 Mengqi Gong
 Longle Wang
 Xiaofan Li
95% of researchers rate our articles as excellent or good
Learn more about the work of our research integrity team to safeguard the quality of each article we publish.
Find out more
HYPOTHESIS AND THEORY article
Front. Environ. Sci. , 28 September 2023
Sec. Environmental Economics and Management
Volume 11 - 2023 | https://doi.org/10.3389/fenvs.2023.1269691
This paper uses the panel data of manufacturing subdivision industry from 2000 to 2014 to calculate the exchange of ecological inequality through MRIO model. On this basis, the systematic GMM model is used to investigate the direct and indirect effects of Foreign Direct Investment on the unequal exchange of manufacturing ecology. In addition, the ecological unequal exchange in China’s manufacturing industry is decomposed into ecological unequal exchange on the production side, on the consumption side, with developed regions and with lessdeveloped regions. The study finds that: 1) Industry-wide research indicates that FDI inflows have a significant positive impact on reducing the unequal exchange in the manufacturing sector. This finding contributes to the existing literature on the effects of FDI on ecological inequality. 2) Path-specific studies reveal that FDI primarily reduces ecological inequality in the manufacturing sector through technological effects. However, the scale and structural effects of FDI exacerbate ecological inequality, confirming the findings of some scholars. This nuanced understanding of the effects of FDI on ecological inequality adds to the existing body of research. 3) From the perspective of FDI sources, FDI from Asian countries and regions is more beneficial for improving China’s ecological unequal exchange. This finding provides guidance for China’s FDI attraction policies. 4) Assessing pollution emissions inventories based on the principle of production responsibility is unfair to China from both the production and consumption perspectives. 5) From a regional perspective, FDI effectively reduces the impact of ecological unequal exchange in the manufacturing sector between China and developed economies. These findings confirm that China bears an unequal exchange in the trade process and enrich the understanding of the impact of FDI on ecological unequal exchange.
Ecological Unequal Exchange (EUE) refers to the process of using the natural resources of less developed economies for production in the process of specialization and participation in international trade, and thus for consumption in developed economies (Jorgenson, 2016; Ciplet and Roberts, 2017; Althouse et al., 2020). The transfers of resources and the environment in this process will significantly affects the ecological environment of the importing and exporting countries and their responsibility to reduce emissions, weakening the effect of emission reduction policies (Peng et al., 2015). A study by Yu et al. (2014) points out that there is a significant EUE between China and both developed and less developed economies, with China’s exports to North America creating about 2,784,500 tons of sulfur dioxide in China, while China’s imports create only about 82,800 tons of SO2 in North America; conversely, the SO2 left in less developed economies by China through imports is 10% higher than the SO2 created by China through exports to less developed economies. To some extent, this shows that the framework of the United Nations Framework Convention on Climate Change and the Kyoto Protocol is “producer responsibility” or “geographical boundary”, and accounting for the pollution emission list of various economies is not conducive to the reduction of developing economies emissions. (Han, 2018). Especially for China, such as a big open country, the manufacturing industry, as the foundation of economic development, has ranked first in the world in terms of output value for many years, but its “rough” prosperity is accompanied by large energy consumption and pollution emissions (Jiang and Tang, 2023), and the products and services produced by China’s manufacturing industry are mainly used for external demand (World Bank, 2019). This has put enormous pressure on China’s energy conservation and emission reduction efforts. The scope and depth of the impact of EUE on the world environment are increasing. Nowadays, EUE has become a very active academic research field in the school of world system theory.
General Secretary Xi Jinping pointed out at the 20th Congress of the Communist Party of China that “China should adhere to the focus of economic development on the real economy, promote a new type of industrialization, accelerate the construction of a strong manufacturing country, and promote the development of high-end, intelligent, and green manufacturing". Therefore, under the background of “achieving new progress in the construction of ecological civilization"as the important goal of economic and social development in the 14th Five-Year Plan period, China’s manufacturing industry must strive to take a leading position in the greening process (Shi, 2018). Green development has externalities beyond national boundaries, which requires clarifying the ecological inequality exchange that Chinese manufacturing industries bear in the process of participating in globalization. China has always been an important recipient of Foreign Direct Investment (FDI). As shown in Figure 1, China’s actual utilization of FDI has rapidly increased from 40.72 billion in 2000 to 180.96 billion in 2021, surpassing the United States and becoming the world’s top recipient (National Bureau of Statistics). In terms of FDI inflows, the manufacturing sector was the main attraction for FDI before 2014. However, in 2010, the share of FDI in the service sector exceeded that of the manufacturing sector for the first time, indicating a shift towards the service sector as the dominant area for attracting FDI in China.
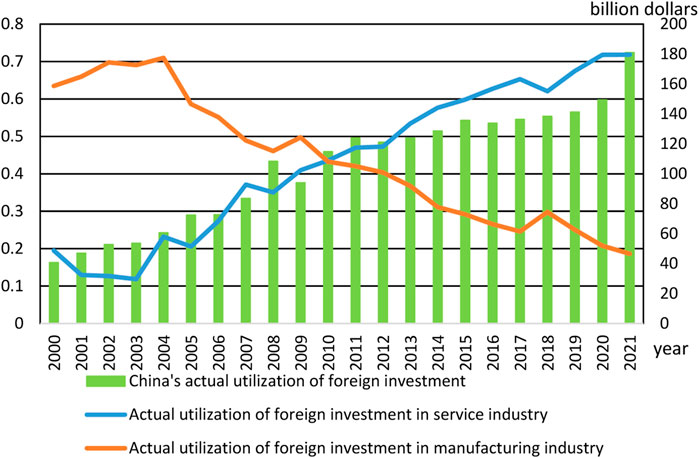
FIGURE 1. The actual utilization of FDI in China from 2000 to 2021.
Manufacturing was the largest sector of FDI between 2000 and 2014, its EUE will be influenced by FDI. As shown in Figure 2, it can be found that there is a significant EUE in China’s manufacturing industry based on carbon emissions accounting from 2000–2014, which indicates that the real responsibility of a country or region to reduce emissions cannot be regarded only as the environmental loss caused by the production side, but a comprehensive emission system that considers both producer and consumer responsibilities (Li and Chen, 2020). And there is an obvious synchronous development trend between EUE and FDI in the Chinese manufacturing industry, so the question that arises is what theoretical link exists between FDI and EUE? What is the direct and indirect impact of the introduction of China’s manufacturing industry on the introduction of FDI? These questions are not only the key issues that need to be solved in the study of the transformation and upgrading of China’s manufacturing industry at this stage but also the important questions that must be answered to implement China’s ability to actively utilize FDI for sustainable development and to gather global high-end elements to promote the transformation and upgrading of the manufacturing industry.
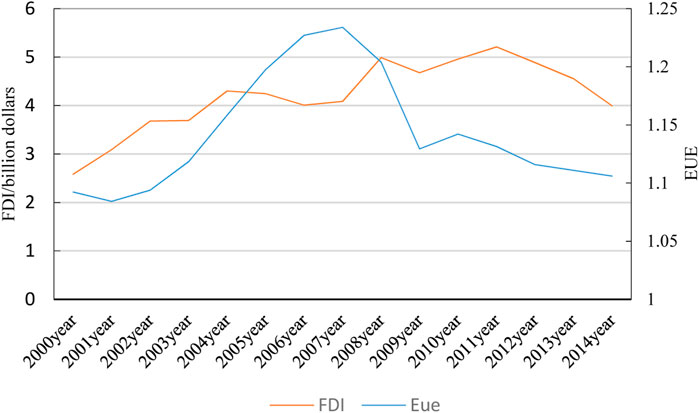
FIGURE 2. China Manufacturing FDI and Eue. Source: Authors’ calculations based on WIOD input-output tables. Data source: National Bureau of Statistics.
The innovations of this paper are as follows: firstly, it expands the mechanism of FDI’s impact on environmental pollution to the mechanism of FDI’s impact on ecological unequal exchange, filling the gap in existing research; secondly, in terms of empirical analysis, this paper uses a multi-regional input-output method to calculate EUE, taking into account the economic linkages and resource flows between different countries and regions. It not only examines the direct effects of FDI on EUE but also investigates the indirect effects from the perspectives of scale, structure, and technology, enriching existing research; thirdly, it decomposes EUE and examines the impact of FDI on different types of EUE.
The following content of this paper is arranged into five parts. The first part is literature review, the second part is theoretical mechanism, the third part is model construction and data explanation, the fourth part is empirical analysis, and the fifth part is conclusion and discussion.
The inflow of FDI significantly affects the EUE of the industry. The academic community has been paying attention to the environmental effects of FDI and have conducted a lot of research work. In this paper, we will review the relevant literature from three aspects:the measurement of EUE, the study of direct effect of FDI on EUE, and the study of indirect effect of FDI on EUE.
Existing studies mainly use three methods to account for EUE. one is to measure EUE using a weighted export flow indicator (Givens and Jorgenson, 2013). The weighted export flow index method is employed to gauge the environmental utilization efficiency by considering the environmental burden associated with the production process in different countries or regions. This method is relatively straightforward and computationally feasible, offering a comprehensive evaluation of environmental efficiency. However, its primary focus on export flows overlooks the influence of imports and domestic consumption. Consequently, it fails to account for the ultimate consumers of goods and services and may disregard the environmental impact of the consumer country.
Another approach is to measure EUE using the ratio of bilateral trade flows measured in monetary terms (Samaniego et al., 2017). the ratio of monetary measured bilateral trade flows method assesses environmental utilization efficiency by comparing the ratio of bilateral trade flows, thereby offering a more comprehensive consideration of the impacts of both imports and exports. This approach reflects the extent to which international trade affects the environment. Nevertheless, it still does not directly incorporate the role of consumers, nor does it account for the environmental consequences of final goods and services consumption. Moreover, this method may be susceptible to fluctuations in exchange rates.
The third approach is to measure the EUE by using a multi-regional input-output analysis method. (Feng and Liu, 2019; Dorninger et al., 2020). multi-region input-output analysis employs multi-region input-output models to measure environmental utilization efficiency, thereby encompassing the economic interconnections and resource flows among various regions. This approach provides a more precise assessment of environmental efficiency, taking into account global supply chains and industrial interdependencies. However, it necessitates abundant data and complex models, making the calculation and estimation process more intricate. Additionally, the availability of data and underlying assumptions of the model may pose limitations on this method. Since trade decentralization can lead to a cross-border geographical division of production and consumption of products. On the one hand, economies can meet the domestic needs for goods and services through imports, and on the other hand can keep energy consumption and pollution emissions in the exporting countries. Thus, Davis and Caldeira (2010), Barrett et al. (2013) and others point out that the EUE of an economy can be calculated based on the consumption side to examine the existence of net ecological inflows and outflows effects in different economies. In contrast,Guo et al. (2012), Yu et al. (2014), and Zhong et al. (2017) argue that both production and consumption responsibility systems should be considered in the process of accounting for ecological inequality exchange.
Regarding the direct impact of FDI on EUE, Jorgenson’s (2012) study points out that developing economies significantly contribute to GHG emissions through the introduction of FDI and therefore argues that FDI leads to EUE between economies. Frame (2014) argues that the process of transfer of ecosystem goods and services from developing to developed economies through FDI and international trade leads to an unequal global ecological Jorgenson (2016) analyzes from a qualitative perspective, arguing that, on the one hand, vertical flows of exports can lead to EUE between developed and developing economies; on the other hand, FDI dependence of developing economies can lead to environmental load shifting. However, it argues that existing studies have not identified the environmental load shifting caused by FDI in services, so global EUE is not inevitable. Doytch (2020) examines whether developed and developing economies cause EUE through FDI, and finds that FDI flowing to developed economies increases the consumption footprint, while FDI flowing to developing economies increases the production footprint, indicating that FDI leads to an uneven distribution of ecological responsibility to some extent, confirming the EUE effect of FDI.
To sum up, the past research mainly examines how developed economies and less developed economies through FDI ecological inequality exchange, for FDI source, EUE lack of comprehensive discussion, this paper will study the object in China, in the heterogeneity analysis, the FDI into vertical FDI and horizontal FDI, EUE into production side EUE, consumption side EUE, EUE between developed economies, and EUE between less developed economies, thus more comprehensive discusses the influence of FDI on EUE, make up the blank of the existing research.
There are still very few relevant studies involving the mechanism of indirect effects of FDI on EUE. Grossman and Krueger (1991) first proposed the impact mechanism of FDI on the environment:structural effect, scale effect, and technology effect in the analysis and study of NAFTA. Since then, most scholars have followed the above mechanisms to decompose FDI to examine its impact on the ecological environment. The scale effect refers to the comprehensive impact of expanding production scale on the local natural environment. Previous studies have predominantly utilized output value as a metric to assess the scale effect and examine its direction and magnitude (Cao and Yu, 2014). The structural effect primarily pertains to the influence of industrial distribution on the environment. Inflows of FDI enhance the capital intensity of the host country, and in accordance with Rebzinski’s theorem, this leads to an increase in the production of capital-intensive polluting products while reducing the output of other goods, consequently contributing to environmental pollution in the host country. To analyze the structural effect and determine its direction and magnitude, scholars have mainly employed the per capita capital stock of the manufacturing industry (Gong et al., 2019). Lastly, if foreign enterprises possess superior technology and efficiency compared to domestic firms and facilitate technology demonstration and spillover effects, FDI inflows will promote the advancement and diffusion of the overall technological level in the host country, thereby mitigating pollution. Typically, the per capita expenditure on scientific research and innovation in the manufacturing industry is chosen as an indicator of the technology effect (Sheng and Lu, 2012).
Studies by Liu and Guo (2023) and Liu et al (2019) point out that FDI can affect the environment through scale effects (Gunby et al., 2017; Makiela and Ouattara, 2018; Muhammad and Khan, 2019), structural effects (Kergroach, 2019)and technology effects (Asongu et al., 2018)affect the environmental pollution of regions and industries, which in turn cause EUE (Muhammad, 2019).
To sum up, The research on the indirect impact of FDI on EUE is still in its early stages. Early scholars primarily focused on domestic perspectives of environmental pollution, without considering the economic linkages and resource flows among different countries and regions. From the research findings, some scholars have found that FDI has a positive technological effect on the environment, surpassing the negative scale effects and structural effects (Sheng and Lu, 2012). However, others have found that FDI in China brings about positive scale effects, negative structural effects, and technological effects (Cao and Yu, 2014). The research conclusions regarding the scale effects, structural effects, and technological effects of FDI vary. Additionally, previous literature has mainly focused on the indirect impact of FDI on the ecological environment, while lacking research on the impact on EUE. Therefore, in order to ensure the rigor of the argument, this paper examines indirect effects of FDI on EUE to enrich existing research.
As an important channel to transfer the environmental load, FDI will not only directly affect manufacturing EUE, but also indirectly affect the manufacturing EUE through the scale, structure and technology effect. In order to better clarify the relationship between FDI and manufacturing EUE, this paper explores the mechanism of FDI affecting Chinese manufacturing EUE from both direct and indirect levels, so as to find its internal connection.
At present, relevant studies in the academic field mainly examine the direct impact of FDI on manufacturing EUE from the perspectives of “pollution paradise”,“environmental competition theory”and“pollution halo”, To be specific:
First, the FDI will worsen the manufacturing EUE. On the one hand, the “pollution paradise” hypothesis suggests that the strict environmental regulations in developed countries or regions will encourage the marginal industries in the region to move to regions with lower environmental standards, and those FDI from pollution-intensive industries will flow into China, increasing the pollution emissions of China’s manufacturing industry and aggravating the EUE of China’s manufacturing industry. On the other hand, the “environmental competition theory” believes that the deepening of global trade liberalization makes the market competition more and more intense. To attract FDI, developing countries or regions will set lower environmental standards than other countries. Therefore, free trade and investment in an open economy will lead to the continuous transfer of high-pollution manufacturing industries from developed countries to developing countries, thus aggravating the EUE of manufacturing industries in countries with low environmental standards.
Second, FDI will improve manufacturing EUE. On the one hand, proponents of the"pollution halo"effect argue that FDI technology spillover provides a good learning opportunity for China’s manufacturing enterprises to adopt similar management technologies, and further promotes the implementation of environmental management systems by domestic enterprises, which helps improve environmental quality and thus improve China’s manufacturing EUE. improve China’s manufacturing EUE. On the other hand, from Porter’s hypothesis, it can be seen that China’s moderate environmental regulation is conducive to technological innovation in the local manufacturing industry, reducing pollution to the environment, and at the same time, because environmental regulation increases the production costs of manufacturing enterprises, improves the competitive advantage of FDI with strict environmental regulation, attracts a large number of FDI with advanced technology into China, the introduction of advanced technology and talent improves China’s production technology and reduce pollution emissions on the production side, thus improving the manufacturing EUE.
Previous studies have mainly examined the direct effect of FDI affecting EUE, and there are fewer studies based on the indirect effect. This paper draws on Grossman and Krueger’s (1991)approach to examine the indirect effect of FDI on Chinese manufacturing EUE through three paths: scale effect, structural effect and technology effect.
First, FDI will exacerbate the manufacturing EUE through the effect of scale path. On the one hand, FDI will increase the demand for manufacturing products by promoting the growth of GDP and improving people’s economic level. In the process of consumption, products pollute the environment, which increases the burden of ecological environment, thus increasing the consumption side EUE (Tang et al., 2021). On the other hand, FDI promotes the scale expansion of manufacturing enterprises, and under the conditions of unchanged production technology and industrial structure, the increase in economic scale will improve the output scale of manufacturing enterprises, and the output scale increases the pollution to the environment, thus increasing the production side EUE. therefore, the scale effect of FDI will deteriorate a country’s manufacturing EUE.
Second, FDI will improve the manufacturing EUE through the effect of scale path. By promoting the growth of GDP, FDI improve people’s living standard, and enhance the awareness of environmental protection, which will lead to a change in the demand structure in favor of high-tech products, thus reducing the pollution emission on the consumption side; at the same time, with sufficient capital, manufacturing enterprises will increase their R&D investment in pollution control, thus reducing the EUE caused by the production side of manufacturing. Therefore, it is believed that FDI will improve the manufacturing EUE through the scale effect path.
First, FDI will improve the manufacturing EUE through the structural effect path. On the one hand, with the gradual improvement of economic development, China’s manufacturing industry pays more attention to the introduction of high value-added industries when introducing FDI, which will promote the industrial structure adjustment, and at the same time, FDI forms fierce competition with domestic enterprises, which also eliminates a large number of backward production capacity and optimizes the manufacturing industry structure, which will improve the manufacturing EUE. On the other hand, as China’s manufacturing cleaning industry still has comparative advantages in the international market, FDI flows to the manufacturing cleaning industry, which improves the technical strength of China’s manufacturing clean industry, effectively reduces the pollution emissions caused by the production side, and improves China’s manufacturing EUE.
Secondly, FDI will deteriorate the manufacturing EUE through the path of structural effect. on the one hand, while China takes advantage of resources to introduce FDI, it makes FDI flow to the resource-intensive industries in manufacturing, which will boost the expansion of resource-intensive industries in the long run, and the over-exploitation of resources will have a bad impact on the ecological environment, which will cause manufacturing EUE. on the other hand, due to the low labor force in China’s manufacturing industry, the FDI will cause the manufacturing EUE. Especially the low-end labor-intensive industries. For a long time, FDI has been concentrated in the low value-added processing manufacturing industry and high pollution industry, which will, to a certain extent, lead to the slow restructuring of China’s manufacturing industry, high energy consumption and high pollution production capacity and other problems. And then cause manufacturing EUE.
First, FDI will improve manufacturing EUE through the path of technology effect. specifically, the introduction of FDI in China’s manufacturing industry produces vertical effects on upstream and downstream enterprises in the domestic manufacturing industry. On the one hand, FDI effectively improves the productivity of upstream manufacturing enterprises by providing production technology, advanced management level or upgrading and replacing production equipment to the upstream enterprises in the domestic manufacturing industry, reduces pollution emissions and improves On the other hand, FDI can also improve the productivity of enterprises by providing high-quality intermediate products to the downstream enterprises of domestic manufacturing industry, thus improving the manufacturing EUE (Tang et al., 2022).
Secondly, FDI will deteriorate manufacturing EUE through the path of technology effect. the FDI introduced into China’s manufacturing industry has a horizontal effect on domestic enterprises in the same industry, due to the fierce competition between FDI and domestic enterprises in the same industry, causing domestic enterprises to reduce their market share and profits, forcing them to squeeze out R&D funds in order to reduce production costs, which eventually reduces the technical level of manufacturing enterprises and deteriorates manufacturing EUE. The theoretical mechanism is shown in Figure 3.
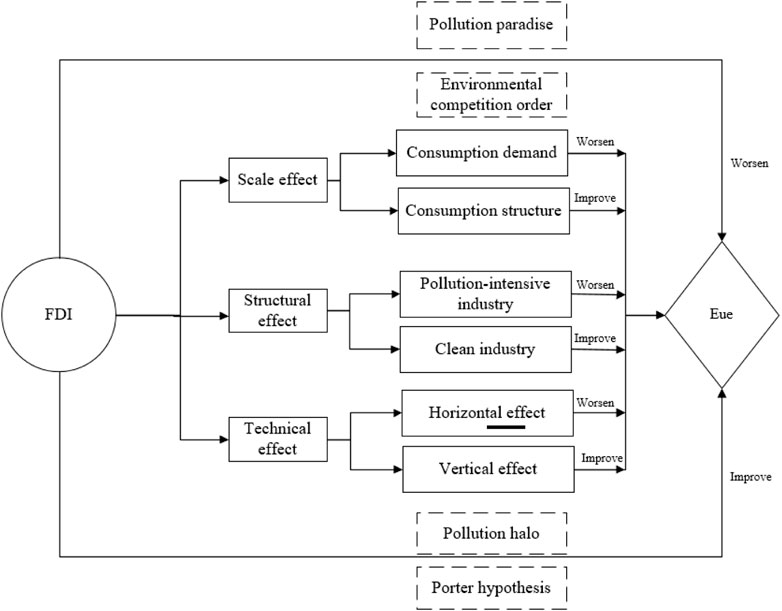
FIGURE 3. Mechanism of FDI’s influence on Chinese manufacturing Eue.
This paper intends to conduct an analysis using the instrumental variables approach to examine the effect of FDI on the overall EUE of China’s manufacturing industry. Manufacturing EUE is used as the explanatory variable and manufacturing FDI is used as the core explanatory variable. Because the EUE has a certain degree of continuity, this paper adds the lagged one-period ecological inequality exchange to the model to control for its own intrinsic shocks.
Thus, the following dynamic panel regression model is developed:
Among them, the explanatory variable
Meanwhile, considering that FDI may indirectly affect manufacturing EUE through the paths of scale effect, structural effect, and technology effect, this paper further adds the interaction terms of manufacturing FDI and output scale (SCAL), capital stock per capita (KL), and R&D intensity (RD) based on Equation 1
Among them, the explanatory variable is the degree of manufacturing This paper uses the World Input-Output Tables developed by WIOD for multi-regional input-output analysis. To make the sub-WIOD input-output table correspond to the manufacturing sector, it is now regrouped and matched regarding the National Economic Classification of Industries and Customs Industrial Classification standards, and finally integrated into 12 sectors, and the matching results are listed in Table 1.
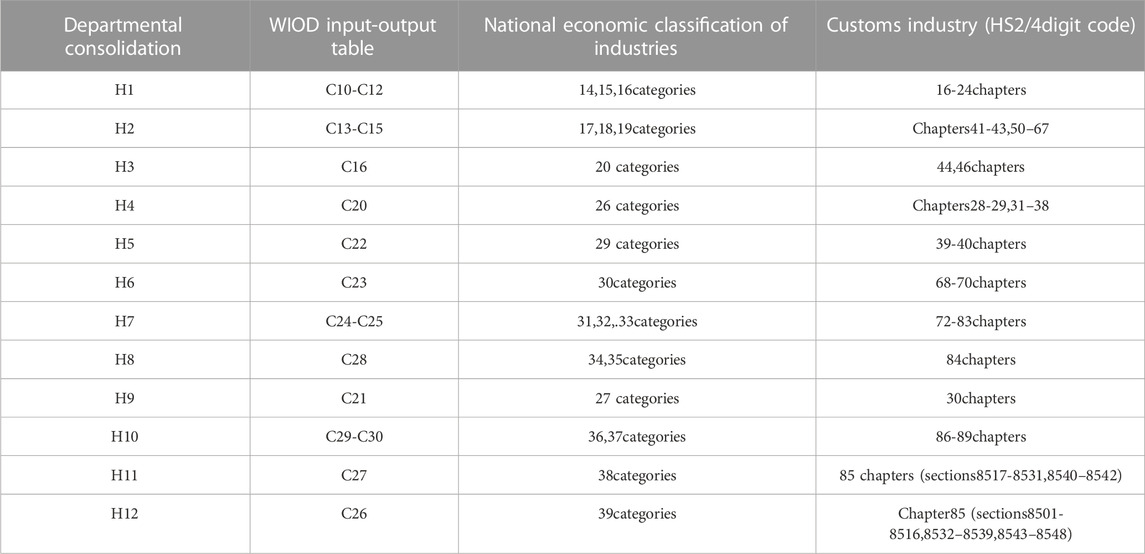
TABLE 1. Departmental consolidation breakdown.
Since the years of data available for WIOD are from 2000 to 2014, limited to data completeness and availability, data from 2000 to 2014 were selected for the study.
(1) The measurement of EUE
Learn from Peng et al. (2015), this paper adopts the multi-region input-output model, considering the situation of production technology differences in different regions and the situation of imported intermediate inputs, and its analysis method is closer to the reality. The MRIO model composed of m countries (regions) can be expressed as:
The block matrix
In this paper, we measure EUE using the ratio of industry production-side emissions and consumption-side emissions by improving the approach of Feng and Liu (2019), and Wang and Zhou (2019). For this purpose, we first calculate the production-side emissions and consumption-side emissions.
Define the matrix f as the input matrix of direct emission intensity. Taking China as an example, let country 1 be China, and let the world emission intensity row vector;
Based on the MRIO model, the production-side emissions of China (country 1)can be expressed as:
Unlike the production side, the consumption side emissions of country 1 are the global pollution caused by the final demand of country 1 Emissions, including both"Domestic Emissions"and"Foreign Emissions". It is expressed by the formula.
pEUE denotes the EUE on the production side of China’s manufacturing industry. the EUE on the consumption side is measured using the ratio of emissions outside the country to emissions inside the country on the consumption side. expressed by the equation
cEUE denotes the consumption side EUE of China’s manufacturing industry. the above method is applied to any kind of emission indicator of environmental pollution. As a country with large total and incremental carbon emissions, China has undertaken a large amount of cross-border transfer of carbon emissions since its accession to the WTO, which has brought enormous pressure on its energy conservation and emission reduction efforts. Therefore, this paper adopts EUE of CO2 as a proxy variable, which can not only effectively reflect the implicit carbon transfer relationship existing in China’s manufacturing industry in the process of participating in international trade, but also facilitate the Chinese government to find the causes of its high carbon emissions and release the potential of low-carbon transformation in the manufacturing sector. CO2 emission data are obtained from the environmental account of WIOD.
(2) FDI rate of flows. In this paper, we adopt the product of FDI and the proportion of exports to industrial sales value of each industry to measure the FDI flow data of sub-sectors, and deflate the price data to reflect the actual situation of each year. The data are obtained from the China Statistical Yearbook.
(3) Control variables.
The scale of output of the manufacturing industry (SCALE), and the manufacturing value added per capita was selected to represent this variable. Capital stock per capita in the manufacturing industry (KL), the annual average balance of net fixed assets in the manufacturing industry is used to represent the capital stock. R&D intensity (RD), and the per capita expenditure on scientific research and innovation in the manufacturing industry is selected to measure this indicator. Industry ownership structure (OS), measured by using the share of manufacturing sales output value of state-controlled enterprises in total manufacturing sales output value. Energy Structure (ES), measured using the proportion of industry coal consumption to total industry energy consumption. Trade openness (TR), measured by the ratio of total imports and exports to manufacturing sales output,.Since the unit of import and export data is USD and the unit of manufacturing sales output data is RMB, the unit is unified after accounting by using the annual average price of RMB exchange rate. Governmental industry environmental regulation (RG), drawing on the research results of Duan et al. (2013), is used to characterize the level of governmental industry environmental regulation in the manufacturing industry in the sample data by using the ratio of industry CO2 emissions to industry gross output value. Labor productivity (LP) is measured by the ratio of industrial sales output to the number of employees.
Descriptive statistics of the data are shown in Table 2.
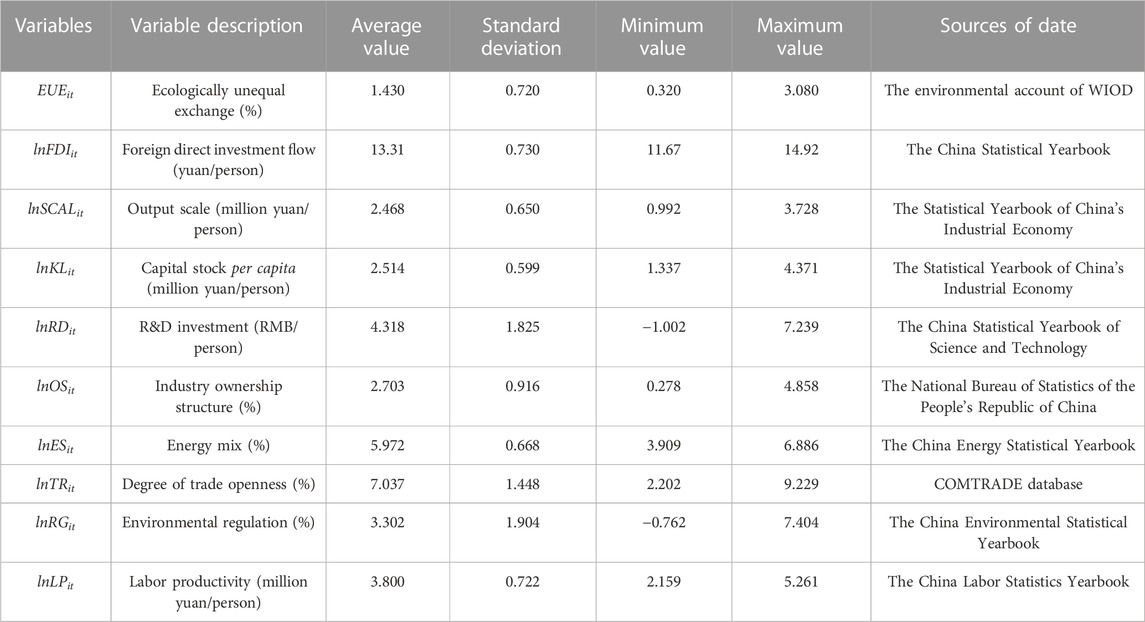
TABLE 2. Descriptive statistics N:180.
Since the independent variables of the empirical model include EUE with a one-period lag,meanwhile, the previous theoretical analysis illustrates that FDI will directly affect the manufacturing industry of EUE, and in the context of green transformation and upgrading faced by the Chinese manufacturing industry, the degree of EUE may affect the structure of FDI, and there may be an endogeneity problem between the two. Therefore, in this paper, the systematic GMM estimation method is used to estimate the model as a comparison, with the estimation results of OLS and RE.
In the process of exploring the empirical evidence of FDI on manufacturing EUE, as a comparison, the paper also gives the static regression results. As shown in Table 3. Where Column 1 corresponds to the least squares estimation (OLS) regression results, Column 2 presents the two-way fixed effect regression results, Column 3 showcases the random effect (RE) regression results, while Column 4 and Column 5 exhibit the outcomes of the one-step system GMM and two-step system GMM, respectively.
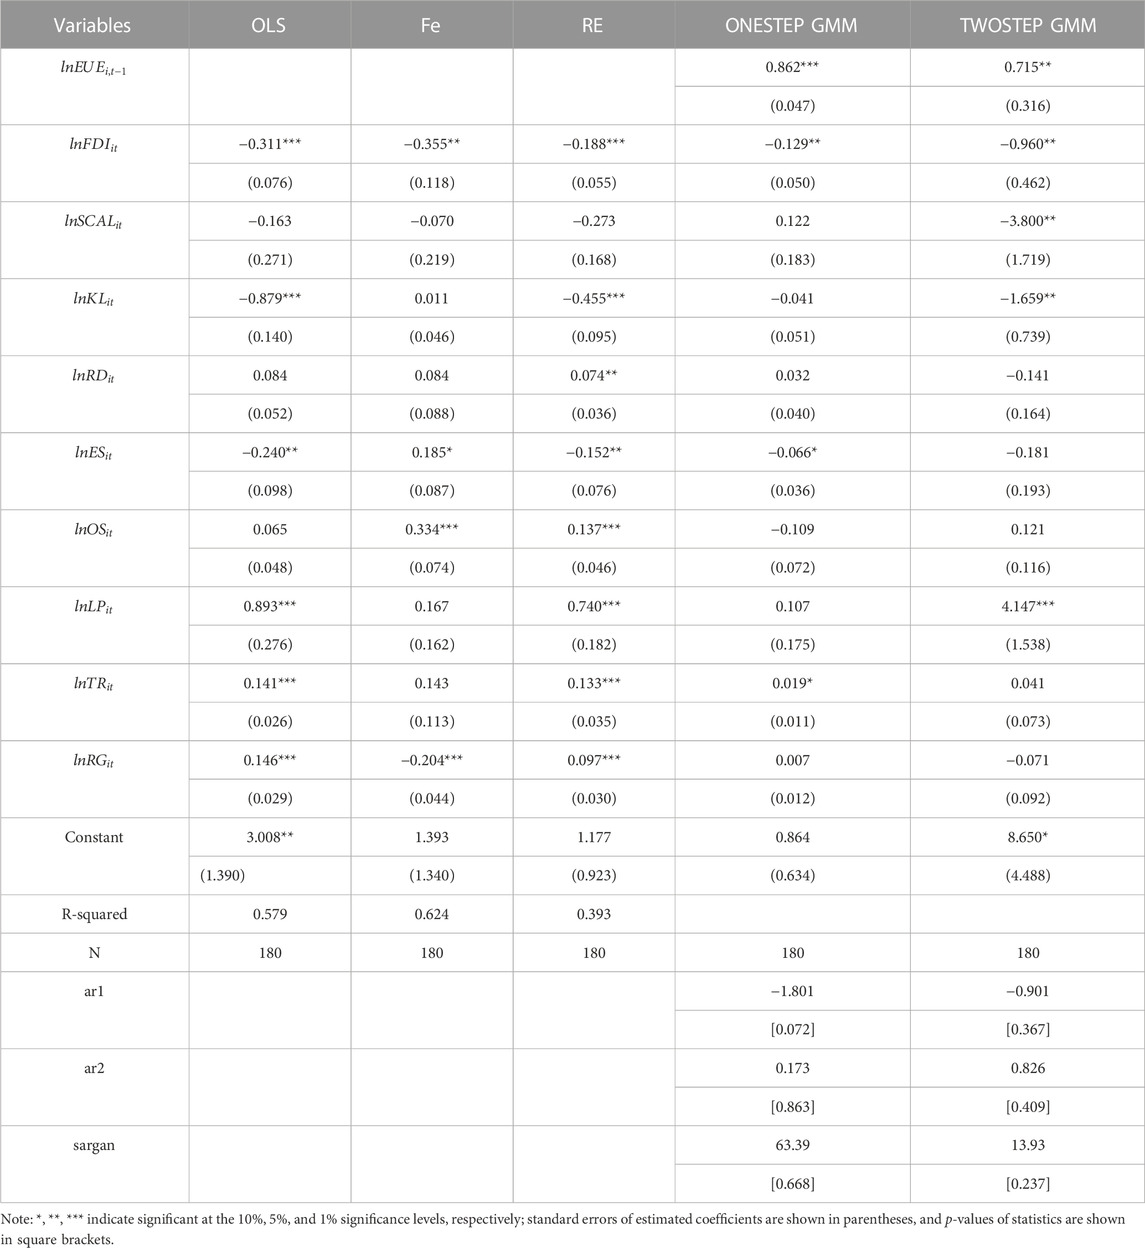
TABLE 3. Baseline regression.
As can be seen from Table 3: First, the lagged period of EUE significantly contributes to the rise of EUE, and passes the test at least at the 5% significance level, indicating that industry EUE is a long-term continuous accumulation process.
Second, FDI will significantly reduce the industry EUE, every 1% increase in FDI will reduce EUE by 0.129–0.960 percentage points, which indicates that the increase of FDI in manufacturing industry during the sample period helps to reduce the size of EUE, that is, FDI improves the EUE in China’s manufacturing industry.
Finally, from the control variables,① the increase of output scale will significantly reduce EUE, indicating that the increase of output scale of manufacturing industry is conducive to the improvement of manufacturing EUE; ② the rise in capital stock will significantly reduce EUE, indicating that China’s industrial structure adjustment is significant, and light pollution industries or even clean production industries will play more power in the manufacturing sector; ③the increase in R&D investment will reduce manufacturing EUE, which did not pass the significance level test; ④energy structure will reduce manufacturing EUE, but the effect on the overall manufacturing EUE is not significant; ⑤the increase in labor productivity will significantly promote the increase of EUE, aim to pass the test at least at the 1% level; ⑥rising trade openness will promote the increase of EUE, indicating that China’s participation in international trade, the output of a large amount of environmental pollution, deepening the manufacturing EUE in the industry; ⑦although the industry regulation will reduce EUE, it does not pass the significance level test.
The previous theory shows that FDI will have an impact on the manufacturing EUE through three paths:scale effect, structural effect, and technology effect. To analyze its specific impact, this paper conducts systematic GMM regressions on Equations 2,(3), and (4), and the regression results are shown in Table 4.
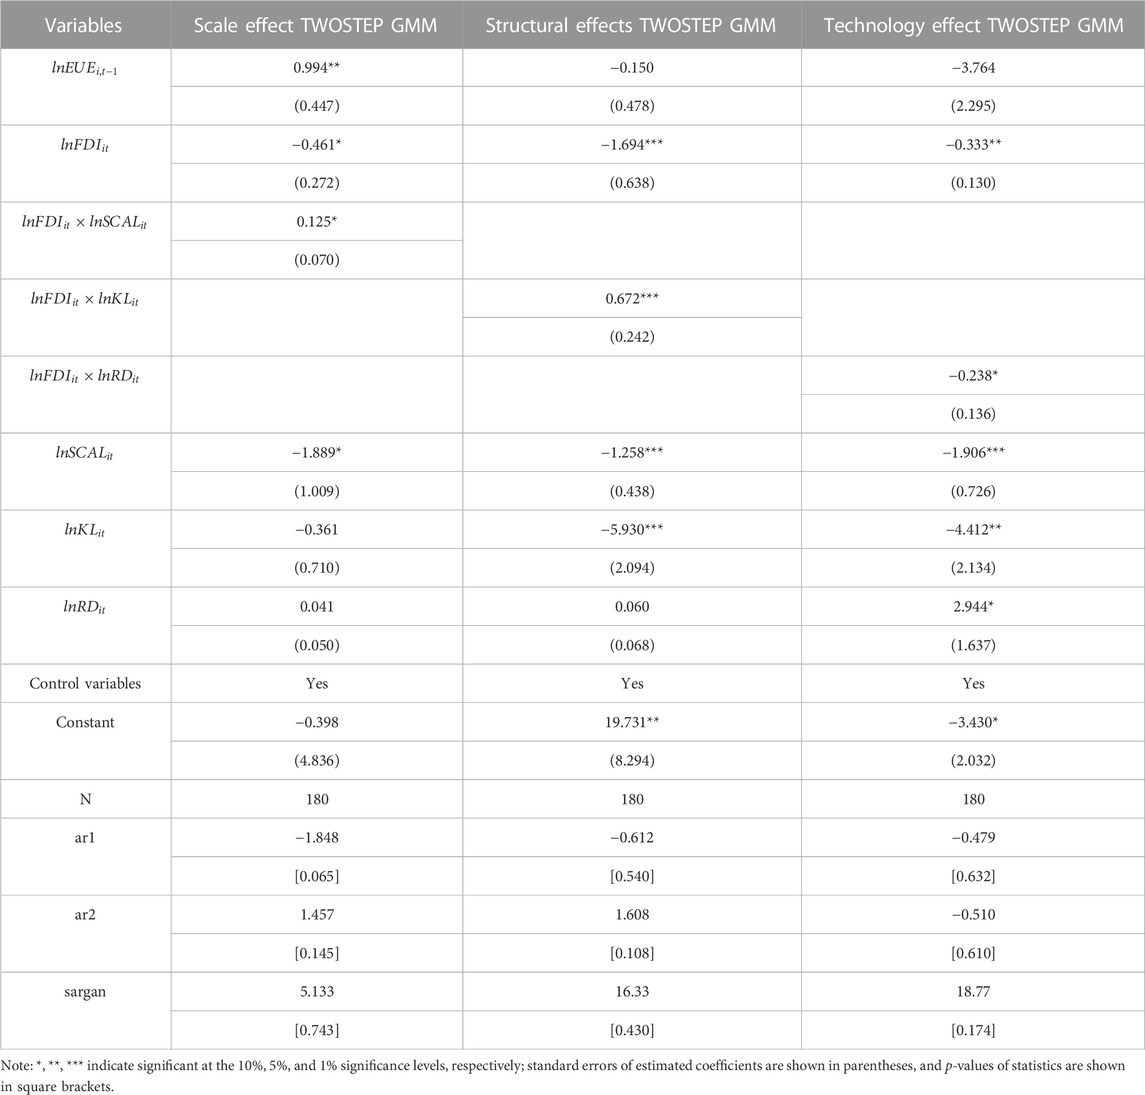
TABLE 4. Regression results of sub-mechanisms.
As shown in Table 4, firstly, the coefficient of the interaction term between FDI and SCAL is positive and passes the test at the 10% level. It indicates that FDI promotes EUE through the scale effect, the reason may be that FDI inflow promotes the output scale of China’s manufacturing industry, which raises the consumption of energy resources and thus increases pollutant emissions and aggravates the EUE of China’s manufacturing industry.
Second, the coefficient of the interaction term between FDI and KL is positive and passes the test at the 1% level, which indicates that FDI promotes EUE through structural effect, However, both the direct and structural effects of FDI reduce EUE The reason can be attributed to the specific characteristics of FDI inflows into China between 2000 and 2014. During this period, China experienced a substantial influx of FDI, particularly in the manufacturing sector, with a focus on labor-intensive and resource-intensive industries. It is well-known that these industries typically exhibit high energy consumption and pollution levels, thereby exerting significant pressure on the environment. While FDI has introduced some advancements in environmental technology and management standards, the environmental burden associated with these industries remains substantial due to their inherent characteristics. Consequently, the interaction term between FDI and the industry structure emerges. In essence, despite the positive environmental improvements brought about by FDI, the overall impact on the environment remains negative due to the influence of the industrial structure.
Finally, the coefficient of the interaction term between FDI and RD is negative and passes the test at the 10% level. It shows that FDI reduces China’s manufacturing EUE through the technology effect. The reason may be that, on the one hand, FDI flowing into China, taking advantage of its advanced technology, competes benignly with domestic enterprises in the same industry, improves our enterprises’ own technology and innovation capability, and improves our environment. On the other hand, multinational enterprises widely establish and promote TNCs (global control), which provides a good learning opportunity for Chinese enterprises to adopt similar management techniques, and also further promotes the implementation of environmental management systems by domestic enterprises to reduce pollution emissions, thus inhibiting China’s manufacturing EUE.
In general, the overall impact of FDI on EUE is negative, while the scale effect and structure effect are positive, and the technical effect is negative. This finding corroborates the findings of Sheng and Lu (2012), suggesting that only when the technical effect exerts a substantial influence can the deteriorating trends in scale and structure be reversed, leading to an improvement in the direct effect. However, the data presented in Table 3 and Table 4 indicate that the technical effect is not particularly significant. It is plausible that the presence of other factors interferes with technical efficiency, potentially masking the positive impact of the technical effect. These factors may encompass market competition, government policies, resource allocation, among others, which could exert a more pronounced influence on efficiency, consequently yielding a smaller coefficient for the technical effect. Further research is required to delve deeper into this matter.
China is a major manufacturing power, Early on, has been responsible for the export of processing trade, Low impact on environmental pollution, Vertically-oriented FDI has been more inclined towards export processing, while horizontally-oriented FDI has been more focused on capturing domestic market share. Considering the potential changes in industrial structure due to different sources of FDI, the impact on EUE may vary. Therefore, a grouped regression analysis was conducted to examine potential heterogeneity in the effects of FDI on EUE; besides, Considering that China assumes different EUE under the production and consumer accountability systems, And China has trade with different economies, The FDI may also affect the EUE differently between China and different economies, To further examine whether there is the heterogeneity of FDI on EUE for different FDI sources, and different EUE objects, this paper systematically analyzes the impact of FDI on EUE by grouping FDI sources, production-side versus consumption-side EUE, and Chinese manufacturing on EUE in economically developed versus economically less developed regions, respectively.
Based on the heterogeneity of FDI sources and from investor motivation, UNCTAD divided FDI into vertical (export-oriented) FDI and horizontal (market-oriented) FDI in the 1998 World Investment report.
In this paper, based on the method of Wei Houkai and others, the FDI from Asia is classified as vertical FDI, the symbol is represented as
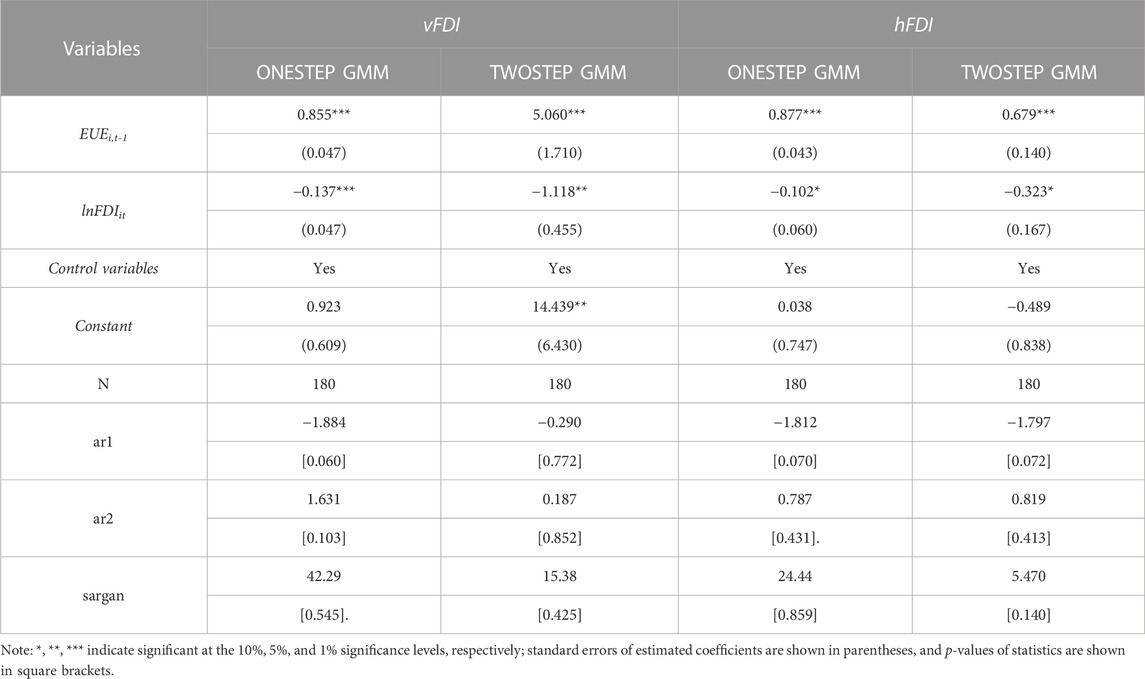
TABLE 5. Regression results by FDI.
From the regression results of FDI grouping, both vertical and horizontal FDI effectively reduce EUE and pass the significance level test. Among them, vFDI reduces EUE by 0.137–1.118percentage points for every 1 percentage point increase, while hFDI reduces EUE by only 0.102to0.323 percentage points for every 1 percentage point increase, probably because Asian countries and regions use mainland China as an export platform, and FDI from neighboring countries and regions such as Japan mainly invests in China’s manufacturing export processing-oriented enterprises to take advantage of China’s labor force advantage for product processing, with the inflow of capital, processing trade gradually transitioned from labor-intensive to capital- and technology-intensive,which improved the technical level of export enterprises and reduced pollution. While foreign-funded enterprises from Europe and the United States bring advanced technology to China, their product production and consumption occur in China, such as the famous Apple and Tesla enterprises, the pollution caused by product production and consumption occur in China, and at the same time, due to China’s preferential policies for FDI, foreign-funded enterprises with their low price advantage forced China’s manufacturing enterprises in the same industry to reduce costs and As a result, they will cut down the technical expenditure and increase the production emission, which leads to the relatively weak effect of horizontal FDI on the improvement of manufacturing EUE in China.
Based on the heterogeneity consideration of the production side and the consumption side of manufacturing EUE in China, and in order to clarify the root causes of manufacturing EUE in China, this paper examines the causes of EUE from the perspective of production-side EUE and consumption-side EUE, respectively. The ratio between external and domestic emissions on the production side is used to measure the production-side EUE, and the ratio between foreign and domestic emissions on the consumption side is used to measure the consumption-side EUE,respectively.
From Table 6, FDI inflows reduce pEUE and cEUE and pass the test at least at the 5% level. It shows that FDI improves manufacturing pEUE and cEUE.For pEUE, every 1 percentage point increase in FDI reduces pEUE by 0.841–2.485 percentage points, while for cEUE, every 1 percentage point increase in FDI reduces cEUE by only 0.278 to 0.501 percentage points, which may be due to the following reasons:① On the one hand, the inflow of FDI provides financial support for the technological upgrading of exporters, which makes the pollution emission on the production side due to foreign demand lower. On the other hand, it raises the level of the country’s economy, increases people’s income and demand, which raises the pollution emissions caused by domestic demand, thus greatly reducing pEUE.② Although the inflow of FDI supports the technological upgrading of Chinese enterprises, it stimulates the development of our economy and raises the demand of the domestic population, thus increasing the domestic emissions on the consumption side due to final demand, thus weakening the improvement effect of FDI on cEUE.
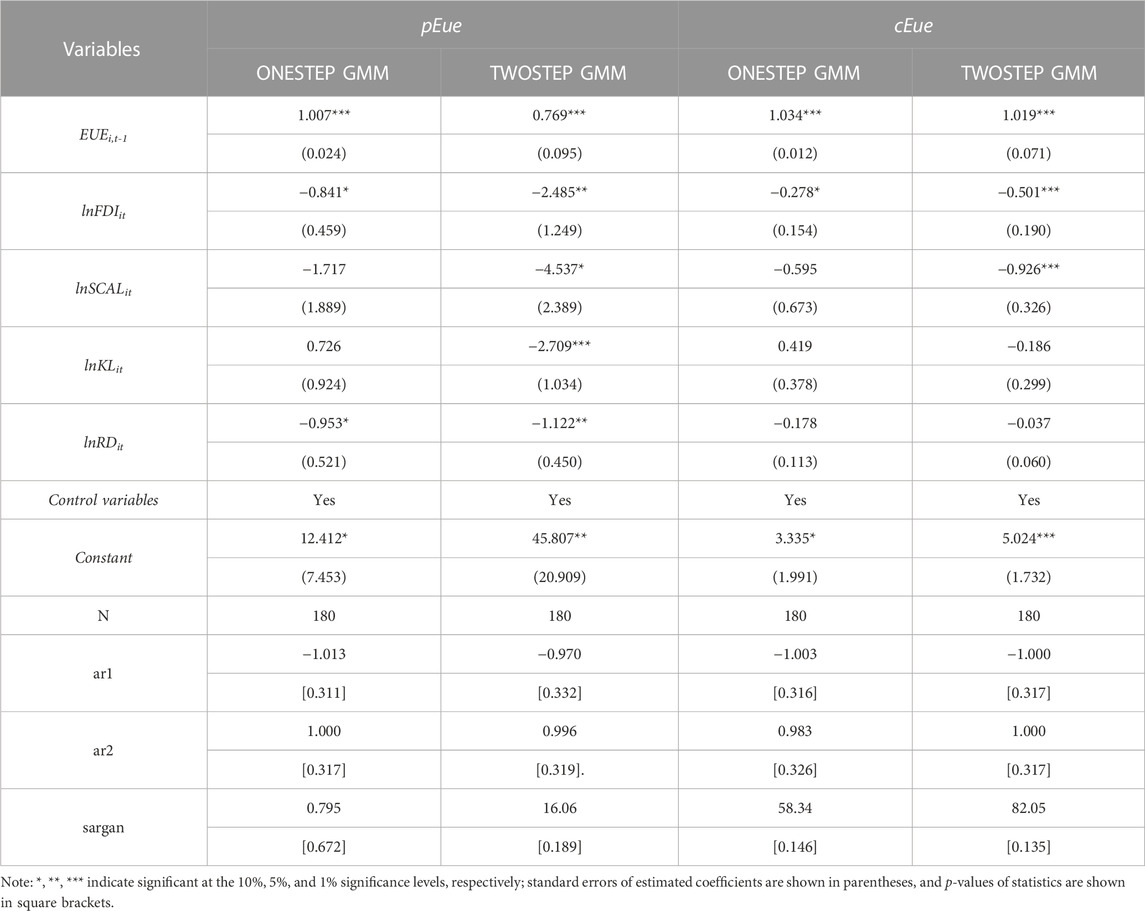
TABLE 6. Sub-Eue regression results.
Based on the consideration of the heterogeneity of the targets of manufacturing EUE in China, this paper divides the 40 countries and regions in the WIOD and a ROW region consisting of other countries into economically developed regions and economically less developed regions according to their economic development and measures the economically developed regions EUE by the ratio between the emissions caused by external demand in economically developed regions and the emissions caused by the country’s consumption in economically developed regions, denoted by the symbol as edrEue. The ratio between emissions from external demand in less developed regions and emissions from domestic consumption in less developed regions is used to measure EUE in less developed regions, denoted by the symbol eurEue. The regression results are shown in Table 7.
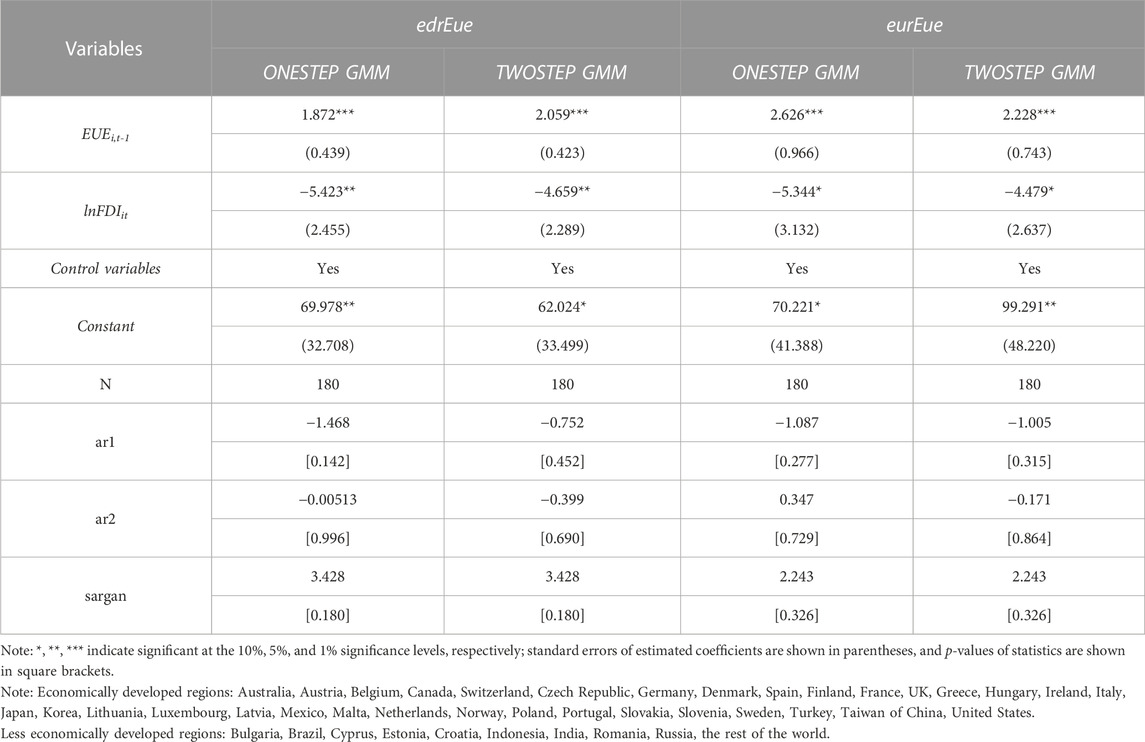
TABLE 7. Estimation results of sub-Eue objects.
From the EUE grouping regression results, FDI effectively suppresses edrEUE and eurEUE and passes the test at least at the 10% significance level. Among them, for every 1 percentage point increase in FDI, edrEUE decreases by 4.659–5.423 percentage points and eurEUE decreases by 4.479–5.344 percentage points. The reason is that, on the one hand, with the development of high-tech industries in China, high-tech products such as Electronic products are increasingly preferred by developed regions, and their capital flows into China’s clean industries to provide financial support for production technology innovation, thus reducing manufacturing edrEUE;on the other hand, China’s exports to less developed regions are dominated by labor-intensive manufacturing manufactured products and began to change to technology-intensive products, foreign demand Structural changes and technological advances have reduced pollution emissions on the production side of the domestic manufacturing industry, while China’s manufacturing demand for less developed regions is energy resources as well as primary manufactured goods. With the inflow of FDI, the economic scale of domestic enterprises expanded, raising the demand for resource products from less developed regions and increasing the pollution emissions from less developed regions due to consumption, thus curbing eurEUE.
Robustness testing is a statistical method employed to assess the reliability and robustness of statistical analyses in the presence of outliers or violations of model assumptions. In empirical research, data may be affected by outliers, missing values, non-normal distributions, or violations of model assumptions, which can lead to unreliable results using traditional statistical methods. The purpose of robustness testing is to mitigate or eliminate the impact of outliers or other data issues on the analysis results by employing statistical methods with higher robustness. This approach enables better handling of outliers or violations of model assumptions, thus enhancing the reliability of the analysis. Common robustness testing methods include variable replacement, supplementary variable method, adjustment of variable classification criteria, subsample regression, altering sample size, shortening or extending the time period, and changing measurement methods.
To examine the impact of FDI on different EUE industries in manufacturing, this paper uses a quantile test to analyze the results as shown in Table 8. At the 10%, 25%, 50%, 75%, and 90% quartiles, the improvement of FDI on manufacturing EUE fluctuates slightly but generally shows an increasing trend, indicating that the “pollution halo” hypothesis exists in the Chinese manufacturing industry.

TABLE 8. Quantile regression.
This paper uses the per capita FDI flow data to measure the effect of FDI on EUE. To test the robustness of this result, FDI flows are further selected to replace FDI flows per capita, and the results are shown in Table 9, through which it can be found that the signs of the regression coefficients of the core independent variables are consistent with those of the previous test, and they pass the test at least at the 5% significance level, and the results are consistent with Table 3, indicating that the results of the previous econometric test of the model have good robustness.
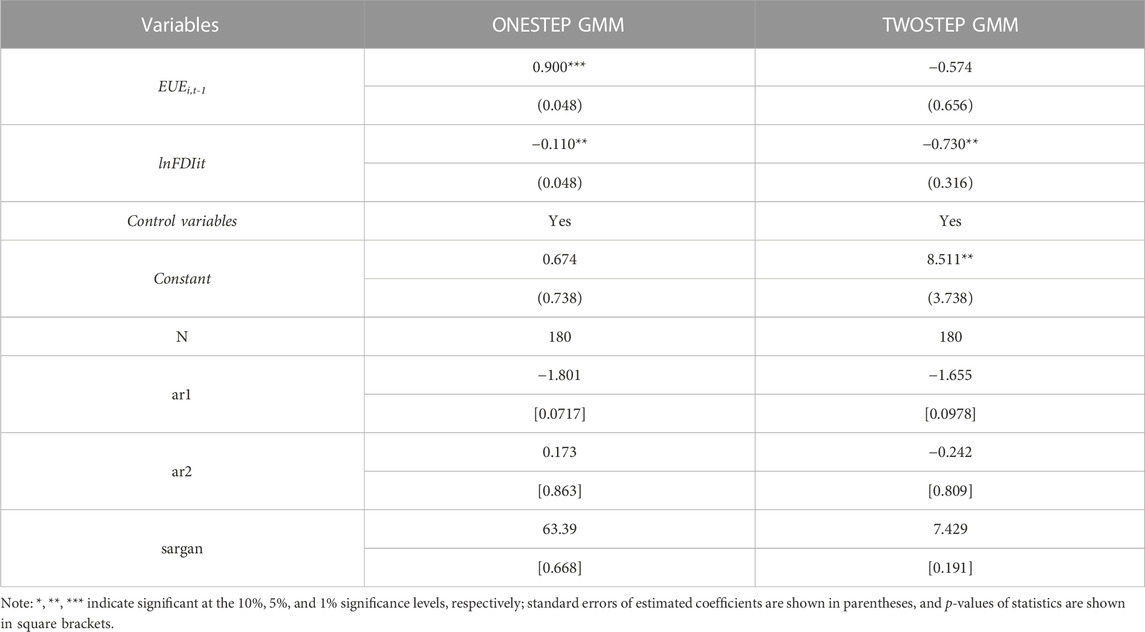
TABLE 9. Robustness tests for replacement variables.
This study analyzes the environmental challenges faced by Chinese manufacturing industries in the process of foreign trade, with special attention to the interaction effects between FDI and its trading countries. As can be seen from Figure 1, China has expanded its openness to attract FDI while also bearing the environmental pollution brought by the FDI source countries. In this paper, we analyze the data set of 44 countries and regions included in WIOD from 2000–2014 using the dynamic GMM model to systematically analyze the impact of FDI on China’s manufacturing EUE, including both direct and indirect mechanisms, and examine the impact of FDI on the production-side and consumption-side EUE of China’s manufacturing industry in a heterogeneity analysis, the impact of different FDI sources on EUE impact and the impact of FDI on EUE in economically developed and economically less developed regions. The results are as follows:① The industry-wide study shows that the inflow of FDI has a significant reduction effect on the manufacturing EUE.② The study of sub-paths shows that FDI reduces manufacturing EUE mainly through technology effect, while the scale effect and structural effect of FDI deepen the manufacturing EUE.③ From the perspective of the source of FDI, the improvement effect of FDI from Asian countries and regions on manufacturing EUE is higher than that of FDI from European and American countries and regions on manufacturing EUE.④ From the results of FDI affecting production-side EUE and consumption-side EUE, FDI effectively reduces pEUE and cEUE.⑤ From the impact of FDI on EUE in economically developed areas and EUE in economically underdeveloped areas, FDI effectively reduces the effect of China’s manufacturing industry on edrEUE as well as eurEUE.The results of FDI research show that the inflow of FDI is beneficial to China’s manufacturing industry to improve environmental pollution and reduce ecological inequality exchange, so we suggest that the Chinese government should encourage FDI to enter the country and also encourage foreign investors to invest in other countries to promote the development of their manufacturing industry and increase trust between the host and source countries (Liu, and Kim 2018).
Previous studies have argued that economic growth in developed countries is achieved through high-quality throughput and simultaneous transfer of environmental burdens to less developed regions (Dorninger et al., 2020). The results of the analysis in this paper provide some evidence that an ecologically unequal exchange relationship of carbon emissions does exist between economically developed and developing countries (e.g., China) in the context of global trade. Firstly, this paper expands the mechanism of FDI affecting environmental pollution to the mechanism of FDI affecting ecological unequal exchange, which fills the gap of existing research; secondly, the empirical aspect not only does the direct effect of the effect of FDI on EUE, but also does the indirect effect from three aspects of scale, structure, and technology, which enriches the existing research; in addition, this paper examines the effect of different FDI sources on EUE which provides a basis for China to participate in global value chain division of labor in the future; finally, this paper does a decomposition of EUE and examines the effects of FDI on different types of EUE from four aspects: production side, consumption side, and with economically developed regions and less developed regions. These studies provide evidence for the theory of ecologically unequal exchange and provide a basis for promoting the integration and sustainable development of the world economy, as well as a reference for implementing China’s ability to actively use FDI for sustainable development and to gather global high-end factors for the transformation and upgrading of manufacturing industries.
This paper has the following limitations. on the one hand, the data on carbon emissions in this study may be far from accurate and exhaustive, and since the WIOD is updated every 5 years, there may be a time lag in terms of data, although they are the most comprehensive data available. On the other hand, previous studies on an ecologically unequal exchange have mainly focused on examining trade relations between countries with different development (Bai, and Givens, 2021). The results of this study suggest that unequal exchange relationships also exist for trade between countries with the same level of development. However, limited to space, this paper only investigates the effect of FDI on the overall EUE between China and developed and less developed regions, ignoring the EUE between different countries and China, which may make the findings less comprehensive.
On the one hand, Future research should expand the study of eco-inequality exchange in the context of the latest economy and trade. On the other hand, Future research can further explore the EUE between different countries and regions and China.
The original contributions presented in the study are included in the article/supplementary Material, further inquiries can be directed to the corresponding author.
MG: Writing–original draft, Funding acquisition, Resources, Supervision, Writing–review and editing. LW: Writing–original draft, Data curation, Methodology. XL: Supervision, Writing–review and editing.
The author(s) declare financial support was received for the research, authorship, and/or publication of this article. This work was supported by the National Natural Science Foundation (72104189) and Ministry of Education Humanities and Social Sciences (20YJC790031).
The authors declare that the research was conducted in the absence of any commercial or financial relationships that could be construed as a potential conflict of interest.
All claims expressed in this article are solely those of the authors and do not necessarily represent those of their affiliated organizations, or those of the publisher, the editors and the reviewers. Any product that may be evaluated in this article, or claim that may be made by its manufacturer, is not guaranteed or endorsed by the publisher.
Althouse, J., Guarini, G., and Porcile, J. G., (2020). Ecological macroeconomics in the open economy:Sustainability,unequal exchange and policy coordination in a center-periphery model. Ecol. Econ. 172, 106628. doi:10.1016/j.ecolecon.2020.106628
Asongu, S., Akpan, U., and Isihak, S. R. (2018). Determinants of foreign direct investment in fast-growing economies:evidence from the BRICS and MINT countries. Financ. Innov. 4 (1), 26–17. doi:10.1186/s40854-018-0114-0
Barrett, J., Peters, G., Wiedmann, T., Scott, K., Lenzen, M., Roelich, K., et al. (2013). Consumption-based GHG emission accounting:a UK case study. Clim. Policy 13 (4), 451–470. doi:10.1080/14693062.2013.788858
Ciplet, D., and Roberts, J. T. (2017). Splintering South:Ecologically unequal exchange theory in a fragmented global climate. J. World-Systems Res. 23 (2), 372–398. doi:10.5195/jwsr.2017.669
Davis, S. J., and Caldeira, K. (2010). Consumption-based accounting of CO2 emissions. Proc. Natl. Acad. Sci. 107 (12), 5687–5692. doi:10.1073/pnas.0906974107
Dorninger, C., Hornborg, A., Abson, D. J., von Wehrden, H., Schaffartzik, A., Giljum, S., et al. (2020). Global patterns of ecologically unequal exchange:Implications for sustainability in the 21st century. Ecol. Econ. 179, 106824. doi:10.1016/j.ecolecon.2020.106824
Doytch, N. (2020). The impact of foreign direct investment on the ecological footprints of nations. Environ. Sustain. Indic. 8, 100085. doi:10.1016/j.indic.2020.100085
Duan, W. B., Liu, D. Y., and Yu, Y. Z. (2013). Technological paths and comparative advantages of energy saving and emission reduction in heterogeneous industries--theoretical model and empirical test. China Ind. Econ. (04), 69–81. doi:10.19581/j.cnki.ciejournal.2013.04.006
Frame, M. (2014). Foreign investment in african resources:the ecological aspect to imperialism and unequal exchange. University of Denver.
Givens, J. E., and Jorgenson, A. K. (2013). Individual environmental concern in the world polity:A multilevel analysis. Soc. Sci. Res. 42 (2), 418–431. doi:10.1016/j.ssresearch.2012.10.005
Gong, Mengqi, Liu, Haiyun, and Jiang, Xu (2019). How two-way FDI in China's industrial sector affects total factor emission reduction efficiency. Industrial Econ. Res. (03), 114–126. doi:10.13269/j.cnki.ier.2019.03.010
Gong, Mengqi, and Liu, Haiyun (2018). Study on the environmental effects of two-way FDI in China's industrial sector. China Population-Resources Environ. 28 (03), 128–138.
Grossman, G. M., and Krueger, A. B. (1991). Environmental impacts of a North American free trade agreement. Cambridge MA: National Bureau of Economic Research Working Paper3914,NBER.
Gunby, P., Jin, Y., and Reed, W. R. (2017). Did FDI really cause Chinese economic growth?A meta-analysis. World Dev. 90, 242–255. doi:10.1016/j.worlddev.2016.10.001
Guo, J., Zhang, Z., and Meng, L. (2012). China's provincial CO2 emissions embodied in international and interprovincial trade. Energy Policy 42, 486–497. doi:10.1016/j.enpol.2011.12.015
Han, C., Chen, Y. F., and Shi, Y. Y. (2018). Measurement and decomposition of consumption carbon emissions from international final demand perspective. Quantitative Econ. Tech. Econ. Res. 35 (07), 114–129. doi:10.13653/j.cnki.jqte.2018.07.007
Jiang, Qisheng, and Tang, Pengcheng (2023). All roads lead to rome? Carbon emissions, pollutant emissions and local officials’ political promotion in China. Energy Policy 181, 113700. doi:10.1016/j.enpol.2023.113700
Jorgenson, A. K. (2016). The sociology of ecologically unequal exchange,foreign investment dependence and environmental load displacement:summary of the literature and implications for sustainability. J. Political Ecol. 23 (1), 334–349. doi:10.2458/v23i1.20221
Jorgenson, A. K. (2012). The sociology of ecologically unequal exchange and carbon dioxide emissions,1960-2005. Soc. Sci. Res. 41 (2), 242–252. doi:10.1016/j.ssresearch.2011.11.011
Kergroach, S. (2019). National innovation policies for technology upgrading through GVCs:a cross-country comparison. Technol. Forecast. Soc. Change 145, 258–272. doi:10.1016/j.techfore.2018.04.033
Li, Z., and Chen, T. (2020). A study on the accounting and allocation of implied carbon benefits of bilateral industrial value added trade between China and the United States. Finance Trade Econ. 41 (05), 84–98. doi:10.19795/j.cnki.cn11-1166/f.20200512.008
Liu, Qinglin, and Guo, Tianzi (2023). A study on the Environmental impact of FDI on the Host country under the background of “double carbon”-- an empirical Analysis based on the Yangtze River Economic Belt of China. Dongyue Symp. 44 (01), 33–43+191. doi:10.15981/j.cnki.dongyueluncong.2023.01.004
Liu, Y. F., Wang, X. Y., and Liu, X. F. (2019). Study on the impact of FDI technology spillover effect on carbon emission heterogeneity in China's manufacturing industry. Sci. Decis. Mak. (04), 23–40.
Makiela, K., and Ouattara, B. (2018). Foreign direct investment and economic growth:exploring the transmission channels. Econ. Model. 72, 296–305. doi:10.1016/j.econmod.2018.02.007
Muhammad, B., and Khan, S. (2019). Effect of bilateral FDI,energy consumption,CO2 emission and capital on economic growth of Asia countries. Energy Rep. 5, 1305–1315. doi:10.1016/j.egyr.2019.09.004
Nie, Fei, and Liu, Haiyun (2017). The impact of industrial agglomeration on foreign investment utilization in Chinese cities-an empirical study based on urbanization threshold model. World Econ. Res. (07), 64–73. doi:10.13516/j.cnki.wes.2017.07.006
Peng, Shuijun, Zhang, Wencheng, and Sun, Chuanwang (2015). Research on carbon emission measurement and influencing factors of production side and consumption side in China. Econ. Res. 50 (01), 168–182.
Salman, Muhammad, Zha, Donglan, and Wang, Guimei (2022). Indigenous versus foreign innovation and ecological footprint:Dynamic threshold effect of corruption. Environ. Sustain. Indic. 100177, 2665–9727. doi:10.1016/J.INDIC.2022.100177
Samaniego, P., Vallejo, M. C., and Martínez-Alier, J. (2017). Commercial and biophysical deficits in South America,1990-2013. Ecol. Econ. 133, 62–73. doi:10.1016/j.ecolecon.2016.11.012
Sheng, B., and Lv, Y. (2012). The impact of foreign direct investment on China’s environment:An empirical study from industrial sector panel data. China Soc. Sci. 05, 54–75+205-206.
Shi, Dan (2018). Green development and the new stage of global industrialization:China's progress and comparison. China Ind. Econ. (10), 5–18. doi:10.19581/j.cnki.ciejournal.2018.10.001
Song, Chen, and Chen, Lu (2019). Research on FDI technology spillover effect based on industry technology similarity. Int. Trade Issues (01), 106–118. doi:10.13510/j.cnki.jit.2019.01.009
Tang, Pengcheng, Jiang, Qisheng, and Mi, Lili (2021). One-vote veto: The threshold effect of environmental pollution in China's economic promotion tournament. Ecol. Econ. 185, 107069. doi:10.1016/j.ecolecon.2021.107069
Tang, Pengcheng, Liu, Xuan, Hong, Yao, and Yang, (2022). Shuwang. Moving beyond economic criteria: Exploring the social impact of green innovation from the stakeholder management perspective. Corp. Soc. Responsib. Environ. Manag., 2401. doi:10.1002/csr.2401
Wei, Houkai, He, Canfei, and Wang, Xin (2001). Analysis of foreign direct investment motives and location factors in China:An empirical study of foreign direct investment in Qinhuangdao City. Econ. Res. (02), 67–76+94.
Yao, Liu, Zhang, Jun, and Geng, Yan (2023). Exports and carbon emissions from the Perspective of Global value chain-- re-examination of the relationship between “inverted U”. Int. Trade issues (01), 90–107. doi:10.13510/j.cnki.jit.2023.01.005
Keywords: multi-region input-output model, system GMM, ecological unequal exchange, production side, consumption side
Citation: Gong M, Wang L and Li X (2023) The impact of FDI on ecological unequal exchange in China’s manufacturing industry. Front. Environ. Sci. 11:1269691. doi: 10.3389/fenvs.2023.1269691
Received: 03 August 2023; Accepted: 18 September 2023;
Published: 28 September 2023.
Edited by:
Lin Zhang, City University of Hong Kong, Hong Kong SAR, ChinaReviewed by:
Tian Meng, Yangzhou University, ChinaCopyright © 2023 Gong, Wang and Li. This is an open-access article distributed under the terms of the Creative Commons Attribution License (CC BY). The use, distribution or reproduction in other forums is permitted, provided the original author(s) and the copyright owner(s) are credited and that the original publication in this journal is cited, in accordance with accepted academic practice. No use, distribution or reproduction is permitted which does not comply with these terms.
*Correspondence: Xiaofan Li, bGl4aWFvZmExMDBAd2l0LmVkdS5jbg==
Disclaimer: All claims expressed in this article are solely those of the authors and do not necessarily represent those of their affiliated organizations, or those of the publisher, the editors and the reviewers. Any product that may be evaluated in this article or claim that may be made by its manufacturer is not guaranteed or endorsed by the publisher.
Research integrity at Frontiers
Learn more about the work of our research integrity team to safeguard the quality of each article we publish.