 Yusheng Kong1,2*
 Mary Donkor
 Mohammed Musah
95% of researchers rate our articles as excellent or good
Learn more about the work of our research integrity team to safeguard the quality of each article we publish.
Find out more
ORIGINAL RESEARCH article
Front. Environ. Sci. , 11 January 2024
Sec. Environmental Economics and Management
Volume 11 - 2023 | https://doi.org/10.3389/fenvs.2023.1269416
This article is part of the Research Topic Low-carbon transition of energy infrastructures View all 14 articles
Carbon emissions from anthropogenic human activities are viewed as the major cause of pollution in the environment. The Paris Treaty came into effect to help minimize the galloping rate of global ecological pollution. The surge in global emissions has prompted other nations to change their environmental regulations to help them to attain their emission mitigation agenda. For instance, China, United States and India have improved their Nationally Determined Contributions they pledged as signatories to the Paris Accord to help them to achieve their sustainable development goals But, despite nations committing to the guidelines of this accord, ecological contamination continues to rise in the globe. To help curb the above menace, a study on the connection between financial development, urbanization, economic growth, renewable energy consumption, and environmental quality of 27 countries from North, South and East Africa over the period 1990 to 2019 was conducted. In attaining this goal, econometric techniques that are robust to heterogeneity and residual cross-sectional dependence were deemed appropriate. From the preliminary analysis, the panel was heterogeneous and cross-sectionally dependent. Also, all the series were stationary after first difference and cointegrated in the long-run. On the regression estimates via the common correlated effects mean group technique, financial development improved environmental quality in the North, South and Eastern regions by 0.56%, 0.42%, and 0.44% respectively. Also, renewable energy promoted ecological safety in the Northern and Eastern regions by 0.24% and 0.08% respectively, but degraded environmental sustainability in the Southern region by 0.66%. Besides, economic growth deteriorated the environment in the North by 0.66%, South by 0.41%, and East by 0.25%. However, urbanization enhanced ecological safety in the East by 0.63%, but had immaterial effect on environmental quality in the North and Southern regions of Africa. Some of the aforestated results are consistent to those under the dynamic common correlated effects mean group (DCCEMG) technique as an alternative estimator. Policy recommendations to help advance the carbon-neutrality target of the regions were proposed.
Climate change and its adversities have been a major concern for all economies in the globe. Greenhouse gases (GHG) dominated by carbon dioxide emissions (CE) have been the key cause of this ecological menace. Due to the environmental, human and economic effects of climate change, 196 countries in the globe signed to the United Nations’ Climate Change Conference (COP 21) in Paris, on December 2015 to come out with Nationally Determined Contributions (NDCs) to help improve ecological quality in the globe. The aim of the Paris Agreement was for nations to pursue steps to keep temperature rise to far below 2°C, above pre-industrial levels, preferably below 1.5°C.
Despite committing to the guidelines of the Paris Accord, environmental pollution, particularly, CE is still on the ascending trend in the North, South and Eastern regions of Africa. Energy usage has been the main cause of this menace because it is the driver of all economic activities in the globe. For instance, economic activities like industrialization, construction, and natural resource extraction among others, are driven by dirty energies like fossil fuels, coal and natural gas among others, which lead to more CE in the regions. To minimize the surging rate of emissions in the regions, there has been calls for the adoption of energies from renewable sources like hydro, wind, solar, and biomass among others (Ehigiamusoe and Dogan, 2022; Olabi and Abdelkareem, 2022). Notwithstanding the enormous benefits of renewable energy in Africa, wind, solar, and biomass form a small percentage of the region’s energy mix. In sub-Saharan Africa, coal accounted for 56% of power generation in 2012, compared to 22% from hydro, 9% from gas, 9% from oil, and 3% from nuclear. But other forms of renewable energy, such as wind, solar, geothermal, and biomass contributed only 1% (Africa Energy Outlook, 2022). Academics and energy policymakers are becoming more concerned about boosting the proportion of renewable energy in the overall energy mix as urban areas expand within the continent (Bhattacharya et al., 2016).
Besides, development in the financial sector has a major effect on environmental quality in Africa. On one hand, financial development worsens ecological quality. For instance, well-structured financial systems enable businesses to access funds to purchase polluting machineries and equipment to boost their operations. However, these machineries and equipment are driven by polluting energies that end up raising the level of emissions. Also, financial development help households to access funds to buy appliances or products that are pollution-intensive. However, a strong financial framework promotes modern industrial practices, and stimulates the adoption of energy-efficient and environmentally sustainable technologies. Financial sector growth also promotes investments in research and development projects that are linked to ecological sustainability. Additionally, economic growth is a major cause of environmental pollution in Africa, because almost all economic activities undertaken in the region are driven by energies from polluting sources. For instance, Africa is undergoing a massive economic transformation due to industrialization, natural resource exploitation, and mass agricultural production among others. These economic activities are powered by energies dominating by polluting fuels that end up degrading the environment.
Moreover, urbanization is an important symbol of modernity and has an indispensable role in the growth and advancement of the contemporary economy and society. Cities are becoming increasingly crowded worldwide, and for the first time, in 2007, the world’s urban population outnumbered its rural counterpart. Between 1970 and 2018, the world’s urban population grew from 1.35 billion to 4.22 billion, with an urban rate of 36.6 percent to 55.3 percent. According to predictions by the United Nation (UN), the global urbanization process will continue to accelerate. By 2050, the global urban population will approach 6.6 billion people, with a 68 percent urbanization rate (UNPD, 2019). The growth in urbanization rate corresponds to the growth in global emissions, because human-caused emissions have accounted for about half of global GHG emissions (IPCC, 2014), after the industrial revolution. In Africa, urban population grew from 15% in 1960 to 40% in 2010, with a predicted 60% growth by 2050 (UN HABITAT, 2018). As cities become more urbanized, there will be the rise in the consumption of polluting energies, consequently causing ecological damage. For instance, the rise in urbanization will lead to the rise in economic activities. However, almost all economic activities undertaken in the regions of Africa are reliant on polluting fuels. Therefore, the surge in urbanization in Africa will negatively affect environmental and economic sustainability if not properly manage.
The increasing rate of emissions in Africa motivated the conduct of this study. In terms of CO2 emissions from industry and fossil fuels, Africa accounted for 3.9% of the global figure in 2021 (Hassan et al., 2023). In the same year, South Africa was ranked as the most polluting nation in Africa, as it released over 436 million metric tons of CO2 emissions that year (Ofori-Sasu et al., 2023). With around 250 million metric tons of CO2 emissions, Egypt came in second, behind Nigeria, Libya, and Algeria. Also, of all nations in Africa, South Africa and Libya had the largest per capita CO2 emissions. According to Ofori-Sasu et al. (2023), the total amount of CO2 emissions Africa produced between 1884 and 2020 was estimated to be 48 billion metric tons. However, the globe released over 1.7 trillion metric tons of CO2 between 1750 and 2020. The above statistics make Africa the least contributor of global CO2 emissions, accounting for 3% of the world’s figure, compared to highest polluters like the US, Europe, and China. The continent also contributes the least percentage of global greenhouse gas emissions over the past 20 years, contributing between 3.4 and 3.9 percent. Though Africa contributes very little to global emissions, the continent is extremely susceptible to the effects of climate change. Based on the ND-GAIN country index, the nations with the highest susceptibility to and lowest readiness for the impact of global climate change in 2019 were Chad, the Central African Republic, Eritrea, Guinea-Bissau, and the Democratic Republic of the Congo. The above statistics suggests that Africa is prone to the negative implications of climate change. Therefore, undertaken this study to come out with policy options to improve ecological sustainability in the region is deemed appropriate.
Moreover, the worsening environmental conditions in Africa have influenced the conduct of many environmental studies in the region. However, majority of those studies concentrated on the Sub-Saharan African region as a whole, without breaking the bloc into sub-regions. This study patches that void by examining how financial development, economic growth, urbanization and renewable energy predict ecological pollution in the North, South and Eastern regions of Africa. Besides, the varied discoveries from the many environmental studies in the region signposts that more explorations on the region are warranted. Hence, studying the connection between financial development, economic growth, urbanization, renewable energy, and environmental quality in the North, South and East Africa to help promote the emission mitigation agenda of the region is worthwhile. Based on objective of the study, the research question of the study is; how do financial development, economic growth, urbanization, renewable energy, and environmental quality in the North, South and East Africa? Answers to this question will help policymakers to formulate stringent policies to promote ecological sustainability in the region.
The study contributes to extant literature in diverse ways. First, the study considers the issue of heterogeneity by grouping the sample into North, South, and East Africa. This is to resolve the issue of “lump sum” so as to attain the elasticity of the regressors in the various regions. Besides, the studied series varied across the various regions. Therefore, considering heterogeneity in the analysis is worthwhile. Also, the study makes a methodological contribution by employing robust econometric techniques. For instance, the DCCEMG and the CCEMG techniques adopted for the study are robust to cross-sectional correlations and heterogeneity. Because the DCCEMG is a dynamic estimator, it includes into its model the lagged response variable as an additional regressor. By so doing, the issue of endogeneity is resolved. Most prior explorations conducted on Africa failed to engage these robust econometric techniques.
This study aims to provide regional decision-makers with valid and reliable information to help advance the ecological and economic decisions of the nations under study. The study also adds to the existing pool of literature on the topic of concern. This will serve as a reference material for further studies in future. The remaining sections of this study are structured as follows: Part two reviews literature that supports the topic understudy, while Part three describes the data, methodology and the econometric techniques that are engaged in conducting the study. In Part four, the results and their discussions are presented, while Part five presents the conclusions and identifies the economic implications and policy recommendations of the study.
Theoretically, financial development influences environmental quality in diverse ways. On one hand, development in the financial sector improves environmental quality. For instance, financial development help households to obtain low-cost loans to buy carbon-intensive items that end up polluting the environment (Udeagha and Breitenbach, 2023). Well-developed financial systems also help entities to obtain funding to expand their production, leading to high energy consumption, and therefore, more pollutant emissions (Ju et al., 2023). In contrast, financial sector growth help to fund investments in green energy generation, energy efficiency, and green technological innovations. This aid in promoting ecological sustainability via low emissions (Destek and Sarkodie, 2019). Advancement in the financial sector also promotes research and development activities that linked to ecological quality improvements (Xiong and Qi, 2018).
The compact cities, ecological modernization, and urban transition theories are the mostly used theories to explain the connection between urbanization and ecological pollution. The ecological modernization proposition contends that urbanization is a system of social evolution that signifies modernity. According to the theory, environmental problems occur as the society transitions from a low to a medium income economy, because growth occurs at the expense of ecological safety (Poumanyvong and Kaneko, 2010). However, the detrimental consequences of urban expansion could be lessened with increased innovative technologies. The urban transition theory places a strong emphasis on urban revolution at the city level. It contends that as manufacturing activities increase and the city’s affluence rises, industrial pollution rises as well (McGranahan et al., 2010). However, due to changes in economic structure or technological developments, environmental threats to the society minimizes. The compact city theory on the other hand, emphasizes the benefits of increasing urbanization, asserting that higher urban densities increase economies of scale in public facilities, hence mitigating ecological problems (Gren et al., 2019).
Economic growth affects the environment in three diverse ways-the scale, composition, and technique effects. According to the scale effect, the rise in economic activities leads to the rise in pollution because more inputs are utilized (Arouri et al., 2012). However, as economic activities rise, so does consumer demand for greener products. This could influence firms to change their production processes in order to reduce pollution. To Tenaw, (2021), this connection amidst economic growth and environmental pollution is the composition effect. Finally, the technique effect posits that, the rise in environmental pollution associated with the rise in economic activities, influences the use of greener technologies in the manufacturing process, thereby advancing ecological safety (Ansari and Khan, 2021).
Xuezhou et al. (2022) explored SSA countries using data from 1980 to 2017 and found that in three different geographic areas, financial development had a detrimental impact on CE levels (Southern, Northern, and Central). Financial development reduces CE and improves the environment in these nations. Also, financial development positively influenced CE in West Africa. Hence, financial development in these nations worsens environmental conditions rather than improving them by producing more carbon emissions. The causality findings in the West and Central African nations indicated a two-way causative relationship between CE and GDP. The findings of Ntarmah et al. (2022) on the role of bank financing in, EG and environmental outcomes of SSA from 1990–2018 revealed that bank financing raised carbon emissions across quartiles and had a favorable impact on Eastern and Central African CE but negatively impacted West African carbon emissions. Suggesting that bank funding lessens the effects of emissions on low-emission nations (Southern and West African sub-regions). While worsening the impact of emissions on middle- and high-emission countries (East and Central African regions). Again, their outcome on connectivity between credit supply, GDP, and the environment suggested credit availability negatively impacted the CE of West African sub-regions and a significant favorable impact on the sub-regions of Central and East African. The Central and East sub region’s credit supply and CE are causally linked in both directions. Moreover, Musah et al. (2022) investigation in West Africa on FD and environmental sustainability from 1990 to 2016 showed that financial growth was detrimental to environmental viability due to excessive CE. A causality from FD to CE was disclosed Haibo and Manu (2022), findings suggested that carbon emissions exhibited significant but negative and positive influences on the financial performance of Northern and Southern countries, respectively. Finally, a bilateral causal linkage was discovered between CE, bank deposit, and bank credit. Adams and Klobodu (2018) findings on determinants of EQ for 26 countries in Africa from 1985–2011 unveiled that financial development was a determinant of EQ which was proxy as CE. Based on above discoveries the following hypothesis is formulated for testing;
H1. Financial development significantly predicts environmental quality in Africa.
Donkor et al. (2022) examined economic growth, environmental quality and government expenditure from 2000 to 2016. It established that GDP positively impacts carbon emissions in North and South nations, and the causation showed a one-way from GDP to CE. Abdul-Mumuni et al. (2022) discovered an unequal response regarding environmental damage accompanying increased economic growth. Positive and negative shocks to economic development ultimately led to increased ecological deterioration. Ntarmah et al. (2021) investigation of the connections between loan availability, economic expansion, and environmental factors from 1990 to 2018 established that Central African nations’ economic expansion negatively influences carbon emissions, but not East, South, or West African countries. The outcomes of Iheonu et al. (2021) on whether some economic indicators have suggestive effects in upholding environmental sustainability from 1990–2016 unraveled that GDP raised CE across the measured quartiles, with a stronger impact in nations where current CE were at their lowest levels. The research also demonstrates a two-way causative relationship between GDP and CE. Adewuyi and Awodumi (2017) and Khoshnevis Yazdi and Ghorchi Beygi (2018) established a substantial interaction between GDP and CE with feedback effects in five West African nations: Togo, Burkina Faso, Mali, The Gambia and Nigeria. Finally, Wang and Dong (2019) found that GDP positively affected the ecological footprint (EF) in SSA countries. Also, a feedback causality between GDP and EF was discovered. Based on aforestated reviews the hypothesis formulated for the study is;
H2. Economic growth has a significant effect on environmental quality in Africa.
Abdul-Mumuni et al. (2022) results from 1990–2018 on asymmetric impact of energy usage and GDP on CE show that adjustments in the use of renewable energy–both positive and negative decline environmental damage. Also, Erdoğan et al. (2022) unveiled that renewables exist as a significant de-carbonization channel within the framework of increasing urbanization level among SSA countries. According to the study of Wang and Dong (2019), RNE negatively predicted EF. Also, a one-way causal relationship was found between them. Khoshnevis Yazdi and Ghorchi Beygi, (2018) investigation on the dynamic impact of RNE and financial growth on CE from 1985 to 2015 showed that RNE decreases CE. The study discovered a unidirectional causal relationship between the use of RNE and CE in African nations and a two-way causative relationship between CE, FD, and GDP. Apergis et al. (2018) results from 42 SSA countries on whether RNE and health expense decrease CE from 1995–2011 revealed that RNE significantly reduces CE in the selected economies in Africa. Hanif, (2018); Inglesi-Lotz and Dogan, (2018) results support alternatives to RNE usage raise air quality by limiting CE and reducing the direct contact of homes with toxic gases. (Fuinhas et al., 2017). conducted a study on Latin America from 1991 to 2012. From the results, primary energy consumption enhanced CE in the countries, but energies from renewable sources improved ecological quality via low emissions. This discovery deviates the study of Koengkan and Fuinhas, (2022) for 18 Latin American countries. Kazemzadeh et al. (2023a) investigated the share of renewable energy consumption in total electricity consumption in 49 global economies over the period 1985 to 2017. From the findings, the share of renewable energy consumption in total electricity consumption was interdependent. Kazemzadeh et al. (2023b) investigated 75 economies from 2006 to 2020. From the quantile regression estimates, energy transition mitigated CE in the 10th and 25th quantiles. Koengkan et al. (2023) adopted the asymmetric approach to study the influence of energy transition on environmental deterioration in 18 Latin America and Caribbean economies. From the results, both positive and negative shocks in renewable energy mitigated pollution in the countries. Kazemzadeh et al. (2023a) analyzed factors that influenced CE intensity in 94 economies using the necessary condition analysis and fuzzy-set qualitative comparative analysis techniques, it was disclosed that reducing carbon emission intensity required addressing economic complexity and curtailing the reliance on fossil energy consumption. Based on above reviews, the hypothesis formulated for testing is;
H3. Renewable energy enhances environmental quality in Africa.
Hussain et al. (2022) scrutinized the effect of urbanization and non-renewable energy on CE in Africa from 1996–2019 and found a positive correlation between URB and CE. Nathaniel and Adeleye, (2021) investigation on environmental conservation amid carbon emissions, energy use, and urbanization from 1992–2016 on selected Africa countries found out that urbanization has asymmetric impact on the environment. Analysis by Salahuddin et al. (2019) from 1984 to 2016 on the impact of URB and globalization on CE revealed a positive connection between urbanization and CE. Adams and Klobodu, (2018) findings on determinants of selected countries from 1985–2011 exhibited that urbanization is a determinant of environmental degradation. The investigations of Erdoğan et al. (2022); Hanif, (2018); Iheonu et al. (2021); Wang and Dong (2019) confirmed urbanization as a key promoter of CE in SSA economies. Also, a feedback causality between urbanization and CE was revealed. With respect to above reviews the following hypothesis is formulated for testing;
H4. Urbanization has a material influence on environmental quality in Africa.
From the literature, it is obvious that efforts have been made towards environmental outcomes and their influencing factors. Nonetheless, the literature on the link between financial development, economic growth, urbanization, renewable energy, and environmental deterioration has yielded contrasting outcomes. Whilst some discovered positive effects of the variables on environmental pollution, others unfolded negative association amidst the series. Some on the other hand, found a neutral connection amidst the variables of concern. The mixed discoveries might be due to the variables used, study period, and econometric methods among others. This signposts that, the debate on the nexus amidst the series is ceaseless and warrants further interrogations. Also, considering the surging rate of pollution in Africa, and financial development, economic growth, urbanization, and renewable energy playing several roles in the ecological sustainability of nations, studying how the variables could explain CE in the North, South, and Eastern regions of Africa is deemed appropriate. Also, prior explorations in their attempt to examine the environmental effects of financial development, economic growth, urbanization and renewable energy mostly engaged conventional econometric techniques that ignored residual cross-sectional dependence, and slope heterogeneity among others. This study fills that gap by employing the CCEMG and the DCCEMG econometric techniques that are robust to these issues.
A panel data of twenty-seven (27) North, South and East African countries for the period 1990 to 2019 is used for the analysis. The nations and timeframe used for the analysis are dependent on data availability. Specifically, data on CE, for most of the countries were up 2019 as of the time this analysis was conducted. Also, the predictors’ data for majority of the analyzed countries were not available for periods below 1990. Therefore, using 1990 as the start period and 2019 as the end period, the period 1990–2019 was deemed appropriate for the study because all the countries could contribute significant data in that timeframe. The studied countries include Algeria, Egypt, Libya, Morocco, Sudan, Tunisia, Angola, Botswana, Lesotho, Mozambique, Namibia, Swaziland, South Africa, Zambia, Zimbabwe, Burundi, Comoros, Djibouti, Ethiopia, Kenya, Madagascar, Malawi, Mauritius, Rwanda, Seychelles, Somalia, and Uganda. Geographically, culturally, politically, and financially, these countries are incredibly diverse. Six different variables sourced from the database of the World Bank (WDI) are used for the study. The variables are carbon dioxide emissions (CO2 emissions), financial development (FD), renewable energy (RE), urbanization (URB) and economic growth (GDP). Details on the variables used for the study are shown in Table 1 with their various descriptions outlined below the table.
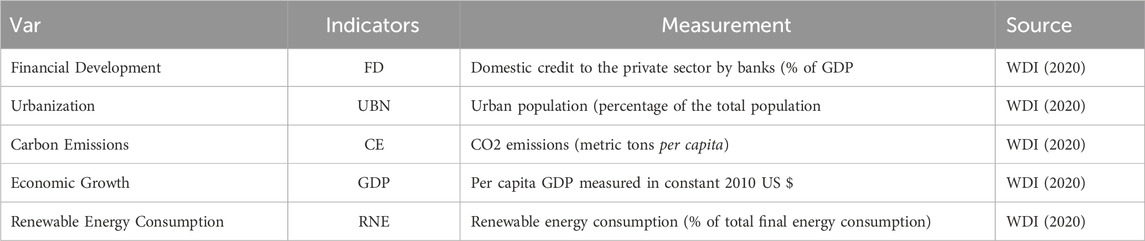
TABLE 1. Variable definition.
CO2 emissions: CO2 emissions is an important heat-trapping gas, that comes from the extraction and burning of fossil fuels (such as coal, oil, and natural gas), from wildfires, and natural processes like volcanic eruptions. According to the World Bank, CO2 emissions are those stemming from the burning of fossil fuels and the manufacture of cement. They include carbon dioxide produced during consumption of solid, liquid, and gas fuels and gas flaring. As reported by the Environmental Protection Agency of the United States, CO2 emissions from fossil fuels and industrial processes account for 65% of global greenhouse gas emissions, while the effusions of carbon from forest and other land products represent 11% of the global figure. Because CO2 emissions account for a greater percentage of greenhouse gases emitted on the environment, it has been expansively used as a measure of environmental pollution in past and present explorations. Therefore, following Mirziyoyeva and Salahodjaev, (2023) and Anwar et al. (2022), we adopt CO2 emissions measured as metric tons per capita as our proxy of environmental quality.
Financial Development: Financial development refers to the size of capital flows in financial institutions, capital markets, and foreign direct investments. According to the World Bank, financial development occurs when financial instruments, markets, and intermediaries ease the effects of information, enforcement, and transaction costs and therefore do a correspondingly better job at providing the key functions of the financial sector in the economy. Improvements in producing information about possible investments and capital allocation, monitoring firms and exerting corporate governance, trading, diversification, and management of risk, mobilization and pooling of savings, and easing the exchange of goods and services are among the key functions of financial sector growth. Financial development has been expansively used to predict environmental quality in different geographical locations, where positive Yang et al. (2023) negative Tao et al. (2023), and neutral effects Ren et al. (2023) have been disclosed. Therefore, using the variable to predict environmental quality in the studied countries is worthwhile. Following Aljadani et al. (2023), we use domestic credit to private sector by banks as a percentage of GDP to proxy financial development in our study.
Renewable Energy Consumption: Renewable energy, also known as green or clean energy, emanates from sources that could be easily replenished. Examples of energies from renewable sources are wind, hydro, solar, geothermal and biomass among others. Energies from renewable sources are beneficial because, they enhanced reliability, security, and resilience of the nation’s power grid; promote job creation throughout renewable energy industries; reduce carbon emissions and air pollution from energy production; raises energy independence; increases affordability, as many types of renewable energy are cost-competitive with traditional energy sources; and expand clean energy access for non-grid-connected or remote, coastal, or islanded communities. According to the World Bank, renewable energy consumption is the share of renewable energy in total final energy consumption. The variable has been used by researcher like Jinapor et al. (2023), Sun et al. (2023) and Gyimah et al. (2023) among others, to predict environmental quality in different jurisdictions. Therefore, following above researchers, using renewable energy as a determinant of environmental quality in the studied regions is very fitting. Renewable energy is measured as a percentage of the total energy consumption of the investigated countries.
Urbanization: According to the Environmental Protection Agency of the United States, urbanization refers to the concentration of human population into discrete areas. This concentration leads to the transformation of land for residential, commercial, industrial and transportation purposes. Urbanization is influenced highly by the notion that towns and cities have better conditions of service as compared to rural areas. It is very common in developed and developing world because people have the propensity to migrate to urban areas to have access to better transportation, business opportunities, housing, sanitation, healthcare, and better education among others. Numerous studies have used urbanization to predict ecological quality in diverse geographical settings, where positive Hussain et al. (2022), negative Wang et al. (2021), and nonlinear effects Ahmed et al. (2019) were reported. In line with these studies, we use urbanization as a determinant of environmental quality in this study. Urbanization in our exploration is measured as urban population as a percentage of the total population of the individual nations.
Economic Growth: Economic growth is the rise in the size of a nation’s economy over a certain period of time. Put simply, economic growth is the surge in the aggregate production of an economy, often manifested in the increase in national income. Gross domestic product (GDP), which represents the total production of goods and services, is usually used to measure the size of country’s economy. According to the World Bank, GDP represents the sum of value added by all its producers. Value added is the value of the gross output of producers less the value of intermediate goods and services consumed in production, before accounting for consumption of fixed capital in production. Researchers Abid et al. (2023), Ronaghi and Scorsone, (2023) and Umar et al. (2023) in their study on the determinants of environmental quality, confirmed economic growth as one of the key factors. Therefore, using the variable to explain ecological quality in the regions is very fitting. In our analysis, we proxied economic growth by GDP Per capita measured in constant 2010 US dollars ($).
The anthropogenic contamination of the environment inspires researchers to conduct studies to examine the causes of pollution on the environment, so as to make recommendations to advance environmental quality in economies. Based on the prevailing nature of ecological deterioration in North, South and East Africa, undertaking such studies could help to promote the pollution mitigation agenda of the regions. This study seeks to examine the effect of financial development, urbanization, economic growth and renewable energy on ecological pollution in the aforesated regions to help propose measures to improve environmental sustainability in the regions. To attain this goal, the following baseline econometric model is developed for estimation;
Where
Where lnFD, lnRNE, lnURB, lnGDP, and lnCE are the log transformations of FD, RNE, URB, GDP, and CE respectively. Expectedly, the coefficient of FD is to be positive
At the first stage, the Breusch and Pagan (1980) LM test, the Pesaran (2004) scaled LM test, and the Pesaran (2015) cross-sectional dependence (CD) test are used to study dependencies or otherwise in the panels. These tests are conducted because of the potential interdependence among the variables due to trade and other macroeconomic activities. According to Kong et al. (2023) and Musah et al. (2023), the negligence of cross-sectional correlations between variables might result in inaccurate estimations and conclusions. Hence, following Wu et al. (2023) the aforestated tests are engaged to study the CD attributes of the studied panels.
At the second stage, we employ the Hashem Pesaran and Yamagata, (2008) test to examine whether the slope parameters are heterogeneous or homogeneous in line with the study of Chen et al. (2022). This test is engaged because the negligence of slope heterogeneity could lead to biased estimates and conclusions. The Pesaran-Yamaga test predicts the delta tilde (
Moreover, the unit root properties of variables are pertinent, because they guide the selection of econometric methods to be employed. Therefore, following Sun et al. (2022), the CIPS and CADF unit root tests are used to assess the integration characteristics of the series at the third stage. These tests are used because they are robust to residual cross-sectional correlations. The CADF and CIPS tests are respectively estimated through the following models.
Also, before the elasticities of the determinants could be explored, it is worthwhile to examine whether the series possess a long-term cointegration association or not. Therefore, following Chen and Wang (2019), the Westerlund and Edgerton (2007) bootstrap test is used to examine the cointegration attributes of the variables. This test is used because it controls for cross-sectional correlations and heterogeneity. The test predicts the group (
After confirming the series to be cointegrated in the long-run, the CCEMG estimator is used to examine the coefficients of the predictors in line with the study of (Murshed et al., 2022). This technique is engaged because it accounts for heterogeneity and residual cross-sectional dependence (CD). The technique is also appropriate for both stationary and non-stationary variables. The idea of common correlated effects estimation, introduced in Pesaran (2006), is to approximate the projection space of unobserved common factors with the inclusion of cross section averages of the variables in the regression equation. Following Pesaran (2006), our CCEMG specification with augmented cross-sectional averages to account for CD is specified as;
Where
Where
Finally, the Dumitrescu and Hurlin (2012) causality test is engaged to explore the causalities between the variables in line with the study of (Espoir et al., 2021). This test is chosen because it is efficient to heterogeneous panels. The test is also used because it is robust to CD as disclosed in this study. The Dumitrescu-Hurlin test predicts the
Following Fuinhas et al. (2017), the conceptual framework depicted in Figure 1 is developed for the study.
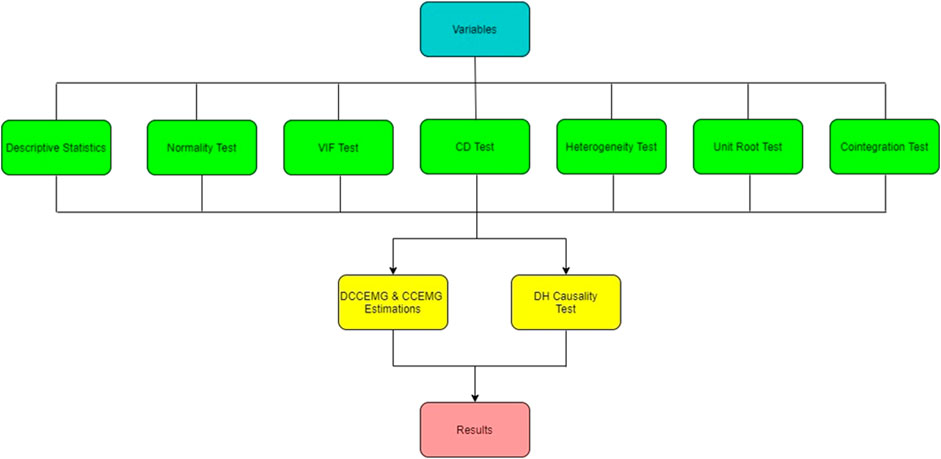
FIGURE 1. Conceptual framework of the study. (Source: Authors’ creation).
The descriptive statistics are displayed in Table 2. From the table, the Eastern economies produce the least carbon dioxide (M = 0.91, SD = 1.69), followed by Northern economies with (M = 3.85, SD = 2.93), whereas Southern Africa has the most of carbon emissions with (M = 76,130.42, SD). This suggests that, on average, Southern economies pollute the climate of Africa more than Northern and Eastern blocks. Again, it is interesting to see that the Southern republics growth rate is comparably small considering their carbon emissions to that of the Northern block, even though their emission is smaller yet high increase in growth rate is recorded. Furthermore, financial development in the Northern region is averagely higher compared to Eastern and Southern regions. Contrarily, Southern and Eastern regions record high investments in RNE as compared to the Northern region. Urban population growth in the North is higher compared to the Southern and Eastern blocks. Kurtosis in the Northern region is mostly mesokurtic (i.e., kurtosis values
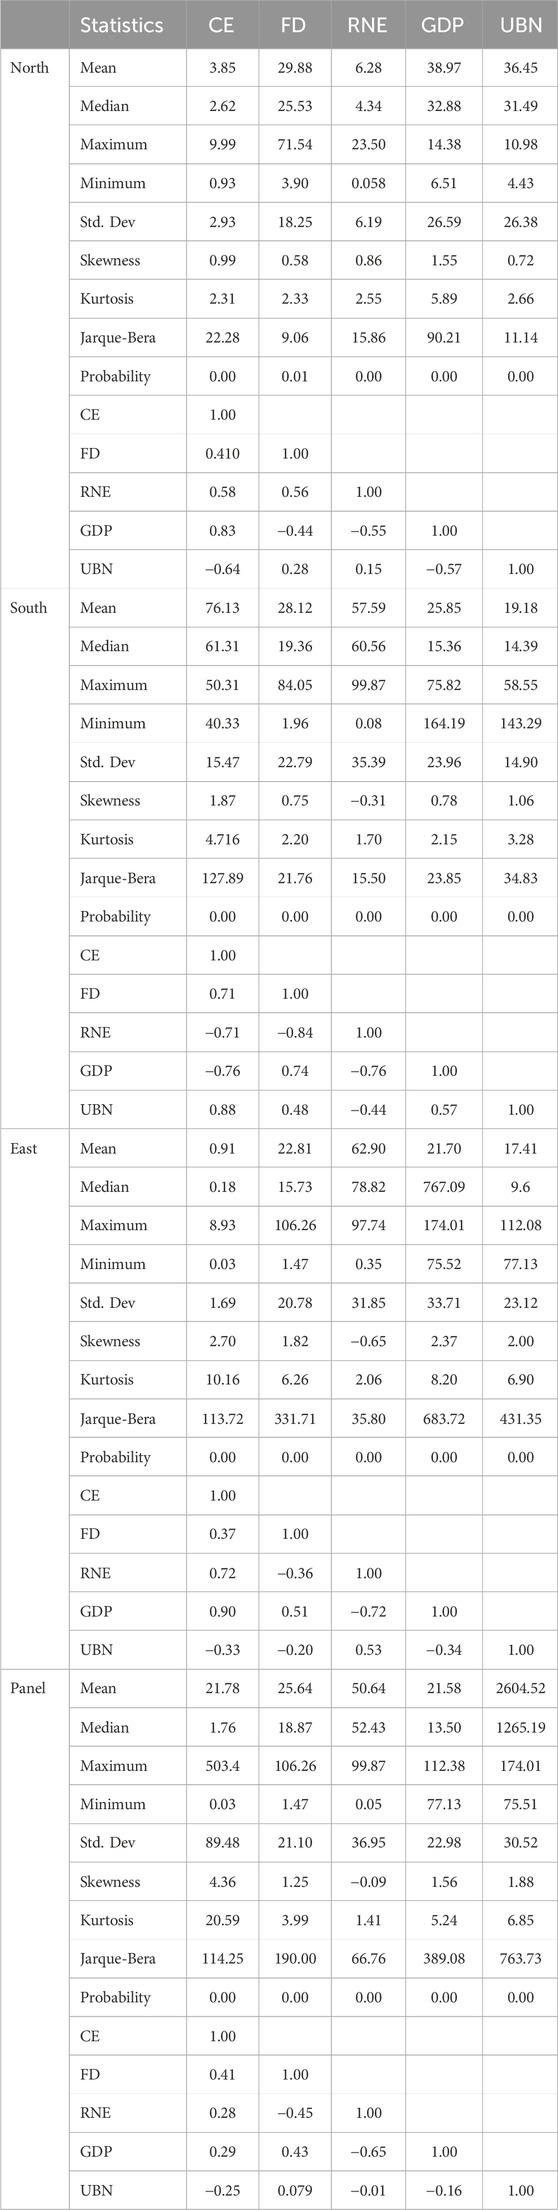
TABLE 2. Descriptive statistics and correlational matrix.
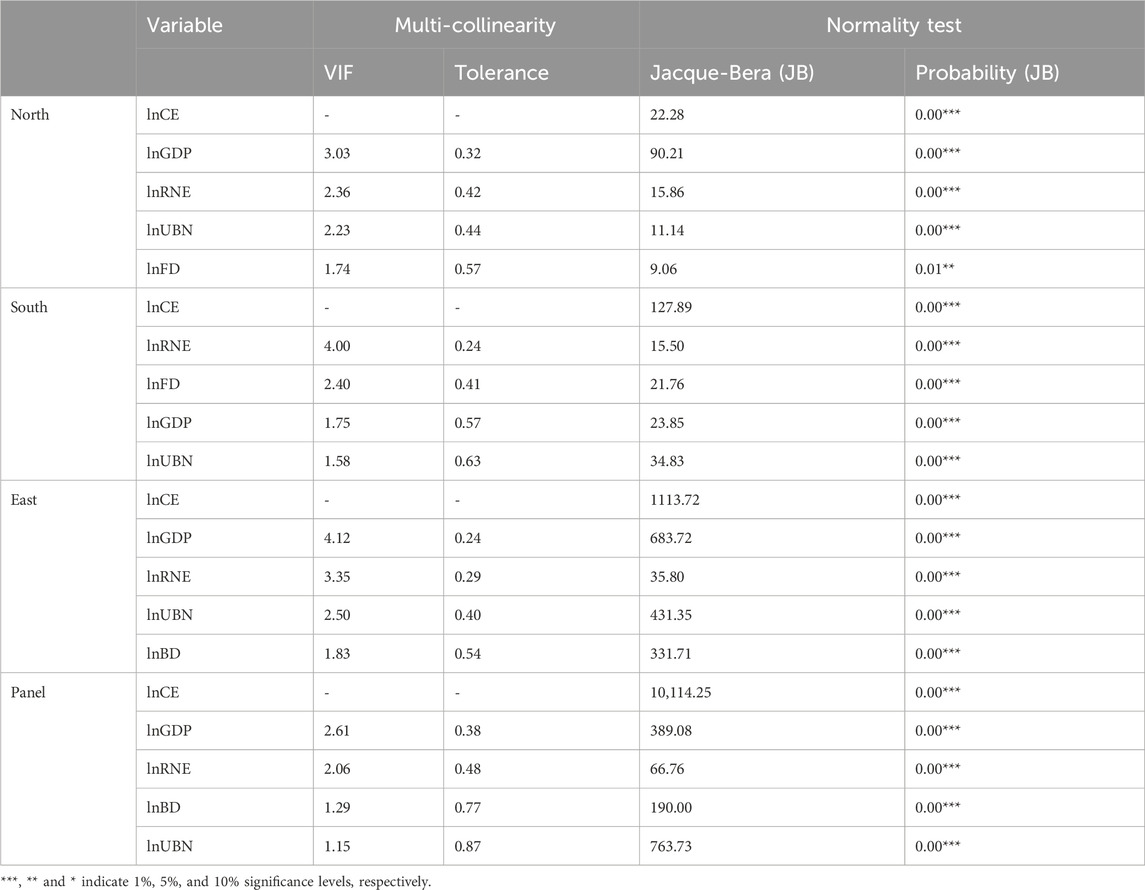
TABLE 3. Multi-collinearity and normality test.
The study’s initial test is to determine whether there are cross-sectional correlations in the error terms or not. Therefore, the CD tests displayed in Table 4 are conducted for that purpose. From the results, the null hypothesis of no CD in the residual terms is rejected. This implies, the error terms are cross-sectionally correlated. Hence, the study’s analysis is conducted using econometric methods robust to cross-sectional dependencies. Also, because the negligence of heterogeneity could be detrimental in panel regression analysis (Breitung and Das, 2005), the Pesaran-Yamagata test is used to determine whether or not there is heterogeneity in the slope coefficients or not. Based on the tests’ results displayed in Table 5, the null hypothesis that the slope coefficients are homogeneous cannot be accepted. This implies, the slope parameters are heterogeneous in nature. Based on this outcome, the study’s analysis is conducted using econometric methods that are robust to heterogeneous slopes.
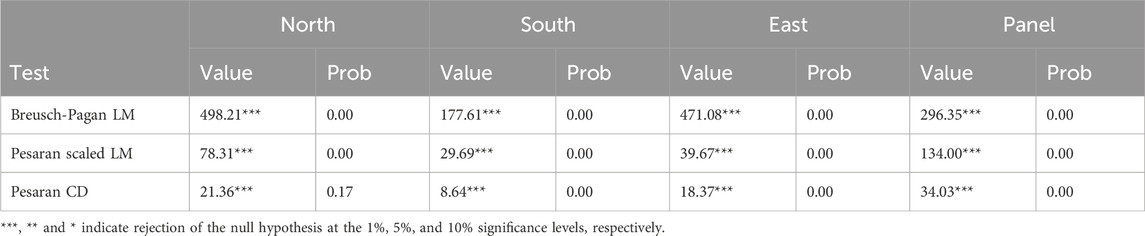
TABLE 4. Cross-sectional dependency test results.
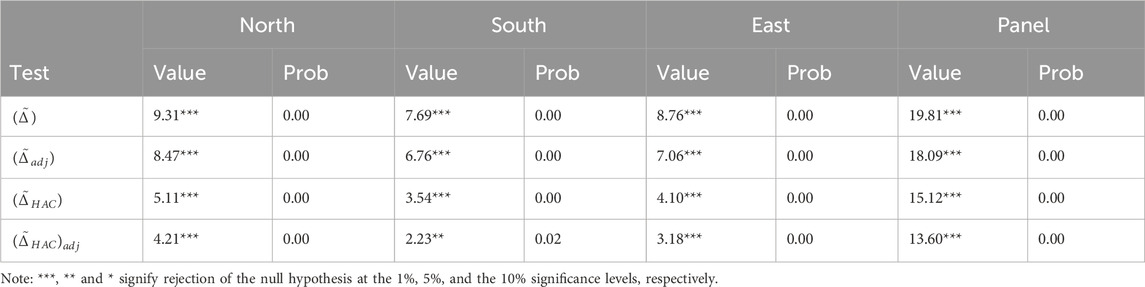
TABLE 5. Heterogeneity test results.
At the third phase of the analysis, the CIPS and CADF stationarity tests are used to assess the series’ integration features. Based on the results displayed in Table 6, the null hypotheses of no unit root in the series cannot be accepted at levels, but can be accepted after first difference. This implies, the variables have a first differenced integration order, supporting the studies of (Phale et al., 2021; Musah, 2022; Tackie et al., 2022). Fourthly, the Westerlund and Edgerton’s bootstrap test is engaged to examine the cointegration attributes of the series. According to the results displayed in Tables 7, the series are flanked by a long-run cointegration association aligning the investigations of (Li et al., 2020; Donkor et al., 2022). Based on this discovery, the researchers proceeded to discover the elasticities of the regressors.
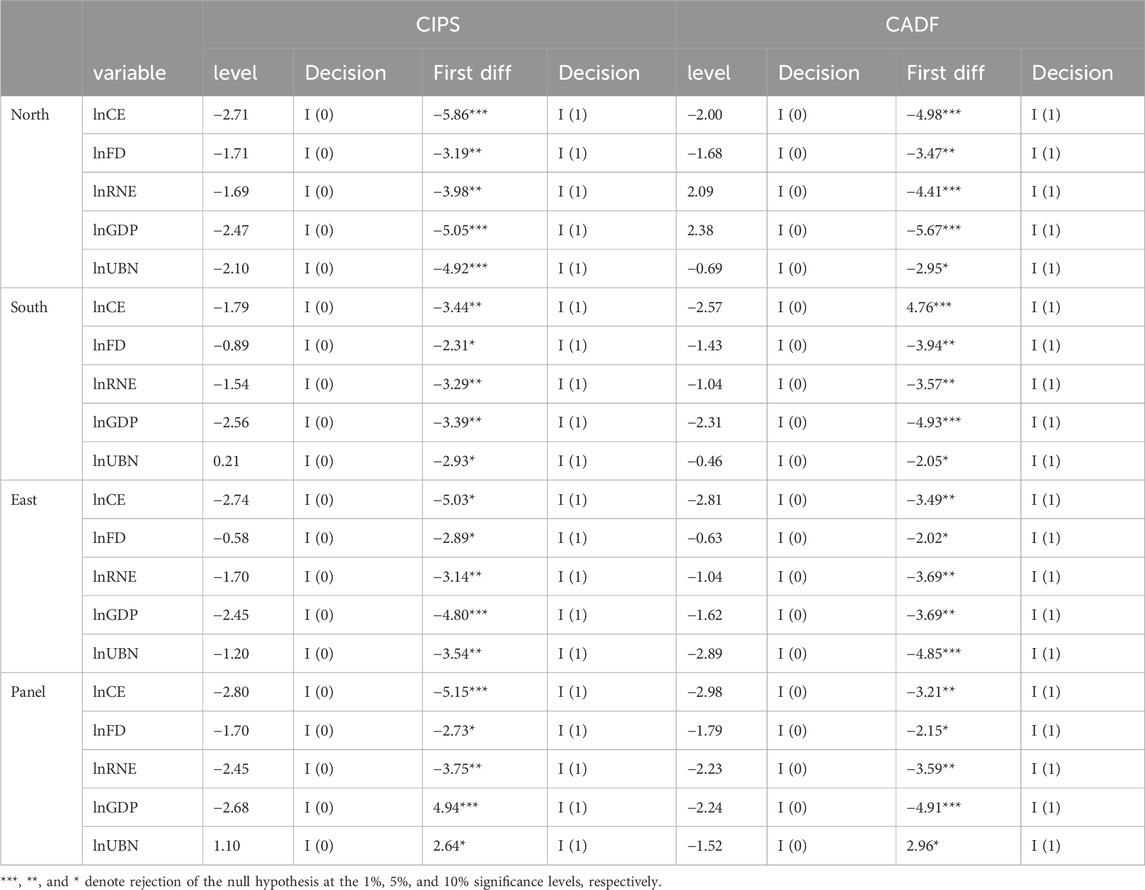
TABLE 6. CIPS and CADF unit root tests results.
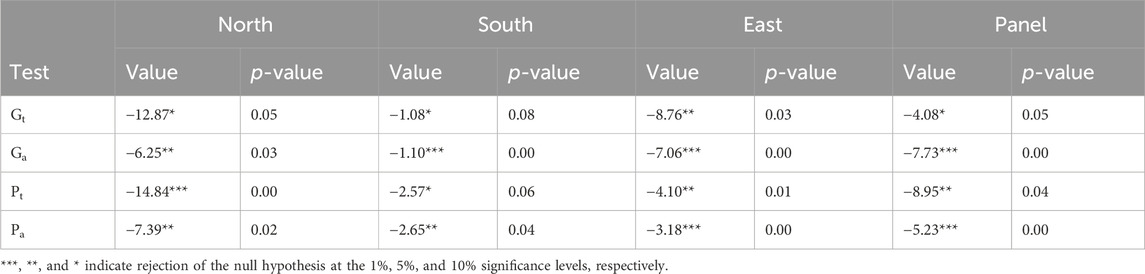
TABLE 7. Westerlund and Edgerton panel cointegration test results.
Having confirmed the variables to be cointegrated in the long-run, the CCEMG regression technique is first adopted to estimate the coefficients of the determinants. Based on the results displayed in Tables 8, FD has a decreasing effect on CE in the entire panel, and the North, South, and Eastern regions of Africa. Ceteris paribus, a 1% increase in FD mitigated CE by 0.56% in the Northern region, 0.42% in the Southern region, 0.44% in the Eastern region, and 0.22% in the entire panel. Also, the coefficient of RE is significantly negative for the entire panel and the Northern region, positive and significant for the Southern region, but negatively insignificant for the Eastern region of Africa. All factors held constant, a percentage rise in clean energy mitigated CE by 0.24% in the Northern region and 0.21% in the entire panel.
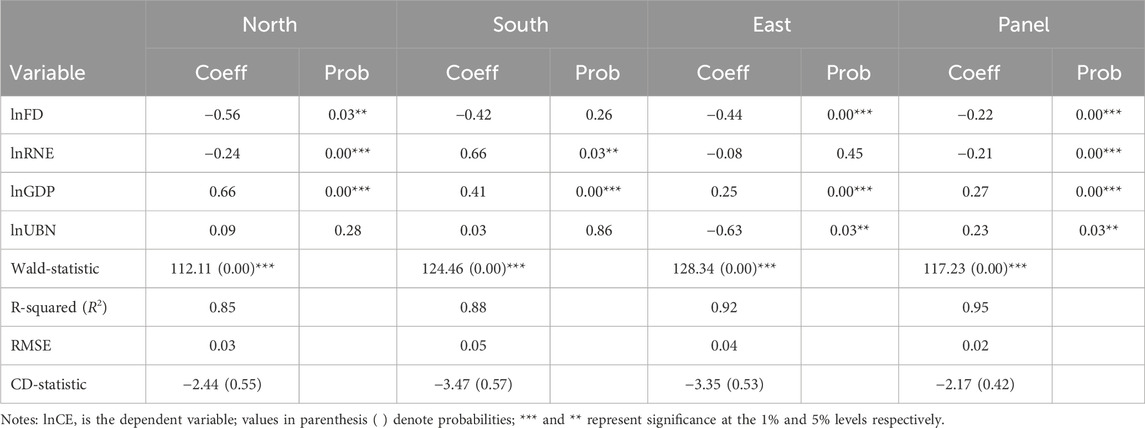
TABLE 8. CCEMG estimation results.
Furthermore, GDP has a significantly positive effect on CE in the regions and the entire panel. Specifically, a 1% rise in GDP leads to a 0.66% increase in the Northern region, 0.41% rise in the Southern region, 0.25% surge in the Eastern region, and 0.27% increase in the aggregate panel. However, GDP trivially predicts CE in the Northern and Southern regions of Africa. Ceteris paribus, a percentage surge in urbanization raises CE by 0.23% in the aggregate panel, but mitigates emissions of carbon by 0.63% in the Eastern region. Besides, the significant Wald-statistic values signposts that the estimated models have a very high predictive power. Also, the R-squared values implies, FD, RE, GDP, and URB account for 0.85%, 0.88%, 0.92%, and 0.95% of the variations in CE correspondingly. Moreover, the root mean square error (RMSE) values justify that the estimated models are very accurate, while the insignificant CD test statistics suggests that the issue of cross-sectional correlations initially detected in the panels have been minimized.
From the results, FD has a decreasing effect on CE in the entire panel, and the North, South, and Eastern regions of Africa. This suggests that development in the financial sector is beneficial to environmental quality in the studied regions. Financial sector advancements can boost ecological sustainability in the regions by stimulating investments in green energy generation and utilization, thereby reducing pollutant effusions. Financial sector growth also promotes the adoption of technological innovations and energy efficient activities that could add to environmental safety in the regions. Besides, a well-developed financial sector could stimulate investments in research and development initiatives that are gainful to ecological sustainability. The negative association between FD and CE supports the studies of Xuezhou et al. (2022) and Haibo and Manu (2022), but contrasts those of Ntarmah et al. (2022) and Musah et al. (2022).
Also, the coefficient of RE is significantly negative for the entire panel and the Northern region, positive and significant for the Southern region, but negatively insignificant for the Eastern region of Africa. This suggests that RE adoption improves environmental quality in the region as a whole. The results is not surprising because, most countries in Africa have become aware of the ecological consequences of dirty energies like fossil fuels, coal, and natural gas among others, as a result, they are shifting to the utilization of clean energies like solar, wind, biogas, and hydro among others, that have been proven to be environmentally gainful. Besides, nations in Africa have formulated environmental laws to regulate the operations of entities in the bloc, amongst them are sanctions for those that use polluting energies in their undertakings. This finding aligns those of Abdul-Mumuni et al. (2022); Erdoğan et al. (2022), but conflicts that of Gyimah et al. (2023) for Ghana.
The positive coefficient for the Southern region signposts that, the clean energies adopted by those countries are linked to the generation of emissions. This is possible because the installation of solar and wind panels among others involves the utilization of machineries and equipment that are driven by polluting energies. The positive association between RE and CE contrasts the studies of Wang and Dong (2019) and Khoshnevis Yazdi and Ghorchi Beygi, (2018). The insignificant connection between RE and CE in the Eastern region implies, the adoption of energies from green sources failed have any material influence on the region’s environmental quality. However, since the coefficient is negative, the continuous adoption of RE could boost ecological sustainability in the future. The finding varies from those of Apergis et al. (2018), Hanif, (2018) and Inglesi-Lotz and Dogan, (2018).
Furthermore, GDP has a significantly positive effect on CE in the regions and the entire panel. These findings suggests that GDP worsens environmental quality in the studied nations. This is not surprising because GDP promotes economic activities like industrialization, construction that are heavily reliant on the use of energies that are damaging to ecological sustainability. Also, the backbone of most countries in Africa is agriculture. However, large-scale agriculture activities undertaken in the regions are driven by equipment, machineries, and inputs that are linked to the utilization of polluting fuels like fossil and coal among others, thereby escalating ecological damage via pollutant emissions. Additionally, most economies in the regions depend on natural resources to advance their economic progress. However, over-exploitation of resources to boost economic growth could surge the rate of pollution, consequently damaging environmental quality. The damaging effect of GDP on environmental quality supports the study of Donkor et al. (2022) and Abdul-Mumuni et al. (2022), but varies from that of Ntarmah et al. (2021) for Central Africa.
Moreover, urbanization has a significantly positive effect on CE in the aggregate panel, by significantly negative influence on nations in the Eastern region. However, the variable trivially predicts CE in the Northern and Southern regions of Africa. The coefficient in the aggregate panel suggests that urbanization degrades ecological quality in the regions as a whole. This is not surprising because urbanization leads to expansion in infrastructure and other economic advancement activities. However, these activities are connected to the consumption of polluting fuels that end up degrading the environment. Also, as cities are urbanized, the utilization of items or products like automobiles, air-conditioners, refrigerators, and power plants among others also surge. This surges the rate of CE, thereby worsening environmental quality. The detrimental effect of urbanization on ecological sustainability aligns the studies of Hussain et al. (2022) and Erdoğan et al. (2022) but deviates from that of Ali et al. (2019).
The negative connection between urbanization and CE in the Eastern region means, countries in the region have established regulations that promote sustainable urbanization activities in the region. Besides, individuals in urbanized centers in the region have embraced ecologically friendly lifestyles. This has minimized the rate of pollution in the region, consequently, advancing environmental safety. This finding aligns the study of McGee and York (2018), but conflicts that of Sadorsky, (2014). The CCEMG estimates are displayed in Figure 2.
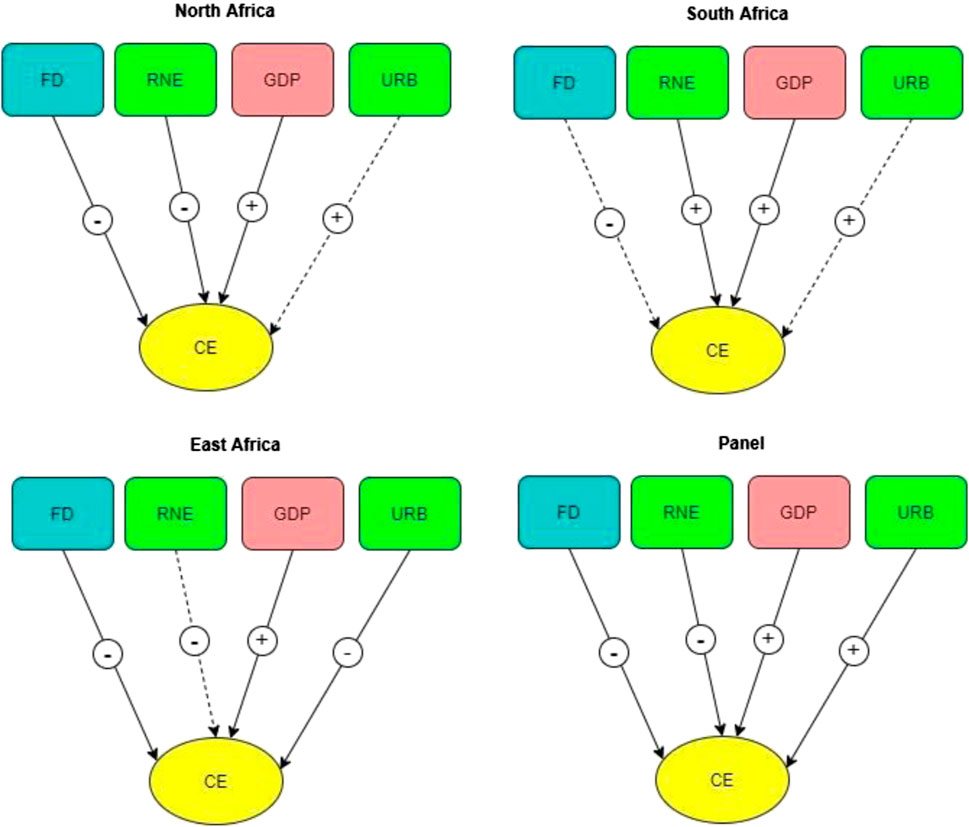
FIGURE 2. CCEMG estimation results. Note: (→) represents significant effect on CE while (⇢) symbolizes insignificant effect on CE. Also, (+) denote positive influence on CE while (−) represents negative influence on CE.
To check robustness of the CCEMG results, estimates from the DCCEMG technique are also explored. Based on the results displayed in Table 9, FD has a significantly negative effect on CE in the Northern region aligning the studies of Tao et al. (2023) and Xuezhou et al. (2022), but materially positive influence on CE in the Eastern region and the aggregate panel collaborating the investigations of Yang et al. (2023) and Ntarmah et al. (2021, 2022). Also, development in the financial sector has no material association with CE in the Southern region, which is consistent with the study of Ren et al. (2023). This means, FD improves environmental quality in the Northern region of Africa, but harms it in the Eastern and the entire panel. Besides, FD trivially impact ecological quality in the Sothern region of Africa. Also, RE advances environmental sustainability in the aggregate panel and the Northern region supporting the investigation of Jinapor et al. (2023), but worsens ecological safety in the Southern region contrasting the exploration of Sun et al. (2022). Besides, clean energy utilization has no substantial effect on environmental quality in the Eastern region of Africa. This collaborates the study of Gyimah et al. (2023). Moreover, GDP improves ecological safety in Southern and Eastern regions contrasting the study of Ronaghi and Scorsone (2023), but harms ecological sustainability in the aggregate panel and the Northern region aligning the investigation of (Abid et al., 2023). Finally, urbanization has immaterial effect on environmental quality in the Norther and Southern regions contrasting the study of conflicting the studies of Hussain et al. (2022) and Ahmed et al. (2019). However, urbanization worsens ecological safety in the Eastern region and the entire panel collaborating the study of (Wang et al., 2021). Summarily, some of estimates under the DCCEMG technique are consistent to some under the CCEMG technique in terms of sign, while others are not. These variations were expected because the two estimators are not the same, though they are all mean group estimators. For instance, the DCCEMG technique is a dynamic estimator that includes into its model the lagged response variable as an additional regressor, whilst the CCEMG estimator does not. Figure 3.
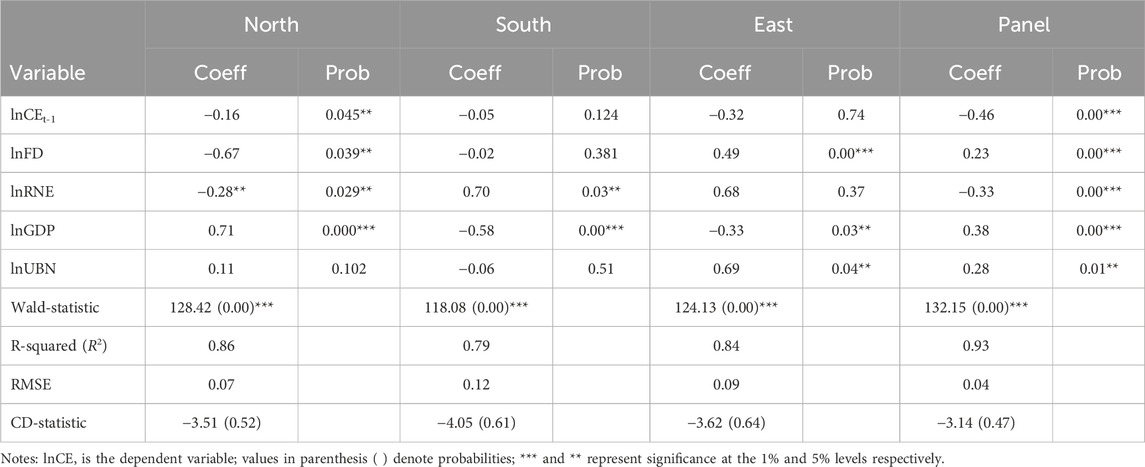
TABLE 9. DCCEMG estimation results.
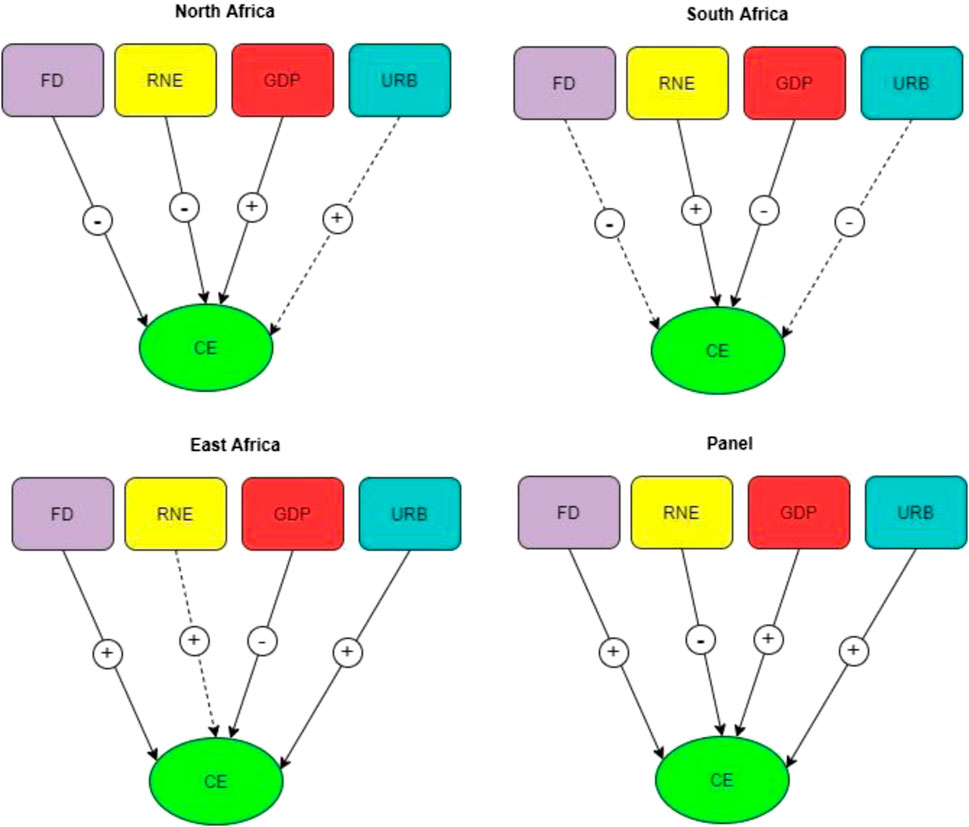
FIGURE 3. DCCEMG estimation results. Note: (→) represents significant effect on CE while (⇢) symbolizes insignificant effect on CE. Also, (+) denote positive influence on CE while (−) represents negative influence on CE.
The CCEMG and DCCEMG can only unearth the long-run equilibrium relationships between CE, FD, RNE, GDP, and URB but not the causalities between the variables. Hence the Dumitrescu and Hurlin (2012) causality test is used to analyze the causations amidst the series. Based on the results displayed in Table 10, there is a unidirectional causality between FD and CE, RNE and CE, and GDP and CE in Northern economies of Africa. The outcome signifies that a fall or rise in FD, RNE, and GDP caused a decline or upswing in CE. This suggests that developing banking strategies to boost growth rate, engaging in renewable resource usage, and building up a developmental project through entrepreneur, industrialization, and community development have a higher tendency to emit harmful gases like carbon into the atmosphere (Donkor et al., 2022; Musah et al., 2022).
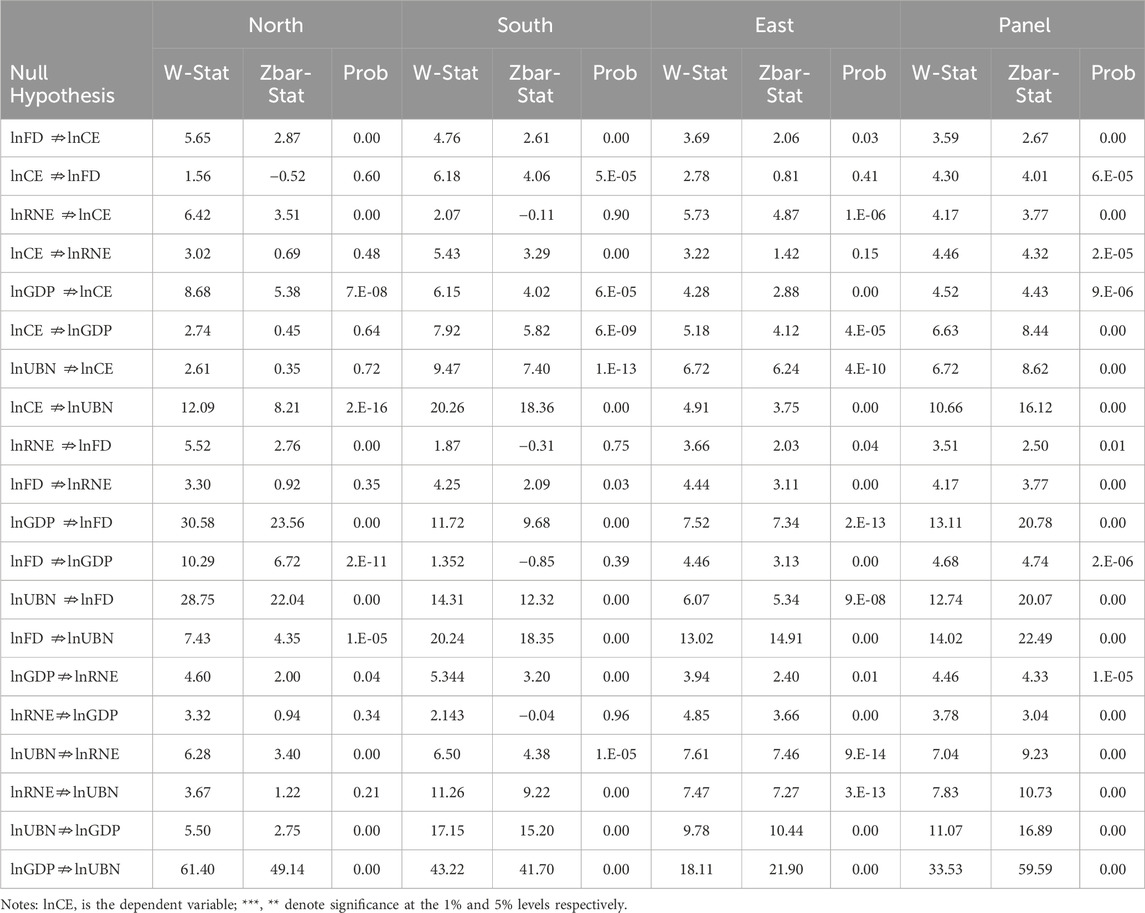
TABLE 10. Dumitrescu-Hurlin panel causality test results.
Moreover, the Southern economies reports a bidirectional causality between FD and CE, GDP and CE, URB and CE (Adewuyi and Awodumi, 2017; Iheonu et al., 2021; Xuezhou et al., 2022). Also, unidirectional causality between CE and RNE (Khoshnevis Yazdi and Ghorchi Beygi, 2018) is also unveiled. According to this finding, a rise or decline in FD, GDP, and URB leads to a rise or fall in CE. Finally, the results from the Eastern republics show a unidirectional causality between FD, RNE, and CE, with causality running from FD and RNE to CE. Besides, there is a bidirectional causation between GDP and CE and URB and CE (Wang and Dong, 2019). The outcome suggests that the Southern and Eastern economies stand better chances of growing their banking industries, infrastructure, education, transportation, housing, and URB-related businesses, which could help stir up the economic activities in these countries. Still, stakeholders should focus most of their policies on the green environment since these outcomes have the propensity to impact society positively or negatively. Additionally, there is a bidirectional causal relationship between URB and RNE in the Southern, Eastern, and entire panels. According to these results, a rise or fall in URB causes an upswing or decline in REC, and vice versa. The conclusion is not shocking given that more people in these regions reside in metropolitan areas, leading to higher usage of non-renewable energies.
Furthermore, bidirectional causal association between GDP and RNE is disclosed in all the panels. The result points out that an escalation or fall in GDP leads to an upsurge or decline in RNE and vice visa. The finding implies, more RNE is used as the economies of these countries expand. Therefore, a decline in the economic activities in the countries may make RNE less effective. Likewise, the discoveries show a bidirectional relationship between GDP and FD, implying that well-structured banking policies help to boost business activities in the nations. As such, there is a spillover effect on nations economic viability. From a boarder perspective, most African countries stand a better chance to catch up with the developed countries if they carefully adopt green systems put in place to mitigate harmful gases.
This study explores the association between financial development, renewable energy, urbanization, economic growth and carbon emissions in selected economies from North, South and East Africa from 1990 to 2019. From the findings, the panels are heterogeneous and cross-sectionally correlated. Also, the variables are first differenced stationary and cointegrated in the long-run. On the regression estimates via the CCEMG technique, financial development improves the environment in all the regions. Also, renewable energy promotes ecological safety in the Northern, Eastern and the entire panel, but degrades it in the Southern panel. Besides, economic growth degrades the environment in all the regions, however, urbanization improves it in the Eastern region, but harms it in the entire panel. Some estimates of the DCCEMG technique support the above disclosures whilst others are not. Various causal relations are unveiled.
It can be inferred from above findings that financial sector development and renewable energy consumption improve environmental sustainability in Africa. However, urbanization and economic growth worsen ecological quality in the continent. Therefore, the rightful allocation of financial resources to ecologically benign energy sources and projects without sacrificing economic progress would be gainful to the nation. The government should also formulate stringent regulations to compel financial institutions to lend funding for environmentally friendly projects and production processes across the country. Moreover, heavy taxation on the services of financial institutions that indulge in ecologically-polluting practices would impel them to transition to practices that would promote environmental safety. Top economies usually overlook ecological goals in favor of resources and activities that boost financial and economic goals. This attitude should not be entertained by nations in the regions, if they want to attain their carbon neutrality agenda.
Additionally, authorities should ensure that energies used to power the regions’ economic activities are from green sources. Since economic advancement activities are mostly driven by establishments, the adoption of clean energies by these establishments could play a material role in the emission mitigation goal of the nation. The entities should not only adopt clean energies, but they should also embrace green and energy efficient technologies in their operations. Thus, government can balance economic growth with sustainability by ensuring the adoption of renewable energies, technological innovations, energy efficiency and other ecologically friendly practices in the economic activities of the nations. Besides, subsidies, such as tax cuts and price controls should be considered for sectors that specialize in the manufacturing and assembling of renewable energy sources. This will help to boost production, and subsequently, economic growth. Moreover, institutional frameworks that enhance ecological sustainability should be strengthened because nations in the North, South and East Africa are still developing.
Besides, nations in the regions should prioritize the idea of green and sustainable urbanization. The governments should promote the sustainable transformation of urban production and consumption patterns, as it restructures policies to make urbanization more sustainable. Besides, the nations should encourage green transportation in urban areas and should support green housing efforts to help drive their eco-urbanization agenda. Also, authorities should endeavor to enhance technical developments in food and resource production in order to lessen humanity’s over-dependence on the natural environment for survival. Moreover, the governments should provide rural communities with the bare necessities to help reduce rural-urban migration in the country. Additionally, developing technologies that are ecologically harmless is crucial for minimizing the country’s negative environmental effects of urbanization.
Though the study achieved its aim, there were still some inherent limitations. Notable amongst them was data limitations. The lack of available data restricted the study to only 27 nations in Africa. Therefore, in future when data becomes available for more nations, comparative studies could be conducted to authenticate our study’s outcomes. Also, the study employed the CCEMG and the DCCEMG econometric techniques to estimate the elastic effects of the regressors on the regressand. The results should therefore be interpreted with caution, because if other econometric techniques were to be engaged the findings might be different. The study was also confined to only some selected economies in Africa. The results can therefore not be generalized for all nations in Africa and the world at large. Frameworks like IPAT, EKC, and STIRPAT among others, have been used to model the effect of macroeconomic indicators on environmental pollution. It is therefore suggested that future explorations on our studied topic should consider such frameworks in their analysis. Also, because the regression techniques adopted to explore the elasticities of the regressors cannot estimate the parameters at the various levels of ecological pollution, we suggest that future studies should employ the panel quantile regression technique, because it estimates the coefficients of predictors at various quantiles. Moreover, technological innovation has a major effect on carbon emissions, finance, and economic growth in Africa. Future researchers should therefore factor the variable in their investigations. Finally, a study on the moderating effect of renewable energy in the link between financial development, economic growth, urbanization and environmental quality in Africa could help advance the emission mitigation agenda of the continent. Based on the above, the key questions raised to guide future research in this area are; 1) what other econometric techniques can be used to study the determinants of environmental quality in Africa? 2) what framework can be adopted to model the effect of macroeconomic indicators on environmental pollution in Africa? 3) what other factors can help to curb the rate of carbon emissions in Africa?
The original contributions presented in the study are included in the article/Supplementary material, further inquiries can be directed to the corresponding authors.
YK: Supervision, Writing–original draft. MD: Conceptualization, Writing–original draft. CJ: Data curation, Writing–review and editing. MM: Formal Analysis, Writing–review and editing. JN: Methodology, Writing–review and editing.
The author(s) declare financial support was received for the research, authorship, and/or publication of this article. This work was funded by the National Natural Science Foundation of China with Grant No: (71973054).
The authors declare that the research was conducted in the absence of any commercial or financial relationships that could be construed as a potential conflict of interest.
All claims expressed in this article are solely those of the authors and do not necessarily represent those of their affiliated organizations, or those of the publisher, the editors and the reviewers. Any product that may be evaluated in this article, or claim that may be made by its manufacturer, is not guaranteed or endorsed by the publisher.
CE, Carbon Emission; URB, Urbanization; FD, Financial Development; RNE, Renewable Energy; GDP, Gross Domestic Product; WDI, World Development Indicators; CD, Cross-sectional Dependence; RMSE, Root Mean Square Error; CCEMG, Common Correlated Effects Mean Group; DCCEMG, Dynamic Common Correlated Effects Mean Group; GHG, Greenhouse Gas; EQ, Environmental Quality; EF, Ecological Footprints; SSA, Sub-Saharan Africa; CADF, cross-sectionally augmented ADF; CIPS, cross-sectionally augmented Im, Pesaran and Shin; IPCC, Intergovernmental Panel on Climate Change; UNPD, United Nations Development Programme.
Abdul-Mumuni, A., Mensah, B. D., and Amankwa Fosu, R. (2022). Asymmetric effect of renewable energy consumption and economic growth on environmental degradation in sub-Saharan Africa. Int. J. Energy Sect. Manag. 17, 1013–1033. doi:10.1108/IJESM-07-2022-0009
Abid, L., Kacem, S., and Saadaoui, H. (2023). The impacts of economic growth, corruption, energy consumption and trade openness upon CO2 emissions: West African countries case. Arab Gulf J. Sci. Res. 2023, 5. doi:10.1108/AGJSR-01-2023-0005
Adams, S., and Klobodu, E. K. M. (2018). Financial development and environmental degradation: does political regime matter? J. Clean. Prod. 197, 1472–1479. doi:10.1016/j.jclepro.2018.06.252
Adewuyi, A. O., and Awodumi, O. B. (2017). Biomass energy consumption, economic growth and carbon emissions: fresh evidence from West Africa using a simultaneous equation model. Energy 119, 453–471. doi:10.1016/j.energy.2016.12.059
Ahmed, Z., Wang, Z., and Ali, S. (2019). Investigating the non-linear relationship between urbanization and CO2 emissions: an empirical analysis. Air Qual. Atmos. Health 12 (8), 945–953. doi:10.1007/s11869-019-00711-x
Ali, R., Bakhsh, K., and Yasin, M. A. (2019). Impact of urbanization on CO2 emissions in emerging economy: evidence from Pakistan. Sust. Cities Soc. 48, 101553. doi:10.1016/j.scs.2019.101553
Aljadani, A., Toumi, H., and Hsini, M. (2023). Exploring the interactive effects of environmental quality and financial development in top ten remittance-receiving countries: do technological effect matter? Environ. Sci. Pollut. Res. 30 (19), 56930–56945. doi:10.1007/s11356-023-26256-2
Ansari, M. A., and Khan, N. A. (2021). Decomposing the trade-environment nexus for high income, upper and lower middle income countries: what do the composition, scale, and technique effect indicate? Ecol. Indic. 121, 107122. doi:10.1016/j.ecolind.2020.107122
Anwar, A., Sinha, A., Sharif, A., Siddique, M., Irshad, S., Anwar, W., et al. (2022). The nexus between urbanization, renewable energy consumption, financial development, and CO2 emissions: evidence from selected Asian countries. Environ. Dev. Sustain. 24 (5), 6556–6576. doi:10.1007/s10668-021-01716-2
Apergis, N., Ben Jebli, M., and Ben Youssef, S. (2018). Does renewable energy consumption and health expenditures decrease carbon dioxide emissions? Evidence for sub-Saharan Africa countries. Renew. Energy 127, 1011–1016. doi:10.1016/j.renene.2018.05.043
Arouri, M., Youssef, A. B., M’Henni, H., and Rault, C. (2012). Empirical analysis of the EKC hypothesis for sulfur dioxide emissions in selected Middle East and North African countries. J. Energy Dev. 37 (1), 207–226. Available at: https://www.jstor.org/stable/24812737 (Accessed October 20, 2023).
Bhattacharya, M., Paramati, S. R., Ozturk, I., and Bhattacharya, S. (2016). The effect of renewable energy consumption on economic growth: evidence from top 38 countries. Appl. Energy 162, 733–741. doi:10.1016/j.apenergy.2015.10.104
Breitung, J., and Das, S. (2005). Panel unit root tests under cross-sectional dependence. Stat. Neerl. 59 (4), 414–433. doi:10.1111/j.1467-9574.2005.00299.x
Breusch, T., and Pagan, A. (1980). The Lagrange multiplier test and its applications to model specification in econometrics. Rev. Econ. Stud. 47, 239–254. doi:10.2307/2297111
Chen, C., Pinar, M., and Stengos, T. (2022). Renewable energy and CO2 emissions: new evidence with the panel threshold model. Renew. Energy 194, 117–128. doi:10.1016/j.renene.2022.05.095
Chen, Y., Wang, Z. Z. Z., and Zhong, Z. (2019). CO2 emissions, economic growth, renewable and non-renewable energy production and foreign trade in China. Renew. Energy 131, 208–216. doi:10.1016/j.renene.2018.07.047
Chudik, A., and Pesaran, M. H. (2015). Common correlated effects estimation of heterogeneous dynamic panel data models with weakly exogenous regressors. J. Econ. 188 (2), 393–420. doi:10.1016/j.jeconom.2015.03.007
Destek, M. A., and Sarkodie, S. A. (2019). Investigation of environmental Kuznets curve for ecological footprint: the role of energy and financial development. Sci. Total Environ. 650, 2483–2489. doi:10.1016/j.scitotenv.2018.10.017
Donkor, M., Kong, Y., Manu, E. K., Ntarmah, A. H., and Appiah-Twum, F. (2022). Economic growth and environmental quality: analysis of government expenditure and the causal effect. Int. J. Environ. Res. Public Health 19 (17), 10629. doi:10.3390/ijerph191710629
Dumitrescu, E. I., and Hurlin, C. (2012). Testing for Granger non-causality in heterogeneous panels. Econ. Model 29, 1450–1460. doi:10.1016/j.econmod.2012.02.014
Ehigiamusoe, K. U., and Dogan, E. (2022). The role of interaction effect between renewable energy consumption and real income in carbon emissions: evidence from low-income countries. Renew. Sustain. Energy Rev. 154, 111883. doi:10.1016/j.rser.2021.111883
Erdoğan, S., Onifade, S. T., Altuntaş, M., and Bekun, F. V. (2022). Synthesizing urbanization and carbon emissions in Africa: how viable is environmental sustainability amid the quest for economic growth in a globalized world? Environ. Sci. Pollut. Res. 29 (16), 24348–24361. doi:10.1007/s11356-022-18829-4
Espoir, D. K., Sunge, R., and Bannor, F. (2021). Co2 emissions and economic development in Africa: evidence from A dynamic spatial panel model. Kiel, Hamburg: ZBW - Leibniz Information Centre for Economics.
Fuinhas, J. A., Marques, A. C., and Koengkan, M. (2017). Are renewable energy policies upsetting carbon dioxide emissions? The case of Latin America countries. Environ. Sci. Pollut. Res. 24 (17), 15044–15054. doi:10.1007/s11356-017-9109-z
Gren, Å., Colding, J., Berghauser-Pont, M., and Marcus, L. (2019). How smart is smart growth? Examining the environmental validation behind city compaction. Ambio 48 (6), 580–589. doi:10.1007/s13280-018-1087-y
Gyimah, J., Hayford, I. S., Nwigwe, U. A., and Opoku, E. O. (2023). The role of energy and economic growth towards sustainable environment through carbon emissions mitigation. PLOS Clim. 2 (3), e0000116. doi:10.1371/journal.pclm.0000116
Haibo, C., and Manu, E. K. (2022). The impact of banks’ financial performance on environmental performance in Africa. Environ. Sci. Pollut. Res. 29, 49214–49233. doi:10.1007/s11356-022-19401-w
Hanif, I. (2018). Impact of economic growth, nonrenewable and renewable energy consumption, and urbanization on carbon emissions in Sub-Saharan Africa. Environ. Sci. Pollut. Res. 25 (15), 15057–15067. doi:10.1007/s11356-018-1753-4
Hashem Pesaran, M., and Yamagata, T. (2008). Testing slope homogeneity in large panels. J. Econ. 142 (1), 50–93. doi:10.1016/j.jeconom.2007.05.010
Hassan, M. A., Galal, A., Al-Ghussain, L., Sayed, M., Abubaker, A. M., Darwish Ahmad, A., et al. (2023). Internally shielded receivers for parabolic trough solar concentrators operating with supercritical carbon dioxide: analytical assessment. Energy Convers. Manag. 280, 116789. doi:10.1016/j.enconman.2023.116789
Hussain, M. N., Li, Z., and Sattar, A. (2022). Effects of urbanization and nonrenewable energy on carbon emission in Africa. Environ. Sci. Pollut. Res. 29 (17), 25078–25092. doi:10.1007/s11356-021-17738-2
Iheonu, C. O., Anyanwu, O. C., Odo, O. K., and Nathaniel, S. P. (2021). Does economic growth, international trade, and urbanization uphold environmental sustainability in sub-Saharan Africa? Insights from quantile and causality procedures. Environ. Sci. Pollut. Res. 28, 28222–28233. doi:10.1007/s11356-021-12539-z
Inglesi-Lotz, R., and Dogan, E. (2018). The role of renewable versus non-renewable energy to the level of CO2 emissions a panel analysis of sub- Saharan Africa’s Βig 10 electricity generators. Renew. Energy 123, 36–43. doi:10.1016/j.renene.2018.02.041
IPCC (2014). Climate change: synthesis Report. Geneva, Switzerland: Intergovernmental Panel on Climate Change, 151.
Jinapor, J. A., Suleman, S., and Cromwell, R. S. (2023). Energy consumption and environmental quality in Africa: does energy efficiency make any difference? Sustainability 15 (3), 2375. doi:10.3390/su15032375
Ju, S., Andriamahery, A., Qamruzzaman, M., and Kor, S. (2023). Effects of financial development, FDI and good governance on environmental degradation in the Arab nation: dose technological innovation matters? Front. Environ. Sci. 11. doi:10.3389/fenvs.2023.1094976
Kazemzadeh, E., Fuinhas, J. A., Koengkan, M., and Shadmehri, M. T. A. (2023b). Relationship between the share of renewable electricity consumption, economic complexity, financial development, and oil prices: a two-step club convergence and PVAR model approach. Int. Econ. 173, 260–275. doi:10.1016/j.inteco.2022.12.001
Kazemzadeh, E., Fuinhas, J. A., Salehnia, N., Koengkan, M., and Silva, N. (2023a). Exploring necessary and sufficient conditions for carbon emission intensity: a comparative analysis. Environ. Sci. Pollut. Res. 30 (43), 97319–97338. doi:10.1007/s11356-023-29260-8
Khoshnevis Yazdi, S., and Ghorchi Beygi, E. (2018). The dynamic impact of renewable energy consumption and financial development on CO 2 emissions: for selected African countries. Energy Sources, Part B Econ. Plan. Policy 13 (1), 13–20. doi:10.1080/15567249.2017.1377319
Koengkan, M., and Fuinhas, J. A. (2022). “Does the energy transition process decrease the environmental degradation in Latin American and caribbean countries?,” in Globalisation and energy transition in Latin America and the caribbean (Cham: Springer International Publishing), 199–244. doi:10.1007/978-3-031-13885-0_8
Koengkan, M., Fuinhas, J. A., and Vieira, I. (2023). The asymmetric impact of energy’s paradigm transition on environmental degradation: a macroeconomic evidence from Latin American and the caribbean countries. J. Knowl. Econ. 2023, 1189. doi:10.1007/s13132-023-01189-w
Kong, Y., Donkor, M., Musah, M., Nkyi, J. A., and Ampong, G. O. A. (2023). Capital structure and corporates financial sustainability: evidence from listed non-financial entities in Ghana. Sustainability 15 (5), 4211. doi:10.3390/su15054211
Li, K., Hu, E., Xu, C., Musah, M., Kong, Y., Mensah, I. A., et al. (2020). A heterogeneous analysis of the nexus be-tween energy consumption, economic growth and carbon emissions: evidence from the Group of Twenty (G20) countries. Energy Exp. Exploit. 39, 815–837. doi:10.1177/0144598720980198
McGee, J. A., and York, R. (2018). Asymmetric relationship of urbanization and CO2 emissions in less developed countries. PLOS ONE 13 (12), e0208388. doi:10.1371/journal.pone.0208388
McGranahan, G., Jacobi, P., and Songsore, J. (2010). The citizens at risk: from urban sanitation to sustainable cities. UK: Routledge.
Mirziyoyeva, Z., and Salahodjaev, R. (2023). Renewable energy, GDP and CO2 emissions in high-globalized countries. Front. Energy Res. 11. doi:10.3389/fenrg.2023.1123269
Murshed, M., Khan, S., and Rahman, AKMA (2022). Roadmap for achieving energy sustainability in Sub-Saharan Africa: the mediating role of energy use efficiency. Energy Rep. 8, 4535–4552. doi:10.1016/j.egyr.2022.03.138
Musah, M. (2022). Financial inclusion and environmental sustainability in Ghana: application of the dynamic ARDL estimator. Environ. Sci. Pollut. Res. 29 (40), 60885–60907. doi:10.1007/s11356-022-19994-2
Musah, M., Gyamfi, B. A., Kwakwa, P. A., and Agozie, D. Q. (2023). Realizing the 2050 Paris climate agreement in West Africa: the role of financial inclusion and green investments. J. Environ. Manag. 340, 117911. doi:10.1016/j.jenvman.2023.117911
Musah, M., Kong, Y., Mensah, I. A., Li, K., Vo, X. V., Bawuah, J., et al. (2021). Trade openness and CO2 emanations: a heterogeneous analysis on the developing eight (D8) countries. Environ. Sci. Pollut. Res. 28 (32), 44200–44215. doi:10.1007/s11356-021-13816-7
Musah, M., Owusu-Akomeah, M., Nyeadi, J. D., Alfred, M., and Mensah, I. A. (2022). Financial development and environmental sustainability in West Africa: evidence from heterogeneous and cross-sectionally correlated models. Environ. Sci. Pollut. Res. 29 (8), 12313–12335. doi:10.1007/s11356-021-16512-8
Nathaniel, S. P., and Adeleye, N. (2021). Environmental preservation amidst carbon emissions, energy consumption, and urbanization in selected african countries: implication for sustainability. J. Clean. Prod. 285, 125409. doi:10.1016/j.jclepro.2020.125409
Ntarmah, A. H., Kong, Y., and Manu, E. K. (2021). Investigating the dynamic relationships between credit supply, economic growth, and the environment: empirical evidence of sub-regional economies in Sub-Saharan Africa. Environ. Sci. Pollut. Res. 28 (5), 5786–5808. doi:10.1007/s11356-020-10875-0
Ntarmah, A. H., Kong, Y., Obeng, A. F., and Gyedu, S. (2022). The role of bank financing in economic growth and environmental outcomes of sub-Saharan Africa: evidence from novel quantile regression and panel vector autoregressive models. Environ. Sci. Pollut. Res. 29 (21), 31807–31845. doi:10.1007/s11356-021-17947-9
Ofori-Sasu, D., Abor, J. Y., Agyekum Donkor, G. N., and Otchere, I. (2023). Renewable energy consumption and carbon emissions in developing countries: the role of capital markets. Int. J. Sustain. Energy 42 (1), 1407–1429. doi:10.1080/14786451.2023.2268857
Olabi, A. G., and Abdelkareem, M. A. (2022). Renewable energy and climate change. Renew. Sustain. Energy Rev. 158, 112111. doi:10.1016/j.rser.2022.112111
Pesaran, M. H. (2004). General diagnostic tests for cross-sectional dependence in panels. Empir. Econ. 60, 13–50. doi:10.1007/s00181-020-01875-7
Pesaran, M. H. (2006). Estimation and inference in large heterogeneous panels with a multifactor error structure. Econometrica 74 (4), 967–1012. doi:10.1111/j.1468-0262.2006.00692.x
Pesaran, M. H. (2015). Testing weak cross-sectional dependence in large panels. Econ. Rev. 34, 1089–1117. doi:10.1080/07474938.2014.956623
Phale, K., Li, F., Adjei Mensah, I., Omari-Sasu, A. Y., and Musah, M. (2021). Knowledge-based economy capacity building for developing countries: a panel analysis in southern african development community. Sustainability 13 (5), 2890. doi:10.3390/su13052890
Poumanyvong, P., and Kaneko, S. (2010). Does urbanization lead to less energy use and lower CO2 emissions? A cross-country analysis. Ecol. Econ. 70 (2), 434–444. doi:10.1016/j.ecolecon.2010.09.029
Ren, X., Zhao, M., and Yuan, R. (2023). Influence mechanism of financial development on carbon emissions from multiple perspectives. Sustain. Prod. Consum. 39, 357–372. doi:10.1016/j.spc.2023.05.009
Ronaghi, M., and Scorsone, E. (2023). The impact of COVID-19 outbreak on CO2 emissions in the ten countries with the highest carbon dioxide emissions. J. Environ. Public Health 2023, 1–10. doi:10.1155/2023/4605206
Sadorsky, P. (2014). The effect of urbanization on CO2 emissions in emerging economies. Energy Econ. 41, 147–153. doi:10.1016/j.eneco.2013.11.007
Salahuddin, M., Ali, M. I., Vink, N., and Gow, J. (2019). The effects of urbanization and globalization on CO2 emissions: evidence from the Sub-Saharan Africa (SSA) countries. Environ. Sci. Pollut. Res. 26, 2699–2709. doi:10.1007/s11356-018-3790-4
Sun, Y., Bao, Q., and Taghizadeh-Hesary, F. (2023). Green finance, renewable energy development, and climate change: evidence from regions of China. Humanit. Soc. Sci. Commun. 10 (1), 107. doi:10.1057/s41599-023-01595-0
Sun, Y., Li, H., Andlib, Z., and Genie, M. G. (2022). How do renewable energy and urbanization cause carbon emissions? Evidence from advanced panel estimation techniques. Renew. Energy 185, 996–1005. doi:10.1016/j.renene.2021.12.112
Tackie, E. A., Chen, H., Ahakwa, I., and Atingabili, S. (2022). Exploring the dynamic nexus among economic growth, industrialization, medical technology, and healthcare expenditure: a PMG-ARDL panel data analysis on income-level classification along West African economies. Front. Public Health 10, 903399. doi:10.3389/fpubh.2022.903399
Tao, M., Sheng, M. S., and Wen, L. (2023). How does financial development influence carbon emission intensity in the OECD countries: some insights from the information and communication technology perspective. J. Environ. Manag. 335, 117553. doi:10.1016/j.jenvman.2023.117553
Tenaw, D. (2021). Getting into the details: structural effects of economic growth on environmental pollution in Ethiopia. Heliyon 7 (7), e07688. doi:10.1016/j.heliyon.2021.e07688
Udeagha, M. C., and Breitenbach, M. C. (2023). The role of financial development in climate change mitigation: fresh policy insights from South Africa. Biophysical Econ. Sustain. 8 (1), 1. doi:10.1007/s41247-023-00110-y
Umar, M., Yousaf Raza, M., and Xu, Y. (2023). Determinants of CO2 emissions and economic progress: a case from a developing economy. Heliyon 9 (1), e12303. doi:10.1016/j.heliyon.2022.e12303
UN HABITAT (2018). The state of african cities 2018: the geography of african investment. UN HABITAT, IHS-Erasmus University Rotterdam. Available at: https://unhabitat.org/sites/default/files/download-manager-files/The-State-of-African-Cities.pdf.
UNPD (2019). World urbanization prospect: the 2018 revision. New York: United Nations, Department of Economic and Social Affairs, Population Division.
Wang, J., and Dong, K. (2019). What drives environmental degradation? Evidence from 14 Sub-Saharan African countries. Sci. Total Environ. 656, 165–173. doi:10.1016/j.scitotenv.2018.11.354
Wang, W.-Z., Liu, L.-C., Liao, H., and Wei, Y. M. (2021). Impacts of urbanization on carbon emissions: an empirical analysis from OECD countries. Energy Policy 151, 112171. doi:10.1016/j.enpol.2021.112171
Westerlund, J., and Edgerton, D. L. (2007). A panel bootstrap cointegration test. Econ Lett 97:185–190. Econ. Lett. 97 (3), 185–190. doi:10.1016/j.econlet.2007.03.003
Wu, L., Adebayo, T. S., Yue, X.-G., and Umut, A. (2023). The role of renewable energy consumption and financial development in environmental sustainability: implications for the Nordic Countries. Int. J. Sustain. Dev. World Ecol. 30 (1), 21–36. doi:10.1080/13504509.2022.2115577
Xiong, L., and Qi, S. (2018). Financial development and carbon emissions in Chinese provinces: a spatial panel data analysis. Singap. Econ. Rev. 63 (02), 447–464. doi:10.1142/S0217590817400203
Xuezhou, W., Manu, E. K., and Akowuah, I. N. (2022). Financial development and environmental quality: the role of economic growth among the regional economies of Sub-Saharan Africa. Environ. Sci. Pollut. Res. 29 (16), 23069–23093. doi:10.1007/s11356-021-17271-2
Keywords: financial development, carbon emissions, renewable energy consumption, urbanization, economic growth, selected economies in Africa
Citation: Kong Y, Donkor M, Jin C, Musah M and Nkyi JA (2024) Do financial development, urbanization, economic growth and renewable energy promote the emission mitigation agenda of Africa? Evidence from models that account for cross-sectional dependence and slope heterogeneity. Front. Environ. Sci. 11:1269416. doi: 10.3389/fenvs.2023.1269416
Received: 30 July 2023; Accepted: 30 November 2023;
Published: 11 January 2024.
Edited by:
Fengtao Guang, China University of Geosciences Wuhan, ChinaReviewed by:
Dilawar Khan, Kohat University of Science and Technology, PakistanCopyright © 2024 Kong, Donkor, Jin, Musah and Nkyi. This is an open-access article distributed under the terms of the Creative Commons Attribution License (CC BY). The use, distribution or reproduction in other forums is permitted, provided the original author(s) and the copyright owner(s) are credited and that the original publication in this journal is cited, in accordance with accepted academic practice. No use, distribution or reproduction is permitted which does not comply with these terms.
*Correspondence: Mary Donkor, bWRvbmtvcjM0QGdtYWlsLmNvbQ==; Yusheng Kong, eXNoa29uZ0B1anMuZWR1LmNu
Disclaimer: All claims expressed in this article are solely those of the authors and do not necessarily represent those of their affiliated organizations, or those of the publisher, the editors and the reviewers. Any product that may be evaluated in this article or claim that may be made by its manufacturer is not guaranteed or endorsed by the publisher.
Research integrity at Frontiers
Learn more about the work of our research integrity team to safeguard the quality of each article we publish.