 Peijun Wang
 Ziqi Lin
 Jing Wang
 Yali Yang3
95% of researchers rate our articles as excellent or good
Learn more about the work of our research integrity team to safeguard the quality of each article we publish.
Find out more
ORIGINAL RESEARCH article
Front. Environ. Sci. , 15 November 2023
Sec. Land Use Dynamics
Volume 11 - 2023 | https://doi.org/10.3389/fenvs.2023.1267475
The Huaihai Economic Zone (HEZ) has excellent topographic and climatic conditions and is recognized as one of China’s major grain production areas. Identifying the spatiotemporal evolution patterns of arable land and the driving factors can offer valuable insights for protecting arable land, optimizing land use layout, and developing ecological economics in HEZ. In this paper, we analyze the spatiotemporal evolution patterns using spatial autocorrelation, land use transfer matrix, and kernel density calculations and investigate the driving factors of arable land evolution with Geodetector. The results show the following trends in the distribution of arable land within the HEZ: 1) The kernel density distribution of the arable land in HEZ remained relatively consistent from 2005 to 2020, but the density showed a downward trend over time. 2) The distribution of arable land in HEZ exhibited lower density in the Northeast and higher density in the Southwest, showing growth in the initial stage and subsequent declines in the intermediate and final phases. 3) A significant positive spatial correlation was observed in the distribution of arable land in HEZ. The main local cluster types were the “high-high” and “low-low” clusters, and their distribution characteristics were similar to the kernel density of arable land. 4) The change of arable land in HEZ between 2005 and 2020 was primarily driven by the conversion of land types, with a notable shift towards grassland and construction land 5) The main driving factors affecting the spatial distribution of arable land in HEZ included traffic accessibility, air temperature, precipitation, elevation, and slope. The secondary driving factors were land use and soil type. Over time, population and GDP have also evolved into significant driving factors. 6) The factors were bi-enhance after the interaction. In the future, all cities within HEZ should implement rigorous control measures to limit the expansion of arable land usage. Their primary focus should be on revitalizing existing construction land while strictly upholding the “compensation determines occupation” principle. They should also work to optimize the arrangement of arable land and give increased consideration to the interactive effects of traffic accessibility, population, and GDP to protect arable land in a more focused and effective manner.
Grain production and security are significant strategic concerns tied to economic development, social stability, and national independence, and arable lands are the foundation to ensure national grain security (Wang and Qian, 2019; Gao and Wang, 2020; Su et al., 2020). Considering China’s endowment of arable land resources, the outlook is not promising. The topography of China is characterized by numerous mountainous regions, limited plains, and extensive soil erosion. The arable land predominantly consists of medium-and low-yield fields with a fragmented distribution (Pei et al., 2014). The eastern regions, known for their excellent topographic and climatic conditions, often prioritize economic development, making it challenging to ensure better protection of high-quality arable land. As China experiences social and economic development and continuous population growth, the limited land struggles to meet the demand for construction land, resulting in the inevitable conversion of arable land into construction land. However, the balance of arable land often fails to supplement prime farmland after the requisition of prime farmland, leading to an overall decline in the quality of arable land in China. To this end, the relevant ministries and commissions of the Chinese government issued documents on arable land protection (Ye et al., 2023) and rural revitalization (Liu et al., 2023) in 2017 and 2022, respectively, proposing stringent arable land protection measures and adhering to the red line for arable land and permanent prime farmland. Therefore, identifying the spatiotemporal evolution patterns of regional arable land and detecting the driving factors can provide an essential theoretical basis for achieving a dynamic balance between regional economic development and arable land protection.
The global rate of urbanization has been on the rise as human society has advanced. Scholars worldwide express concerns about changes in arable land as a fundamental resource for grain production, with some focusing more on the ecology of cultivated landscapes in urban areas (Song and Gin, 2002; Song and Gin, 2003). In recent years, some researchers have studied the effects of farming management practices (Gupta et al., 2010) and land type transfer (Gebremedhin et al., 2018; Kazlauskaitė-Jadzevičė et al., 2019; Gebresamuel et al., 2022) on cropland soil properties and vegetation cover from a microscopic perspective to investigate changes in cropland soil quality. The increase in urbanization has brought about significant changes in both the quantity and quality of arable land, leading to growing interest among international scholars in food production security issues. The degradation of arable soils has been investigated at various scales, including regional (Adugna and Abegaz, 2016; Störrle et al., 2016), national (Daedlow et al., 2018), and global (Prăvălie et al., 2021). As non-grain production has advanced, people’s awareness of food security has grown, and research on arable land has become more global and macroscopic in scope. For example, some scholars have studied the spatial and temporal evolution of cropland (Hatna and Bakker, 2011), and others have investigated the driving factors behind cropland changes (Boru et al., 2015; Arowolo and Deng, 2018; Uisso and Tanrivermis, 2021) to examine cropland patterns and causes and provide a foundation for cropland conservation (Haggar et al., 2021). Amidst global warming concerns, countries worldwide are urging carbon emissions reduction, and the study of carbon stock changes during cropland utilization (Desyatkin et al., 2018) is emerging as a new research trend.
In China, there are also numerous research results on arable land, including spatiotemporal distribution and evolution characteristics of arable land (Zhang et al., 2018; Chen et al., 2019b; Zhang and He, 2020; Xie et al., 2021b; Geng et al., 2021), evaluation of the arable land quality and evolution trend (Qin et al., 2020b; Xu et al., 2021), evaluation of arable land function and evolution characteristics (Yang and Tan, 2014; Qin and Wang, 2020a; He et al., 2020; Tang and Zang, 2021), transformation evaluation and evolution of arable land use function (Shi and Li, 2018; Ran et al., 2020; Miao et al., 2021), arable land and national grain security (Shan and Lai, 2011; Liu et al., 2019; Deng et al., 2021) and arable land consolidation (Guan et al., 2020; Wang et al., 2020). To determine the causes of the spatiotemporal evolution of arable land, numerous researchers have examined driving factors, such as the influence factors of the spatiotemporal evolution of arable land in karst mountain areas (Zhang et al., 2020), the factors influencing the abandonment of arable land in major grain-producing regions (Zhou et al., 2021), and the driving factors of spatiotemporal variability of arable land fragmentation in mountainous and hilly areas of eastern Jiangxi province (Chang et al., 2021). In conclusion, while most scholars have analyzed the spatiotemporal evolution patterns of arable land in terms of overall trends, characteristics, and independent factors, they have often overlooked the spatial distribution autocorrelation and the interactive effects of multiple factors on arable land’s spatiotemporal evolution.
HEZ is located at the southern edge of the Huang-Huai-Hai plain, with excellent farming conditions, and is one of the major grain-producing areas in China (Xie et al., 2021a). However, it also faces economic challenges and is considered an economic depression zone. In 2018, the State Council of the People’s Republic of China approved the Development Plan of the Huaihe River Eco-Economic Belt, which clarifies the scope of HEZ and incorporates it into the national development strategy, aiming to promote the coordinated development of each city and the development of ecological economics. This study employs spatial autocorrelation, land use transfer matrix, and kernel density calculations to identify the spatiotemporal evolution patterns of arable land in the Huaihai Economic Zone. Furthermore, it utilizes Geodetector to analyze the driving factors behind these changes. The study aims to support the development of practical arable land protection policies and ensure food security in HEZ. This effort plays a crucial role in establishing a dynamic balance between sustainable economic growth and the preservation of arable land within the region.
The scope of HEZ consists of Xuzhou, Lianyungang, Suqian, Suzhou, Huaibei, Shangqiu, Zaozhuang, Jining, Linyi, and Heze, with an area of 95,481 km2, as shown in Figure 1. HEZ borders Beijing, Tianjin, and Hebei in the north, the Yangtze River Delta in the south, the coastal economic belt in the east, and the Central Plains urban agglomeration in the west, with highly convenient traffic conditions. The topography of the whole region is mainly plain, with a temperate monsoon climate. The average temperature is 9.8–16.1°C, the average frost-free period is 200–220 days, and the annual precipitation is 660–950 mm.
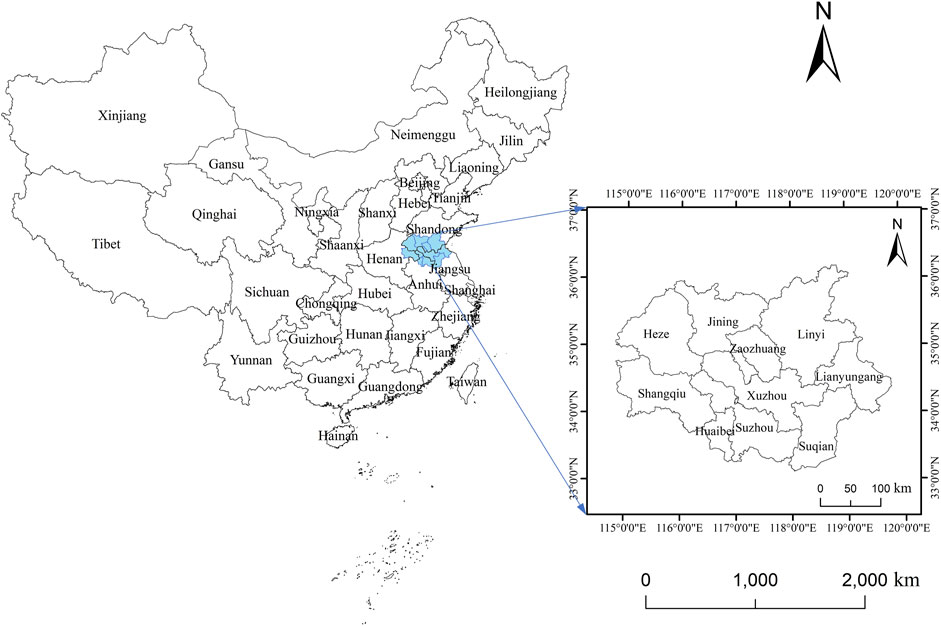
FIGURE 1. Location of HEZ in China.
Remote sensing images of HEZ from 2005 to 2020 were obtained from the Geospatial Data Cloud (http://www.gscloud.cn/). These images are in TIF format with a resolution of 30 m. Specifically, the images in 2005 are based on Landsat4-5TM satellite digital products, those from 2010 on Landsat7 ETM SLC-off satellite products, the 2015 images on Landsat8 OLI/TIRS satellite digital products, and the 2020 images on Landsat8-9 OLI/TIRS C2 L2 products. The ENVI 5.3 software was used to create interest zones for a total of six land use types, namely, cropland, forest land, grassland, construction land, water, and unused land, by combining the location and colors of the real land use types of the HEZ region in Google Maps. Finally, with the support vector machine classification method in ENVI 5.3 software, the land use type maps of 2005, 2010, 2015, and 2020 were obtained, and the Kappa coefficients for remote sensing image classification of the 4 years showed that the overall accuracy ranged from 80% to 90%.
Data on precipitation, temperature, population, GDP, and soil type in HEZ from 2010 to 2020 were sourced from the Resource and Environmental Science and Data Center (RESDC) at the Chinese Academy of Sciences (CAS) (https://www.resdc.cn/). The meteorological data for 2020 were obtained from the National Climate Data Center (ftp://ftp.ncdc.noaa.gov/pub/data/noaa/isd-lite) and were interpolated using the ANUSPLIN interpolation method, similar to the RESDC, CAS. Road data were acquired from OSM (http://download.geofabrik.de/), and their density was estimated as traffic accessibility data using GIS software. Elevation and slope data were sourced from the SRTMDEMUTM 90 m resolution digital elevation data product and the SRTMSLOPE 90 m resolution slope data product in the DEM digital elevation data available on the Geospatial Data Cloud (http://www.gscloud.cn/). All the mentioned data were resampled in GIS to standardize the pixel size to 1,000 m and reclassified to discretize them as detection factor data.
The administrative division data were obtained from the RESDC, CAS (https://www.resdc.cn/).
Kernel density calculation is a statistical method for nonparametric density estimation and is valuable for identifying and analyzing hot and cold zones (Li et al., 2014). In kernel density analysis, points falling within the radius are given different weights according to their distance from the central sample point. The closer they are to the central sample point, the higher their weight and the resulting kernel density value. In the kernel density measurement of arable land, the larger the estimated value of kernel density, the more concentrated the distribution of arable land. In this paper, we transformed the arable land map from 2005 to 2020 into arable land element points using ArcGIS software, then calculated the kernel density of the arable land element points using the Kernel Density tool. Finally, we classified the computed value of arable land kernel density using a five-level classification based on the Natural Breaks method. To better compare the kernel density analysis maps of different years, we graded the calculated kernel density values in 2010, 2015, and 2020 according to the classification threshold of 2005. This allowed us to generate kernel density distribution maps of arable land from 2005 to 2020. The calculation formula, as defined by Li et al. (2014), is as follows:
In the formula, fn represents the estimated value of the kernel density of cultivated land, indicating the number of cultivated land units per square kilometer (plots/km2). n is the total number of cultivated lands, and k denotes the kernel density function. x-xi represents the distance between the calculated cultivated land and the sample cultivated land, while h represents the smoothing parameters for the cultivated land, which are calculated for the kernel density.
The global spatial autocorrelation describes the degree of association and spatial characteristics between the attribute values of each geographical element in a region, which can measure the overall degree of spatial association and the difference between regions (Anselin, 1995; Fotheringham, 2009; Li et al., 2013; Anselin and Rey, 2014). In this paper, we generated a 10 km arable land grid map using ArcGIS and calculated the arable land area proportion for each grid square. In addition, the spatial weight matrix was constructed based on the arable land map of HEZ from 2005 to 2020 using Geoda software. Finally, the arable land area proportion was selected as a variable to calculate the global Moran’s I index, with the formula defined as follows (Anselin, 1995; Zhang et al., 2023):
Where I represents the global Moran’s index, n is the number of study areas, xi and xj are the cultivated land area of the i and j regions, respectively.
Where E(I) and VAR(I) represent the expected value and variance of the global Moran’s I index, respectively. Zscore>+1.96 or Zscore < −1.96 (
There are some differences in the spatial autocorrelation level between different spatial units and adjacent regions in HEZ. Global spatial autocorrelation cannot effectively express the type of arable land agglomeration in HEZ (Ren et al., 2016). Hence, the detailed state of arable land agglomeration is analyzed using the local spatial autocorrelation. The utilization of LISA analysis facilitates researchers in comprehending the spatial patterns of clustering exhibited by high and low values of a variable inside a certain geographical region (Brooks, 2019). In accordance with a comprehensive global spatial autocorrelation analysis, this study generates LISA cluster maps of arable land within HEZ employing the Geoda software. LISA constitutes a visual representation of localized Moran’s I values, primarily depicted as a Moran’s I scatterplot (Anselin and Rey, 2014). In the local Moran’s I scatter plot, the x-axis represents the variable values of each observation (X), and the y-axis represents the summated values of the observation’s neighbors (Y). Z-scores are calculated for these X and Y values, and the origin of the scatter plot is set to a Z-score of zero, which represents the mean value (Brooks, 2019). At the confidence level of
In the formula, Ii represents the local Moran’s index of the i region, and the meaning of the other variables is consistent with that in the global Moran’s index formula.
The land use transfer matrix quantitatively expresses the status and changes of land use types at the beginning and end of the period. They reflect the quantity and flow direction of land use types and can reveal the macroscopic change pattern of land use in the study area (Niu et al., 2021). In this paper, we transform the raster data of land use status in 2005 and 2020 into a land use transfer matrix using ArcGIS software. The mathematical model is as follows (Jin et al., 2022):
Where Sij denotes the land use state at the beginning and end of the study period, m and n are the corresponding land use types in the two periods.
The Geodetector model is a statistical method to detect the spatial differentiation between elements and their driving factors. It encompasses four primary functions: interaction detection, ecological detection, factor detection, and risk zone detection (Wang et al., 2010; Wang and Hu, 2012; Wang and Xu, 2017). Factor detection involves exploring the spatial heterogeneity of attribute Y and assessing the explanatory power of factor X in relation to this variability. Interaction detection identifies synergistic interactions between different risk factors Xs, determining their combined impact on the dependent variable Y. Risk zone detection assesses differences in mean attributes between sub-regions, while ecological detection compares the effects of factors X1 and X2 on the spatial distribution of attribute Y (Wang and Xu, 2017). Based on the natural and socio-economic attributes of arable land, this study selects four socio-economic driving factors (land use type, population, GDP, and traffic accessibility) and five natural driving factors (precipitation, air temperature, elevation, slope, and soil type). In this context, Y represents the spatial distribution of arable land in HEZ for the years 2010, 2015, and 2020, while Xs denote the driving factors influencing this distribution, including land use types, population, GDP, transportation accessibility, precipitation, temperature, elevation, slope, and soil types. We analyzed the driving factors of spatial and temporal differentiation of arable land with the factor interaction and interaction detection functions of the Geodetector model (Wang and Xu, 2017; Bian et al., 2023). The types of interaction between two variables and their interactive impacts are shown in Figure 2 (Wang and Xu, 2017).
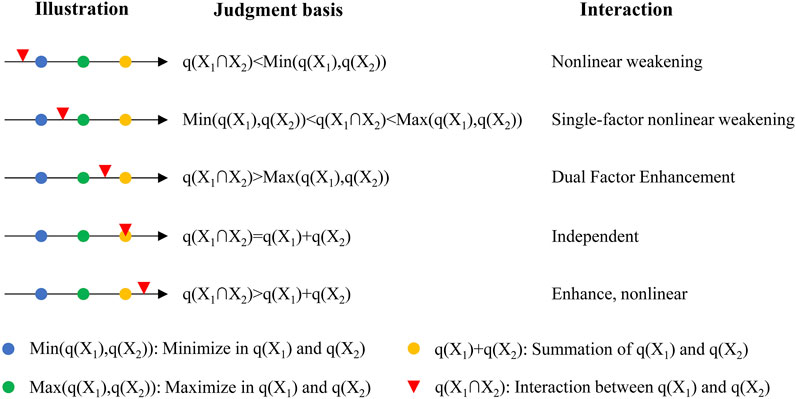
FIGURE 2. Types of interaction between two variables.
This study uses the q value to measure the explanatory power of the factors within the Geodetector model, as expressed in the following formula (Wang and Hu, 2012):
Here, L represents the stratification of the dependent variable Y or influencing factor X, reflecting its classification or partition. Nh stands for the number of units within layer h; and N is the total number of units across the entire study area.
Figure 3 indicates that the spatial distribution of kernel density of arable land in HEZ from 2005 to 2020 was roughly consistent. Arable land with medium and high kernel density covered a wide area, mainly concentrated in Heze, Shangqiu, Huaibei, Suzhou, Xuzhou, the eastern part of Jining, the southern areas of Lianyungang and Linyi, as well as the northern part of Suqian. The distribution area of arable land with high density in 2015 and 2020 was significantly smaller than that in 2005 and 2010. There were only a few low-density areas of arable land, primarily located in the northern part of Linyi, at the junction of Linyi, Zaozhuang, and Jining, and scattered in the urban areas of each city. The maximum values for the kernel density of arable land in 2005, 2010, 2015, and 2020 were 1050.20, 1034.25, 1022.10, and 1050.00 plots/km2, respectively. While there was a rebounded in 2020, there was a general downward trend.
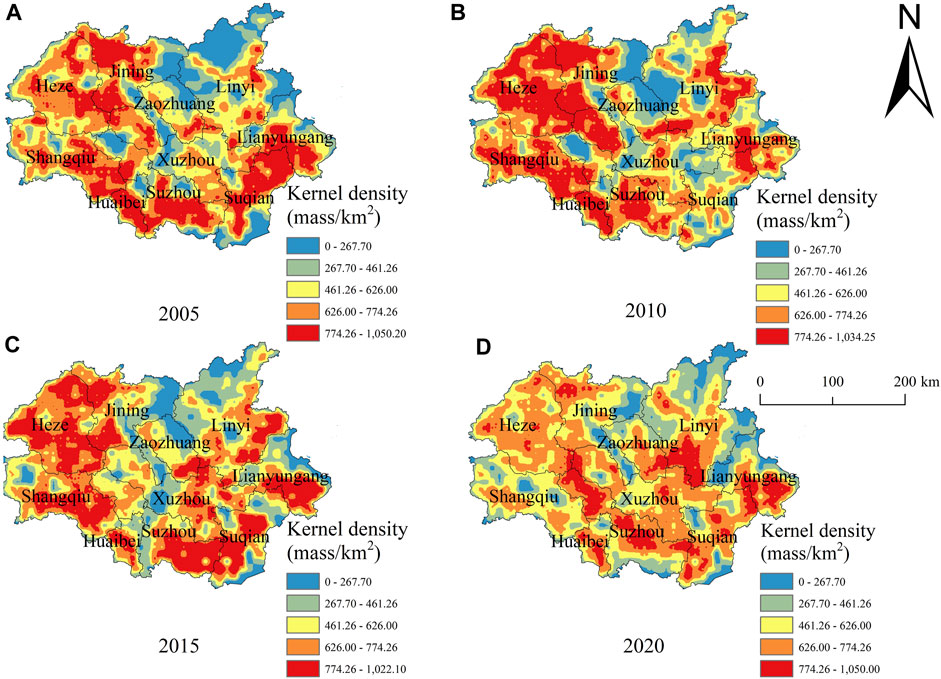
FIGURE 3. Kernel density distribution of arable land in HEZ from 2005 to 2020. (A) 2005; (B) 2010; (C) 2015; (D) 2020.
The distribution of arable land in HEZ from 2005 to 2020 shows a decrease in the northeast and an increase in the southwest (Figure 4). More arable land is found in the northwest (Heze and Jining), southwest (Shangqiu and Huaibei), and southeast (Suzhou and Suqian) of HEZ. In contrast, the northeast of HEZ, including the area north of Linyi and the junction of Linyi, Jining, and Zaozhuang, exhibits less arable land, mirroring the distribution characteristics of arable land kernel density. The total area of arable land in the HZE for 2005, 2010, 2015, and 2020 is 5.10, 5.37, 5.29, and 5.12 million hectares, respectively. The total arable land increases before 2010 and decreases after.
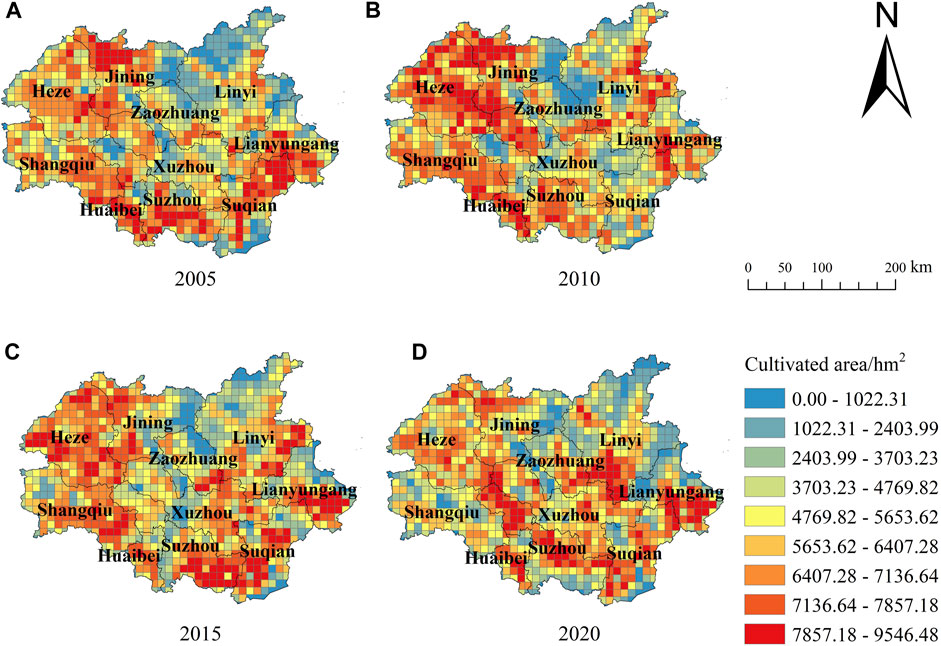
FIGURE 4. Distribution of arable land area in HEZ from 2005 to 2020. (A) 2005; (B) 2010; (C) 2015; (D) 2020.
Very few units of arable land remain unchanged in each period, with more units increasing compared to those decreasing in the initial stage (Figure 5). In comparison, the number of In comparison, the number of units with increased arable land is fewer than those with reduced land in the middle and final phases. Over time, the units with reduced arable land show an increasing trend continuously.
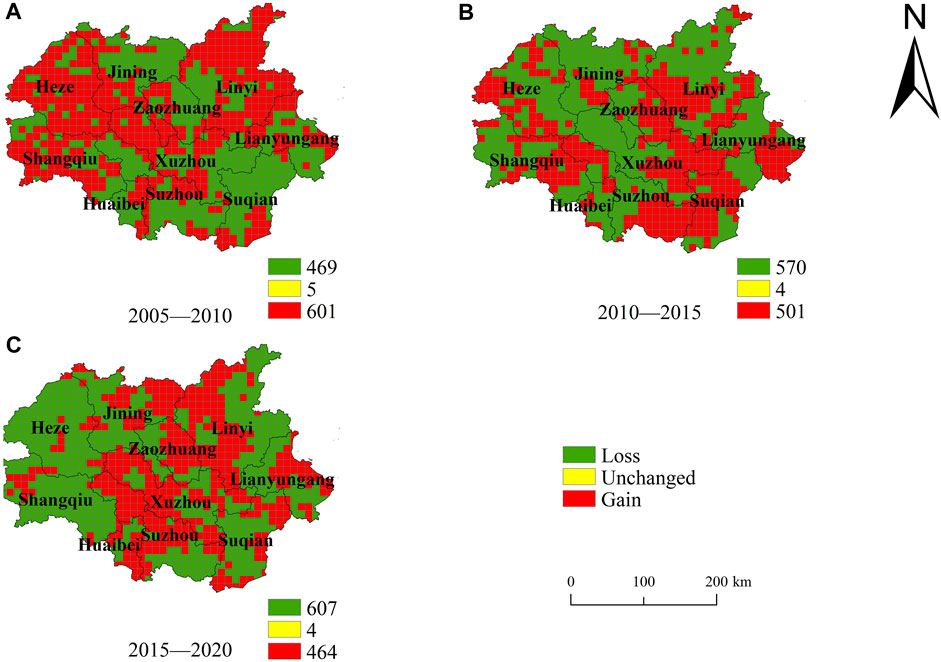
FIGURE 5. Increase and decrease of arable land area in HEZ from 2005 to 2020. (A) 2005–2010; (B) 2010–2015; (C) 2015–2020.
The increase in arable land area initially decreased and then increased over time (Table 1). Arable land increased significantly from 2015 to 2020, while the decrease in arable land area continued to rise and exceeded the increase during the middle and final phases. Except for the growth of arable land in the initial stage, the arable land area in the middle and final phases is in a state of negative growth.
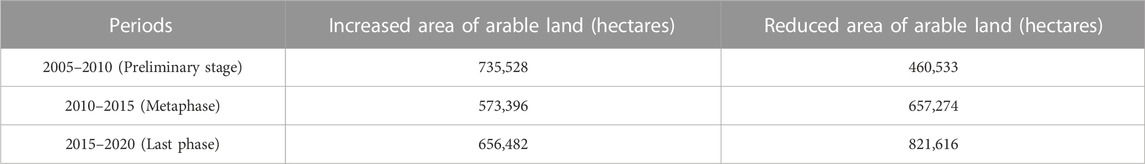
TABLE 1. Increase and decrease of arable land area in HEZ in different periods.
The global Moran’s I index values of HEZ from 2005 to 2020 are significantly greater than 0 (Table 2). The Z-values in 2005, 2010, 2015, and 2020 are 37.6825, 33.7846, 36.3673, and 33.8522, respectively, which are more significant than the threshold value of 1.96 and pass the test of significance level (α = 0.05), indicating that the arable land in HEZ from 2005 to 2020 shows a significant agglomeration distribution. In other words, the regions with a high (low) proportion of arable land have a high (low) ratio in their adjacent areas. The global Moran’s I index values from 2005 to 2020 are 0.6307, 0.5723, 0.5935, and 0.5763, respectively. Overall, the global Moran’s I index’s values are decreasing, indicating that the aggregation of arable land distribution shows a weakening trend.
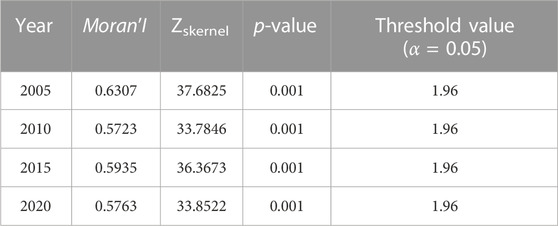
TABLE 2. Global Moran’I index and test of arable land in HEZ from 2005 to 2020.
Figure 6 shows four distribution types of arable land within HEZ on the LISA clustering map.
(1) ‘high-high’ type. These regions have a high proportion of arable land within themselves and their adjacent areas, with minimal spatial distribution differences, indicating an agglomeration distribution. Excluding the regions of insignificant type, this type is the most numerous. From 2005 to 2015, the number of regions of the ‘high-high’ type regions remained stable. In 2020, it significantly decreased, primarily transforming into insignificant regions, with a few becoming ‘low-low’ type regions. From 2005 to 2020, the ‘high-high’ type regions are more prevalent in the western (Shangqiu, Heze, Jining), southern (Huaibei, Suzhou), eastern (Suqian, Lianyungang) parts of HEZ, as well as in northwestern Xuzhou City. The regions of this type tended to shrink toward the central HEZ from 2015 to 2020, with distribution characteristics similar to arable land with high kernel density.
(2) ‘low-low’ type. These regions have a low proportion of arable land within themselves and their adjacent areas, with minimal spatial distribution differences, indicating an agglomeration distribution. The number of ‘low-low’ type regions remained consistent in 2005, 2015, and 2020, except for 2010. From 2005 to 2015, there were more ‘low-low’ type regions in the northeast of HEZ, including the north of Linyi, the junction of Zaozhuang, Jining, and Linyi, the water area, and the urban areas of each city, similar to the spatial distribution of low kernel density regions of arable land. By 2020, regions of this type had reduced, mainly transforming into insignificant regions. Meanwhile, some of the insignificant regions at the junction of Lianyungang and Linyi transformed into the ‘low-low’ type.
(3) The number of ‘low-high’ and ‘high-low’ distribution types of arable land in HEZ is minimal, with no apparent pattern.
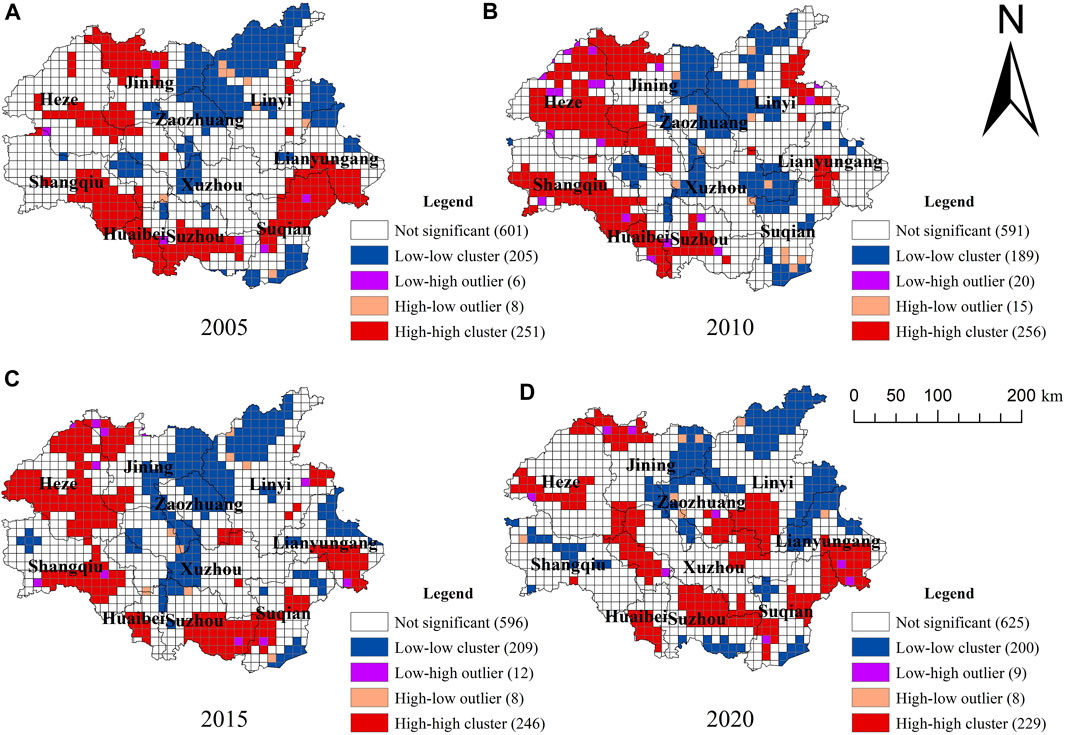
FIGURE 6. LISA clustering map of HEZ from 2005 to 2020. (A) 2005; (B) 2010; (C) 2015; (D) 2020.
According to Table 3 and Figure 7, forest land in HEZ decreased by 1179487.17 ha, and unused land decreased by 19,878.48 ha from 2005 to 2020. In contrast, grassland, construction land, arable land, and water area increased by 611,089.74, 528,634.08, 26,033.94, and 33,607.89 ha, respectively. Regarding arable land, the net increase from the conversion of water area, construction land, grassland, unused land, and forest land to arable land from 2005 to 2020 is −26262.36, −248301.81, −298003.59, 5601.15, and 593,000.55 ha, respectively. Therefore, the primary input land type of arable land in HEZ from 2005 to 2020 is forest land, while the main output land types are grassland and construction land (Figure 7).
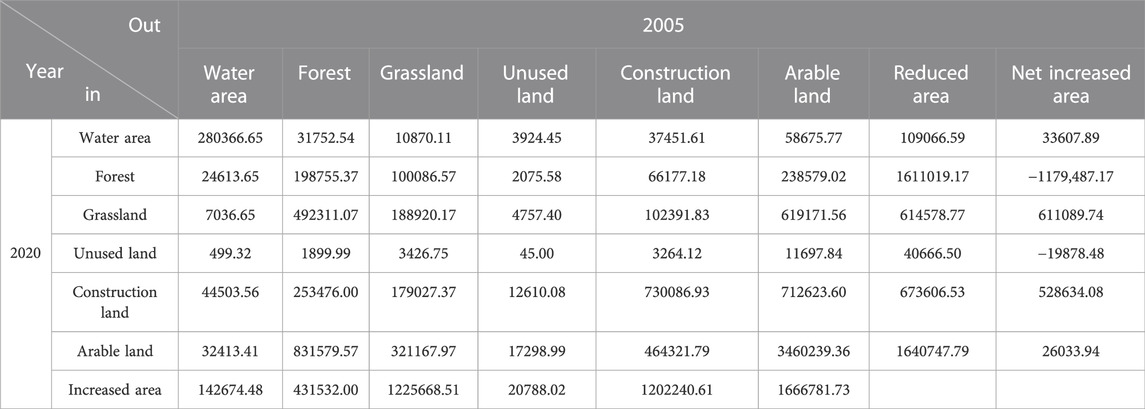
TABLE 3. Land use transfer matrix of HEZ from 2005 to 2020 (unit: hectares).
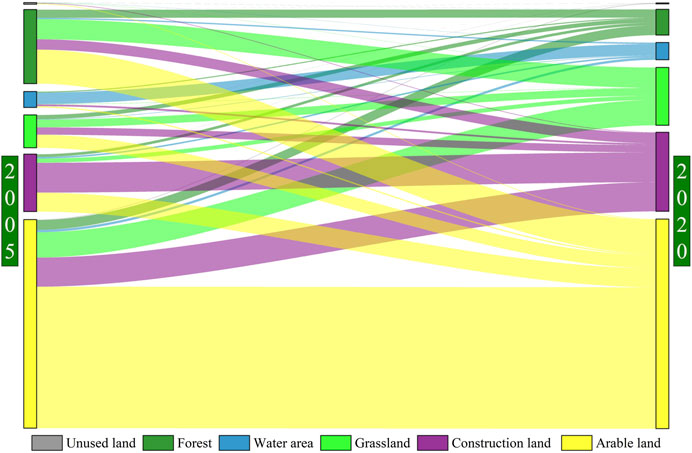
FIGURE 7. Sankey diagram of land use transfer of HEZ from 2005 to 2020.
This study divided the driving factors of the spatial distribution of arable land in HEZ into three levels in 2010 (Figure 8). The most influential factors are elevation, slope, and traffic accessibility, with strengths of 71.4%, 69.4%, and 68.2%, respectively. Precipitation and air temperature have influences of 39.8% and 37.3%, respectively. Population, GDP, and land use type are the factors at the third power level, with strengths of 11.8%, 11.7%, and 10%, respectively.
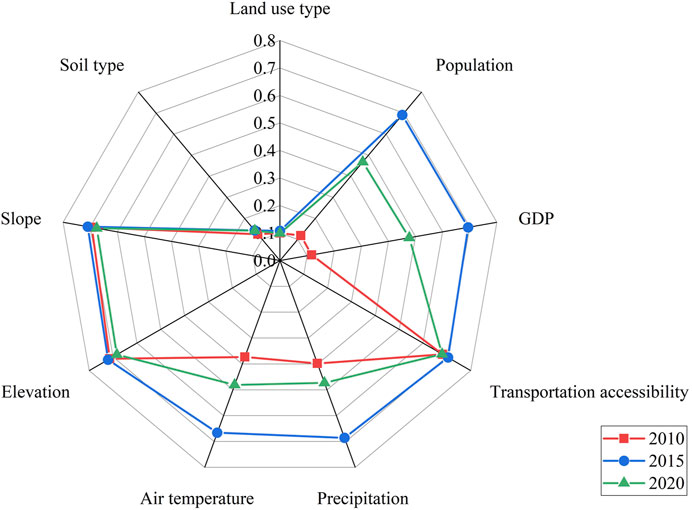
FIGURE 8. Radar chart of driving factor influence.
This study divided the driving factors of arable land distribution in the study area into two levels in 2015 (Figure 8). The first level driving factors are elevation, slope, traffic accessibility, precipitation, air temperature, population, and GDP, with influences of 72.1%, 70.9%, 70.5%, 68.6%, 66.6%, 69.1%, and 69.4%, respectively, followed by soil type and land use type, with influences of 14.3% and 10.8%, respectively.
In 2020, The factors with the most significant influence were elevation, slope, and traffic accessibility, with strengths of 68.4%, 67.6%, and 68%, respectively, followed by air temperature, GDP, precipitation, and population, with influences of 48.1%, 47.7%, 47.3%, and 46.8%, respectively (Figure 8). The factors with the third power level are soil type and land use type, with influences of 14.2% and 9.9%, respectively.
Geodetector offers a significant advantage in identifying influencing factors, enabling the detection of interactions between two factors, analyzing changes in their interactive influence, and determining the type of interaction (Zhao et al., 2018). Here, X1, X2, X3, X4, X5, X6, X7, X8, and X9 represent land use type, soil type, traffic accessibility, precipitation, air temperature, elevation, slope, population, and GDP, respectively.
In 2020 (Figure 9) the interaction between any two factors increased the power to a certain extent. The results in 2010 and 2015 are the same as those in 2020. The interaction effect exceeds the highest value of the individual influencing factor but falls short of the sum of the corresponding factors. Hence, all pairs of factors exhibit a dual-factor enhanced interaction. Among them, interactions between each factor and traffic accessibility, elevation, and slope are the strongest, explaining the spatiotemporal variation of arable land in HEZ with an influence of approximately 0.7. Interactions involving precipitation, temperature, elevation, population, and GDP are relatively weaker, explaining the spatiotemporal variation with an influence of around 0.5. The interactions between land use type and soil type are the least significant, with an explanatory power of less than 0.2.
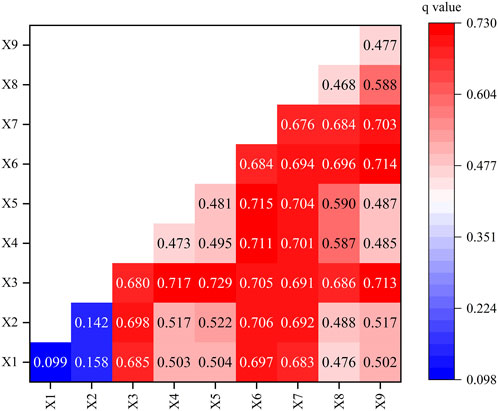
FIGURE 9. Heat map of interactive detection of driving factors of spatiotemporal evolution of cultivated land.
Urban areas in each city are the primary locations with a high kernel density of construction land and a low kernel density of arable land in HEZ. The urban areas of each city are the primary regions characterized by a high kernel density of construction land and a low kernel density of arable land. From 2005 to 2020, the conversion of arable land into other land types, driven by diverse human utilization needs, eventually decreased the aggregation of arable land (Wu, 2005).
Thus, the maximum kernel density of arable land and the Global Moran'I index generally decrease over time. More construction land occupied arable land with deepening urbanization, which made the distribution of arable land in partial areas more intensive under the requirement of the requisition-compensation balance system of arable land. Hence, the maximum value of the kernel density of arable land rebounded in 2020.
HEZ features an area with high terrain in the Northeast and low terrain in the Southwest. Under the condition of large-scale mechanized farming, elevation is the main factor in the distribution of arable land. Thus, there is less area of arable land in the Northeast and more in the Southwest within HEZ. Due to the region’s large-scale agriculture mechanization, the ‘high-high’ distribution type of arable land is the primary type. In contrast, the ‘low-low’ type is typically associated with construction land and water areas, which are predominantly found in the urban areas of each city and lake areas. It is the second most common agglomeration type after the ‘high-high’ type.
HEZ is less influenced by the economic reach of provincial cities, resulting in an economic depression. Nonetheless, HEZ possesses a favorable climate, topography, and soil conditions, making it primarily an area for agricultural development in the initial stage (2005–2010), which led to a net increase in arable land. From 2010 to 2015, cities in HEZ relied on their resource endowments to start vigorously developing industries, which damaged many arable lands due to excavation, subsidence, and occupation during production and construction. The difficulty and cost of land consolidation and reclamation increased. Therefore, the arable land area was in a negative growth stage. In the last period (2015–2020), China proposed the strategy of “rural revitalization,” which makes solving the problems of “agriculture, rural areas, and farmers” the top priority (Niu et al., 2020; Xu, 2020). This has underscored the increasing importance of arable land protection and restoration. At the same time, China’s economy has transformed from a high-speed development model to a high-quality model. More attention has been paid to the coordinated development of ecology and economy, leading to the increased arable land area during this period. However, due to the massive demand for construction land from the growing population and production activities, most of the arable land was converted to construction land, resulting in the maximum reduction of arable land in the three periods. Thus, the arable land area was still in negative growth in the last period.
Urbanization and industrialization transformed much of the arable land into construction land from 2005 to 2020. Moreover, the project of “returning arable land to forest and grassland” has also led to the transformation of many arable lands with low and unstable grain production into grassland. Meanwhile, some arable land around the water area that was unsuitable for cultivation has been restored to the water area due to the policy of “returning farmland to the lake” (Ma et al., 2021). With the increasing construction land area, much forest land, some barren grasslands, and tidal flats were reclaimed into arable land due to the policy of “requisition-compensation balance” of arable land. Therefore, a large amount of forest land and a small amount of unused land is converted to arable land.
There are many methods for studying the degree of influence of independent variables on dependent variables, such as multiple linear regression, logistic regression, decision trees, and random forests. These methods can utilize numerical research to determine the degree of influence of independent variables on dependent variables, but they all have an obvious flaw: they cannot explore the relationship between spatial variables. In addition, while the geographically weighted regression model can explore interrelationships between various factors on a spatial dimension, it is sensitive to data deficiencies and outliers, has high data requirements, and has slower calculation speeds, making it unsuitable for analyzing large amounts of spatial data. Geodetector calculates the relationship between factors based on the similarity of their spatial distribution. If the spatial distribution of independent variables is similar to that of dependent variables, it indicates a significant influence of independent variables on dependent variables. It can also detect the impact of dependent variables under the interaction of multiple independent variables. Compared to traditional methods, Geodetector does not rely on linear assumptions. It can handle both numerical and qualitative data and is highly inclusive of different types of data. These properties make Geodetector suitable for many spatial driving factor studies (Chen et al., 2023; He et al., 2023). Hence, when investigating the factors influencing the spatiotemporal changes in arable land, Geodetector proves to be a highly appropriate tool.
Since the q-value in Geodetector represents the spatial distribution of independent and dependent variables rather than the correlation between the individual independent variables, the sum of the q-values of each driving factor is not equal to 1 (Chen, 2019a).
From the perspective of natural and socio-economic attributes, HEZ is located in the Huang-Huai-Hai plain with flat terrain, and most of the arable land is tilled by machinery. In the context of mechanized agriculture, a significant portion of arable land is situated in regions characterized by low elevation and gentle slopes. As a result, elevation and slope are identified as the primary factors influencing the distribution of arable land. The Huang-Huai-Hai Plain is an alluvial plain, and its soil fertility depends on the alluvial material carried by rivers, while the river runoff mainly depends on precipitation. Besides, it is located near the north-south boundary of the Qinling Mountains and Huaihe River. The difference in water and heat conditions between the north and the south predominantly affects the spatial distribution of arable land. Thus, air temperature and precipitation are the main factors affecting the spatial distribution of arable land in HEZ. Good transportation conditions facilitate all agricultural activities, and arable land near roads offers greater convenience. Hence, transportation conditions greatly influence the spatial distribution of arable land.
Most of the soil types in HEZ are semi-aquatic and suitable for cultivation (Zhao et al., 2014). Nevertheless, long-term human socio-economic activities have led to various land types being planned and arranged based on human needs, resulting in minimal correlation between the spatial distribution of arable land and soil types in HEZ. HEZ is China’s primary grain production area. With arable land protection being a fundamental national policy, land use planning strictly limits arable land occupation, leading to various land use types within fixed areas. Consequently, land use type has a minimal impact on the spatial distribution of arable land.
From 2010 to 2020, traffic accessibility, precipitation, air temperature, elevation, and slope were the main factors affecting the spatial distribution of arable land, while land use types and soil types had little influence on the spatial distribution of arable land. However, the influence of air temperature and precipitation on the spatial distribution of arable land initially increased and then decreased. HEZ prioritized agricultural development before 2010, and arable land was widespread, even in regions with unfavorable water and heat conditions. Thus, air temperature and precipitation had little impact on the distribution of arable land in this period. With industry development and urbanization in HEZ, the construction land first occupied the arable land with poor hydrothermal conditions while retaining the arable land with better hydrothermal conditions to the maximum extent. Therefore, air temperature and precipitation became the main factors after 2010. With the continuous deepening of urbanization and the rapid growth of the social economy, to meet the demand of population growth for construction land from 2015 to 2020, many arable lands with better water and heat conditions have also been transformed into construction land. Consequently, the impact of air temperature and precipitation on the spatial distribution of arable land showed a downward trend.
From 2010 to 2020, the impact of population and GDP on the spatial distribution of arable land in HEZ changed from secondary to significant factors, showing a trend of first increasing and then decreasing. Before 2010, HEZ, dominated by agriculture, was in an economic depression, resulting in low GDP and severe population outflow. As a result, there was a minimal correlation between GDP, population, and the spatial distribution of arable land. By 2015, industrial development had driven economic growth and occupied a significant portion of arable land. Enhancements in farming equipment and technology have facilitated greater mechanization in agriculture, leading to the return of some of the population. Therefore, population and GDP had a more intense impact on the spatial distribution of arable land in this period. From 2015 to 2020, China’s economy transitioned from high-speed development to a high-quality stage, leading to more diversified economic development modes and broader industry distribution. Simultaneously, the rural revitalization strategy has lured some populations back to the countryside, but it has resulted in a corresponding reduction in the spatial distribution of arable land. While the population and GDP have undergone changes, they have not significantly altered the spatial distribution of arable land. Therefore, their influence on the spatial distribution of arable land in 2020 has diminished compared to 2015, but they remain important factors.
The interaction of factors with elevation, slope, and precipitation has a strong influence on the spatiotemporal distribution of arable land, but these factors are all-natural factors and are not controllable. Therefore, the anthropogenic factors of traffic accessibility, population and GDP, which have a high interaction influence, can be intervened to guide the spatiotemporal distribution of arable land in the HEZ to evolve in a more favorable direction. Although arable land is a product of socio-economic activities, it is mainly distributed in regions with superior geographical and climatic conditions due to considerations of cultivation conditions and grain output, and is thus mainly influenced by natural factors such as slope, elevation, temperature, and precipitation. Specifically, if a region has both flat terrain and sufficient water and heat conditions, it is more likely to become an arable land, and thus the interaction of natural factors can greatly enhance the driving force of the spatiotemporal evolution of arable land. At the same time, transportation, as a channel for managing arable land and grain output, also has an important impact on the distribution of arable land. If a region has convenient transportation and superior geographical and climatic conditions and is located in a major grain-producing area, it is highly likely to become an arable land. In summary, the interaction between natural factors and between natural factors and transportation has a stronger driving force on the spatiotemporal evolution of arable land in the Huaihai Economic Zone.
Arable land is a fundamental resource to ensure national grain security. The area of arable land in HEZ was getting less and less, and the distribution was more and more discrete. The authors put forward some targeted suggestions for protecting arable land based on the results.
First, all cities in HEZ should strictly control the newly added occupation of arable land. Based on land spatial planning, gradually reduce the scale of incremental space utilization within the urban development boundary, strictly control the use of arable land and permanent basic farmland, and strictly control various situations of land occupation. If it is necessary to occupy arable land, it is required to supplement the arable land according to the principle of equal quantity and equivalent quality. Strengthen land use planning and control, reasonably determine the annual total land use plan, and effectively regulate the timing and pace of new construction land. Optimize the selection of construction project sites, strictly implement land use standards, and ensure no or minimal occupation of arable land.
Second, all cities in HEZ should focus on revitalizing existing construction land. In accordance with the requirements of high-quality development and comprehensive conservation strategy, promote the transformation of land use from relying on new additions to tapping the potential of existing stock, vigorously promote “using existing stock to replace new additions,” “using underground space to replace above-ground space,” and “using funds and technology to replace space,” and promote the redevelopment of low-efficiency land to reduce the occupation of arable land from the source.
Third, the government administrative departments should strictly adhere to the principle of determining the scale of allowable arable land occupation based on the supplement of newly added arable land quantity. Reform the balance management mode of land occupation and compensation. Adjust and improve the compensation system for land occupation, expand the implementation of balance between non-agricultural construction land occupation and compensation to all types of land occupation, and adhere to the principle of “compensation determines occupation.” Under the premise of achieving a dynamic balance of total arable land, the stable increase of arable land utilization in the province is used as the indicator for supplementing arable land and the upper limit for the scale of allowable arable land occupation in the next year. Strengthen compensation incentives for supplementing arable land. The cost of supplementing arable land is mainly used for arable land protection and quality construction, and it mobilizes the enthusiasm of relevant entities to protect arable land. Improve the quality acceptance system for supplementing arable land. Strengthen the management of the quality of supplementing arable land, enhance the construction of supporting infrastructure for supplementing arable land, continue to improve soil fertility, enhance the quality of arable land, stabilize the utilization of arable land, and prevent degradation and abandonment.
Fourth, the government administrative departments should optimize the layout of arable land and steadily promote the gradual adjustment of arable land from the mountains to the foothills, promote the planting of fruit trees and seedlings on the mountains and slopes as much as possible, promote a more natural and agricultural production layout that conforms to the geographical pattern and agricultural production laws, and better prevent the non-grain production and abandonment of arable land.
Finally, the government administrative departments should use the effect of dual factor enhancement to guide the spatial evolution of arable land in HEZ. For example, all cities in HEZ should invest more funds to build and improve road facilities in farming areas, improve the utilization rate of arable land, and reduce the realization cost of agricultural products and the possibility of occupying arable land. All cities in HEZ should develop local adaptive agriculture and attract the population to engage in agricultural activities to improve the economic output of arable land and reduce the possibility of abandoning arable land.
This paper identified the spatiotemporal evolution patterns of arable land in HEZ from 2005 to 2020 and detected the driving factors. The conclusions are as the following.
(1) The arable land with high kernel density was distributed all over the cities and had a large area. Inversely, the arable land with low kernel density was mainly distributed in the north of Linyi, the junction of Linyi, Zaozhuang, and Jining, and the urban areas of each city. The distribution of arable land was less in the Northeast and more in the Southwest. There was significant agglomeration distribution of arable land. The main clustering types are the “high-high” and “low-low” clusters, and the spatial distribution overlapped with the kernel density of arable land.
(2) The distribution pattern of the kernel density of arable land from 2005 to 2020 was almost the same, and its maximum values generally decreased. The “high-high” type regions remained stable from 2005 to 2015 but decreased significantly in 2020 and tended to shrink toward the central part of HEZ, while the “low-low” type regions decreased significantly from 2005 to 2010 and mainly transformed into insignificant areas. Taking 2010 as the inflection point, the area of arable land of HEZ first increased and then decreased.
(3) The primary output type of arable land from 2005 to 2020 was grassland and construction land, while the primary input type was forest land.
(4) The main factors affecting the spatial distribution of arable land in HEZ from 2010 to 2020 were elevation, slope, and traffic accessibility. Air temperature and precipitation greatly influenced the spatial distribution of arable land in HEZ and showed a trend of increasing at first and then decreasing. Population and GDP had little influence before 2010. However, they had a more and more impact with time. The interaction of each factor showed the effect of dual factor enhancement.
(5) All cities in HEZ should strictly control the newly added occupation of arable land, focus on revitalizing existing construction land, strictly adhere to the principle of “compensation determines occupation,” optimize the layout of arable land, and pay more attention to the interactions of traffic accessibility, population, and GDP on the distribution of arable land, to protect arable land in a more targeted manner.
The original contributions presented in the study are included in the article/Supplementary Material, further inquiries can be directed to the corresponding author.
PW: Funding acquisition, Methodology, Project administration, Supervision, Validation, Writing–review and editing. ZL: Writing–original draft, Methodology, Software, Visualization. JW: Writing–original draft, Formal Analysis, Validation. YY: Data curation, Validation, Writing–original draft. SM: Supervision, Writing–review and editing.
The authors declare financial support was received for the research, authorship, and/or publication of this article. This research was funded by National Natural Science Foundation of China (Grant No. 41901229).
We sincerely thank the reviewers and guest editors for their constructive and insightful comments to help us improve this research. Besides, the authors would like to express their gratitude to EditSprings (https://www.editsprings.cn) for the expert linguistic services provided.
The authors declare that the research was conducted in the absence of any commercial or financial relationships that could be construed as a potential conflict of interest.
All claims expressed in this article are solely those of the authors and do not necessarily represent those of their affiliated organizations, or those of the publisher, the editors and the reviewers. Any product that may be evaluated in this article, or claim that may be made by its manufacturer, is not guaranteed or endorsed by the publisher.
Adugna, A., and Abegaz, A. (2016). Effects of land use changes on the dynamics of selected soil properties in northeast Wellega, Ethiopia. Soil 2, 63–70. doi:10.5194/soil-2-63-2016
Anselin, L. (1995). Local indicators of spatial association—LISA. Geogr. Anal. 27, 93–115. doi:10.1111/j.1538-4632.1995.tb00338.x
Anselin, L., and Rey, S. J. (2014). Modern spatial econometrics in practice: a guide to GeoDa, GeoDaSpace and PySAL. Chicago, IL: GeoDa Press LLC.
Arowolo, A. O., and Deng, X. Z. (2018). Land use/land cover change and statistical modelling of cultivated land change drivers in Nigeria. Reg. Environ. Change. 18, 247–259. doi:10.1007/s10113-017-1186-5
Bian, K., Tan, L., Shen, Y., Chen, X., and Xu, J. (2023). Spatial pattern of land use along the terrain gradient of Qinghai Tibet Plateau: a case study of Qiangtang Plateau, China. China. Front. Environ. Sci. 11, 1217225. doi:10.3389/fenvs.2023.1217225
Boru, D., Schwartz, M., Kam, M., and Degen, A. A. (2015). Effects of family size and wealth on size of land cultivated by Borana pastoralists in Southern Ethiopia. Hum. Ecol. 43, 15–28. doi:10.1007/s10745-014-9711-3
Brooks, M. M. (2019). The advantages of comparative LISA techniques in spatial inequality research: evidence from poverty change in the United States. Spat. Demogr. 7, 167–193. doi:10.1007/s40980-019-00052-4
Chang, Y., Zhang, T., Zhang, F., Shi, J., and Xie, Z. (2021). Analysis on the spatiotemporal variability and driving factors of cultivated land fragmentation in the hilly region of Eastern Jiangxi: a case of Wannian County. Res. Soil Water Conserv. 28, 264–271+280. doi:10.13869/j.cnki.rswc.2021.03.029
Chen, D., Zeng, W., Guo, K., and Wang, F. (2023). Study on spatio-temporal evolution and driving forces of ecosystem services in the Three Gorges Reservoir Area from 2000 to 2020. J. Hum. Settlements West China 38, 127–134. doi:10.13791/j.cnki.hsfwest.20230418
Chen, J. (2019a). Research on spatial-temporal disparities and influencing factors of cultivated land intensive utilization in various cities and prefectures of Sichuan Province. Wuhan: Wuhan University.
Chen, Z., Shi, D., He, W., Xia, J., Jin, H., and Lou, Y. (2019b). Spatio-temporal distribution and evolution characteristics of slope farmland resources in Yunnan from 1980 to 2015. Trans. Chin. Soc. Agric. Eng. 35, 256–265. doi:10.11975/j.issn.1002-6819.2019.15.032
Daedlow, K., Lemke, N., and Helming, K. (2018). Arable land tenancy and soil quality in Germany: contesting theory with empirics. Sustainability 10, 2880. doi:10.3390/su10082880
Deng, J., Ma, Q., Wei, H., Wang, X., Yang, C., Zhou, H., et al. (2021). Spatial-temporal evolution of cultivated land resources in Huai River Basin of Henan Province from the perspective of food security. Res. Soil Water Conserv. 28, 390–396. doi:10.13869/j.cnki.rswc.20210315.002
Desyatkin, A. R., Iwasaki, S., Desyatkin, R. V., and Hatano, R. (2018). Changes of soil C stock under establishment and abandonment of arable lands in Permafrost Area—central Yakutia. Atmosphere 9, 308. doi:10.3390/atmos9080308
Fotheringham, A. S. (2009). The problem of spatial autocorrelation" and local spatial statistics. Geogr. Anal. 41, 398–403. doi:10.1111/j.1538-4632.2009.00767.x
Gao, Y., and Wang, Z. (2020). Does urbanization increase the pressure of cultivated land? Evidence based on interprovincial panel data in China. Chin. Rural. Econ. 36, 65–85.
Gebremedhin, H., Gebresamual, G., Abadi, N., Hailemariam, M., Teka, K., and Mesfin, S. (2018). Conversion of communal grazing land into arable land and its impacts on soil properties and vegetation cover. Arid. Land Res. Manage. 32, 236–252. doi:10.1080/15324982.2017.1406412
Gebresamuel, G., Molla, B., Teka, K., Negash, E., Haile, M., and Okolo, C. C. (2022). Changes in soil organic carbon stock and nutrient status after conversion of pasture land to cultivated land in semi-arid areas of northern Ethiopia. Arch. Agron. Soil Sci. 68, 44–60. doi:10.1080/03650340.2020.1823372
Geng, Y., Chen, W., Zhang, F., and Ma, Y. (2021). Evolution and driving mechanisms of cultivated land trajectories in the middle and lower reaches of the Yellow River: a case study on the Henan Province. J. Agric. Resour. Environ. 38, 249–258. doi:10.13254/j.jare.2020.0216
Guan, X., Wang, X., Ren, Y., Zhang, J., and Zhang, S. (2020). Regulation and optimization of cultivated land in different ecological function areas along Yellow River. Trans. Chin. Soc. Agric. Mach. 51, 175–183+237. doi:10.6041/j.issn.1000-1298.2020.12.019
Gupta, R. D., Arora, S., Gupta, G. D., and Sumberia, N. M. (2010). Soil physical variability in relation to soil erodibility under different land uses in foothills of Siwaliks in N-W India. Trop. Ecol. 51, 183–197.
Haggar, J., Gracioli, C., and Springate, S. (2021). Land sparing or sharing: strategies for conservation of arable plant diversity. J. Nat. Conserv. 61, 125986. doi:10.1016/j.jnc.2021.125986
Hatna, E., and Bakker, M. M. (2011). Abandonment and expansion of arable land in Europe. Ecosystems 14, 720–731. doi:10.1007/s10021-011-9441-y
He, Q., Xie, D., Wang, S., and Chen, L. (2020). Spatio-temporal evolution of cultivated land multi-function based on a fuzzy optimization model in Beibei District, Chongqing. J. Southwest Uni., Nat. Sci. 42, 79–87. doi:10.13718/j.cnki.xdzk.2020.01.012
He, Y., Shi, X., Zeng, B., and Wang, J. (2023). Spatial distribution characteristics and influencing factors of intangible cultural heritage in Southwest China. J. Zhejiang Univ. Sci. Ed. 50, 628⁃638–650. doi:10.3785/j.issn.1008-9497.2023.05.014
Jin, S., Liu, X., Yang, J., Lv, J., Gu, Y., Yan, J., et al. (2022). Spatial-temporal changes of land use/cover change and habitat quality in Sanjiang plain from 1985 to 2017. Front. Environ. Sci. 10, 1032584. doi:10.3389/fenvs.2022.1032584
Kazlauskaitė-Jadzevičė, A., Tripolskaja, L., Volungevičius, J., and Bakšienė, E. (2019). Impact of land use change on organic carbon sequestration in Arenosol. Agric. Food Sci. 28, 9–17. doi:10.23986/afsci.69641
Li, H., Zhang, X., Wu, J., and Zhu, B. (2014). Spatial pattern and its driving mechanism of rural settlements in Southern Jiangsu. Sci. Geogr. Sin. 34, 438–446.
Li, X., Tong, L., and Kang, S. (2013). Spatial pattern of crop water sensitive coefficient in Haihe Basin. Trans. Chin. Soc. Agric. Eng. 29, 82–89. doi:10.3969/j.issn.1002-6819.2013.14.011
Liu, M., Wang, P., He, X., and Shi, J. (2023). Restructuring of traditional villages under the production of space theory driven by red tourism: a case study of Malan village in Beijing. Geogr. Res. 42, 1663–1679. doi:10.11821/dlyj020221181
Liu, Y., Zhang, F., Xie, Z., and Zhang, T. (2019). Evolution of spatio-temporal characteristics of grain production in China from the perspective of arable land use. J. China Agric. Univ. 24, 173–182. doi:10.11841/j.issn.1007-4333.2019.11.19
Ma, S., Cheng, H., Lin, C., and Wang, L. (2021). Spatiotemporal changes of land use and landscape pattern in Jianghuai Ecological Economic Zone. Res. Soil Water Conserv. 28, 292–299. doi:10.13869/j.cnki.rswc.2021.01.036
Miao, M., Ze, H., and Wu, Y. (2021). Spatio-temporal evolution characteristics of cultivated land use transition in Zhejiang Province. Acta Agric. Zhejiangensis 33, 753–760. doi:10.3969/j.issn.1004-1524.2021.04.20
Niu, L., Zhang, B., Jia, T., and She, D. (2021). Analysis on intensity and stability of land use change in haixi Mongolian and Tibetan autonomous prefecture of qinghai province. J. Soil Water Conserv. 35, 152–159. doi:10.13870/j.cnki.stbcxb.2021.02.021
Niu, S. D., Fang, B., Cui, C., and Huang, S. H. (2020). The spatial-temporal pattern and path of cultivated land use transition from the perspective of rural revitalization: taking Huaihai Economic Zone as an example. J. Nat. Resour. 35, 1908–1925. doi:10.31497/zrzyxb.20200812
Pei, H., Wei, Y., Wang, X., Tan, Z., and Hou, C. (2014). Method of cultivated land landscape ecological security evaluation and its application. Trans. Chin. Soc. Agric. Eng. 30, 212–219. doi:10.3969/j.issn.1002-6819.2014.09.026
Prăvălie, R., Patriche, C., Borrelli, P., Panagos, P., Roșca, B., Dumitraşcu, M., et al. (2021). Arable lands under the pressure of multiple land degradation processes. A global perspective. Environ. Res. 194, 110697. doi:10.1016/j.envres.2020.110697
Qin, S., and Wang, Z. (2020a). Multi-function evolutions of arable land and its driving forces based on different functional types of cities. Sci. Soil Water Conserv. 18, 94–102. doi:10.16843/j.sswc.2020.04.011
Qin, Y., Tuo, S., Liang, X., Xu, S., He, J., Yu, T., et al. (2020b). Evolution trend of cultivated land quality change in Guangxi in the last 35 years based on long-term location monitoring. Chin. J. Soil Sci. 51, 1290–1296. doi:10.19336/j.cnki.trtb.2020.06.05
Ran, C., Li, Y., and Liang, X. (2020). Evolution characteristics and occurrence mechanisms of cultivated land use transition in Chongqing. J. Chongqing Norm. Univ. Nat. Sci. Ed. 37, 119–128+146. doi:10.11721/cqnuj20200304
Ren, P., Wu, T., and Zhou, J. (2016). Analysis of spatial distribution pattern and evolutionary characteristics of cultivated lands based on spatial autocorrelation model and GIS platform - a case study of Longquanyi District, Chengdu, China. Chin. J. Eco-Agric. 24, 325–334. doi:10.13930/j.cnki.cjea.151091
Shan, N., and Lai, B. (2011). Temporal evolution characteristics of cultivated land resource security based on SPA. China Popul. Resour. Environ. 21, 401–404.
Shi, X., and Li, Y. (2018). Transformation evaluation and differences evolution analysis of cultivated land functional in Guizhou Province in recent 40 years. Carsol. Sin. 37, 722–732. doi:10.11932/karst20180510
Song, I., and Gin, Y. (2002). A model of enhancing biodiversity through analysis of landscape ecology in Seoul cultivated area. Kor. J. Environ. Ecol. 16, 249–260.
Song, I., and Gin, Y. (2003). A study on management for the cultivate land of greenhouses through landscape ecological pattern analysis in Seoul urban area. Kor. J. Environ. Ecol. 17, 56–70.
Störrle, M., Hagedorn, L., Yurtaev, A., Brauckmann, H. J., and Broll, G. (2016). Soil structure of arable and non-arable land in the Western Siberian Grain Belt in Russia - application of the soil fingerprint code for topsoil characterization. J. Plant Nutr. Soil Sci. 179, 510–519. doi:10.1002/jpln.201500450
Su, Y., Qian, K., Lin, L., Wang, K., Guan, T., and Gan, M. (2020). Identifying the driving forces of non-grain production expansion in rural China and its implications for policies on cultivated land protection. Land Use Policy 92, 104435. doi:10.1016/j.landusepol.2019.104435
Tang, C., and Zang, J. (2021). Multi-functional evaluation of cultivated land and an analysis of the temporal and spatial evolution of Guangzhou in the new era. J. Agric. Resour. Environ. 38, 332–343. doi:10.13254/j.jare.2020.0648
Uisso, A. M., and Tanrivermis, H. (2021). Driving factors and assessment of changes in the use of arable land in Tanzania. Land Use Policy 104, 105359. doi:10.1016/j.landusepol.2021.105359
Wang, G., and Qian, L. (2019). Grain security strategy in the 70 years since the founding of new China: evolution path and internal logic. Chin. Rural. Econ. 35, 15–29.
Wang, J., and Xu, C. (2017). Geodetector: principle and prospective. Acta Geogr. Sin. 72, 116–134. doi:10.11821/dlxb201701010
Wang, J. F., and Hu, Y. (2012). Environmental health risk detection with GeogDetector. Environ. Modell. Softw. 33, 114–115. doi:10.1016/j.envsoft.2012.01.015
Wang, J. F., Li, X. H., Christakos, G., Liao, Y. L., Zhang, T., Gu, X., et al. (2010). Geographical detectors-based health risk assessment and its application in the neural tube defects study of the Heshun region, China. Int. J. Geogr. Inf. Sci. 24, 107–127. doi:10.1080/13658810802443457
Wang, P., Sun, H., Fan, S., Dong, Z., and Cheng, F. (2020). Research status and prospects of village reclamation in China. J. China Agric. Univ. 25, 209–220. doi:10.11841/j.issn.1007-4333.2020.11.21
Wu, X. (2005). The dynamic mechanism of arable land non-agriculturalization in Jiangsu Province. Nanjing: Nanjing Normal University.
Xie, T., Li, L., Chen, X., Zhou, Y., Zhang, G., and Chen, L. (2021a). Estimation and prediction of carbon storage based on land use in the Huaihai Economic Zone. J. China Agric. Univ. 26, 131–142. doi:10.11841/j.issn.1007-4333.2021.01.14
Xie, W., Zhang, X., and Pan, X. (2021b). Spatio temporal variation of cultivated land change during 1995-2015 in China. J. Xinyang Norm. Univ. Nat. Sci. Ed. 34, 242–247. doi:10.3969/j.issn.1003-0972.2021.02.012
Xu, M. (2020). The international experience and Chinese road of rural revitalization. Agric. Econ. 40, 30–32.
Xu, W., Ma, Q., and Cai, L. (2021). Evaluation of cultivated land quality grade in Jingyuan County based on 'cultivated land quality grade' (GB/T33469-2016). Grassl. Turf. 41, 94–102+112. doi:10.13817/j.cnki.cyycp.2021.01.013
Yang, X., and Tan, M. (2014). Spatial differences and evolution of arable land functions in Beijing. Geogr. Res. 33, 1106–1118. doi:10.11821/dlyj201406011
Ye, S., Song, C., Gao, P., Cheng, F., Ren, S., and Du, B. (2023). Construction of the new cognitive system for arable land resources from geospatial perspective. Trans. Chin. Soc. Agric. Eng. 39, 225–240. doi:10.11975/j.issn.1002-6819.202211142
Zhang, C., and He, H. (2020). The evolution of spatiotemporal patterns and the influencing factors of the multiple cropping index of cultivated land in Southwest China. Agric. Res. Arid. Areas. 38, 222–230. doi:10.7606/j.issn.1000-7601.2020.03.28
Zhang, M., Zhang, Z., Tong, B., Ren, B., Zhang, L., and Lin, X. (2023). Analysis of the coupling characteristics of land transfer and carbon emissions and its influencing factors: a case study of China. Front. Environ. Sci. 10, 1105552. doi:10.3389/fenvs.2022.1105552
Zhang, Y., Long, H., Ma, L., Ge, D., Tu, S., and Qu, Y. (2018). Farmland function evolution in the Huang-Huai-Hai Plain: processes, patterns and mechanisms. J. Geogr. Sci. 28, 759–777. doi:10.1007/s11442-018-1503-z
Zhang, Y., Zhou, Z., Huang, D., Zhu, M., Wu, Y., and Sun, J. (2020). Spatio-temporal evolution of cultivated land and analysis of influence factors in karst mountainous areas. Trans. Chin. Soc. Agric. Eng. 36, 266–275. doi:10.11975/j.issn.1002-6819.2020.22.030
Zhao, G., Li, Y., Gao, J., and Li, F. (2014). Storage and spatial distribution of soils carbon in lower reaches of the Yellow River irrigation district. Ecol. Environ. Sci. 23, 1113–1120. doi:10.16258/j.cnki.1674-5906.2014.07.021
Zhao, X., Liu, M., and Wang, B. (2018). Spatio-temporal disparity of urban construction land and its impact factors in China based on Geodetector. China Land Sci. 32, 29–35. doi:10.11994/zgtdkx.20180504.132327
Keywords: arable land, kernel density, spatial autocorrelation, driving factor, Geodetector, Huaihai Economic Zone
Citation: Wang P, Lin Z, Wang J, Yang Y and Mu S (2023) Spatiotemporal evolution patterns and driving factors of arable land in Huaihai Economic Zone, China. Front. Environ. Sci. 11:1267475. doi: 10.3389/fenvs.2023.1267475
Received: 26 July 2023; Accepted: 19 October 2023;
Published: 15 November 2023.
Edited by:
Rajesh Bahadur Thapa, International Centre for Integrated Mountain Development, NepalReviewed by:
Motilal Ghimire, Tribhuvan University, NepalCopyright © 2023 Wang, Lin, Wang, Yang and Mu. This is an open-access article distributed under the terms of the Creative Commons Attribution License (CC BY). The use, distribution or reproduction in other forums is permitted, provided the original author(s) and the copyright owner(s) are credited and that the original publication in this journal is cited, in accordance with accepted academic practice. No use, distribution or reproduction is permitted which does not comply with these terms.
*Correspondence: Peijun Wang, d2FuZ3BqQGN1bXQuZWR1LmNu
Disclaimer: All claims expressed in this article are solely those of the authors and do not necessarily represent those of their affiliated organizations, or those of the publisher, the editors and the reviewers. Any product that may be evaluated in this article or claim that may be made by its manufacturer is not guaranteed or endorsed by the publisher.
Research integrity at Frontiers
Learn more about the work of our research integrity team to safeguard the quality of each article we publish.