 Yujie Xu
 Xianchun Liao
 Meicun Li
- 1Business School, University of Jinan, Jinan, China
- 2Institute of Green Development, University of Jinan, Jinan, China
This paper analyze the characteristics of green trade between China and Regional Comprehensive Economic Partnership (RCEP) countries from 2001 to 2020, and then adopts a stochastic frontier gravity (SFG) model and trade inefficiency (TIE) model to analyze the trade potential and the influencing factors of green trade between China and RCEP countries. The main conclusions are as follows: the green trade value continues to grow, with Japan and South Korea as the main green trade partners. The competitive advantage of Chinese green products and the complementarity of RCEP countries towards Chinese green products are both increasing. Per capita GDP, population of RCEP countries promote the green trade, while the geographical distance hinders green trade. In the item of TIE, governance ability and economic freedom promote the efficiency of green trade, while differences in environmental regulation and tariff rate hinders trade efficiency. At present, China has significant green trade potential with RCEP countries. The efficiency of green trade between China and Japan, South Korea, Singapore, Vietnam, and Australia is relatively low. China should actively tap into the demand for green trade and further develop the potential of green trade.
1 Introduction
In the face of changes in the world with rising trade protectionism, regional integration has increasingly become an important supplement to globalization (Chen et al., 2023). In November 2020, China, Japan, South Korea, Australia, New Zealand and Association of Southeast Asian Nations (ASEAN) signed the Regional Comprehensive Economic Partnership (RCEP), marking the formal formation of the largest and most influential free trade area in the world (Tian et al., 2022). RCEP places top priority on regional trade liberalization and facilitation, which is conducive to China’s construction of a new development pattern that promotes domestic and international circulation (Zhang and Wang, 2023). Research has shown that RCEP will significantly promote the international trade value of participating countries, thereby facilitating world economic growth (Zhao and Mun, 2023).
The RCEP pursues the concept of green and development, and the impact of commodity trade on the environment has always been a key concern of the RCEP (Bashir et al., 2022; Fan et al., 2022). In fact, while international trade redistributes global resources, environmental pollution generated in the process of resource exploitation, product processing and commodity transportation is also an important factor hindering the sustainable development of regional economy (Khan et al., 2021). As the world’s largest trading country, China’s trade surplus brings huge carbon emissions from the production of export products (Li et al., 2022). While providing affordable and high-quality goods to foreign consumers, China is burdened with enormous carbon reduction and environmental pressure (Hotak et al., 2020). Against the backdrop of the prevalence of regional cooperation (Hu et al., 2021), how to reduce the impact of environmental pollution in international trade and promote the coordinated development of trade growth and ecological protection is an issue that needs urgent attention and solution (Zhang et al., 2022a).
Green trade is a type of trade that emphasizes environmental protection and sustainable economic and social development (Can et al., 2022a). It can be calculated through trade in environmental products or green industries. Green trade conforms to China’s new development concept and is an important direction of China’s current foreign trade transformation (Li et al., 2022). According to the China Green Development Report in 2021, China’s green trade value reach 1,161.09 billion dollars, surpassing the European Union to become the world’s largest green trading country, accounting for 14.6% of the world. In fact, before the establishment of RCEP, China had already engaged in environmental cooperation with ASEAN to jointly address the pollution transfer issues caused by trade (Yoo and Kim, 2016). We believe that with the green transformation of economic growth and the strong promotion of the RCEP agreement, the multilateral green trade has great potential.
How to tap the potential of green trade between China and RCEP countries and promote the green development of China’s economy? Scientific evaluation of the characteristics of green trade is a prerequisite for carrying out research on green trade potential. Therefore, based on the classification of green trade products, we calculates the green trade value between China and RCEP countries, analyzes the time evolution trend and spatial differentiation pattern of green trade, as well as the competitiveness and complementarity of trade products. The SFG model and TIE model is further used to analyze the key influencing factors of green trade, measure the trade potential between China and RCEP countries, and put forward policy suggestions to promote the development of green trade.
The remainder of the paper is structured as follows. After an introduction, a literature review of green trade, trade characteristic and trade potential prediction are presented in Section 2. We describe the methods and data in Section 3. Analysis and discussion of green trade characteristic, empirical results and estimation of green trade potential are provided in Section 4. The main conclusions are summarized and policy recommendations are discussed in Section 5.
2 Literature review
2.1 Measurement of green trade
Green trade has received more and more attention, but the concept of green trade is not the same in the literature (He et al., 2021; Can et al., 2022a). Some scholars define green trade as trade after deducting environmental damage, and then evaluate the implementation of green trade. Kang and lee (2021) assessed the green trade of the ferrous metal industry after deducting environmental costs. They believe that although ferrous metal industry has achieved overall green trade in China, the expansion of exports and the increase of environmental damage have led to the gradual deterioration of green trade. More scholars use a refined way to calculate the value of green trade by category. Scholars usually adopt two methods to measure green trade.
First, the industry is divided into green and non-green categories, and green trade is calculated by matching green industry codes. The Bureau of Labor Statistics of the United States divides the green industry into five categories: 1) energy from renewable resources, 2) energy efficiency, 3) pollution reduction and removal, greenhouse gas reduction and recycling and reuse, 4) natural resources and environmental compliance, 5) education and training and public awareness. Huang et al. (2020) selected the third category mentioned above as the green industry, calculating how environmental policy affect green trade. Yue et al. (2022) studied the impact of geographical distance on the trade of green industries by taking nursery producers and plant inventory distribution industries as green industries.
Second, scholars judge whether a product is a green product according to the definition and classification of environmental products, and calculate the trade value of green products. Although the international trade of environmental products has started early, different countries have not reached an agreement on the exact definition of environmental products (Can et al., 2022b). At present, the main international classification of environmental goods includes World Bank (WB) list, United Nations Economic and Social Commission for Asia and the Pacific (UNESCAP) list, Organization for Economic Co-operation and Development (OECD) list and Asia-Pacific Economic Cooperation (APEC) list (OECD, 2001; World Bank, 2008; UNESCAP, 2011; APEC, 2012). The quantity and classification of relevant lists of environmental goods are still changing. In 2012, APEC added an environmentally friendly product, forming a list of 54 environmental goods. The environmental product lists submitted by member states collected by the World Trade Organization Secretariat and the negotiations on the Environmental Product Agreement initiated are also based on the APEC Environmental Product List. Can et al. (2021), Zhou et al. (2021), Li et al. (2022), adopted the environmental goods list to measure green trade.
2.2 Research on green trade characteristic
As a new form of trade, there is not much research on the characteristics of green trade. Current academic research focuses more on the characteristics of trade. The first viewpoint is to analyze the spatio-temporal evolution trends of imports, exports, trade value, balance, and target countries, or use network analysis to analyze the structure, centrality, and network density of trade networks (Mou et al., 2022). An et al. (2014) constructed a complex network model to analyze of the evolution of basic features of crude oil trade and studied the stability, hierarchy structure and partition of the networks. Zhou et al. (2021) explored the status changes of countries in the global trading system for green product and the spatial structure of the network shows a transition of trading centers away from the United States towards the Europe and Asia.
The other is to analyze the competitiveness and complementarity of trade products between China and other countries by constructing trade indices, such as revealed comparative advantage (RCA), export similarity index, trade complementarity index (TCI), and intra industry trade index (Maryam et al., 2018). Liu et al. (2020) analyzed the agricultural trade pattern between China and countries along the Belt and Road, and believed that bilateral trade competitiveness and complementarity coexist and show regional heterogeneity. Chen et al. (2021) constructed RCA and TCI to analyze the energy trade between China and the BRICS countries, and found that the crude oil trade between China and Russia continues to expand, but China’s coal export competitiveness has decreased.
2.3 Research on green trade potential prediction
The research on trade predicting methods is relatively mature, but lacks application in the field of green trade. The first method is the Global Trade Analysis Project (GTAP) model, including the trade potential prediction of the two cases without signing and signed economic and trade agreements. In the absence of agreements, the projected tariff and non-tariff barriers are usually used to simulate the trade effects of the expected member countries (Park et al., 2021). Stenberg and Siriwardana (2016) examined the effects of trade liberalisation on forest products trade when APEC extend their preferential treatment to non-member countries using GTAP model. After the trade agreement has been signed, the tariff and non-tariff barriers calculated by the agreement are used to simulate the economic impact on the member countries, and then the changes of trade value in the future is calculated. Zhu and Huang (2023) used the GTAP model to predict trade data under the Schedule of Tariff Commitments of the RCEP, then explored the change of trade networks structure to the tariff reduction.
The other is gravity model, including the traditional gravity model and the stochastic frontier gravity (SFG) model. The traditional gravity model only estimates the average effect of trade determinants, while the SFG model considers the impact of unobservable non-efficiency items and further predicts trade potential by measuring trade efficiency through trade inefficiency (TIE) model (Timbergen, 1962; Batteseg and Coell, 1992). The use of gravity models to predict trade potential requires the analysis of trade influencing factors, which usually include natural and human determinants. Natural determinants include factors that are unlikely to change in the short term, such as economic scale, population, geographical distance, proximity of regions and language consistency (Chen et al., 2008). Research shows that economic scale, neighboring regions and common language have a positive impact on manufacturing trade, while geographical distance hindered manufacturing trade (Morland et al., 2020). Human determinants include infrastructure, economic system, trade agreement, government system and other factors that are likely to change in the short term (Martinez-Zarzoso et al., 2009; Huang et al., 2021). Generally speaking, digital economy, good infrastructure, liberal institutional environment, and trade agreements will promote bilateral trade growth (Guo et al., 2023; Guo and Mai, 2023).
There are abundant researches on the analysis of international trade characteristic and trade potential, but the researches on green trade have not been in-depth. The quantitative standards of green trade are not the same. In particular, RCEP, as an important trading partner of China, lacks the characteristics analysis and trade potential prediction of bilateral green trade. Therefore, the aim of this study was to fill this gap.
The specific contributions of this research are as follows: 1) we calculate the trade value of green products between China and RCEP countries, then analyze the spatiotemporal evolution trend of green trade value, and conduct competitive and complementary analysis on green products, which fill the research gap of green trade in RCEP. 2) We estimate the efficiency of green trade between China and RCEP countries, and analyze the gap between actual trade value and optimal trade value, which is conducive to objectively understanding the potential of green trade. 3) We use the SFG model and TIE model to analyze the influencing factors of green trade between China and RCEP countries, and proposed practical paths to promote the growth of green trade. This study expands the research scope of RCEP green trade and contributes to the new development pattern of China’s domestic and international dual circulation.
3 Methods and data
3.1 Green trade characteristic
The analysis of the characteristics of green trade mainly includes the temporal evolution trend, national differences, and the competitiveness and complementarity. Among them, the analysis of trade competitiveness and complementarity adopts the revealed comparative advantage (RCA) and trade complementarity index (TCI), respectively.
RCA is an index first proposed by Balassa (1965) to measure the competitiveness of an industry in a country. By comparing the ratio of a country’s export of a certain commodity to the world’s export of that commodity with that of the economy’s total export to the world’s total export, the impact of fluctuations in national trade value and world trade value can be eliminated, effectively reflecting the relative advantage of a country’s exports of a certain industry. The formula is as follows:
The
TCI is an index proposed by Drysdale (1969) to measure the trade complementarity between two countries and analyze bilateral trade potential. This paper uses TCI to measure the trade complementarity and the formula is as follows:
3.2 Green trade potential prediction
3.2.1 Stochastic frontier gravity model
Literature studies show that both GTAP and SFG models can be used for trade predicting. Although GTAP is widely used and has a good predictive function for the favorable impact of trade agreement signing, the department classification in the GTAP model is limited and cannot match six digit green product trade data. So we adopt the SFG model in this paper. Stochastic frontier function was first proposed by Meeusen and Broeck (1977), Aigner et al. (1997) to study technical efficiency in production function. In the method, the stochastic perturbation term is divided into two independent parts: the stochastic error term and the non-negative technical inefficiency term. The actual trade value in the panel data can be expressed as:
Where,
The earliest stochastic frontier model assumes that trade inefficiencies do not change with time, that is, the time-invariant model. To make the hypothesis more reasonable when the time dimension is longer, Battese and Coelli (1992) proposed a time-varying stochastic frontier model.
The formula is as follows:
Based on the above theoretical model, in order to measure China’s trade potential with RCEP countries, the following time-varying SFG model is selected as the measurement method. The model is as follows:
Wherein, subscript
3.2.2 Trade inefficiency model
In order to further study the influencing factors of TIE, it is necessary to establish a TIE model. In traditional research methods, the SFG model is used to estimate the value of TIE item
The TIE model is:
Explanatory variable
3.3 Data
According to the model analysis, the dependent variable is the trade value of green products between China and RCEP countries. The APEC list of environmental goods was released at the 20th APEC Leaders’ Informal Meeting in 2012. This paper takes it as the classification standard and screens the six-digit coded data of green trade. The specific classification is shown in Table 1.
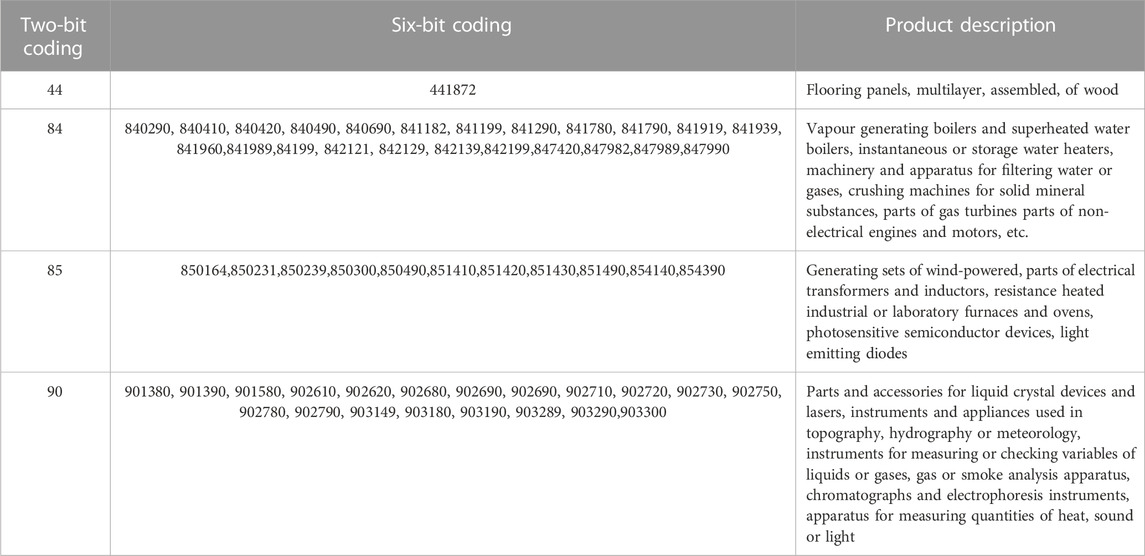
TABLE 1. Green products classification.
The specific data description of the dependent variable and the explanatory variable is shown in Table 2.
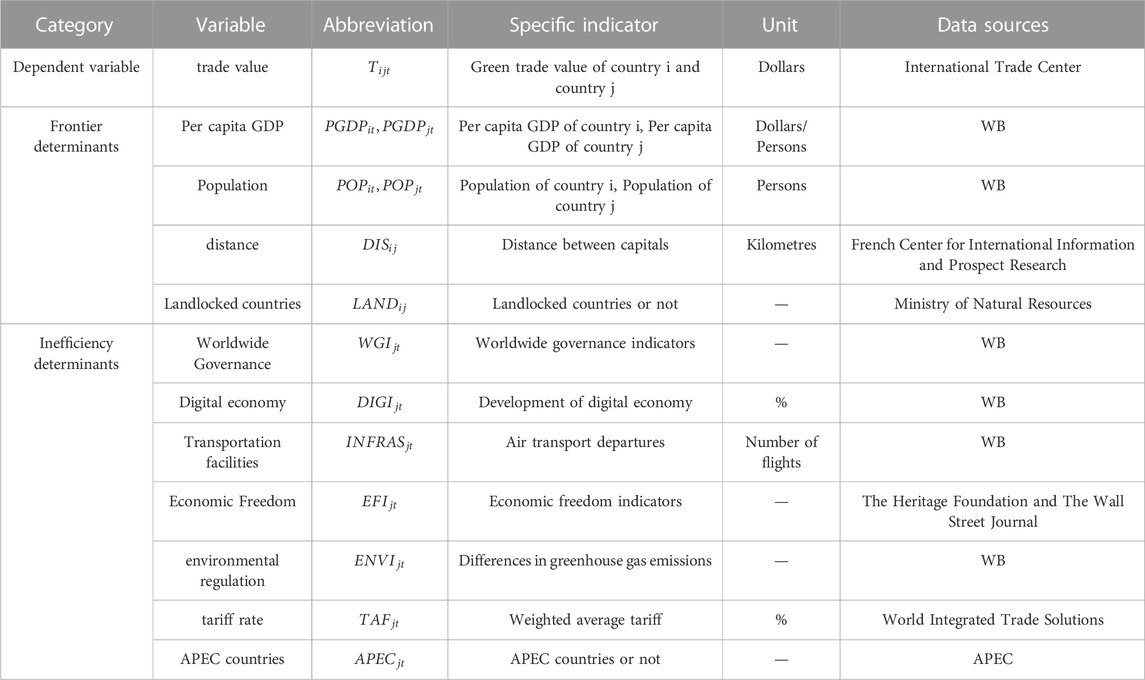
TABLE 2. Trade influencing factors.
4 Results and discussions
4.1 Analysis of green trade characteristic
4.1.1 Analysis of spatio-temporal evolution of green trade
The economic and trade cooperation between China and RCEP countries has developed steadily. As shown in Figure 1, the scale of green trade has continued to expand, with the trade value rising from 367 thousand dollars in 2001 to 4,423 thousand dollars in 2020. The green trade value from 2001 to 2020 can be roughly divided into two stages: the rapid growth stage from 2001 to 2008, and the steady growth stage from 2009 to 2020. Specifically, the import and export grew rapidly from 2001 to 2008, due to the impact of the financial crisis, both imports and exports decreased in 2009. With the strengthening of regional economic and trade cooperation, import and export rebounded to a great extent, and then import showed a downward trend, while export maintained a relatively stable growth trend. On the whole, imports are greater than exports of green trade value, showing a trade deficit, but the trade deficit is decreasing year by year.
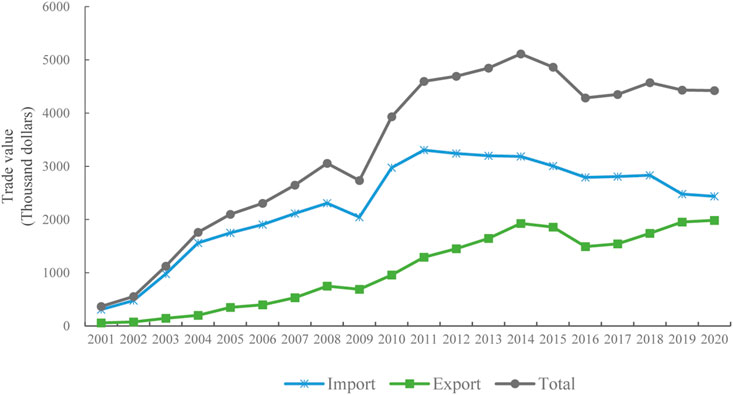
FIGURE 1. Average green trade value between China and RCEP countries from 2001 to 2020.
Green trade value between China and RCEP countries has significant spatial differentiation. As shown in Figure 2, China, Japan and South Korea, as the core of East Asia, have gradually achieved rapid economic and trade growth with processing industry as the main form of trade in recent years. The average value of green trade between China, Japan and South Korea, has exceeded 17,000 million dollars, with the average value of imports exceeding 13,000 million dollars and exports exceeding 3,000 million dollars, both significantly higher than that of other partners. The green trade value of Malaysia, Vietnam, Thailand, Singapore, Indonesia, Australia and the Philippines ranks in the second tier, with the average bilateral trade value between 100 and 3,000 dollars. However, countries such as Myanmar, Laos, Cambodia, New Zealand, and Brunei have relatively small GDP, and the economic structure with a relatively large proportion of agriculture is difficult to effectively promote the development of their green product manufacturing industry. The average annual green trade value with China is less than 100 thousand dollars, ranking in the third tier of RCEP countries. South Korea, Japan and Singapore are green trade deficit countries, while Vietnam, Indonesia and Australia are the main trade surplus countries.
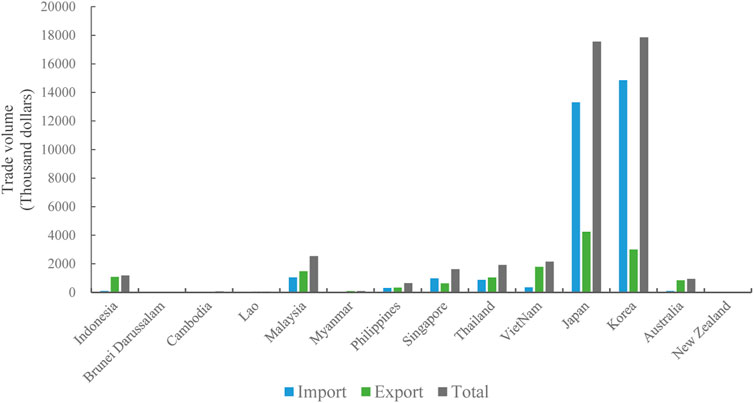
FIGURE 2. Green trade value between China and RCEP countries from 2001 to 2020.
4.1.2 Analysis of trade competitiveness and complementarity
The average index of RCA of China’s green products from 2001 to 2020 is 1.136, indicating that China’s green products have medium comparative advantage, as shown in Table 3. The RCA of green products in RCEP countries is all lower than 2.5, and no country has shown a strong comparative advantage. Specifically, Japan’s RCA of green products is the highest, at 2.031, and it is in the first tier together with South Korea. The RCA of green products in Singapore, Philippines, Malaysia and China are relatively close, all between 0.800 and 1.250, with a medium comparative advantage. The RCA of green products in Thailand, Indonesia and Australia is lower than 0.800, indicating that the comparative advantage of these countries is weak. In terms of the fluctuation trend, the RCA of green products in Myanmar, Cambodia, Laos and Vietnam increased significantly, while that of Japan and South Korea showed a downward trend. The average annual growth rate of the RCA of China’s green products is 4.574%, meaning that the advantage of China’s green products has a deepening trend. The reason is that China actively integrated into the wave of globalization, vigorously improved the scientific research and technological level of green products, and made leapfrog progress in the production and processing level of environmental protection processes and related products.
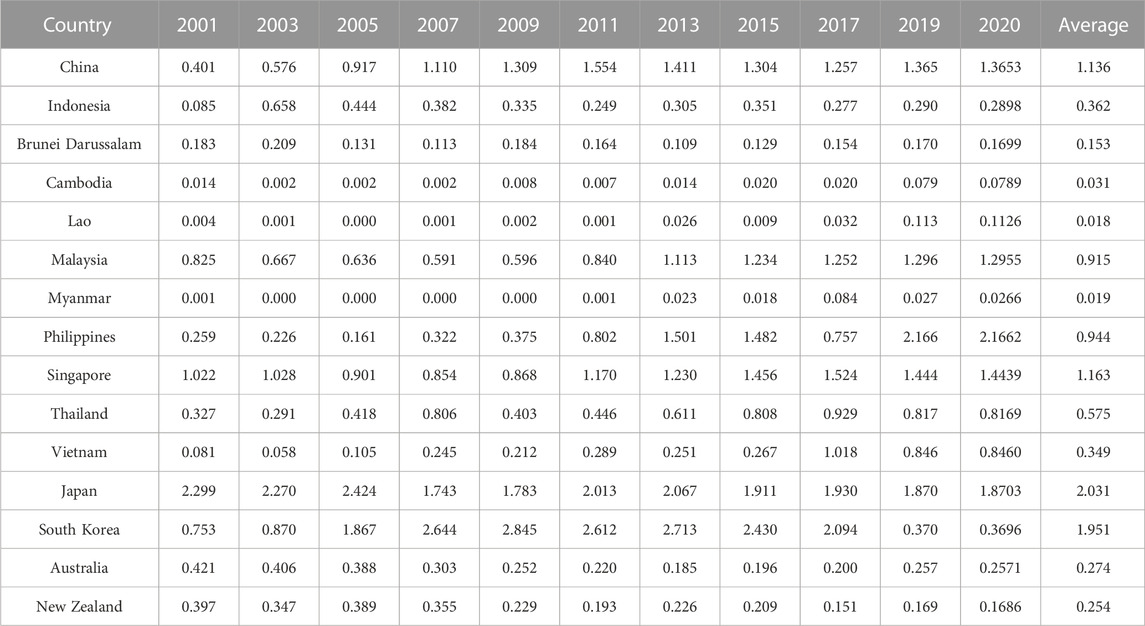
TABLE 3. RCA of green trade between China and RCEP countries.
From 2001 to 2020, the average TCI between RCEP countries and China’s green product exports was 1.050, indicating a slightly stronger complementarity in bilateral green trade, as shown in Table 4. There is a significant national difference in the strength of trade complementarity, with Brunei, South Korea, Vietnam, and Malaysia having the strongest trade complementarity, with trade complementarity indices all above 1.300. Singapore, Thailand, Australia, and Laos rank second in terms of trade complementarity, while China’s trade complementarity with other RCEP countries is not significant. In terms of fluctuation trend, the TCI between RCEP countries and China’s green product exports shows a significant upward trend, with an annual growth rate of 4.456%, indicating that the dependence of RCEP countries on China’s green product exports is gradually strengthening. Specifically, the TCI of Cambodia, the Philippines and China’s green product exports has a significant upward trend over time, while the TCI of New Zealand, Laos, Brunei and China’s green product exports has a downward trend, while the fluctuation trend of other countries and China is not significant.
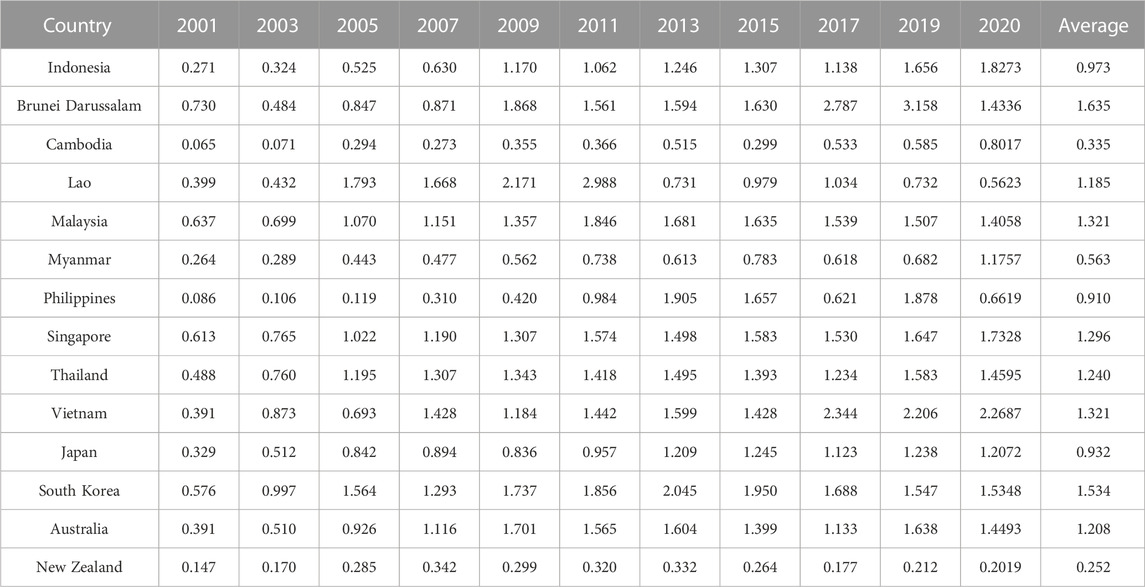
TABLE 4. TCI between RCEP countries and China’s green product exports.
From 2001 to 2020, the average TCI between China and RCEP countries’s green product exports is 1.383, indicating strong complementarity in bilateral green trade, as shown in Table 5. There is a huge difference in the TCI between China and RCEP countries, and the strongest trade complementarity is Japan, South Korea and Singapore. It can be seen that Japan and South Korea, as manufacturing powers, still have export advantages in the field of green product manufacturing, and their trade complementarity is strong. Malaysia, the Philippines and Thailand have the second highest trade complementarity, and the TCI is between 1 and 2. In terms of the fluctuation trend, the TCI shows an inverted “U” trend of increasing first and then decreasing. On the whole, China’s dependence on green products export of RCEP countries is slightly weakened. Specifically, the trade complementarity between China and developed countries such as Australia, New Zealand and Japan shows a downward trend, while countries with low TCI, such as Myanmar, Cambodia, and Laos, have a significant upward trend in TCI over time.
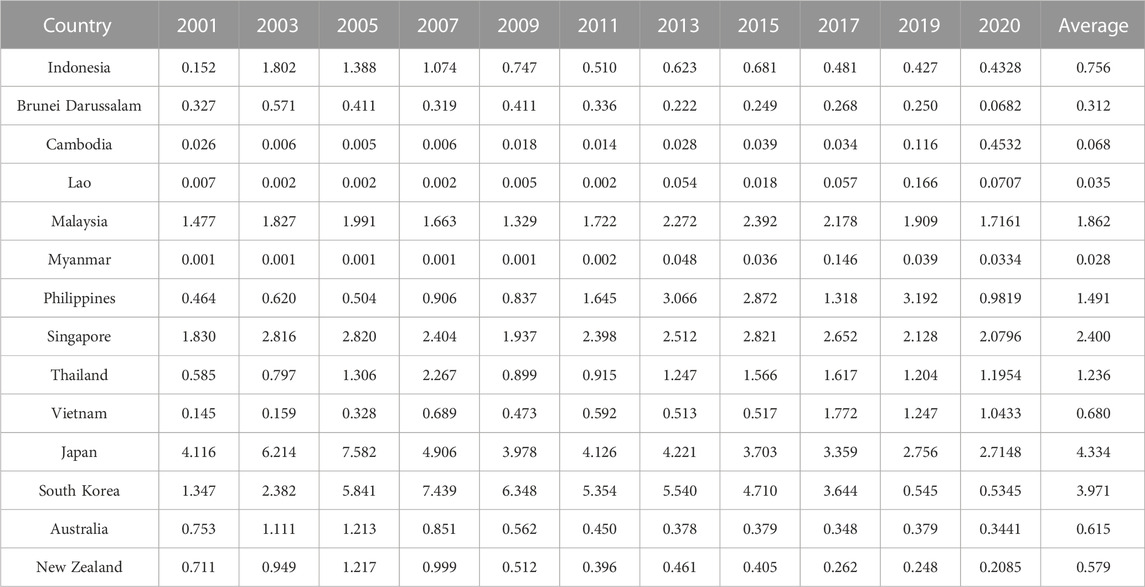
TABLE 5. TCI between China and RCEP countries’s green product exports.
4.2 Analysis of green trade potential
4.2.1 Analysis of stochastic frontier gravity model
This paper uses Frontier 4.1 software to make SFG model and TIE model estimation. Since the SFG model is highly dependent on the functional form, it is necessary to use the LR to judge the applicability of the function before estimating. When the LR statistic is significant, the null hypothesis is rejected, otherwise the null hypothesis is accepted. The following two tests are set in this paper: the existence test of TIE and the time-variability test of TIE. The results are shown in Table 6.
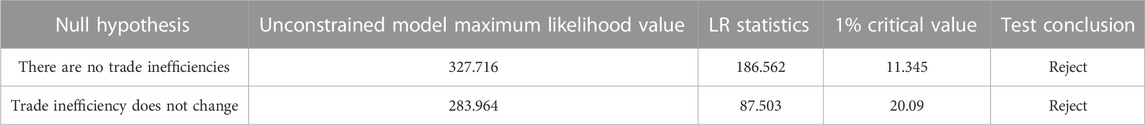
TABLE 6. Hypothesis test of SFG model.
The estimation results show that both null hypotheses are rejected, indicating that using a SFG model is feasible and that trade efficiency changes during the sample period. Therefore, using a time-varying SFG model is more appropriate. After determining the form of the function, we estimates the trade value using a SFG model. In order to compare the robustness of the results, we also presents the regression results of OLS model, time-varying model and time invariant model, as shown in Table 7.
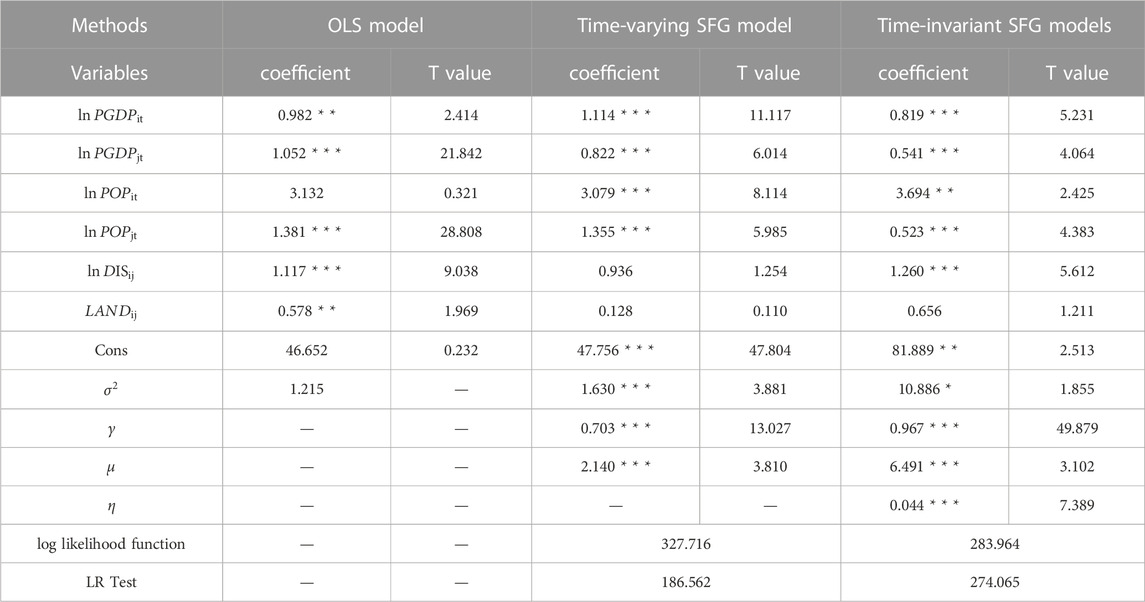
TABLE 7. Regression results of the OLS, time-varying model, time-invariant models.
From the estimation results of various parameters, the value of
The coefficient of Per capita GDP of China and RCEP countries is significantly positive, indicating that the higher the level of economic development, the more conducive to the development of green trade. Generally speaking, a country with higher GDP has a stronger demand for product consumption and trade (Cardebat and Alexandru, 2013). In terms of the value of the coefficient, the per capita GDP coefficient of China is significantly larger than that of RCEP countries, meaning that the impact of China’s economy on green trade is greater than that of RCEP countries.
The coefficient of China’s population is significantly negative, while the coefficient of the population of RCEP countries is significantly positive. On the one hand, people are the main body of consumption. Larger population means the higher demand for differentiated green products, which leads to a greater willingness to engage in international trade. On the other hand, China has a large population, and with the further increase of population, the domestic labor force will increase, which will promote the production and trade of domestic green commodities. Therefore, under the combined effect of these two factors, the effect of population on green trade is not the same in different countries.
The geographical distance coefficient between two countries is significantly negative. It shows that geographical distance plays an obstructive role in green trade. Distance increases commodity transportation cost, reduces trade profit margin and hinders the development of green trade, which is in line with theoretical expectations and the same as the research conclusion of Borchert and Yotov (2017).
The coefficient of whether it is a landlocked country is not significant. Generally speaking, landlocked countries have inconvenient transportation and are a trade hindrance factor. However, among RCEP countries, only Laos is a landlocked country and borders China. In addition to sea transportation, there are also two modes of transportation in international trade: land transportation and river transportation, so the coefficient of this variable is not significant.
4.2.2 Analysis of trade inefficiency model
We use the one-step method to estimate the inefficiency model of green trade between China and RCEP countries, as shown in Table 8. The value of

TABLE 8. Regression results of the TIE model.
Governance ability significantly hinder TIE, indicating that governance ability is a factor to improve green trade efficiency. The vast majority of RCEP members are developing countries with relatively low levels of governance capacity. Improving government governance capacity is conducive to improving the implementation efficiency and stability of trade policies, reducing trade barriers, and thus improving trade efficiency, which is in line with the empirical studies of Kamel (2021) in other regional organizations.
The coefficient of digital economy is negative, but not significant. Generally speaking, the application of the internet and digital economy can reduce the access cost of international trade, enable more high-quality enterprises to enter the international trade market and participate in green trade (Wang et al., 2022). However, the conclusion of our study is different. The reason may be that the development of digital economy in most RCEP countries is not perfect, and there are some problems of network security and cross-border privacy protection. Therefore, the promotion effect of digital economy on green trade efficiency is not significant.
Economic freedom has negative effect on TIE, indicating that economic freedom is a factor to improve green trade efficiency. Economic freedom covers a variety of indicators such as trade freedom, investment freedom and financial freedom. An open trade policy, free investment environment and sound financial financing channels help a country cope with complex trade risks, reduce the loss of trade efficiency and tap greater trade potential. Compared with the research of Sonora (2014), this paper expands the application of the study on economic freedom and trade relations in the RCEP region.
Environmental regulation difference has positive effect on TIE, indicating that environmental regulation difference is a factor hindering green trade efficiency. Among RCEP countries, there are Japan and Australia with stringent environmental regulation, and Cambodia and Laos with low degree of environmental regulation. When there is a large difference in environmental regulation between a country and China, there may be an imbalance in bilateral trade demand, making it difficult to carry out green trade, and the difference in environmental regulation becomes a barrier to trade.
There is a significant positive correlation between tariff rate and non-efficiency of trade, indicating that tariff rate is a factor hindering the efficiency of green trade. Tariff reduces a country’s import cost and plays a direct regulating role on green trade, which is similar to the conclusions of Jiang et al. (2022). The signing of RCEP has greatly reduced the tariffs of member countries. China should make good use of the tax reduction policy and implement the differential strategy to consolidate and expand the advantages of green trade products.
The coefficient of transportation facilities has passed the significance test, but the coefficient value is very small, indicating that the improvement of transportation facilities has a poor effect on improving trade efficiency. The impact of whether a country is an APEC country on green trade efficiency is not significant and does not match the expected results. The possible reason is the complexity of national relations, as APEC is only a non-binding economic forum organization and there are other trade organizations.
4.2.3 Estimation of green trade potential
We measure the potential of green trade between China and RCEP countries through trade efficiency values. According to model (4), the estimated green trade efficiency is obtained, as shown in Figure 3. When there are non-efficiency factors affecting trade, trade efficiency will be less than 1. The larger the green trade efficiency value, the greater the green trade potential, and vice versa.
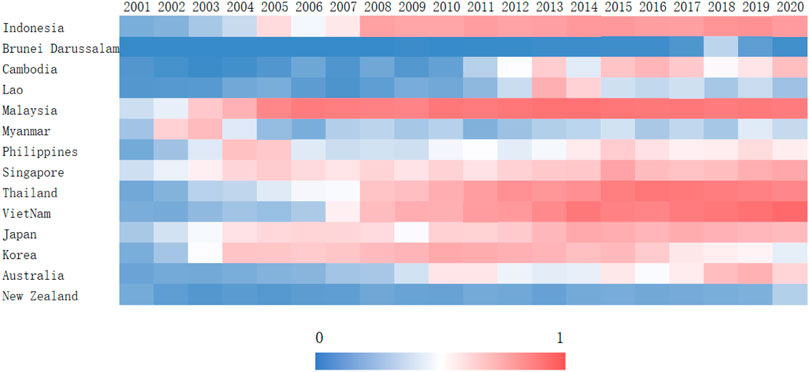
FIGURE 3. Green trade efficiency between China and RCEP countries from 2001 to 2020.
From 2001 to 2020, the average green trade efficiency of China and RCEP countries is 0.504, indicating that the trade potential between China and RCEP countries is great. During the sample period, the green trade efficiency showed an increasing trend, from 0.203 to 0.614, indicating that with the gradual improvement of bilateral trade policies, trade potential has been developed to a certain extent. In terms of regional heterogeneity of green trade efficiency, China and Malaysia have the highest green trade efficiency, with an average value of 0.807, indicating that their trade potential tends to be saturated. The green trade efficiency of China and Singapore, Japan, Thailand, Indonesia, Korea, Vietnam and Philippines is between 0.5 and 0.7, and there is still a certain trade potential. The efficiency of green trade between China and Australia, Myanmar, Lao, New Zealand and Brunei Darussalam is less than 0.5, indicating that there is great potential for green trade between China and these countries. Further taking into account the economic volume and actual trade value of the trade partners, the government should actively tap the green trade demand of Japan, South Korea and Australia, and develop the green trade potential. Since there is no research on the overall green trade efficiency measurement of RCEP countries, we compare the estimated results with the trade efficiency of Alleyne et al. (2020) and Zhang et al. (2022b). The comparison shows that the measured results of green trade efficiency are different from those of other trade efficiency, indicating that green trade has its particularity, and special research on green trade is necessary to achieve the common goal of environmental protection and trade growth.
5 Discussion
Our research found that green trade emphasizes environmental protection and sustainable development, and the green trade potential of RCEP countries is enormous. Jia et al. (2022) simulated the changes in international trade after implementing RCEP tariff reduction through GTAP, and the results showed that despite the interference of trade interest conflicts and international political factors, RCEP can still effectively promote the sustainable development of member countries, which is similar to our research findings. Natural determinants such as GDP, geographical distance, and population have a significant impact on green trade, which is consistent with theoretical expectations (Cardebat and Alexandru, 2013; Borchert and Yotov, 2017). We also found that the population of China and other RCEP countries have different impacts on trade value, which is consistent with the study of Reis et al. (2021). This is because the diverse demands of population growth promote international trade, while providing labor and technology for domestic production, which offsets international trade to some extent. In terms of human determinants, this paper found that governance ability, economic freedom improve green trade efficiency in RCEP, which is consistent with the empirical studies of Kamel (2021) and Sonora (2014). At present, scholars mainly study the impact of environmental regulations on trade and believe that there is a non-linear relationship between the two. Tsurumi et al. (2015) believes that although stringent environmental regulations hinder trade, they can promote the demand for environmentally-friendly products. We expanded on existing research and found that differences in environmental regulations are also important influencing factors in green trade.
6 Conclusion and policy implications
6.1 Conclusion
This paper calculates the green trade value between China and RCEP countries on the basis of the classification of green trade products. Then, we analyzes the time evolution trend and spatial differentiation of green trade, as well as the competitiveness and complementarity of trade products. The SFG model is further used to analyze the key influencing factors of green trade and estimate the trade potential between China and RCEP countries. The main conclusions are as follows:
From 2001 to 2020, the scale of green trade between China and RCEP countries has continued to expand, showing a trade deficit, but the trade deficit is decreasing year by year. The green trade value of Japan and South Korea with China is much higher than that of other partners, and they are the main green trade deficit countries. China’s green products have medium RCA, and their competitive advantage tends to deepen, but the competitiveness of China’s green products is still significantly lower than that of Japan and South Korea. The trade complementarity of green products between China and RCEP countries is relatively strong, especially the complementarity of RCEP countries to China’s green products is growing rapidly. There are significant country differences in the TCI, among which Brunei, South Korea and Vietnam export the most complementary green products with China, and China exports the most complementary green products with Japan, South Korea and Singapore.
The estimation results of SFG model show that Per capita GDP of China and RCEP countries and population of RCEP countries have a significant promoting effect on green trade, and the geographical distance between countries has a hindering effect on green trade. TIE is the main factor hindering bilateral green trade. The estimated results of the TIE model show that governance ability and economic freedom can promote green trade efficiency. And differences in environmental regulation and tariff rate are the key factors hindering trade efficiency.
From 2001 to 2020, the average annual green trade efficiency is 0.504, indicating huge trade potential between China and RCEP countries. During the sample period, the green trade efficiency of China and RCEP countries showed an increasing trend, which shows that with the gradual improvement of bilateral trade policies, the trade potential has been developed to a certain extent. In terms of individual countries, the green trade efficiency values of China and major green trade partners such as Japan, South Korea, Singapore, Vietnam and Australia are all lower than 0.7. We should actively tap the demand for green trade and further develop the potential of green trade.
6.2 Policy implications
Considering the results of our empirical research, we propose the following policy recommendations.
First, we need to improve governance capacity and expand economic freedom. On the one hand, the government should actively improve the procedures and rules of green trade and align policies with RCEP countries. Establish an information system that meets the requirements of RCEP origin management for the cumulative rules of RCEP origin. For the demand for investment and trade facilitation in RCEP, measures such as simplifying customs procedures and mutual recognition of product standards should be improved. Optimize the government institutional environment and enhance government governance capabilities. On the other hand, the government should avoid improper intervention in economic activities and improve the level of enterprises’ participation in RCEP competition and cooperation. And promote the formation of a unified and open market environment with orderly competition by creating a market environment based on the rule of law and facilitation.
Secondly, we should increase investment in environmental pollution control and formulate reasonable environmental regulations. Environmental regulation is not contradictory to the development of green trade. The key lies in policy design and adjustment. It is necessary to align with the RCEP national green product standards, standardize the production process of green products, strengthen environmental protection supervision and investment in environmental governance. Effectively control pollution emissions during production and packaging processes, and improve the green competitiveness of products. At the same time, the government should avoid the impact of environmental regulations on technological innovation and export competitiveness of green trade products, and truly give play to the role of environmental regulations in optimizing trade structure to promote the development of green trade between China and RCEP countries.
Third, take advantage of the opportunity of tariff reduction to open up new trade forms to expand the effect of regional economic integration. We should give full play to China’s comparative advantages, open up new green trade areas and expand our market share. It is necessary to strengthen trade with countries with huge trade potential, and actively promote the building of the China-Japan-Korea free trade area. China needs to strengthen the ties of foreign trade through RCEP, fully utilize the labor advantages of ASEAN and other countries, and accelerate the formation of an upgraded and green version of the “world factory.” Further consolidate China’s advantageous position in the global industrial division of labor, thereby forming a more diversified bond with the global value chain.
Notably, there are limitations in this paper. Due to the small volume of green trade in some RCEP countries, if green trade is classified, there may be individual countries with zero green trade value with China, which cannot be classified for regression analysis. Therefore, heterogeneity analysis has not been conducted on the influencing factors of various types of green trade. In addition, there are many influencing factors for green trade, and some data has certain time lag. More time sensitive and comprehensive analysis should be conducted on RCEP green trade in the future.
Data availability statement
The data used is available from the corresponding author on reasonable request.
Author contributions
YX: Data curation, Writing–original draft. XL: Funding acquisition, Writing–review and editing. ML: Supervision, Writing–review and editing.
Funding
The authors declare financial support was received for the research, authorship, and/or publication of this article. This work was supported by the National Social Science Foundation of China (Nr. 22BJL037).
Conflict of interest
The authors declare that the research was conducted in the absence of any commercial or financial relationships that could be construed as a potential conflict of interest.
Publisher’s note
All claims expressed in this article are solely those of the authors and do not necessarily represent those of their affiliated organizations, or those of the publisher, the editors and the reviewers. Any product that may be evaluated in this article, or claim that may be made by its manufacturer, is not guaranteed or endorsed by the publisher.
Abbreviations
APEC, Asia-Pacific Economic Cooperation; GTAP, Global Trade Analysis Project; OECD, Organization for Economic Co-operation and Development; RCA, Revealed Comparative Advantage; RCEP, Regional Comprehensive Economic Partnership; SFG, Stochastic Frontier Gravity; TCI, Trade Complementarity Index; TIE, Trade Inefficiency; UNESCAP, United Nations Economic and Social Commission for Asia and the Pacific; WB, World Bank.
References
Aigner, D., Lovell, C. A. K., and Schmidt, P. (1977). Reprint of: Formulation and estimation of stochastic frontier production function models. J. Econom. 6, 15–24. doi:10.1016/j.jeconom.2023.01.023
Alleyne, A., Zhang, Z., and Mu, Y. (2020). Sustaining international trade with China: Does ACFTA improve ASEAN export efficiency? Sustainability 12 (15), 6159. doi:10.3390/su12156159
An, H. Z., Zhong, W. Q., Chen, Y. R., Li, H. J., and Gao, X. Y. (2014). Features and evolution of international crude oil trade relationships: A trading-based network analysis. Energy 74, 254–259. doi:10.1016/j.energy.2014.06.095
APEC (2012). APEC list of environmental goods. Available from: https://www.apec.org/.
Balassa, B. (1965). Trade Liberalisation and Revealed Comparative Advantage. Manch. Sch. 33 (2), 99–123. doi:10.1111/j.1467-9957.1965.tb00050.x
Bashir, M. F., Ma, B., Hussain, H. I., Shahbaz, M., Koca, K., and Shahzadi, I. (2022). Evaluating environmental commitments to COP21 and the role of economic complexity, renewable energy, financial development, urbanization, and energy innovation: Empirical evidence from the RCEP countries. Renew. Energy 184, 541–550. doi:10.1016/j.renene.2021.11.102
Batteseg, E., and Coelli, T. J. (1992). “Frontier production functions, technical efficiency and panel data: With application to paddy farmers in India,” in International applications of productivity and efficiency analysis (Dordrecht: Springer), 149–165. doi:10.1007/978-94-017-1923-0_10
Borchert, I., and Yotov, Y. V. (2017). Distance, globalization, and international trade. Econ. Lett. 153, 32–38. doi:10.1016/j.econlet.2017.01.023
Can, M., Ahmed, Z., Mercan, M., and Kalugina, O. A. (2021). The role of trading environment-friendly goods in environmental sustainability: Does green openness matter for OECD countries? J. Environ. Manage. 295, 113038. doi:10.1016/j.jenvman.2021.113038
Can, M., Ben Jebli, M., and Brusselaers, J. (2022a). Can green trade save the environment? Introducing the Green (Trade) Openness Index. Environ. Sci. Pollut. Res. 29, 44091–44102. doi:10.1007/s11356-022-18920-w
Can, M., Oluc, I., Sturm, B., Guzel, I., Gavurova, B., and Popp, J. (2022b). Nexus between trading non-green products and environment: Introducing non-green trade openness index. Front. Environ. Sci. 10, 950453. doi:10.3389/fenvs.2022.950453
Cardebat, J. M., and Alexandru, D. (2013). Social responsibility of countries and their international trade: A gravitational approach. J. Int. Trade Econ. Dev. 22 (2), 234–252. doi:10.1080/09638199.2010.545954
Chen, J., Xie, Q., Shahbaz, M., Song, M., and Wu, Y. (2021). The fossil energy trade relations among BRICS countries. Energy 217, 119383. doi:10.1016/j.energy.2020.119383
Chen, X., Yang, Z., and Liu, X. (2008). Empirical analysis of Xinjiang’s bilateral trade: Gravity model approach. Chin. Geogr. Sci. 18, 9–16. doi:10.1007/s11769-008-0009-5
Chen, X., Yuan, L., and Song, C. (2023). Investigating merchandise trade structure in the RCEP region from the perspective of regional integration. J. Geogr. Sci. 33, 1185–1204. doi:10.1007/s11442-023-2125-7
Drysdale, P. (1969). Japan, Australia, New Zealand: The Prospect for Western Pacific Economic Integration. Econ. Rec. 45 (3), 321–342. doi:10.1111/j.1475-4932.1969.tb00174.x
Fan, M., Yu, Z., Qalati, S. A., He, D., and Hussain, R. Y. (2022). Impact of green logistics performance on china's export trade to regional comprehensive economic partnership countries. Front. Environ. Sci. 10 (5). doi:10.3389/fenvs.2022.879590
Guo, B. N., Wang, Y., Zhang, H., Liang, C. Y., Feng, Y., and Hu, F. (2023). Impact of the digital economy on high-quality urban economic development: Evidence from Chinese cities. Econ. Model. 120, 106194. doi:10.1016/j.econmod.2023.106194
Guo, Q., and Mai, Z. (2023). Do Chinese photovoltaic products have trade potential in RCEP countries? A bp neural-network-improved trade gravity model analysis. Sustainability 15, 463. doi:10.3390/su15010463
He, H., Zhang, S. Y., and Zhu, L. L. (2021). Green product quality supervision strategy in online shopping with consumer evaluation and complaint. Front. Environ. Sci. 9. doi:10.3389/fenvs.2021.702151
Hotak, S., Islam, M., Kakinaka, M., and Kotani, K. (2020). Carbon emissions and carbon trade balances: International evidence from panel ARDL analysis. Environ. Sci. Pollut. Res. 27, 24115–24128. doi:10.1007/s11356-020-08478-w
Hu, F., Xi, X., and Zhang, Y. (2021). Influencing mechanism of reverse knowledge spillover on investment enterprises' technological progress: An empirical examination of Chinese firms. Technol. Forecast. Soc. Chang. 169, 120797. doi:10.1016/j.techfore.2021.120797
Huang, J. B., Ou-Yang, Q., and Feng, C. (2020). Green trade assessment for sustainable development of Chinese ferrous metal industry. J. Clean. Prod. 249, 119382. doi:10.1016/j.jclepro.2019.119382
Huang, X., Huang, S., and Shui, A. (2021). Government spending and intergenerational income mobility: Evidence from China. J. Econ. Behav. Organ. 191, 387–414. doi:10.1016/j.jebo.2021.09.005
Jia, Z., Wang, Y., Chen, Y., and Chen, Y. (2022). The role of trade liberalization in promoting regional integration and sustainability: The case of regional comprehensive economic partnership. Plos One 17 (11), e0277977. doi:10.1371/journal.pone.0277977
Jiang, W. H., Zhang, H., and Lin, Y. Y. (2022). Trade sustainability and efficiency under the Belt and Road initiative: A stochastic frontier analysis of China’s trade potential at industry level. Emerg. Mark. Financ. Trade 58 (6), 1740–1752. doi:10.1080/1540496X.2021.1925246
Kamel, E. M. (2021). The MENA region's need for more democracy and less bureaucracy: A gravity model controlling for aspects of governance and trade freedom in MENA. World Econ. 44 (6), 1885–1912. doi:10.1111/twec.13072
Kang, S. J., and Lee, S. (2021). Impacts of environmental policies on global green trade. Sustainability 13, 1517. doi:10.3390/su13031517
Khan, Z., Muntasir, M., Dong, K., and Yang, S. (2021). The roles of export diversification and composite country risks in carbon emissions abatement: Evidence from the signatories of the Regional Comprehensive Economic Partnership agreement. Appl. Econ. 53 (41), 4769–4787. doi:10.1080/00036846.2021.1907289
Li, J. M., Dong, K. Y., Dong, X. C., and Shahbaz, M. (2022). How green trade influences pollution emissions in China: A provincial perspective. Energy Econ. 115, 106330. doi:10.1016/j.eneco.2022.106330
Liu, C., Xu, J., and Zhang, H. (2020). Competitiveness or complementarity? A dynamic network analysis of international agri-trade along the Belt and Road. Appl. Spat. Anal. Policy 13, 349–374. doi:10.1007/s12061-019-09307-5
Martinez-Zarzoso, I., Felicitas, N. D., and Horsewood, N. (2009). Are regional trading agreements beneficial? Static and dynamic panel gravity models. N. Am. Econ. Financ. 20 (1), 46–65. doi:10.1016/j.najef.2008.10.001
Maryam, J., Banday, U. J., and Mittal, A. (2018). Trade intensity and revealed comparative advantage: An analysis of Intra-BRICS trade. Int. J. Emerg. Mark. 13 (5), 1182–1195. doi:10.1108/IJoEM-09-2017-0365
Meeusen, W., and Broeck, V. J. (1977). Efficiency Estimation from Cobb-Douglas Production Functions with Composed Error. Int. Econ. Rev. 18, 435–444. doi:10.2307/2525757
Morland, C., Schier, F., and Weimar, H. (2020). The structural gravity model and its implications on global forest product trade. Forests 11 (2), 178. doi:10.3390/f11020178
Mou, N. X., Wang, C. Y., Yang, T. F., Ren, H. A., Zhang, L. X., Xu, H. Q., et al. (2022). Spatiotemporal patterns of maritime trade between China and Maritime Silk Road: Evidence from a quantitative study using social network analysis. J. Transp. Geogr. 102, 103387–111236. 103387. doi:10.1016/j.jtrangeo.2022.103387
OECD (2001). Environmental goods and services: the benefits of further global trade liberalisation. Paris: OECD, 1–116.
Park, C. Y., Petri, P. A., and Plummer, M. G. (2021). The economics of conflict and cooperation in the Asia-Pacific: RCEP, CPTPP and the US-China trade war. East Asian Econ. Rev. 25 (3), 233–272. doi:10.11644/KIEP.EAER.2021.25.3.397
Reis, M. D., Prto, S. D., and Azevedo, A. F. Z. (2021). The impacts of the world trade organization on new members. World Econ. 44 (7), 1944–1972. doi:10.1111/twec.13109
Sonora, R. J. (2014). All economic freedom is not created equal: Evidence from a gravity model. Contemp. Econ. Policy 32 (1), 30–41. doi:10.1111/coep.12023
Stenberg, L. C., and Siriwardana, M. (2016). Measuring the economic impacts of trade liberalisation on forest products trade in the Asia-Pacific region using the GTAP model. Int. For. Rev. 17 (4), 498–509. doi:10.1505/146554815817476459
Tian, K., Zhang, Y., Li, Y., Ming, X., Jiang, S. R., Duan, H. B., et al. (2022). Regional trade agreement burdens global carbon emissions mitigation. Nat. Commun. 13, 408. doi:10.1038/s41467-022-28004-5
Timbergen, J. (1962). Shaping the world economy: suggestions for an international economic policy. New York: The Twentieth Century Fund.
Tsurumi, T., Managi, S., and Hibiki, A. (2015). Do environmental regulations increase bilateral trade flows? B.E.J. Econ. Anal. Policy 15 (4), 1549–1577. doi:10.1515/bejeap-2014-0164
UNESCAP (2011). United Nations economic and social communication for Asia and the Pacific, climate-smart trade and investment in Asia and the Pacific. Available from: https://www.un.org/zh/.
Wang, Z., Yu, Z., Ma, L., and Li, A. (2022). The digital economy and the energy “internal circulation”: Evidence from China’s interprovincial energy trade. Sustainability 14 (23), 15837. doi:10.3390/su142315837
World Bank (2008). International trade and climate change: Economic, legal and institutional perspectives institute. Washington, DC: World Bank Publications, 52–72.
Xu, Y. J., Liu, S. G., and Wang, J. Y. (2022). Impact of environmental regulation intensity on green innovation efficiency in the Yellow River Basin, China. J. Clean. Prod. 373, 133789. doi:10.1016/j.jclepro.2022.133789
Yoo, I. T., and Kim, I. (2016). Free trade agreements for the environment? Regional economic integration and environmental cooperation in East Asia. Int. Environ. Agreements 16, 721–738. doi:10.1007/s10784-015-9291-8
Yue, C. Y., Lai, Y. F., Khachatryan, H., and Hodges, A. (2022). Effect of geographic distance on domestic trade: A case of the US Green industry. Agribusiness 38, 154–174. doi:10.1002/agr.21715
Zhang, C., and Wang, Z. (2023). Analysis of spatiotemporal difference and driving factors of green total factor energy efficiency in RCEP members: insights from SBM-GML and Tobit models. Environ. Sci. Pollut. Res. 30, 15623–15640. doi:10.1007/s11356-022-23270-8
Zhang, W., Li, G., and Guo, F. (2022a). Does carbon emissions trading promote green technology innovation in China? Appl. Energy 315, 119012. doi:10.1016/j.apenergy.2022.119012
Zhang, W., Yu, K. Y., and Fang, Y. Y. (2022b). A Gravity model analysis of China's trade in renewable energy goods with ASEAN countries as well as Japan and South Korea. Front. Environ. Sci. 10, 953005. doi:10.3389/fenvs.2022.953005
Zhao, G. F., and Mun, C. J. (2023). The impact of the Regional Comprehensive Economic Partnership (RCEP) on intra-industry trade: an empirical analysis using a panel vector autoregressive model. J. Korea Trade. 27 (3), 103–118. doi:10.35611/jkt.2023.27.3.103
Zhou, H. Y., Wei, S. B., Xi, X., Zhou, H. T., and Hu, H. (2021). Spatiotemporal pattern evolution in global green trade networks:Implications for health economics. Discrete Dyn. Nat. Soc. 2021, 1–15. doi:10.1155/2021/3159747
Keywords: green trade characteristic, green trade potential, stochastic frontier gravity model, trade inefficiency model, RCEP countries
Citation: Xu Y, Liao X and Li M (2023) The characteristic and potential of green trade between China and regional comprehensive economic partnership countries. Front. Environ. Sci. 11:1267413. doi: 10.3389/fenvs.2023.1267413
Received: 26 July 2023; Accepted: 28 September 2023;
Published: 11 October 2023.
Edited by:
Shigeyuki Hamori, Kobe University, JapanReviewed by:
Kashif Abbasi, Shanghai University, ChinaMuhammad Hafeez, Agricultural Research Service (USDA), United States
Copyright © 2023 Xu, Liao and Li. This is an open-access article distributed under the terms of the Creative Commons Attribution License (CC BY). The use, distribution or reproduction in other forums is permitted, provided the original author(s) and the copyright owner(s) are credited and that the original publication in this journal is cited, in accordance with accepted academic practice. No use, distribution or reproduction is permitted which does not comply with these terms.
*Correspondence: Meicun Li, bWVpY3VuMTlAMTI2LmNvbQ==