 Qi Li
Qi Li Xiaomei Kou2,3
 Wenfa Xiao
95% of researchers rate our articles as excellent or good
Learn more about the work of our research integrity team to safeguard the quality of each article we publish.
Find out more
ORIGINAL RESEARCH article
Front. Environ. Sci. , 22 September 2023
Sec. Drylands
Volume 11 - 2023 | https://doi.org/10.3389/fenvs.2023.1266169
This article is part of the Research Topic Wind-Blown Sand and Water Sediment Processes and Disaster Control Strategies in Cold and Arid Regions View all 6 articles
Soil conservation services play a vital role in regulating ecosystem services to prevent soil erosion and ensure regional ecological security. Therefore, effective evaluation and quantification of soil conservation services in the Three Gorges Reservoir Area (TGRA) are conducive to sustainable management under future global change. In this study, based on a basic database, including land use/cover data, soil data, topographic data, meteorological data, and NDVI (Normalized Difference Vegetation Index) data as the basic databases, to evaluate the temporal and spatial changes of soil conservation services in the TGRA from 1990 to 2015 at a regional-scale level using the general soil loss equation. The results showed that forest ecosystems (including coniferous and broad-leaved mixed forests, coniferous forests, shrub forests, and broad-leaved forests) made a greater contribution (69%) to regulating soil conservation in TGRA, followed by farmland ecosystems (29%). In total TGRA, large spatial variation in soil conservation, such as the highest appeared in the northern hinterland, whereas the lowest was mostly shown in the northwest with relatively frequent human activities and developed industry and agriculture. In general, soil conservation in the TGRA ecosystem gradually increased from 1990 to 2015, with a total increase of 6%. In this period, with the effective implementation of ecological projects, such as the conversion of farmland to forest and natural forest protection, the distributed proportion of forest land area in total TGRA showed a significant increase. In the meantime, the increase of vegetation coverage also helps the restoration of ecosystem structure and function and the improvement of soil conservation services. Our findings will aid our knowledge regarding the ecosystem services of the TGRA and provide implications for future sustainable land management and ecological protection.
Soil conservation services have the functions of sediment storage, vegetation conservation, and water conservation, which is an indispensable ecosystem-regulating service (Costanza et al., 1997; Marris, 2022). However, the soil is also susceptible to climate change (such as rainfall and temperature) and human disturbance (such as land use change and pollution), ultimately resulting in soil degradation (Guerra et al., 2022). It is widely known that soil erosion is the key contributor to soil degradation (Pimentel et al., 1995). China, approximately 29.8% of the land area is affected by soil erosion, is one of the most severely eroding regions in the world (Wang et al., 2016; Ministry of Water Resources of the People 's Republic of China, 2019). Globally, 75% of soil erosion was caused by agricultural activities, adversely influencing 80% of arable land and 40% of food production on agricultural lands (Pimentel, 2006). Hence, for the growing population of the world, improving and maintaining soil quality will be one of the most important and urgent challenges (Eekhout and de Vente, 2022).
Due to the proposal and improvement of quantitative prediction models for soil loss, for example, the universal soil loss equation USLE and its modified form RUSLE, soil loss can be more accurately predicted, and the spatial quantification and distribution pattern of soil conservation functions in the ecosystem is gradually concerned by ecologists (Yang et al., 2020; Singh, et al., 2023). Recently, many studies argued that soil conservation services were driven primarily by natural factors (e.g., precipitation, slope, and ndvi) and social factors (e.g., population density, GDP, and road density), and what’s more, controlled primarily by LULC in most regions (Lu et al., 2023). The main statistical methods for exploring and quantifying influencing factors of soil conservation services are multiple linear regression, correlation analysis, random forest, and geographically weighted regression (Guo et al., 2021; Xie et al., 2023).
The above mathematical-statistical methods have weak functions in spatial difference analysis and are not suitable for describing changes in land use types and spatial variances in ecosystem services (Liu et al., 2019; Rong et al., 2022). By analyzing the differences between intra and inter-layer, geographic detectors quantitatively express spatial heterogeneity. This method can not only detect data-based data but also deterministic data (type data) (Wang and Xu, 2017; Shi et al., 2023). It can also quantitatively detect the main driving factors that express a certain spatiotemporal phenomenon and the interaction between different driving factors. Compared with other spatial heterogeneity detection tools, geographic detection tools have higher interpretation efficiency.
The TGRA of China is an ecologically fragile and ecological function area with a complex and diverse geographic environment (Liu et al., 2014; Cheng et al., 2015). The TGRA plays an important role in flood regulation, water and soil conservation for the whole Yangtze River basin, and even the whole country (Huang, 2019). However, there are many serious ecological issues, such as conflicts between humans and the land, serious soil erosion, and a decrease in biodiversity in the TGRA (Peng et al., 2023). Since the 1990s, the TGRA’s restoration of vegetation and ecological construction projects have played a key role in soil erosion prevention, regulating climate, and biodiversity protection, and ensuring the safety and balance of the regional water supply (Li et al., 2013). Analyzing the spatiotemporal dynamics of soil conservation in the TGRA, not only reveals the evolution law of the erosion environment but also provides a theoretical foundation for ecological constructions and preventing soil erosion in the TGRA.
Recently, there have been numerous studies on soil erosion and soil conservation services TGRA, and the majority of the research is focused on the scale of counties and small watersheds, particularly in the Chongqing reservoir area (Shen et al., 2010; Teng et al., 2019; Huang et al., 2020; Luo et al., 2023). Nevertheless, the spatiotemporal dynamics and underlying factors influencing soil conservation services within the TGRA remain inadequately understood. Consequently, additional research is imperative to investigate the spatiotemporal fluctuations in soil conservation services and the underlying response mechanism of driving factors in the TGRA. The purpose of our study is to analyze spatial characteristics of soil conservation services for ecosystems in the TGRA and to discuss which factors will influence them. Given the intricate nature of the TGRA, this research employs data on land use/cover, topography, precipitation, soil, and ground long-term observation data to study the spatiotemporal change of soil conservation using the general soil loss equation (RUSLE). Furthermore, stepwise regression and geographic detectors are utilized to explore the underlying factors that influence soil conservation services in the TGRA. Our findings will help to improve ecosystem service efficiency and provide data support and scientific recommendations in support of sustainable ecosystem management in the TGRA.
The TGRA (between 106°49′ to 111°39′E and 28°28′ to 31°44′N) is located at the upper reach of the Yangtze River Basin in China (Liu et al., 2014) (Figure 1). It covers an area of 58,000 km2, consisting of 5% urban, 11% agroecosystems, 69% forests, and forestry lands, 1% wetland, and 14% inland watercourses. It stretches along the Yangtze River from Jiangjin District in Chongqing municipality to Yiling District in Yichang, Hubei province, which is very narrow and characterized by diverse topographic conditions, A mountainous and undulating topography with steep slopes characterizes (Li et al., 2013). It has a humid, subtropical monsoonal climate with a mean annual temperature ranging between 15°C and 19°C, a mean annual precipitation of 1,250 mm, and a relative humidity of 76% (Hao et al., 2019). The elevation ranges from 50 to 2,796.8 m (Zhao et al., 2022). The main types of soil are purple, yellow, yellow-brown, brown, lime, alluvial, and paddy soil. The subtropical evergreen broadleaved forest and warm coniferous forest are the zonal vegetation (Yan et al., 2014).
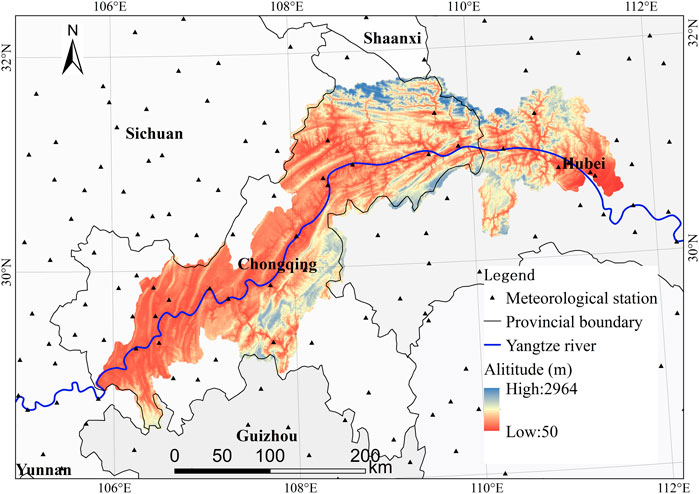
FIGURE 1. Geographical location of the Three Gorges Reservoir Area.
Combined with the 1:1,000 topographic map and other ground observation data, four periods (1990, 2000, 2010, 2015) of Landsat TM images (30 m resolution) were gained from the US Geological Survey (USGS) (https://earthexplorer.usgs.gov/). The selected year exhibited images characterized by a cloud cover of less than 5% and high imaging quality during the period spanning from June to October. A sequence of image preprocessing procedures was conducted on the obtained remote sensing images, including geometric registration, radiation processing and normalization, image mosaicing, and clipping. To analyze the characteristics of land use in the TGRA, the land was classified into 8 types, including farmland (FL), coniferous forest (CFL), mixed broadleaf-conifer forest (MBCF), broad-leaved forest (BLF), shrub land (SL) grassland (GL), water bodies (WB), and bare land (BL). The land classification was accomplished by ERDAS IMAGINE 8.7, and the overall classification accuracy was verified to exceed 87%.
The 16-day normalized difference vegetation index (NDVI) product was obtained from the MODIS product of NASA (https://ladsweb.modaps.eosdis.nasa.gov/), with a spatial resolution of 250 m. The NDVI data were used to calculate the C factor for different land cover types.
Data was gained from the National Meteorological Administration of China with high accuracy. An ANUSPLIN (Thin Plate Spline Function) interpolation method by the R 4.1.0 (http://www.r-project.org/) package was used to interpolate meteorological factors and the main variables considering the latitude and longitude, altitude, and terrain that have a significant impact on the meteorological factors. A total of 188 meteorological stations were selected in the study area and its surrounding areas (see Figure 1) to ensure the accuracy of data. To avoid the low representativeness of single-year data, average meteorological data from four time periods (1986–1990, 1996–2000, 2006–2010, and 2011–2015) were selected. Interpolate the meteorological data of 188 meteorological and hydrological stations in the research area and surrounding areas to generate a grid map with a resolution of 30 m for the corresponding year.
The soil data is derived from the National Qinghai Tibet Plateau Scientific Data Center (http://westdc.westgis.ac.cn), with a resolution of 1 km, and the dataset includes soil type, soil texture, and soil organic matter.
The DEM (Digital Elevation Model) data with a resolution of 30 m was obtained from the Geospatial Data Cloud (http://www.gscloud.cn/). DEM data is mainly used for extracting slope and slope length factors and is generated through the hydrological analysis module in Spatial Analysis.
The social and economic statistics were derived from the statistical yearbooks, forest statistics yearsbooks, and rural statistics yearbooks of counties within the research area in Chongqing municipality and Hubei province.
The data formats required for soil conservation services and driving force assessment are diverse, including land use/cover grid data, various meteorological data, socio-economic text data, and regional vector data. All kinds of data have different sources, different precision, and various storage formats. To guarantee the accessibility of data, All raster data were converted to the same WGS-84 coordinate system at a spatial resolution of 30 m.
In the context of this study, soil conservation can be defined quantitatively as the disparity between potential soil erosion and actual soil erosion. To assess the extent of soil conservation, the revised universal soil loss equation was employed to estimate both potential and actual soil erosion, with the discrepancy serving as a measure of SC service (Renard et al., 1997). The equation is represented as follows:
where SEp is the potential erosion; SEa is the actual erosion; SC is the soil conservation service t/(hm−2 a−1); R is the rainfall erosion factor (MJ mm)/(ha h year); K is the erodibility of the soil or the amount of soil lost through erosion per unit area following rainfall of a given intensity (t ha h)/(ha MJ mm); L is the slope length(m), S is the slope steepness (%); C is the vegetation cover factor (dimensionless, ranges from 0 to 1); and P is the practice factor (dimensionless, ranges from 0 to 1), which refers to the ratio of soil loss under specific conservation measures to soil loss under sloping tillage without conservation measures. Since the soil composition and topography of the study area with little changes, the K and LS coefficients were the same in 1990, 2000, 2010, and 2015.
The erosivity factor pertains to the erosive impact of precipitation on soil, which is a significant contributor to soil erosion. Wang. (2011) synthesized the findings of Zhang et al. (2002) and other researchers on the rainfall erosivity model in TGRA, and utilizing 40 years of rainfall data, developed a straightforward algorithm for calculating the rainfall erosivity R of the TGRA. The calculation formula is as follows:
Where R is the annual rainfall erosivity factor;
The soil erodibility factor reflects the sensitivity of the soil to rainfall erosion forces (Ganasri and Ramesh, 2016). The soil erodibility factor is calculated based on the data provided by the World Soil Database (HWSD) of the Scientific Data Center for the Cold and Dry Regions, using the K value estimation principle proposed by Williams et al. (1984). The soil erodibility factor is closely related to the soil’s mechanical composition (clay, sand, and silt contents) and soil organic carbon content.
The slope length-slope factor reflects the impact of topography on slope erosion and runoff (Wischmeier and Smith, 1978; Wang et al., 2015). According to the characteristics of the study area, the following formula is used to extract the slope length and steepness in ArcMap 10.8 software (ESRI, United States).
Where L is the slope length factor, S is the steepness factor, λ is the slope length (m), and θ is the slope percentage.
The vegetation cover factor reflects the effect of vegetation on soil erosion and is closely related to land use. The value of the ground cover factor depends on the vegetation coverage (Jia, 2014).
Where
Engineering practice factor refers to the improvement of soil conservation after the use of relevant engineering measures. The value of P between 0–1.0 indicates that good engineering measures have been taken, and the soil erosion amount is almost 0, while 1 indicates that no engineering measures have been taken.
Based on the regional and climatic characteristics of the TGRA, this article selects representative human and natural factors that affect soil conservation services. Among them, human activities mainly consider land use/cover types, population density, and per capita GDP; The natural environmental factors mainly consider precipitation, temperature, altitude, and slope (Table 1). In this study, stepwise regressions are fitted between soil conservation services and driving factors, and the variance contribution of each factor explains its impact on the spatial distribution of soil conservation services. In order to mitigate the mutual interference between independent variables, it is advisable to identify and retain the significant factors that contribute to the spatial heterogeneity of ecosystem services, while discarding the non-significant factors.

TABLE 1. The range of influencing factors of ecosystem services and the interval of their classification.
Furthermore, we use geographic detectors to assess the spatial heterogeneity impact of driving factors on soil protection services. The geographical detector provides a statistical method for detecting spatial association between independent and dependent variables. There are four main components of the geographical detector: risk detection, factor detection, ecological detection, and interactive detection. According to this theory, if an independent variable influences a dependent variable significantly, their spatial distributions should be also similar. The advantages of geographical detectors are: (1) They can quantitatively analyze the relative importance of various driving factors of ecosystem service changes, and (2) evaluate the combined impact of any two factors on soil conservation rate. Factor and interaction detectors were used in this study. The formula of the model is expressed as follows:
Where k was the number of strata of independent variables; Nk and N were the numbers of units in the layer and region, respectively; ρ was the variance; The larger the q value, the greater the explanatory power of the independent variable to the dependent variable. The value of q is between 0–1, the larger the q value, the greater the explanatory power of the independent variable to the dependent variable. The interaction detector compares the explanatory power of the interaction of any two influencing factors [q (X1 X2)] with the explanatory power of each single factor (q) X1 or q (X2) to evaluate the combined effect of the two influencing factors.
Spatial distributions of the four main factors that affect soil conservation in the study area are shown in Figure 2. The rainfall erosivity factor is between 3,656.64 and 8,079.30 MJ mm ha−1 h−1 yr−1, with an average value of 5,247.07 MJ mm ha−1 h−1 yr−1. The rainfall erosivity is relatively high in the hinterland of the reservoir area and south of the reservoir head, which is highly consistent with the rainfall pattern. The value if soil erosivity index K is between 0.005 and 0.075 t ha h ha−1 MJ−1 mm−1, with an average value of 0.017 t ha h ha−1 MJ−1 mm−1. The areas with high K values were mainly located in the hinterland and east of the TGRA, the soil texture is predominantly acid purple soil, gray alluvial soil and waterlogged paddy soil. The terrain factor LS is 0 in flat areas, 95.28 in mountainous and steep areas, and 9.90 in average. In 2015, the land cover coefficient C ranged between 0 and 1, with an average value of 0.07, and it had a different spatial distribution from NDVI.
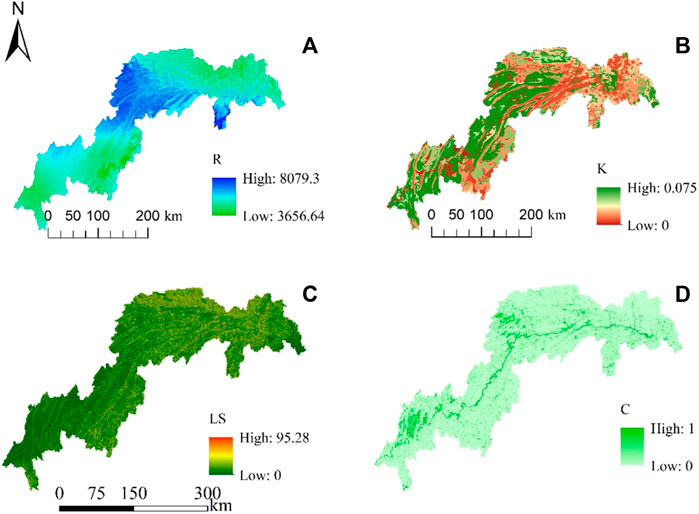
FIGURE 2. Spatial distribution of main parameters in the USLE Model. Note: (A) R factor (MJ mm ha−1 h−1 yr−1), (B) K factor (ha h ha−1 MJ−1 mm−1), (C) LS factor, (D) 2015 C factor.
The spatial-temporal variation characteristics of soil conservation services are examined at the sub-basin scale in the TGRA. The Soil conservation of ecosystem services was 49.70 billion t in 2015, and the per unit soil conservation was 716.08 t hm−2 a−1. Due to the heterogeneity of ecological environmental factors such as vegetation cover, terrain, soil, and meteorology, the geospatial patterns of soil conservation display a clear spatial heterogeneity in the TGRA (Figure 3). The regions exhibiting elevated soil conservation values were predominantly concentrated in the northern hinterland of the reservoir area. In this particular region, the extent of forest coverage exceeds that of the entire reservoir area, thereby facilitating the efficient interception of precipitation by the forest canopy. Furthermore, the limited human activities in this region contribute to the relatively low occurrence of actual soil erosion. Conversely, the region demonstrates a substantial potential for soil erosion owing to the copious amount of rainfall it receives. The lower soil conservation values are mainly distributed in the northwest in the TGRA, which is characterized by frequent human activities and relatively developed industries and agriculture. The region primarily encompasses the central urban area of Chongqing, along with the adjacent Changshou County, Fengdu County, and Zhongxian County. Within these localities, there is a notable deficiency in vegetation coverage, and the forested land predominantly consists of man-made or secondary forests, resulting in substantial soil erosion. Furthermore, the terrain in the area is relatively flat, farmland area is relatively high, and soil erosion is relatively high, resulting in low soil conservation.

FIGURE 3. The distribution of soil conservation per unit area during 1990–2015 in the TGRA.
During the whole study period from 1990 to 2015, the spatial distribution of soil conservation and its maximum value differ, but the overall pattern is similar (Figure 4). The soil conservation per unit area in the TGRA for the years 1990, 2000, 2010, and 2015 were recorded as 678.31, 711.26, 716.12, and 716.08 t hm−2 a−1, correspondingly. Despite a marginal decline in soil conservation per unit area observed between 2010 and 2015, there was an overall increase in soil conservation throughout the entirety of the study period. During 1990–2015, the per unit soil conservation in the TGRA increased from 678.31 t hm−2 a−1 in 1990 to 716.08 t hm−2 a−1 in 2015, with a total increase of 6%. According to the analysis of the grid map of soil conservation services in 2015 minus the grid map in 1990, the area in which soil conservation services increased account for 95.95% of the TGRA, while the area in which soil conservation decreased account for only 4.05% of the TGRA. It is evident from the topographic map that soil conservation services are declining mostly in the main urban area of Chongqing, Yiling District, Wanzhou District, reservoir banks and county seat. These regions have a relatively high concentration of human social activity and the highest level of urbanization, and farmland and urban construction land account for a relatively high proportion.
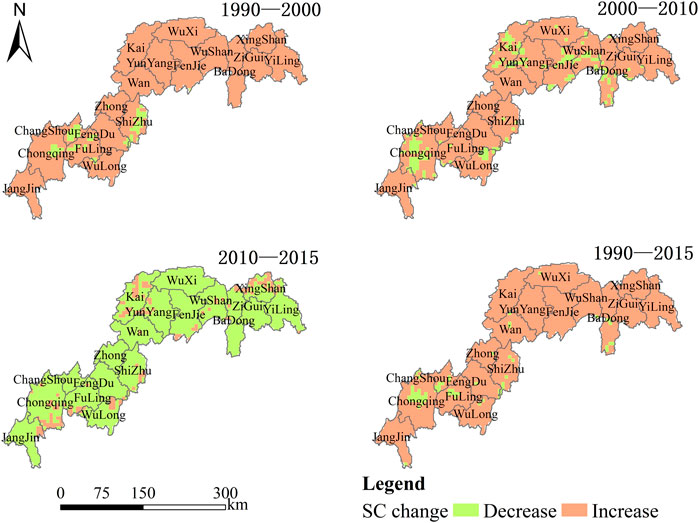
FIGURE 4. The change of soil conservation per unit area during 1990–2015 in the TGRA.
In 2015, the total amount of soil conservation services of forest ecosystem (coniferous forest, coniferous and broad-leaved mixed forest, shrub forest, broad-leaved forest) was the highest (34.50 billion tons), accounting for 69% of the total soil conservation in the TGRA, and was the main contributor of soil conservation services in the TGRA. Agricultural ecosystems take second place in soil conservation, accounting for 29%, and their ecosystem area is second only to forests (Table 2). From the perspective of soil conservation capacity per unit area, different land use/cover types exhibit varying capacities. The broad-leaved forest exhibited the highest soil conservation, with an average of 1,268.72 t hm−2 a−1. Conversely, the artificial surface displays the lowest soil conservation capacity, with an average of 171.23 t hm−2 a−1.
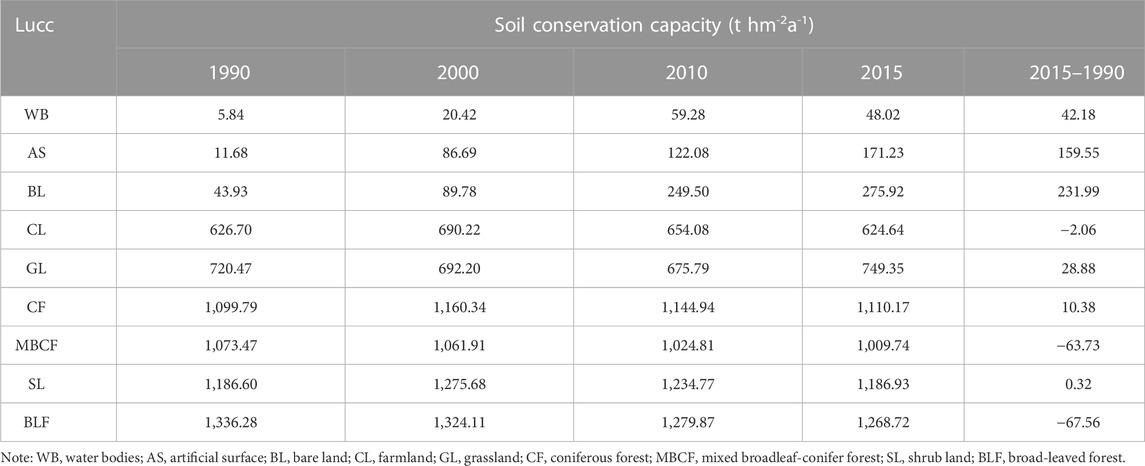
TABLE 2. The per unit area values of soil conservation of different LUCC on TGRA between.
The spatial distribution and temporal changes in soil conservation services demonstrate spatial heterogeneity and temporal variability as a result of the combined influence of natural factors and human activities. The analysis results presented in Table 3 demonstrate that the stepwise regression R2 value for the primary influencing factors of soil conservation services exceeds 0.9, indicating a strong relationship between the dependent and independent variables. The fitted equation effectively captures the impact of independent variables on the dependent variable. Specifically, soil conservation exhibits a negative correlation with per capita GDP and the proportion of farmland area, while displaying a positive correlation with other driving factors.
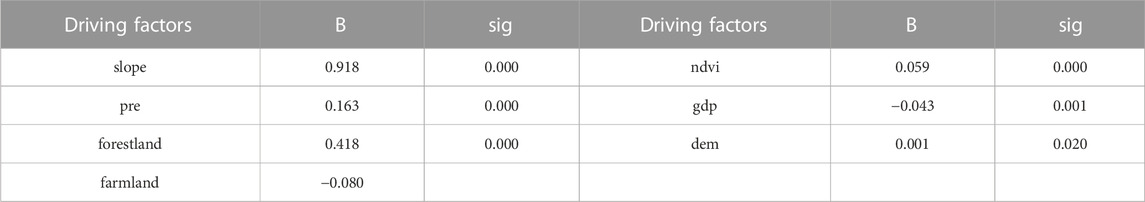
TABLE 3. The influence factors of soil conservation services.
Based on the results of geographical detectors (Figure 5), The explanation of factors affecting soil conservation services is given below: Slope > altitude > proportion of forest land area > proportion of farmland area > per capita gdp > ndvi. There is a higher q value for slope and altitude in topographic factors, which are the main factors affecting the spatial pattern distribution of soil conservation, followed by the proportion of forest land area. Combined with the results of stepwise regression analysis, the per unit soil conservation amount increases with elevation, slope, and forest land proportion. In part, this may be due to the complex geography of the TGRA. A large number of broad-leaved forests and coniferous forests are situated in deep ravines, high topography and deep ravines. Additionally, human activity is relatively low in these areas, and soil conservation is relatively strong. In other words, the larger the topo-graphic relief, the greater the surface runoff, resulting in more soil erosion and consequently less soil retention.
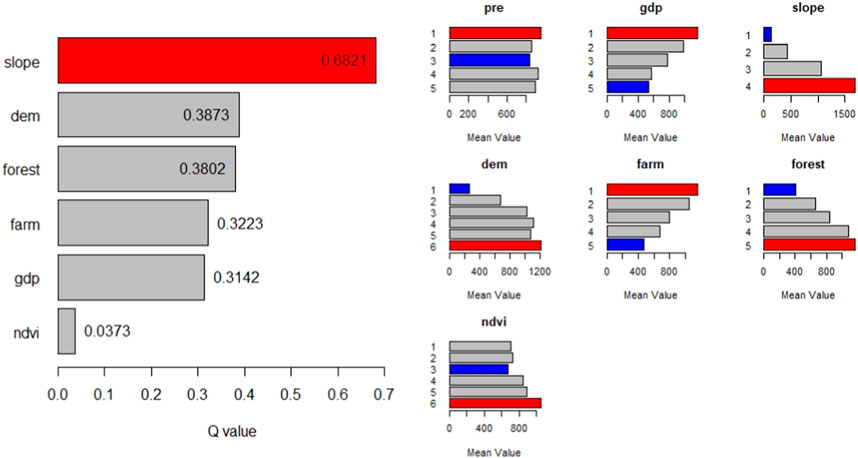
FIGURE 5. The q values of influencing factors in the TGRA.
As compared with a single impact factor, two impact factors interacting in pairs had greater explanatory power. According to the soil conservation interaction detection results (Figure 6), the slope has significantly greater interaction than other variables, and the slope of the land is the primary factor that affects the spatial distribution of soil conservation services. Among them, the interaction value q of slope factor and altitude factor is 0.7153, which is significantly higher than the interaction of other factors, while the cross value of slope factor and rainfall factor is 0.7110. The results indicate that slope and altitude are the most important influencing factors for soil conservation, and the comprehensive impact of slope and rainfall on soil conservation services is also very high. As a result, the larger the topographic relief, the greater the surface runoff, resulting in more soil erosion and therefore less soil retention. The TGRA is surrounded by complex terrain and steep slopes. Vegetation restoration and afforestation should be carried out on steep slope farmland to reduce surface runoff, reduce large area of water and soil loss and increase soil conservation.
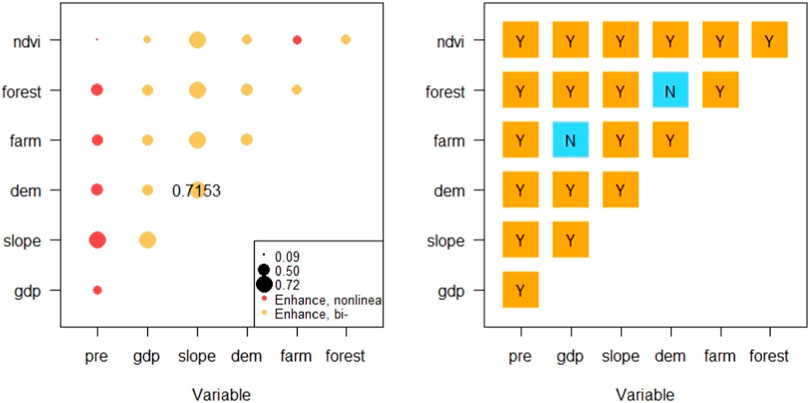
FIGURE 6. The dominant interactions between two covariates in the TGRA.
Rainfall is one of the most important factors affecting soil conservation. In addition, ecological engineering construction such as natural forest protection and conversion of farmland to forests also contribute significantly to regional soil conservation. In order to clarify the impact of rainfall and human activities on soil conservation services in the TGRA, a Pearson correlation analysis was used to examine the relationship between soil conservation, rainfall, and NDVI, and the spatial heterogeneity of the relationship was explored, and NDVI was used as a proxy for vegetation change caused by human activities. According to Figure 7, there is a significant positive correlation between soil conservation and NDVI in most parts of the reservoir area and a negative correlation in a few parts. The relation between soil conservation and rainfall is mainly correlated with a non-significant positive correlation and a significant positive correlation, and it is particularly significant in the areas with more forest area in the north of the hinterland in TGRA. The areas with a negative correlation between soil conservation and rainfall are mainly distributed in the north of the reservoir head, the south of the reservoir belly, and the north of the reservoir area. This study considers that a high rainfall area has a higher potential for soil erosion, as a result, the simulation results of soil conservation will be high. This study’s findings are similar to those of Zhang et al. (2002) and Teng et al. (2019). However, Liu et al. (2014) and Liu. (2019) believed that increased rainfall aggravated soil erosion and led to the reduction of soil conservation. This may be due to the fact that soil conservation services are influenced by many factors, and those factors differ from region to region.
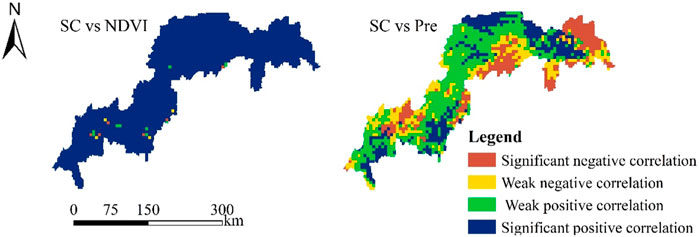
FIGURE 7. Relationship between soil conservation services, NDVI, and rainfall.
Soil conservation is the soil erosion reduced by the ecosystem, which plays an important role in maintaining soil nutrients, preventing land degradation, and reducing river sediment deposition. The TGRA holds significant importance as an ecological function area for soil and water conservation in China. The adoption of proactive policies, including the protection of the Yangtze River forest, the preservation of natural forests, and the conversion of farmland to forest initiatives has effectively facilitated the restoration of the ecosystem’s structure and functionality within the TGRA. Moreover, the alteration in land use and cover has contributed to a reduction in soil erosion. Under conditions of minimal precipitation fluctuations, soil conservation efforts in the TGRA have witnessed an increase, thereby enhancing the provision of soil conservation services. Based on the findings from the analysis conducted at the district and county levels, it is evident that there has been a notable increase in soil conservation within Yunyang County, Fengjie County, Wushan County, and Kai County, situated in the central region of the reservoir area. This increase is characterized by a relatively substantial growth rate, which aligns with the spatial distribution of forest area changes in the reservoir area. Additionally, other scholars concur that the forest’s capacity for soil conservation surpasses that of other vegetation types in the TGRA. The presence of forests can contribute to the ecosystem’s ability to mitigate soil erosion through the interception of precipitation by the forest canopy and the stabilization of soil through vegetation root systems. Moreover, in the TGRA, forested regions and nature reserves are typically found in areas with higher elevations and slopes, resulting in extensive forest coverage and a heightened potential for soil erosion. Consequently, forested land exhibits a significantly higher rate of soil conservation compared to other ecosystems.
It should be noted that the land use data was collected by interpreting Landsat TM/ETM image (30 m), combined with meteorological data and soil data to calculate soil conservation. Due to the difficulty of obtaining data, the DEM data and soil data used in this study are of the same period, and the soil erodibility factor and slope length factor are unchanged. But, in fact, the land use/cover of the TGRA has changed dramatically, there may be local differences in slope and slope length factors over time, and the change of soil type will also lead to small changes in the soil erodibility factor, which will lead to a certain deviation in the research results (Zhao et al., 2022). Finally, the evaluation model is mainly based on GIS spatial analysis, and data errors are unavoidable in the calculation, but the regional soil conservation distribution pattern and spatiotemporal changes can still be fully reflected. How to enrich the data sources and to improve the accuracy of the assessment, deeply consider the interaction mechanism of various environmental factors, and identifying the driving mechanism of regional soil erosion and soil conservation will be the important direction of the next research.
When analyzing the driving factors behind soil conservation services, the utilization of geographical detectors can effectively demonstrate the significance of the influencing factors on soil conservation services. Additionally, the outcomes of correlation analysis can directly unveil the directional relationship that impacts soil conservation services. However, these methods do not comprehensively elucidate the underlying mechanisms and internal processes that influence the provision of soil conservation services. The present study acknowledges that the human-natural driving factors of soil conservation services cannot comprehensively encompass all potential influencing variables, primarily due to the scarcity of pertinent data and the challenges associated with quantitatively representing these variables. Notably, specific social factors, including the relative proportions of three industries, can exert a substantial influence on the effects of soil conservation services. As a result, forthcoming assessments require heightened investment in temporal and human resources for the acquisition of data and parameters. Additionally, it is crucial to validate the evaluation outcomes through comparison with measured results to enhance the accuracy of data and the efficacy of evaluation.
During the period from 1990 to 2015, the total amount of soil conservation in the TGRA showed an overall upward trend, with the spatial pattern showing the distribution characteristics being high in the north of the hinterland of the reservoir area. The implementation of ecological projects such as ecological afforestation and conversion of cropland to forest and grassland has significantly increased the average vegetation coverage in the TGRA. Soil conservation function is closely related to ecosystem type and coverage. In the TGRA, coniferous mixed forests have the strongest soil conservation potential. The spatial characteristics of soil conservation services in the TGRA were primarily affected by topographic factors (slope, altitude) and forest land area ratio. The interaction effect between two influencing factors can enhance their explanatory powers regarding soil conservation. The combination of slope and altitude was most significant, followed by slope and precipitation. The TGRA is a very important ecological functional area in China. In accordance with comprehensive ecological protection and management, increasing vegetation cover, reducing interference intensity, and afforestation will improve soil conservation services in the TGRA.
The original contributions presented in the study are included in the article/Supplementary Material; further inquiries can be directed to the corresponding author.
QL: Writing–review and editing, Conceptualization, Methodology. XK: Writing–review and editing, Methodology. LN: Writing–original draft, Conceptualization, Methodology. XX: Writing–review and editing, Formal Analysis, Funding acquisition, Resources. WX: Writing–review and editing. JZ: Writing–review and editing, Funding acquisition, Resources.
The author(s) declare financial support was received for the research, authorship, and/or publication of this article. This work was supported by the National Key Research and development program of China (2017YFC050530201) and the National Social Science Fund of China (21BJY187).
Authors QL, XK, and LN were employed by Power China Northwest Engineering Corporation Limited.
The remaining authors declare that the research was conducted in the absence of any commercial or financial relationships that could be construed as a potential conflict of interest.
All claims expressed in this article are solely those of the authors and do not necessarily represent those of their affiliated organizations, or those of the publisher, the editors and the reviewers. Any product that may be evaluated in this article, or claim that may be made by its manufacturer, is not guaranteed or endorsed by the publisher.
Cheng, H., Wu, S., Wang, X., Jiang, Y., Chen, C., Wang, Y., et al. (2015). Research progress on the effects of the Three Gorges Reservoir on the ecological environment. Zhongguo Shengtai Nongye Xuebao/Chinese J. Eco-Agriculture 23 (2), 127–140. doi:10.13930/j.cnki.cjea.140734
Costanza, R., d'Arge, R., De Groot, R., Farber, S., Grasso, M., Hannon, B., et al. (1997). The value of the world's ecosystem services and natural capital. nature 387 (6630), 253–260. doi:10.1038/387253a0
Eekhout, J. P., and de Vente, J. (2022). Global impact of climate change on soil erosion and potential for adaptation through soil conservation. Earth-Science Rev. 226, 103921. doi:10.1016/j.earscirev.2022.103921
Ganasri, B. P., and Ramesh, H. (2016). Assessment of soil erosion by RUSLE model using remote sensing and GIS-A case study of Nethravathi Basin. Geosci. Front. 7 (6), 953–961. doi:10.1016/j.gsf.2015.10.007
Guerra, C. A., Berdugo, M., Eldridge, D. J., Eisenhauer, N., Singh, B. K., Cui, H., et al. (2022). Global hotspots for soil nature conservation. Nature 610 (7933), 693–698. doi:10.1038/s41586-022-05292-x
Guo, L., Liu, R., Men, C., Wang, Q., Miao, Y., Shoaib, M., et al. (2021). Multiscale spatiotemporal characteristics of landscape patterns, hotspots, and influencing factors for soil erosion. Sci. Total Environ. 779, 146474. doi:10.1016/j.scitotenv.2021.146474
Hao, B., Ma, M., Li, S., Li, Q., Hao, D., Huang, J., et al. (2019). Land use change and climate variation in the three gorges reservoir catchment from 2000 to 2015 based on the google earth engine. Sensors 19 (9), 2118
Huang, C. B. (2019). Research on regulating forest landscape of the Three Gorges Reservoir area based on ecosystem service. Huazhong Agricultural University, 000125. doi:10.27158/d.cnki.ghznu.2019.000125
Huang, C., Zhou, Z., Teng, M., Wu, C., and Wang, P. (2020). Effects of climate, land use and land cover changes on soil loss in the Three Gorges Reservoir area, China. Geogr. Sustain. 1 (3), 200–208. doi:10.1016/j.geosus.2020.08.001
Jia, F. F. (2014). InVEST model based ecosystem services evaluation with case case study on ganjiang River Basin. China University of Geosciences.
Li, Y. C., Liu, C. X., Min, J., Wang, C. J., Zhang, H., and Wang, Y. (2013). RS/GIS-based integrated evaluation of the ecosystem services of the Three Gorges Reservoir area(Chongqing section). Acta Ecol. Sin. 33 (1), 0168–0178. doi:10.5846/stxb201107020989
Liu, C., Wu, X., and Wang, L. (2019). Analysis on land ecological security change and affect factors using RS and GWR in the Danjiangkou Reservoir area, China. Appl. Geogr. 105, 1–14. doi:10.1016/j.apgeog.2019.02.009
Liu, D. Q. (2019). Spatiotemporal tradeoff and synergy of watershed ecosystem services:a case study of bailongjiang watershed in gansu. CNKI.
Liu, Q. G., Peng, D. L., Shi, P. C., Huang, G. S., and Wang, X. J. (2014a). Evaluation of forest ecosystem services in three gorges reservoir area. J. Northeast For. Univ. 11, 62–66. doi:10.13759/j.cnki.dlxb.20141106.017
Liu, Y., Wang, Y. J., Wang, H. X., Wang, Y. Q., Sun, S. Q., Qin, F. H., et al. (2014b). Function and value assessment of soil and water conservation under six patterns of the grain to green program in the three gorges reservoir area of the Yangtze River. Sci. Soil Water Conservation 12 (6), 50–58. doi:10.3969/j.issn.1672-3007.2014.06.008
Lu, R., Dai, E., and Wu, C. (2023). Spatial and temporal evolution characteristics and driving factors of soil conservation services on the Qinghai-Tibet Plateau. CATENA 221, 106766. doi:10.1016/j.catena.2022.106766
Luo, Z., Chen, X., Li, N., Li, J., Zhang, W., and Wang, T. (2023). Spatiotemporal foresting of soil erosion for SSP-rcp scenarios considering local vegetation restoration project: A case study in the three gorges reservoir (tgr) area, China. J. Environ. Manag. 337, 117717. doi:10.1016/j.jenvman.2023.117717
Marris, E. (2022). A call for governments to save soil. Nature 601, 503–504. doi:10.1038/d41586-022-00158-8
Ministry of Water Resources of the People 's Republic of China (MWR) (2019). Monitoring bulletin of China's soil erosion. Editorial Department of the Bulletin of the Ministry of Water Resources.
Peng, C., Wang, Y., Dong, J., and Huang, C. (2023). Impact of land use change on the habitat quality evolution in three gorges reservoir area, China. Int. J. Environ. Res. Public Health 20 (4), 3138. doi:10.3390/ijerph20043138
Pimentel, D., Harvey, C., Resosudarmo, P., Sinclair, K., Kurz, D., McNair, M., et al. (1995). Environmental and economic costs of soil erosion and conservation benefits. Science 267, 1117–1123. doi:10.1126/science.267.5201.1117
Pimentel, D. (2006). Soil erosion: A food and environmental threat. Environ. Dev. Sustain. 8, 119–137. doi:10.1007/s10668-005-1262-8
Renard, K., Foster, G., Weesies, G., McCool, D., and Yoder, D. (1997). Predicting soil erosion by water: A guide to conservation planning with the revised universal soil loss equation (RUSLE). Washington: USDA-ARS.
Rong, Y., Li, K., Guo, J., Zheng, L., Luo, Y., Yan, Y., et al. (2022). Multi-scale spatio-temporal analysis of soil conservation service based on mgwr model: A case of beijing-tianjin-hebei, China. Ecol. Indic. 139, 108946. doi:10.1016/j.ecolind.2022.108946
Shen, Z., Gong, Y., Li, Y., and Liu, R. (2010). Analysis and modeling of soil conservation measures in the three gorges reservoir area in China. Catena 81 (2), 104–112. doi:10.1016/j.catena.2010.01.009
Shi, H., Wang, P., Zheng, J., Deng, Y., Zhuang, C., Huang, F., et al. (2023). A comprehensive framework for identifying contributing factors of soil trace metal pollution using Geodetector and spatial bivariate analysis. Sci. Total Environ. 857, 159636. doi:10.1016/j.scitotenv.2022.159636
Singh, M. C., Sur, K., Al-Ansari, N., Arya, P. K., Verma, V. K., and Malik, A. (2023). GIS integrated RUSLE model-based soil loss estimation and watershed prioritization for land and water conservation aspects. Front. Environ. Sci. 11, 1136243. doi:10.3389/fenvs.2023.1136243
Teng, M., Huang, C., Wang, P., Zeng, L., Zhou, Z., Xiao, W., et al. (2019). Impacts of forest restoration on soil erosion in the Three Gorges Reservoir area, China. Sci. Total Environ. 697, 134164. doi:10.1016/j.scitotenv.2019.134164
Wang, J. F., and Xu, C. D. (2017). Instrumental networking and social network building: How horizontal networking and upward networking create social capital. Acta Geogr. Sin. 72 (1), 116–134. doi:10.3724/sp.j.1041.2017.00116
Wang, J., Sun, G., Luo, Z., and Liu, K. (2015). Relationship between topography and the distribution of understory vegetation in a Pinus massoniana forest in Southern China. Environ. Sci. Technol. (China) 38 (12), 291–304. doi:10.1016/j.iswcr.2015.10.002
Wang, X., Zhao, X., Zhang, Z., Yi, L., Zuo, L., Wen, Q., et al. (2016). Assessment of soil erosion change and its relationships with land use/cover change in China from the end of the 1980s to 2010. Catena 137, 256–268. doi:10.1016/j.catena.2015.10.004
Williams, J., Jones, C. A., and Dyke, P. T. (1984). Modeling approach to determining the relationship between erosion and soil productivity. Trans. Am. Soc. Agric. Eng. 27 (1), 129–144. doi:10.13031/2013.32748
Wischmeier, W. H., and Smith, D. D. (1978). “Predicting rainfall erosion losses:a guide to conservation planning,” in Agriculture handbook (USA: USDA-ARS).
Xie, X., Wang, X., Wang, Z., Lin, H., Xie, H., Shi, Z., et al. (2023). Influence of landscape pattern evolution on soil conservation in a red soil hilly watershed of southern China. Sustainability 15 (2), 1612. doi:10.3390/su15021612
Yan, E. P., Lin, H., Wang, G. X., and Xia, C. Z. (2014). Analysis of evolution and driving force of ecosystem service values in the Three Gorges Reservoir region during1990-2011. Acta Ecol. Sin. 34 (20), 5962–5973. doi:10.5846/stxb201312263032
Yang, L. W., Wang, D. Y., Wang, Z. Y., Liang, Z., Wu, S., and Li, S. (2020). Quantitative assessment of the supply-demand relationship of soil conservation service in the Sushui River Basin. Resour. Sci. 42, 2451–2462. doi:10.18402/resci.2020.12.15
Zhang, W. B., Xie, Y., and Liu, B. Y. (2002). Rainfall erosivity estimation using daily rainfall amounts. Sci. Geogr. Sinica/Dili Kexue 22 (6), 711–716. doi:10.12249/j.cnki.sgs.2002.06.012
Keywords: soil conservation, spatiotemporal variation, driving factors, Three Gorges Reservoir area, geographic detectors
Citation: Li Q, Kou X, Niu L, Xia X, Xiao W and Zhu J (2023) Spatiotemporal variations and its driving factors of soil conservation services in the Three Gorges Reservoir area in China. Front. Environ. Sci. 11:1266169. doi: 10.3389/fenvs.2023.1266169
Received: 24 July 2023; Accepted: 04 September 2023;
Published: 22 September 2023.
Edited by:
Jun'E Liu, Shaanxi Normal University, ChinaReviewed by:
Guanghui Ming, Yellow River Conservancy Commission, ChinaCopyright © 2023 Li, Kou, Niu, Xia, Xiao and Zhu. This is an open-access article distributed under the terms of the Creative Commons Attribution License (CC BY). The use, distribution or reproduction in other forums is permitted, provided the original author(s) and the copyright owner(s) are credited and that the original publication in this journal is cited, in accordance with accepted academic practice. No use, distribution or reproduction is permitted which does not comply with these terms.
*Correspondence: Jianhua Zhu, emh1Y29vbEBjYWYuYWMuY24=
Disclaimer: All claims expressed in this article are solely those of the authors and do not necessarily represent those of their affiliated organizations, or those of the publisher, the editors and the reviewers. Any product that may be evaluated in this article or claim that may be made by its manufacturer is not guaranteed or endorsed by the publisher.
Research integrity at Frontiers
Learn more about the work of our research integrity team to safeguard the quality of each article we publish.