 Barbora Gontkovičová
 Emília Duľová Spišáková
94% of researchers rate our articles as excellent or good
Learn more about the work of our research integrity team to safeguard the quality of each article we publish.
Find out more
ORIGINAL RESEARCH article
Front. Environ. Sci., 18 September 2023
Sec. Environmental Economics and Management
Volume 11 - 2023 | https://doi.org/10.3389/fenvs.2023.1264770
This article is part of the Research TopicChanges in the Approach to Energy Concerns and their Impact on the Economy and the EnvironmentView all 6 articles
European member states have taken several systematic steps on the way to become low-carbon and resource-efficient economies since the adoption of the Europe 2020 Strategy. The long-term targets in the field of climate and energy challenges is currently being continued and developed through the sustainable development goals (SDGs) of the 2030 Agenda. In order to assess the current situation and progress in the given area, it is necessary to consistently analyze the results that the member states have achieved during the validity of the Europe 2020 Strategy. Therefore, the aim of the article is to analyze and assess the degree of fulfilment of Europe 2020 targets by EU member states in the field of the environment with a subsequent link to the targets of the 2030 Agenda. We compared the values of the selected indicators (Share of renewable energy in gross final energy consumption (RER), Final energy consumption (FEC), Primary energy consumption (PEC) and Net greenhouse gas emissions (GHG) in the EU Member States with the national goals of the selected countries by application of multivariate comparison methods, namely, the ranking method, the scoring method and the distance method. Among the countries that achieved the best results in the evaluation were Greece, Romania and Estonia. On the other hand, in the sample of countries, there were four, namely, France, Ireland, Austria and Belgium, which did not meet the targets and based on the prediction, they will not achieve them even by 2025.
The topic of the environment and sustainable development has received significantly increased attention in recent years. The start of the Environmental policy of European Union (EU) is usually dated to the meeting of the European Council in Paris in 1972, at which heads of state or government (after the first UN conference on the environment) declared the need for a Community environmental policy (European Parliament, 2023). Despite its primarily economic origins, the EU has become one of the main international actors in the protection of the environment (Mathis, 2020). In addition to developing its own environmental policy, it is an active participant in global initiatives. The EU is the contracting party to the United Nations Framework Convention on Climate Change (UNFCCC), which was adopted at the Earth Summit in Rio de Janiero, Brazil in 1992. It recognized the need for the international community to act together to protect people and the environment and limit greenhouse gas emissions. Almost every country in the world has ratified it. The EU initiative in the field of environmental protection was also reflected in the Europe 2020 Strategy adopted in 2010 (European Commission, 2010). The key components of the climate and energy targets were renewable energy sources, reduction of greenhouse gas emissions and energy efficiency. The EU and all its member states have also signed and ratified the Paris Agreement, which was adopted in 2015 at the meeting of the parties to the UNFCCC. With the Paris Agreement, countries not only renewed their commitment to climate action, but they also agreed on new targets to accelerate efforts to limit the global warming. In accordance with this commitment, EU member states have agreed to step out on the way to becoming the first climate-neutral economy and society by 2050 (Council of the EU and the European Council, 2023). In the same year, the United Nations General Assembly unanimously adopted the document “Transforming our World: the 2030 Agenda for Sustainable Development” (United Nations, 2015). The main goal of 2030 Agenda is to achieve sustainable development in the economic, social, and environmental fields by 2030 in a balanced and integrated way. The Sustainable Development Goals are universally applicable to all countries. While the 2030 Agenda is not legally binding, the EU is committed to being a pioneer in their implementation (European Commission, 2016). The 2030 Agenda, together with the Paris Agreement on climate change, outlines the way to make the world a better place and to create a global framework for international cooperation in the field of sustainable development and its economic, social, environmental and governance dimensions (European Commission, 2023a). The European Green Deal (EGD), which represents a package of political initiatives whose purpose is to direct the EU on the way of green transformation with the ultimate goal of achieving climate neutrality by 2050, brought a new impetus to climate policy and measures at the EU level (European Commission, 2019). The EGD was presented on 11 December 2019, in Brussels and is part of the strategy for fulfilling the 2030 Agenda for Sustainable Development and the commitments made under the Paris Agreement. Subsequently, the European Council adopted the European Climate Law in June 2021, which is a key element of the EGD. Climate regulation should bring benefits such as cleaner air, water and soil, reduced energy bills, renovated homes, better public transport and more charging stations for e-cars, less waste, healthier food, and improved health for current and future generations. By adopting of European Climate Law, the EU and its member states have committed to reducing net greenhouse gas emissions in the EU by at least 55% compared to 1990 levels by 2030. Also, the political ambition to achieve climate neutrality by 2050 turns into a legal obligation of the EU (Council of the EU and the European Council, 2023).
The activities of the EU in the field of environment have a long-term nature. Currently, the importance of environmental policies is even stronger. The green economy efforts of the Member states are now even more important than ever, due to the context of today’s global energy crisis and economic uncertainty caused by challenges, such as the COVID-19 pandemic or the Russian invasion of Ukraine (Siksnelyte-Butkiene et al., 2022). However, each political initiative and strategy to be successful requires a precise setting of quantitative indicators enabling the assessment of its degree of fulfillment. Therefore, the article focuses on the assessment of the level of achievement of national goals resulting from the Europe 2020 Strategy in the field of climate change and energy. We assume that the evaluation of the achievement of the goals of the Europe 2020 Strategy in the field of climate and energy is not sufficiently analyzed. For this reason, we decided to assess the values achieved in 2020 in EU member states—as outputs for the Europe 2020 Strategy, but also as values that shape new goals and policies in the field of energy and climate, not only for the present, but also for the future. However, it also refers to the connection and continuity of these targets with the goals of the 2030 Agenda for Sustainable Development, which are again ambitious. Some authors already point out that they may not be achieved.
In addition to active participation of the EU in the mentioned global initiatives, sustainable growth was one of the priorities of the Europe 2020 Strategy. The transformation of the EU into a smart, sustainable and inclusive economy included the supporting greener and more competitive economy and a more efficient use of resources. The European Commission set three targets in the field of climate change and energy (known as “20/20/20”), s on individual EU member states. These were the following goals.
• Reduce greenhouse gas emissions by at least 20% compared to 1990 levels;
• Increase the share of renewable energy sources in final energy consumption to 20%;
• Achieve a 20% increase in energy efficiency (European Commission, 2010).
The two flagship initiatives “An industrial policy for the globalization era” and “Resource efficient Europe” were supposed to catalyze the progress.
The Europe 2020 Strategy was completed in 2020. Currently, Sustainable Development Goals of 2030 Agenda and the Green Deal superseded it (Becker et al., 2020). Within this Agenda, the seventh goal “Affordable and clean energy” and the 13th goal “Climate action” follow the original goals of the Europe 2020 Strategy (United Nations, 2015). Alignment of the SDGs in the Member States was facilitated by the fact that the targets and indicators of the Europe 2020 Strategy correspond to the logic of the 2030 Agenda and the SDGs (Dugarova et al., 2017). This is evidenced by Table 1, which points to the connection between the targets of the Europe 2020 Strategy and the goals of the 2030 Agenda for Sustainable Development. The first original target focused on renewable energy resources is captured in partial goal 7.2 entitled “Increase substantially the share of renewable energy in the global energy mix.” The target value for the EU increased from 20% to 42.5% by 2030. The second original partial target related to energy efficiency was translated into partial goal 7.3 entitled “Double the global rate of improvement in energy efficiency” and the target value was also increased from 20% to 32.5% in the EU by 2030. The last original partial target of the Europe 2020 Strategy in the area of Climate change and energy was a target related to the reduction of greenhouse gas emissions. Within the framework of the 2030 Agenda, the 13th goal deals with this area, specifically partial goal 13.2 entitled “Integrate climate change measures into national policies, strategies and planning.” Here, the EU is committed to reducing emissions by at least 55% compared to 1990 levels by 2030. Adjusting the targets until 2030 and achieving them will contribute to the achievement of the Fitfor-55 goals, but also the goals of the European Union in the field of energy security and resilience of the REPowerEU plan (European Commission, 2023b). Therefore, it is essential to constantly assess progress towards energy and climate commitments and ensure that countries can exchange best practices to promote mutual learning and climate change mitigation.
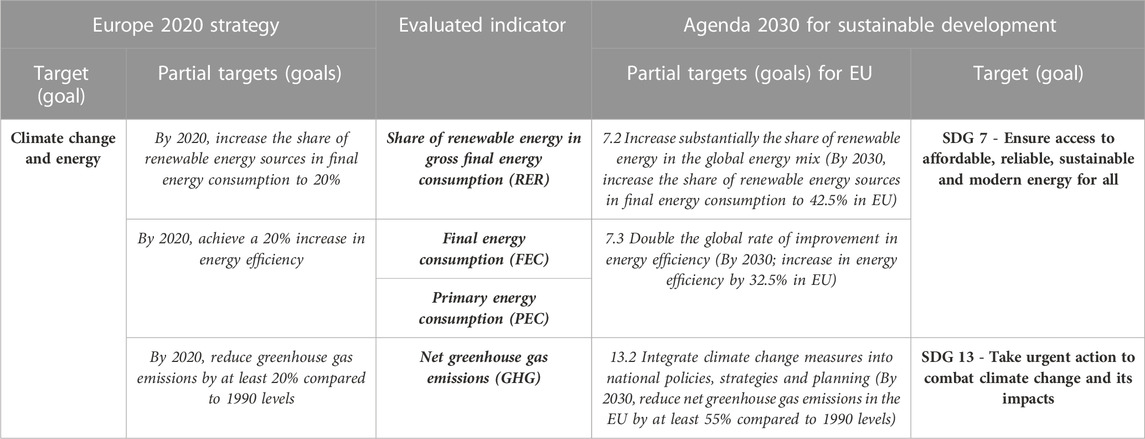
TABLE 1. The targets, which are evaluated within Europe 2020 strategy and 2030 Agenda, are highlighted by bolt, because we pointed to their common indicators (in middle).
The literature review in Table 2 shows that some studies examine the fulfilment and interconnectedness of the goals of the Europe 2020 Strategy as a whole, other focus on climate and energy targets independently, and currently this issue is a part of research focused on SDG 7 and SDG 13.
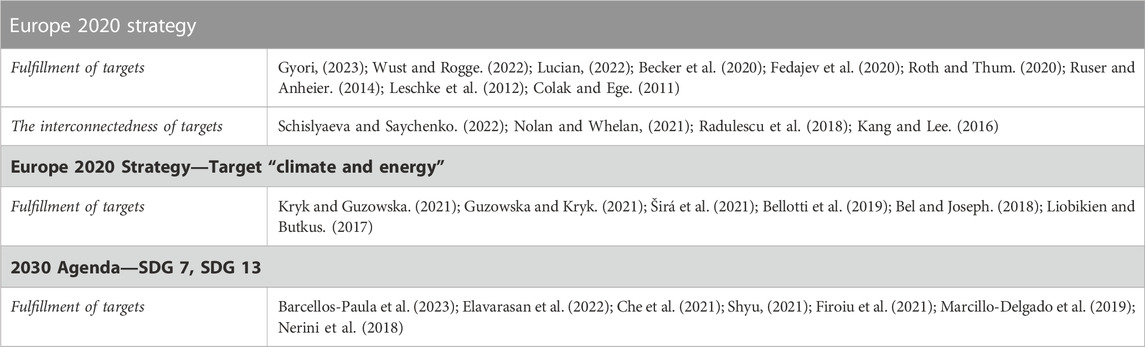
TABLE 2. Review of studies about climate and energy targets.
As for the approaches to assessment of progress under the climate and energy goals, these were often part of studies that explore the Europe 2020 Strategy as a whole. Colak and Ege. (2011) analyzed the initial situation for targets achievement using three composite indices—smart, sustainable, and inclusive growth index. Leschke et al., 2012 focused on the need to change and adapt the National policies in the context of the Europe 2020 Strategy. Several authors evaluated the development of individual areas of Strategy and targets in an effort to point out their attainability in 2020 (Lucian, 2022; Wust and Rogge, 2022; Gyori, 2023). An important area of research is also the question of the existence of relations among the targets and their interdependence (Kang and Lee, 2016; Radulescu et al., 2018; Nolan and Whelan, 2021; Schislyaeva and Saychenko, 2022). In addition, several authors dealt with the issue whether the targets were set correctly, how they can be evaluated and whether they are at all feasible in the given form (Ruser and Anheier, 2014; Becker et al., 2020; Fedajev et al., 2020; Roth and Thum, 2020).
Several studies were skeptical about achieving the targets of the Strategy. Smit et al. (2014) predicted that the EU as a whole would achieve primary energy savings of 16.4% in 2020 in their study from 2014. According to their predictions, only Slovakia, Latvia, Italy, Greece, Portugal, Spain, Ireland, Bulgaria, and Lithuania will exceed the primary energy savings targets in 2020. European Environment Agency (2012) and Picazo-Tadeo et al. (2014) in relation to greenhouse gas emissions predicted that in 2020 emissions in most EU member states will be below their national targets. The results of the regression analysis Liobikienė, G. and Butkus, M. (2017) showed that economic growth and increasing primary energy consumption will contribute to the growth of greenhouse gas emissions in the EU, which may negatively affect the achievement of the targets. Guzowska and Kryk (2021) also indicated the difficulties of some countries to achieve the target values in the area of climate and energy by 2020. Based on data from 2014 to 2018, they found that of all EU countries, only one-quarter effectively achieve their climate/energy targets during the monitored period. The separate topic is the role of new technologies in mitigating climate impacts and changes (Bel and Joseph, 2018; Duľová Spišáková et al., 2021), as well as in the field of energy (Mikoláš et al., 2015; Bellotti et al., 2019). According to Liobikien and Butkus (2017), the uneven effectiveness of the energy and climate policy of the EU member, which determined different changes in greenhouse gas emissions, primary energy consumption and the share of RES at the level of individual countries, affects the achievement of the set targets.
According to European Environment Agency. (2022), the EU-27’s 2020 GHG emissions were 32% below 1990 levels, thus by far exceeding the 2020 target of a 20% reduction. In 2020, final and primary energy consumption levels in the EU-27 were more than 5% below the intended targets for that year. Part of these results can be attributed to the pandemic. In the area of renewable energy generation, the EU-27 achieved a level of 22% of total energy consumption from renewable sources in 2020, thus meeting its 20% target.
Currently, the focus is shifting to the evaluation of the goals within the 2030 Agenda, as well as the relations of SDG 7 and SDG 13 to other areas of sustainable development. Nerini et al. (2018) found that synergies and trade-offs exist in three key areas where decisions on SDG7 affect humanity’s ability: to realize desire for greater wellbeing, to build physical and social infrastructures for sustainable development; and achieve sustainable management of the natural environment. Therefore, there is an urgent need to better organize, connect and disseminate this evidence to help all actors work together to achieve sustainable development. Some scientists advocate access to energy as a basic human right that needs to be protected by government measures and interventions. A study by Shyu (2021) tried to link the concepts of energy access, energy poverty, energy justice and energy democracy with a rights-based concept with different levels/dimensions of policy measures. Any improvements in the monitored area have a positive effect on several other indicators, such as industrialization, poverty or even the ability of regions to adapt more easily to climate change (Che et al., 2021). However, despite climate agreements, greenhouse gas emissions continue to fall short of the goals to limit global warming, and global causes thus induce local effects (Barcellos-Paula et al., 2023).
Regardless of the diversity of approaches to the researching of the issue of climate and energy in the context of the Europe 2020 Strategy, the results of the studies agree that it is a cross-sectoral issue that requires the involvement not only of the departments of the environment, the economy or the energy production sector, but it also extends to the transport or waste sectors and, last but not least, it is also affected by the behavior of the household.
Several of the above-mentioned research dealt with the assessment of the achievement of the goals of the Europe 2020 Strategy even before 2020. However, a full assessment of the results of the implementation of the Strategy is absent. For this reason, in the results and discussion section, we will focus on the assessment of progress under Europe 2020 and the degree of fulfilment, respectively exceeding the targets set for climate and energy.
The selection of indicators corresponds to the intersection of indicators for monitoring the achievement of the targets of the Europe 2020 Strategy and the 2030 Agenda in the field of environment. We applied priority criteria of availability, comparability, and relevance for data selection. Therefore, the analysis and as follows results is based on the data from Eurostat. Table 3 shows four indicators of climate and energy targets of the Europe 2020 Strategy and their characteristics.
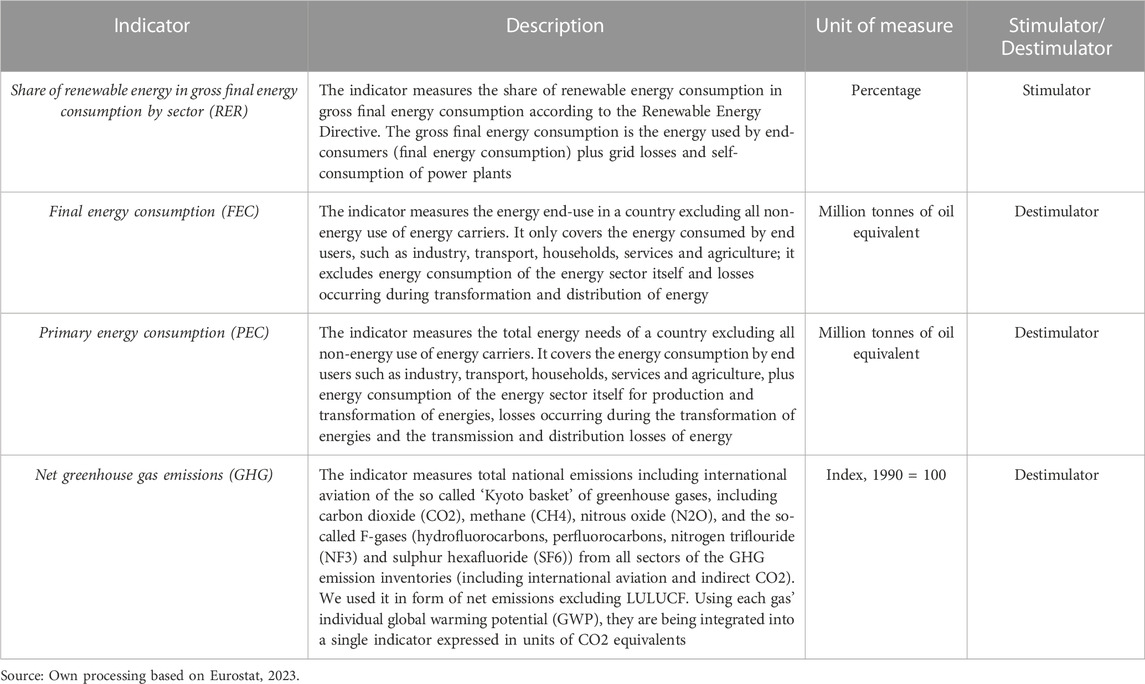
TABLE 3. List of indicators and their characteristics.
Before the analysis, we classify the variables into groups according to their desired development into stimulators, destimulators and nominants. For stimulants, higher values are desirable, declaring a positive development of the variable, for destimulators, a decrease in values is positive. Rising values of the nominants have a positive effect on the observed phenomenon, but only to a certain value.
For the mentioned four indicators, target values were set for individual EU member countries, which present their national targets (European Commission, 2022a; European Commission, 2022b; Cucchiella et al., 2020; Becker, 2020). In order to evaluate whether and to what extent individual member countries managed to fulfill the national target values, we will use three methods - the ranking method, the scoring method and the distance method from the fictitious object. The reference year will be 2020.
In the ranking method, we arrange the objects (EU Member States) based on the values acquired by the indicator
The disadvantage of the mentioned method is the transition from a “stronger” scale of values (numerical) to a “weaker” scale (ordinal). Another issue is that the difference of two consecutive normalized values is at most 1, no matter what the actual difference of the values of the original variable is. The following two methods will allow us to quantify the differences between countries.
In the scoring method, we replace the values of the individual variables
where
In the case of the destimulator, we use the relation:
where
The resulting integral indicator is determined as the average number of points di:
The first in the score will be the object with the highest value
The distance method is one of the most accurate methods within multicriteria methods. It points to the distance of the object from the ideal object, which reaches the best values in all indicators (max./min. according to the character of the indicator). This method works with standardized forms of indicator values, while a fictitious spatial unit of the same order (in our case a EU Member State) is also introduced into the sample. For each object, the average distance (
The lowest value
Based on the achieved results, for the worst rated countries, we will make a prediction of the future development for the next 4 years using a trend estimation, which is an analogy of a simple regression analysis. The choice of the short-term prediction until 2025 is based on the regard to the length of the time series and to ensure a sufficient level of reliability. The trend of development of the indicator will be chosen as statistically significant model from several considered variants of functions. The function must meet the conditions of the F test (statistical significance of the model as a whole), p-values of regressors (statistical significance or insignificance of individual regression coefficients) and at the same time have a significant value of the coefficient of determination, which expresses the probability of reaching the predicted values in the future. In case that two or more tested models will be statistically significant, the one with the higher coefficient of determination will be chosen.
The completed Europe 2020 Strategy was a breakthrough in achieving climate/energy targets, therefore it serves as a reference point for the research carried out. We decided to assess the achieved results based on the values of the indicators in 2020 (Figure 1), considering the achievement or exceeding the set targets (Table 4) and a time comparison of the indicator values in 2005 and 2020 (Table 5).
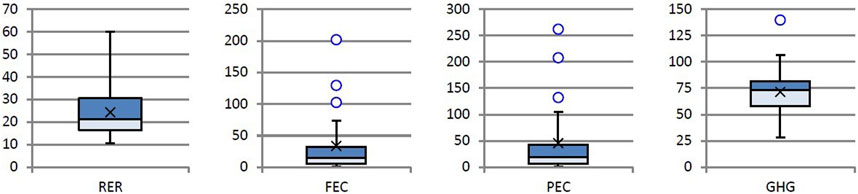
FIGURE 1. Boxplots for selected indicator (2020).
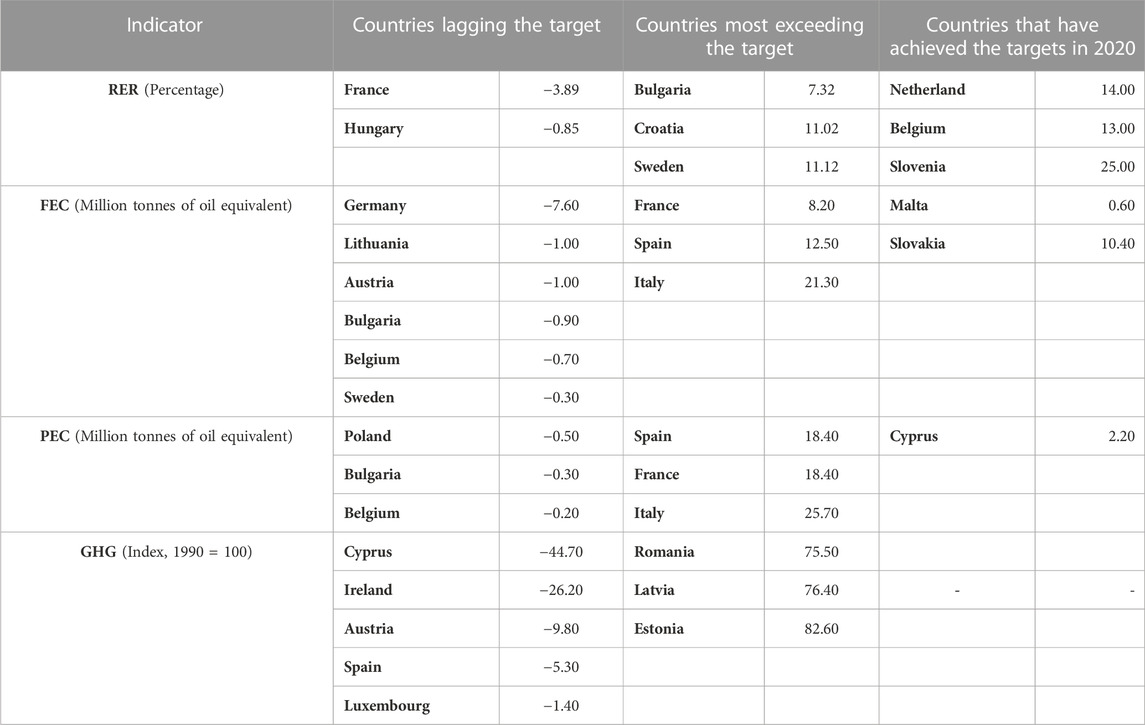
TABLE 4. Countries lagging and exceeding the climate and energy targets.
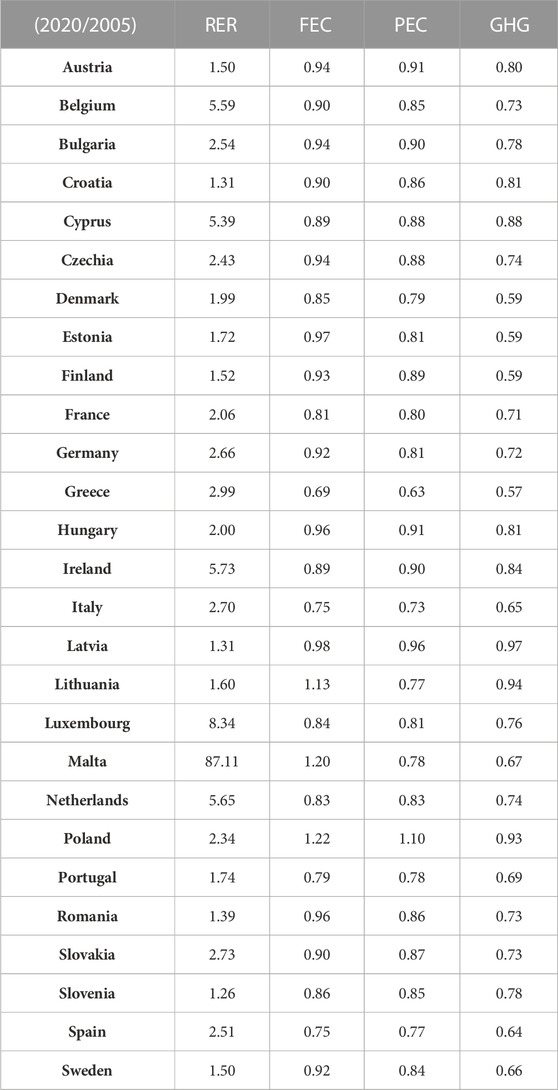
TABLE 5. Time comparison of the values achieved in 2005 and 2020 (2005/2020).
The share of renewable energy in gross final energy consumption (in %) is one of the sub-target of the Europe 2020 Strategy, which was fluently followed by goal SDG 7 of the 2030 Agenda. The indicator measures the extent of penetration of renewable sources into the energy system. The target value for the EU as a whole was to increase this share by 20% by 2020 and EU met it. Each Member State contribute to this target. Malta (minimum in boxplot) had the smallest share, namely, 10.71%, but managed to fulfill the national target (10%). Looking at the longer-term trends, the RER increased by 87.11 times between 2005 and 2021 (Table 5). The increase represents an average annual increase of 5.81 p.p. over the 15-year period. Sweden as boxplot´s maximum had the highest share of renewable energy in gross final energy consumption, namely, 60.12%, which also exceeded its target value (49%). In this area, Luxembourg belongs to the countries with the second-highest progress (8.34 times increase). The share of renewable energy in gross final energy consumption in Romania, Croatia, Latvia and Slovenia increased the lowest (less than 1.4 times). Only two countries failed to achieve the national target in 2020, namely, France, which fell short of the target by 3.89%, and Hungary, which fell short by 0.85%. Netherlands, Belgium and Slovenia reached exactly the target value in 2020. The target was most exceeded by 7.3 p.p. in Bulgaria, and even by more than 11 p.p. in Croatia and Sweden.
Final energy consumption (in Mtoe) indicates the energy requirements of the economy. This target aimed at reducing the final energy consumption expressed in million tonnes of oil equivalent. This target is also followed by the goal of the 2030 Agenda SDG 7. The lowest value was achieved in 2020 by Malta (minimum in boxplot), namely, 0.6 Mtoe, but compared to 2005, its value increased by 0.1Mtoe, which represents an increase of 20 p.p. (second-highest increase after Poland—Table 5). Spain belongs among the countries with high final energy consumption. In 2020, the value of the indicator reached 73.8 Mtoe (maximum in boxplot), however, is about 25 p.p. less than it was in 2005. Outliers in this indicator and Member States with the highest FEC were Germany (201.9 Mtoe), France (129.7 Mtoe) and Italy (102.7 Mtoe). As for the achievement of the target in the area of final energy consumption, we observed 6 countries that did not reach their national targets (Table 4). Germany lagged behind the most (by 7.6 Mtoe), then Lithuania and Austria (by 1 Mtoe), and Bulgaria, Belgium and Sweden (from 0.3 to 0.9 Mtoe). Malta and Slovakia reached the exact target value in 2020. Italy was the country with the largest exceeding of the national goal, by 21.3 Mtoe, followed by Spain with an excess of 12.5 Mtoe.
The second sub-target related to energy consumption is the reduction of primary energy consumption expressed in million tonnes of oil equivalent. Primary energy consumption (Mtoe) refers to the energy input to the economy that is further processed through energy conversion. Even in this case, this target is followed by the goal of the 2030 Agenda SDG 7. Similarly, as for previous indicator, Malta showed the lowest indicator value of 0.7 Mtoe (minimum in boxplot), which represents a decrease of 22 p.p. compared to 2005 and the country thus reached the target value. Cyprus followed with 2.2 Mtoe, Luxembourg with 3.9 Mtoe, Estonia with 4.3 Mtoe and Latvia with 4.3 Mtoe. Larger and more populous Member States such as Germany (262.1 Mtoe), France (208.0 Mtoe) and Italy (132.3 Mtoe) were recorded as outliers value. Based on assessing the achievement of target values by EU member countries in 2020 in the area of primary energy consumption, we find that three countries failed to fulfill the target. These are Poland (higher consumption of primary energy by 0.5 Mtoe), Bulgaria (higher by 0.3 Mtoe) and Belgium (higher by 0.2 Mtoe). Cyprus is the only country that has exactly reached the target value in 2020. On the other hand, the biggest exceeding from the target was achieved by Italy, which reduced primary energy consumption by 25.7 Mtoe vs. target value. The significant decrease in the energy consumption also occurred in France, Spain, Germany and Romania (between 12 and 18.4 Mtoe). The countries most exceeding the target are the same as for FEC.
In the case of both consumption indicators, the good ranking of southern countries in the FEC and PEC indicators can be explained by the higher average temperature, and thus also the natural lower demand for energy consumption. It is possible to positively evaluate the fact that in 2020 energy consumption in the EU reached the lowest level since 1990. To some extent, the effects of the pandemic caused by COVID-19 with the subsequent economic decline of European economies contributed to this. This ultimately contributed to the achievement of target values in several countries. According to the European Court of Auditors. (2023), the EU27 would most likely not reach its energy efficiency target by 2020 without lower energy consumption due to the financial crisis in 2009 and the COVID-19 pandemic. Based on the above, it is almost impossible to evaluate the effectiveness of specific tools that actually lead to a reduction in energy consumption. This was also confirmed by the European Environmental Agency. (2023), according to which, after a significant decrease in energy consumption in Europe due to COVID-19, the final energy consumption in the EU increased by up to 6.9% between 2020 and 2021. This was due to economic recovery and the lifting of pandemic restrictions. The highest increase was recorded for solid fossil fuels and nuclear energy. Energy consumption increased in all sectors and energy sources, especially in the transport and solid fuel sectors. Significantly higher primary or final energy consumption in 2021 compared to 2020 reduced the positive exceeding of the target (Eurostat, 2023). For example, in the case of primary energy consumption, the exceeding decreased the from 25.7 Mtoe to 12.7 Mtoe in Italy and from 18, 40 Mtoe to 2.00 Mtoe in France. As for final energy consumption the exceeding decreased the from 21.3 to 10.7 Mtoe in Italy and from 12.5 Mtoe to 6.0 Mtoe in Spain. Therefore, some Member States would no longer meet the national target in 2021 (Primary energy consumption—Cyprus, Netherlands, Austria, Sweden, Final energy consumption—Czechia, France, Hungary, Poland, Slovakia).
As already mentioned in the theoretical overview, the last target of the Europe 2020 Strategy is the reduction of net greenhouse gas emissions, which was also reflected in the 2030 Agenda as SDG 13. Greenhouse gas emissions measure the environmental pressures created by economies. The specifics of this goal is that 11 member countries (Estonia, Croatia, Latvia, Lithuania, Hungary, Malta, Poland, Portugal, Romania, Slovenia and Slovakia) had the opportunity to increase emissions compared to 1990. The differences in the value of the indicator for individual countries are therefore obvious. The lowest value in 2020 was shown by Estonia (maximum in boxplot), where GHG reached a level of 28.4% of the value in 1990. On the contrary, a high value was recorded in case of Ireland, namely, 106.2%, which means that in this country GHGs increased by 6.2p.p. compared to 1990. Cyprus is considered an outlier, where emissions increased by almost 40 p.p. compared to the base year. Excluding five countries, the Member States achieved the target of reduction of net greenhouse gas emissions. Luxembourg fell behind of the target value by 1.4 p.p., Spain by 5.3 p.p., Austria by 9.8 p.p. Ireland is significantly behind, by 26.2 p.p. and Cyprus up to 44.7 p.p. On the other hand, in Bulgaria, Lithuania, Romania and Latvia there was a recorded decrease in emissions by more than 70 p.p. against the target and in Estonia by 82.6 p.p.
The question arises whether the reduction of net greenhouse gas emissions or increase of the renewable energy share in some countries was not more aimed at achieving the target in 2020, than real changes. The European Court of Auditors. (2023) also points to the possibility of distortion of results in the field of renewable energy and emission quotas. They found a lack of transparency on how EU Member States achieved their national targets through flexible measures: buying emission allowances or shares of renewable energy from other member states that have exceeded their targets. For example, Luxembourg and Lithuania became the first EU countries to buy surplus renewable energy from other countries to meet their own national targets under the EU’s Renewable Energy Directive in 2017.
Three methods were used to evaluate the success and progress of Member States in achieving the target values in all four indicators, namely, the ranking method, the scoring method and the distance method from the fictitious object. Ratios of observed indicators to target values are considered decision variables.
Based on the results according to the ranking method, the best ranking countries were Croatia and Greece, which taken the first place together (Figure 2). This means that, taking into account the results they achieved in all four monitored indicators, these countries recorded the highest level of fulfilment of their national targets. Specifically, in Croatia and Greece there was a fulfilment, or exceeding in all monitored indicators. Also, Romania, Estonia and the Czech Republic are among five best ranking Member States. On the contrary, according to this method, Belgium, Ireland and Austria are at the bottom of the ranking. Slovakia is in 9th place in the success of achieving targets. The position of Cyprus was negatively affected by the net greenhouse gas emissions indicator. The share of renewable energy in gross final energy consumption indicator decreased the overall ranking of France. The position of Lithuania and Bulgaria was affected in negative sense by values of energy consumption indicators.
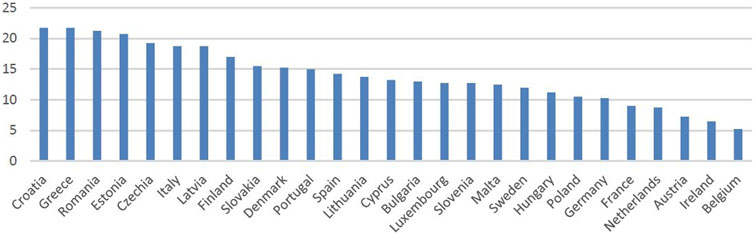
FIGURE 2. Ranking method results.
Figure 3 demonstrate the results of ranking based on the scoring method. In this case, the highest number of points was assigned to Estonia (87.4 points), followed by Romania (83.9 points), Latvia (80.3 points) and Croatia (80.0 points). As a leader, Estonia achieves the best rating in the GHG indicator. Romania even achieved a leading position in the two indicators FEC and PEC, but the number of points achieved reduced the result in the indicator Share of renewable energy in gross final energy consumption. Slovakia is in eighth place (73.1 b) due to good results in the share of renewable energy in gross final energy consumption and net greenhouse gas emissions indicators. Ireland (59.8 p.), Belgium (60.3 p.) and Austria (60.6 p.) are once again at the bottom of the ranking, although in a different order.
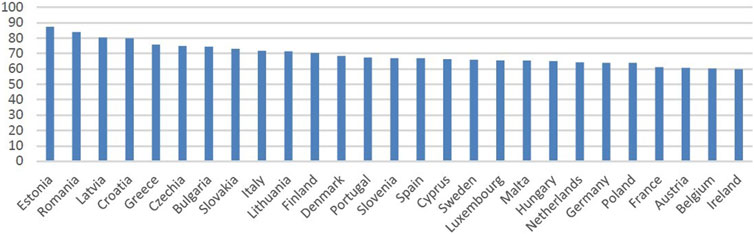
FIGURE 3. Scoring method results.
The third method (Figure 4) for evaluating the success of countries in achieving the targets of the Europe 2020 Strategy in the field of climate change and energy is the method of distance from a fictitious object. According to this method, the best position was again given to Croatia and Greece, which showed the smallest distance from the fictitious object (the country achieving the best results in all monitored indicators).
FIGURE 4. Distance method results.
In case of Greece, the distance from the fictitious object was negatively affected by the indicator of net greenhouse gas emissions, where the country took the 13th place. Similarly, Croatia also took 13th place, but in the field of final energy consumption. The worst ranking countries according to this method are again Ireland and Belgium, but in this case also France, which occupied the last place in the share of renewable energy in gross final energy consumption indicator.
The achieved results using three methods of multivariate comparison could be summarized as follows (Figure 5). The first three places are occupied by 5 countries in different order, namely, Croatia, Greece, Estonia, Czechia, and Latvia. In terms of meeting the targets of the Europe 2020 Strategy in the area of the environment, these countries achieved the greatest rate of their completion, and often even exceed the national targets. The Net greenhouse gas emissions indicator mainly contributed to the reduction of Croatia’s rating in the applied methods. Similarly, the best results of Romania in primary and final energy consumption indicators are confronted with a lower fulfillment of the target in the area of Share of renewable energy in gross final energy consumption, where the value of the national target was exceeded by only 2 p.p. Even though Estonia is a leader in the field of GHG, its weakness can be considered the FEC indicator, in which the country achieved an average rating and exceeded the national target by only 3 p.p. The GHG indicator contributed to Latvia’s excellent rating, where it not only met the national goal, but even exceeded it by 65.3 p.p.
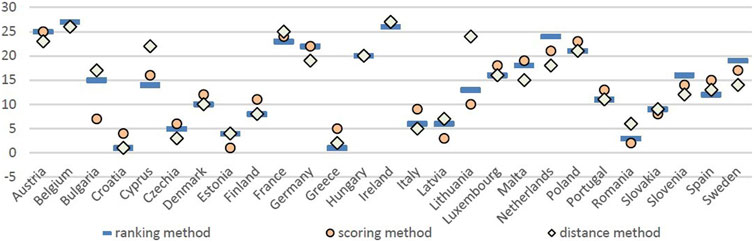
FIGURE 5. Results comparison of ranking, scoring and distance methods.
Based on the results of the methods used, we identified deficiencies in four countries that are repeated in the last places in the ranking. These are Ireland, Belgium, Austria, and France, which at the same time show failure to achieve any of the target values in the four monitored areas. In the Discussion chapter, we will therefore focus on predicting the future development of problem indicators in the four mentioned countries.
The trend of the indicator developments can be defined by several functions. In order to choose the appropriate and most accurate development trend, in addition to the coefficient of determination (R2), it is necessary to monitor the p-value and the result of the F test, which must reach values lower than 0.05. Estimated parameters of the regression models are in Table 6 and Table 7.
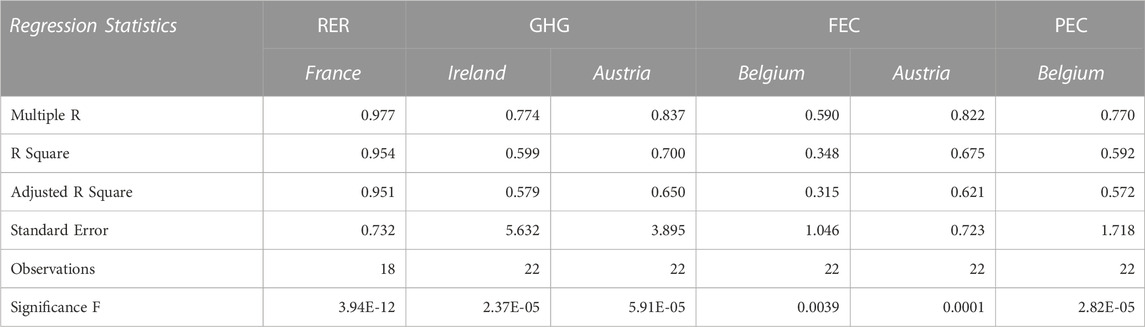
TABLE 6. Estimated parameters of the regression models I.
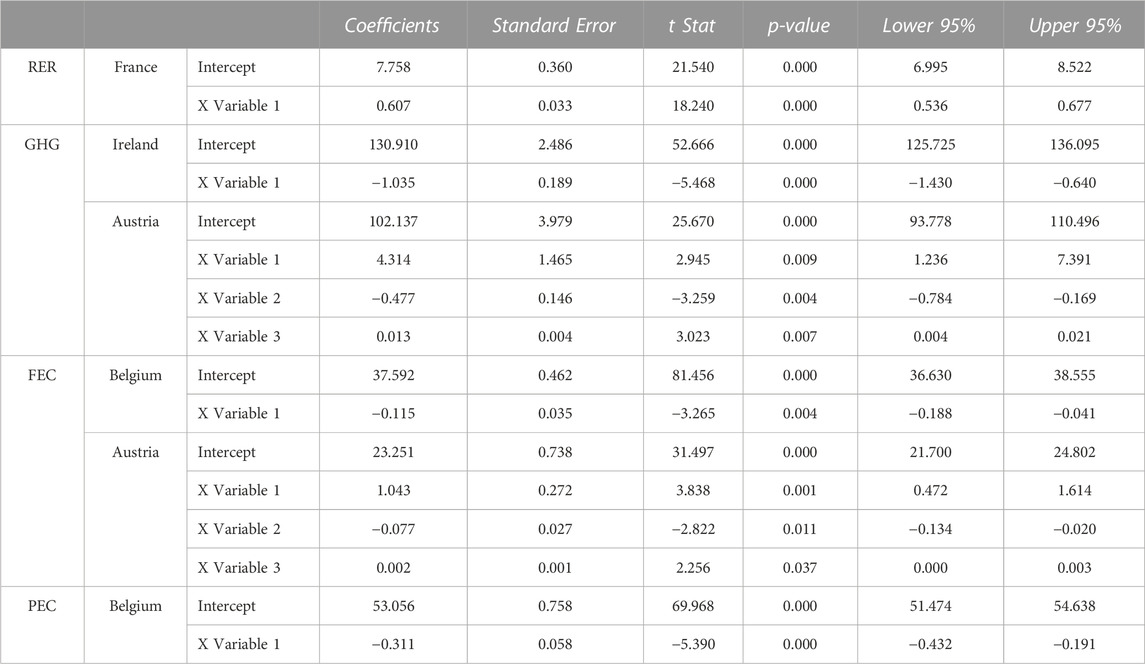
TABLE 7. Estimated parameters of the regression models II.
In the area of renewable energy resources, we focused on France, due to the country’s greatest lag behind the target value. Despite the fact that this country is the second-largest European source of wind energy, the second-largest exclusive maritime zone, has rich resources of forest, water and solar energy, it has not reached the target in the monitored area in 2020 (Lebrouhi et al., 2022). The problem is also that the long-term main source of energy in France there is nuclear energy. Based on the results of the testing, the current development of the indicator the share of renewable energy resources in gross finale energy consumption of France can be described by a linear function (Figure 6). The p-value for the constant and for the regression coefficient are less than 0.05, which indicates their statistical significance, as well as the statistical significance of the selected model. The probability that the country will follow this trend in the coming years is 95.41%. Due to problems with reaching the target value, the country decided to reduce the share of nuclear energy in the overall energy mix and focus on decarbonizing the energy system. It represents a significant challenge of the energy transformation in France (Lebrouhi et al., 2022). In the coming years, the country wants to focus mainly on variable renewable energies, such as photovoltaic solar and wind energy.
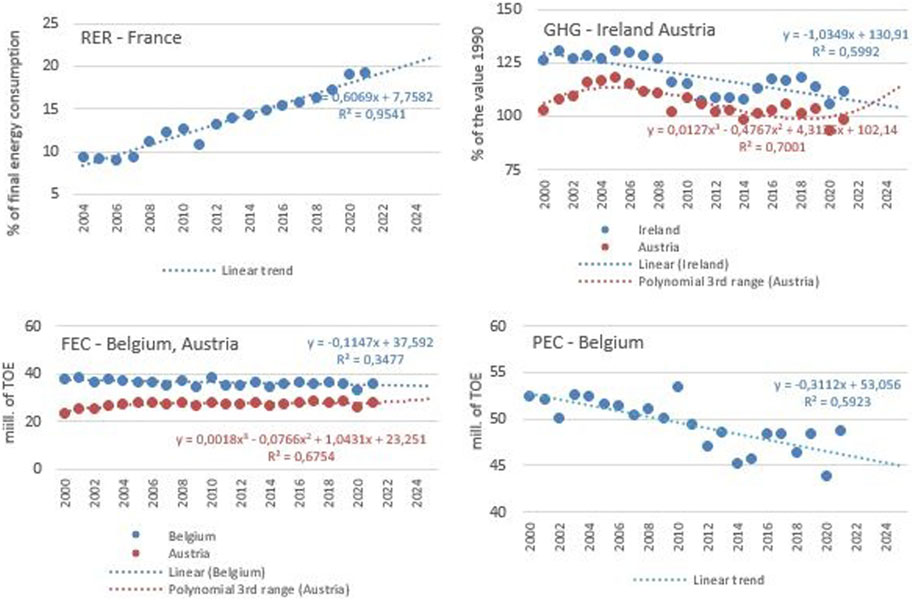
FIGURE 6. Expected development of the climate and energy indicators by 2025.
As for indicator of greenhouse gas emissions, we focused on Ireland and Austria, due to the obvious lagging of the countries behind the national target values. The main source of greenhouse gas emissions in Ireland is the transport sector, households, and industry. The country shows the highest national share of emissions from agriculture sector in the EU due to extensive agri-food production (Uidhir et al., 2020). This is 32.7% of emissions, which is three times more than in the rest of Europe (Environmental Protection Agency, 2020). This high proportion of total greenhouse gas emissions reflects the importance of the sector to the economy, the biological nature of agricultural emissions and the lack of heavy industry, rather than environmental inefficiency (Department of Agriculture, Food and the Marine, 2019; Torney and O'Gorman, 2019). The development of the greenhouse gas emissions indicator in Ireland is possible to described with the best accuracy by the linear function (Table 6; Table 7; Figure 6). However, the probability that the country will follow this trend in the next years is only 60%. Because the most greenhouse gas emissions produced in Ireland come from agriculture and the energy sector, it will be essential in the coming years to reduce these emissions and focus on investing in renewable energy sources such as solar panels, wind, geothermal, biomass, but also for extensive tree planting. These will help absorb carbon dioxide emissions.
In the case of Austria, the largest share of total greenhouse gas emissions was recorded by the transport sector (up to 30%). On the other hand, the energy industry accounted for only 13% of the total share of emissions (Jensen and Fachada, 2021). The statistically significant model was described by a polynomial function of the 3rd degree (Figure 6). The p-value for the constant and the regression coefficients together with the result of the F test are shown in Table 4, 5. The probability of the described development in the next few years is 70%. Based on the problems and failure to achieve the targets not only in the area of greenhouse gas emissions, the Austrian government decided to enact a new law on climate protection, which will contain obligatory methods of reducing emissions and also sectoral goals for 2040 with interim goals until 2030 (European Parliament, 2021).
Belgium and Austria failure to achieve the target values and recorded last ranking position regardless of the used method. These results were affected mainly by final energy consumption. Based on the results of the testing, the most suitable function describing the development of the indicator in Belgium is a linear function (Figure 6). Statistical significance for the constant and the model is confirmed by the calculated p-values and the result of the F-test (Table 6; Table 7). However, due to the very fluctuating development of this indicator, the coefficient of determination is only 0.3477. As for Austria, a statistically significant model was described by a polynomial function of the 3rd order (Figure 6). The probability of such a development for the predicted period is 67.54%. Most of the measures taken in connection with the target of energy efficiency are oriented towards the heating of buildings and the field of transport. The government created a new Ministry for Climate, Environment, Energy, Mobility, Innovation and Technology, which will have full competence in the field of energy policy, in an effort to reduce complexity and speed up processes (European Parliament, 2021).
The last monitored area is primary energy consumption, in which Belgium achieved the worst results from among the four countries mentioned. The problem of not reaching the energy consumption targets in Belgium is clearly related to the fact that the country has limited energy resources, and primary energy production represents approximately 35% of the total primary energy consumption. The country is therefore very dependent on the supply of energy from other countries (especially the supply of fossil fuels). In 2020, the main consumer of primary energy was the industrial sector (26.3%). It was followed by the housing sector (20.8%) and transport (20.4%). Unlike Austria, in the transport sector there was a decrease in consumption compared to 2019 by up to 15.9% due to the introduced COVID-19 measures and restrictions. Despite this, road transport is the most energy-intensive means of transport in Belgium (National Climate Commission, 2023). In this case, a linear function was determined as the most appropriate function describing the development of the indicator so far (Figure 6). The probability that the country will follow this trend is less than 60%.
Based on the test results, it is possible to determine for each country the expected development of the values of the monitored indicator in the future (Figure 6) and then to evaluate whether that country will succeed in achieving the original targets of the Europe 2020 Strategy in the next years (Table 8). If the development of all four indicators to date were governed by the selected functions, none of the countries would be able to achieve the target set for 2020 in the Europe 2020 Strategy, to which individual countries have committed themselves, even by 2025. This indicates the ambition of the targets, the necessity of constant monitoring of the development of selected indicators, as well as the need to adopt changes and apply effective tools aimed at achieving climate and energy goals.

TABLE 8. The expected values of the climate and energy indicators by 2025.
The results of the performed analyzes can be compared with several studies that also focused on the evaluation of the achievement of targets in the monitored area, but before 2020. As an example, we present four studies (Table 9). Of course, the applied research method has an influence on the final form.
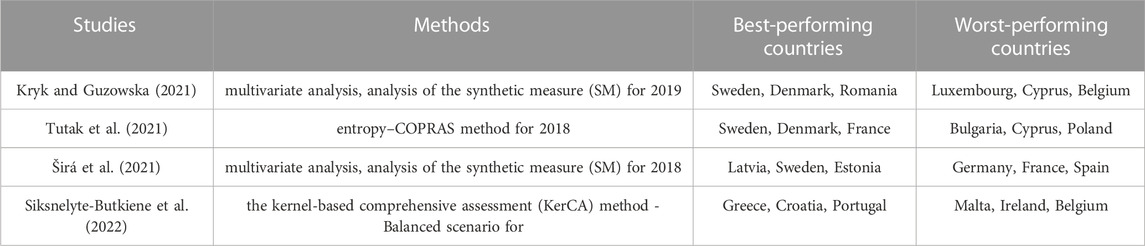
TABLE 9. Evaluation of the achievement of the goals of the Europa 2020 Strategy according to another research.
According to the studies of Kryk and Guzowska. (2021), as well as Tutak et al. (2021) Sweden and Denmark are among the best rated countries in achieving the targets. In our rating, these countries did not appear among the leaders. This can be explained by the lower average temperature in these countries, which in turn corresponds to a higher requirement for energy consumption. Since we used the same weights for the assessed indicators, the results in the consumption indicators affected the ranking of Sweden and Denmark to such an extent that they reached only an average level.
Similar conclusions as ours were presented in the following research. According to Širá et al. (2021), the Baltic states, the Nordic countries (members of the European Union), Romania and Croatia are among the countries that best meet the targets of the sustainable growth. Even the Croatia was the only country that achieved the targets during the entire period under review. Siksnelyte-Butkiene et al. (2022) elaborated a study according to which countries such as Greece, Croatia, Italy, Portugal and Romania have high potential in the area of reducing greenhouse gas emissions, but also in the area of using renewable energy sources and increasing energy efficiency. They achieved these results thanks to the implementation of effective policies and the adoption of measures leading to success in the monitored area. The stated findings are consistent with our results, as Croatia achieved the best results in the rankings compiled by us, Greece, Estonia, Latvia and Romania were also among the leaders. According to Lucian (2022), Romania’s success in this area is due to a significant reduction in greenhouse gas emissions by more than 50% due to the shutdown of production capacities, especially in the energy sector, without actively implementing any measures aimed at this area. The country is also among the most energy-demanding because there is no modernization of power plants. Siksnelyte-Butkiene et al. (2022) further state that the lagging countries include France, Belgium, Ireland, and Poland, which face greater difficulties in implementing climate and energy targets. Their problem is insufficient reduction of greenhouse gas emissions, but also other circumstances related to dependence on fossil fuels (for example, coal in Poland, oil and natural gas in Belgium) and in France (nuclear energy, oil and gas). Again, this is in line with our findings, as France, Belgium and Ireland belong to worst-performing countries.
The climate and energy targets originating from the Europe 2020 Strategy can be considered ambitious. The gradual filling and current status is the result of a long-term process. Recorded positive progress of several countries is the result of their systematic approach over several years. However, it is necessary to constantly research this area and pay attention to it. This is evidenced by studies from the past, as well as current research results.
The aim of the article was to analyze and assess the degree of fulfilment of Europe 2020 climate change and energy targets by EU member states with a subsequent link to the targets of the 2030 Agenda. The article considered not only the level of achievement of the target values, but also the exceeding of these values. The development of four basic indicators in the field of climate change and energy in the member countries of the European Union was analyzed (greenhouse gas emissions, renewable energy resources, final energy consumption, primary energy consumption). Based on the available data, we have concluded that in the field of renewable energy sources, two countries failed to reach the target value in 2020, namely, France and Hungary. Three countries reached the target just in 2020 and the other member countries exceeded the national target. In the case of the greenhouse gas emissions indicator five countries failed to reach the national target (Cyprus, Ireland, Austria, Spain and Luxembourg). Six countries, namely, Germany, Lithuania, Austria, Bulgaria, Belgium and Sweden, were behind in achieving the target related to final energy consumption. Two countries, Slovakia and Malta, reached their national target in 2020 and other countries exceeded the national target values. In the case of primary energy consumption, Poland, Bulgaria and Belgium were behind the target values in 2020. In addition to the evaluation of the achievement of target values, the second part of the article was devoted to multivariate comparison, in which three methods were used to evaluate the success and progress of Member States in achieving the target values in all four indicators - the ranking method, the scoring method and the distance method from the fictitious object. Even though the ranking of countries shows certain quantitative deviations within the framework of the methods used, the qualitative conclusions remain. The Member States with the best results in the context of climate change and implementation of energy priorities are Croatia, Greece, Estonia, Czechia, Latvia, and Romania. These countries occupied the first ranks in the three methods used to assess the achievement of target values in 2020. On the contrary, the worst-performed countries are Ireland, Belgium, Austria, and France, which were significantly behind other EU countries in several areas, and they failed to achieve several target values.
Considering these findings, a prediction of the future development of individual indicators in the four worst countries was made as part of the discussion (using regression analysis). The aim was to find out whether these countries will not be able to achieve the targets of the Europe 2020 Strategy and gradually converge to the goals of 2030 Agenda for Sustainable Development by at least 2025. Based on the results of the regression analysis, we concluded that if the current trend of development continues, Ireland and Austria in the area of greenhouse gas emissions, France in the area of renewable energy resources, Belgium and Austria in the area of final energy consumption and Belgium in the area of primary energy consumption will not reach the national target values even in the coming years. It will require taking the necessary measures that are most problematic in individual countries, such as the mentioned agricultural sector in Ireland, the transport sector in Austria or the excessive dependence on imported energy in Belgium.
Applied approach allowed us to assess the efforts of countries and the acceleration of strategies to achieve climate and energy goals at the individual level. The analysis of the target implementation reflects not only the efforts of countries but can be also used as a supporting tool for the further development of environmental and energy policy.
This article presents one possibility of assessing the effectiveness of the implementation of the climate and energy targets of the Europe 2020 Strategy. However, it would be interesting to investigate the effectiveness in question using other methods. The evaluation of the success of the Europe 2020 Strategy is insufficient, and the available literature lacks publications dealing with the evaluation of the achievement of individual targets in this area.
Publicly available datasets were analyzed in this study. This data can be found here: https://ec.europa.eu/eurostat/web/sdi/database.
BG: Conceptualization, Data curation, Methodology, Supervision, Visualization, Writing–original draft, Writing–review and editing. ED: Conceptualization, Project administration, Resources, Writing–original draft, Writing–review and editing.
The author(s) declare financial support was received for the research, authorship, and/or publication of this article. The article was funded by the project VEGA 1/0338/22 “European Union and Strategy Europe 2020 in mirror of the Priorities and Challenges of the Agenda 2030” and presents its partial results.
The authors declare that the research was conducted in the absence of any commercial or financial relationships that could be construed as a potential conflict of interest.
All claims expressed in this article are solely those of the authors and do not necessarily represent those of their affiliated organizations, or those of the publisher, the editors and the reviewers. Any product that may be evaluated in this article, or claim that may be made by its manufacturer, is not guaranteed or endorsed by the publisher.
Barcellos-Paula, L., Gil-Lafuente, A. M., and Castro-Rezende, A. (2023). Algorithm applied to SDG13: A case study of ibero-American countries. Mathematics 11 (2), 313. doi:10.3390/math11020313
Becker, W., Norlén, H., Dijkstra, L., and Athanasoglou, S. (2020). Wrapping up the Europe 2020 strategy: A multidimensional indicator analysis. Environ. Sustain. Indic. 8, 100075. doi:10.1016/j.indic.2020.100075
Bel, G., and Joseph, S. (2018). Climate change mitigation and the role of technological change: Impact on selected headline targets of Europe's 2020 climate and energy package. Renew. Sustain. Energy Rev. 82, 3798–3807. doi:10.1016/j.rser.2017.10.090
Bellotti, D., Rivarolo, M., and Magistri, L. (2019). Economic feasibility of methanol synthesis as a method for CO2 reduction and energy storage. Energy Procedia 158, 4721–4728. doi:10.1016/j.egypro.2019.01.730
Che, X., Jiang, M., and Fan, C. (2021). Multidimensional assessment and alleviation of global energy poverty aligned with UN SDG 7. Front. Energy Res. 9, 777244. doi:10.3389/fenrg.2021.777244
Çolak, M. S., and Ege, A. (2011). An assessment of EU 2020 strategy: Too far to reach? Soc. Indic. Res. 110, 659–680. doi:10.1007/s11205-011-9950-2
Council of the EU and the European Council (2023). Paris Agreement on climate change. Avaliable At: https://www.consilium.europa.eu/en/policies/climate-change/paris-agreement/ (Accessed July 15, 2023).
Cucchiella, F., Gastaldi, M., Koh, L., and Santibanez-Gonzalez, E. D. (2020). Assessment of GHG emissions in Europe: Future estimates and policy implications. Environ. Eng. Manag. J. 19 (1), 131–142. doi:10.30638/eemj.2020.014
Department of Agriculture, Food and the Marine (2019). ’Ag-Climatise’: A draft national climate and air roadmap for the agriculture sector to 2030 and beyond. Avaliable At: https://www.agriculture.gov.ie/ruralenvironmentsustainability/climatechangebioenergybiodiversity/agclimatiseadraftnationalclimateairroadmapfortheagriculturesectorto2030andbeyondpublicconsultation/ (Accessed August 25, 2023).
Dugarova, E., Slay, B., Papa, J., and Marnie, S. (2017). Leaving No one behind in implementing the 2030 Agenda for sustainable development: Roma inclusion in Europe. New York:UNDP Regional Bureau for Europe and the Commonwealth of Independent States, 59.
Duľová Spišáková, E., Gontkovičová, B., and Spišák, E. (2021). Assessment of research and development financing based on the strategies in EU: Case of Sweden, Slovakia and Romania. Suistanability 13, 8628. doi:10.3390/su13158628
Elavarasan, R. M., Pugazhendhi, R., Irfan, M., Mihet-Popa, L., Campana, P. E., and Khan, I. A. (2022). A novel sustainable development goal 7 composite index as the paradigm for energy sustainability assessment: A case study from Europe. Appl. Energy 307, 118173. doi:10.1016/j.apenergy.2021.118173
Environmental Protection Agency (2020). Ireland’s national inventory report 2020: Greenhouse gas emissions 1990-2018. Avaliable At: http://www.epa.ie/pubs/reports/air/airemissions/ghg/nir2020/NIR%202020_Merge_finalv2.pdf (Accessed August 25, 2023).
European Commission (2023b). 13 Climate Action. Take urgent action to combat climate change and its impacts. Avaliable At: https://commission.europa.eu/system/files/2023-07/SDG-Report-13-MD.pdf (Accessed July 13, 2023).
European Commission (2022a). 2022 report on the achievement of the 2020 energy efficiency targets. Avaliable At: https://eur-lex.europa.eu/legal-content/EN/TXT/PDF/?uri=CELEX:52022DC0641&qid=1689919841860 (Accessed June 08, 2023).
European Commission (2022b). 2022 report on the achievement of the 2020 renewable energy targets. Avaliable At: https://eur-lex.europa.eu/legal-content/EN/TXT/PDF/?uri=CELEX:52022DC0639&qid=1689920167897 (Accessed June 08, 2023).
European Commission (2010). EUROPE 2020. A strategy for smart, sustainable and inclusive growth. Avaliable At: https://ec.europa.eu/eu2020/pdf/COMPLET%20EN%20BARROSO%20%20%20007%20-%20Europe%202020%20-%20EN%20version.pdf (Accessed July 10, 2023).
European Commission (2016). Sustainable development: EU sets out its priorities. Avaliable At: https://ec.europa.eu/commission/presscorner/detail/en/IP_16_3883 (Accessed July 09, 2023).
European Commission (2023a). The EU and the United Nations – common goals for a sustainable future. Avaliable At:https://commission.europa.eu/strategy-and-policy/sustainable-development-goals/eu-and-united-nations-common-goals-sustainable-future_en (Accessed July 12, 2023).
European Commission (2019). The European green deal. Avaliable At: https://eur-lex.europa.eu/legal-content/EN/TXT/HTML/?uri=CELEX:52019DC0640 (Accessed July 08, 2023).
European Court of Auditors (2023). Special report 18/2023: EU climate and energy targets – 2020 targets achieved, but little indication that actions to reach the 2030 targets will be sufficient. Avaliable At: https://www.eca.europa.eu/en/publications/SR-2023-18 (Accessed August 22, 2023).
European Environment Agency (2012). Greenhouse gas emission trends and projections in Europe 2012. Tracking progress towards kyoto and 2020 targets. Avaliable At: http://www.eea.europa.eu/publications/ghg-trends-and-projections-2012?utm_source=EEASubscriptions&utm_medium=RSSFeeds&utm_campaign=Generic (Accessed July 09, 2023).
European Environment Agency (2023). Primary and final energy consumption in Europe (8th EAP). Avaliable At: https://www.eea.europa.eu/ims/primary-and-final-energy-consumption (Accessed August 22, 2023).
European Environment Agency (2022). Trends and projections in Europe 2022. Avaliable At: https://www.eea.europa.eu/publications/trends-and-projections-in-europe-2022 (Accessed July 02, 2023).
European Parliament (2021). Climate action in Austria Latest state of play. Avaliable At: https://www.europarl.europa.eu/RegData/etudes/BRIE/2021/696186/EPRS_BRI(2021)696186_EN.pdf (Accessed August 24, 2023).
European Parliament (2023). Environment policy: General principles and basic framework. Avaliable At: https://www.europarl.europa.eu/factsheets/en/sheet/71/environment-policy-general-principles-and-basic-framework (Accessed July 10, 2023).
Eurostat (2023). Sustainable development goals. Database. Avaliable At: https://ec.europa.eu/eurostat/web/sdi/database (Accessed June 20, 2023).
Fedajev, A., Stanujkic, D., Karabašević, D., Brauers, W. K., and Zavadskas, E. K. (2020). Assessment of progress towards “Europe 2020” strategy targets by using the MULTIMOORA method and the Shannon Entropy Index. J. Clean. Prod. 244, 118895. doi:10.1016/j.jclepro.2019.118895
Firoiu, D., Ionescu, G. H., Pîrvu, R., Cismaș, L. M., Tudor, S., and Patrichi, I. C. (2021). Dynamics of implementation of SDG 7 targets in EU member states 5 Years after the adoption of the Paris agreement. Sustainability 13 (15), 8284. doi:10.3390/su13158284
Guzowska, M. K., and Kryk, B. (2021). Efficiency of implementing climate/energy targets of the Europe 2020 strategy and the structural diversity between old and new member states. Energies 14 (24), 8428. doi:10.3390/en14248428
Gyori, T. (2023). Categorisation of regions in the European Union based on smart and inclusive growth indicators for the Europe 2020 strategy. Reg. Stat. 13 (2), 299–323. doi:10.15196/RS130205
Jensen, L., and Fachada, J. C. (2021). Climate action in Austria Latest state of play. Avaliable At: https://www.europarl.europa.eu/RegData/etudes/BRIE/2021/696186/EPRS_BRI(2021)696186_EN.pdf (Accessed August 24, 2023).
Kang, D., and Lee, D. H. (2016). Energy and environment efficiency of industry and its productivity effect. J. Clean. Prod. 135, 184–193. doi:10.1016/j.jclepro.2016.06.042
Kryk, B., and Guzowska, M. (2021). Implementation of climate/energy targets of the Europe 2020 strategy by the EU member states. Energies 14, 2711. doi:10.3390/en14092711
Lebrouhi, B. E., Schall, E., Lamrani, B., Chaibi, Y., and Kousksou, T. (2022). Energy transition in France. Sustainability 14, 5818. doi:10.3390/su14105818
Leschke, J., Theodoropoulou, S., and Watt, A. (2012). “How do economic governance reforms and austerity measures affect inclusive growth as formulated in the Europe 2020 strategy?,” in A triumph of failed ideas: European models of capitalism in the crisis. Editor S. Lehndorff (Brussels, Belgium: ETUI), 243–281.
Liobikienė, G., and Butkus, M. (2017). The European Union possibilities to achieve targets of Europe 2020 and Paris agreement climate policy. Renew. Energy 106, 298–309. doi:10.1016/j.renene.2017.01.036
Lucian, P. (2022). The objectives of the Europe 2020 Strategy and Romania's achievements. Stud. Bus. Econ. 17 (2), 195–215. doi:10.2478/sbe-2022-0033
Marcillo-Delgado, J. C., Ortego, M. I., and Perez-Foguet, A. (2019). A compositional approach for modelling SDG7 indicators: Case study applied to electricity access. Renew. Sustain. Rev. 107, 388–398. doi:10.1016/j.rser.2019.03.028
Mathis, C. F. (2020). European environmental policy. Encyclopédie d'histoire numérique de l'Europe. Avaliable At: https://ehne.fr/en/encyclopedia/themes/political-europe/a-european-%E2%80%9Cmodel%E2%80%9D-defined-public-policies/european-environmental-policy (Accessed July 06, 2023).
Mikoláš, M., Kozel, R., and Vilamová, S. (2015). The new national energy concept 2015 - the future of brown coal in the Czech Republic. Acta Montan. Slovaca 20, 4.
National Climate Commission (2023). Belgium’s eighth national communication on climate change. Under the United Nations Framework Convention on Climate Change. Avaliable At: https://climat.be/doc/nc8-summary.pdf (Accessed August 24, 2023).
Nerini, F. F., Tomei, J., and To, S. L. (2018). Mapping synergies and trade-offs between energy and the sustainable development goals. Nat. Energy 3 (1), 10–15. doi:10.1038/s41560-017-0036-5
Nolan, B., and Whelan, C. T. (2021). Brian nolan and christopher T. Whelan (2011), poverty and deprivation in Europe. Oxford: Oxford university press. £55, pp. 275, hbk. J. Soc. Policy 42, 179–181. doi:10.1017/S0047279412000682
Picazo-Tadeo, A. J., Castillo-Gimenez, J., and Beltr an-Esteve, M. (2014). An intertemporal approach to measuring environmental performance with directional distance functions: Greenhouse gas emissions in the European union. Ecol. Econ. 100, 173–182. doi:10.1016/j.ecolecon.2014.02.004
Radulescu, M., Fedajev, A., Sinisi, C., Popescu, C., and Iacob, S. (2018). Europe 2020 implementation as driver of economic performance and competitiveness. Panel analysis of CEE countries. Sustainability 10, 566. doi:10.3390/su10020566
Roth, F., and Thum, A. (2020). “Economic policy, CEPS working documents,” in The key role of education in the Europe 2020 strategy (Brussels, Belgium: CEPS), 2020.
Ruser, A., and Anheier, H. K. (2014). The EU’s future role on the global stage. Glob. Policy 5, 58–67. doi:10.1111/1758-5899.12146
Schislyaeva, E. R., and Saychenko, O. A. (2022). Evaluation of post COVID-19 energy poverty and global trading impact on energy affordability. Front. Energy Res. 10, 971122. doi:10.3389/fenrg.2022.971122
Shyu, C. W. (2021). A framework for 'right to energy' to meet UN SDG7: Policy implications to meet basic human energy needs, eradicate energy poverty, enhance energy justice, and uphold energy democracy. Energy Res. Soc. Sci. 79, 102199. doi:10.1016/j.erss.2021.102199
Siksnelyte-Butkiene, I., Karpavicius, T., Streimikiene, D., and Balezentis, T. (2022). The achievements of climate change and energy policy in the European union. Energies 15, 5128. doi:10.3390/en15145128
Širá, E., Kotulič, R., Kravčáková Vozárová, I., and Daňová, M. (2021). Sustainable development in EU countries in the framework of the Europe 2020 strategy. Processes 9, 443. doi:10.3390/pr9030443
Smit, T. A. B., Hu, J., and Harmsen, R. (2014). Unravelling projected energy savings in 2020 of EU Member States using decomposition analyses. Energy Policy 74, 271–285. doi:10.1016/j.enpol.2014.08.030
Torney, D., and O’Gorman, R. (2019). A laggard in good times and bad? The limited impact of EU membership on Ireland’s climate change and environmental policy. Ir. Polit. Stud. 34 (4), 575–594. doi:10.1080/07907184.2019.1647174
Tutak, M., Brodny, J., and Bindzár, P. (2021). Assessing the level of energy and climate sustainability in the European union countries in the context of the European green deal strategy and Agenda 2030. Energies 14, 1767. doi:10.3390/en14061767
Uidhir, T. M., Rogan, F., and Gallachóir, B. O. (2020). Develop a LEAP GHG Ireland analytical tool for 2050. Avaliable At: https://www.epa.ie/publications/research/climate-change/Research_Report_349.pdf (Accessed August 25, 2023).
United Nations (2015). Transforming our world: The 2030 Agenda for sustainable development. Avaliable At: https://documents-dds-ny.un.org/doc/UNDOC/GEN/N15/291/89/PDF/N1529189.pdf?OpenElement (Accessed July 11, 2023).
Keywords: Europe 2020, 2030 Agenda, targets, renewable energy, energy consumption, greenhouse gas emissions
Citation: Gontkovičová B and Duľová Spišáková E (2023) Climate and energy targets under Europe 2020 strategy and their fulfillment by member states. Front. Environ. Sci. 11:1264770. doi: 10.3389/fenvs.2023.1264770
Received: 21 July 2023; Accepted: 07 September 2023;
Published: 18 September 2023.
Edited by:
Irena Jindrichovska, Czech University of Life Sciences Prague, CzechiaReviewed by:
Radka MacGregor, Metropolitan University Prague, CzechiaCopyright © 2023 Gontkovičová and Duľová Spišáková. This is an open-access article distributed under the terms of the Creative Commons Attribution License (CC BY). The use, distribution or reproduction in other forums is permitted, provided the original author(s) and the copyright owner(s) are credited and that the original publication in this journal is cited, in accordance with accepted academic practice. No use, distribution or reproduction is permitted which does not comply with these terms.
*Correspondence: Barbora Gontkovičová, YmFyYm9yYS5nb250a292aWNvdmFAZXViYS5zaw==; Emília Duľová Spišáková, ZW1pbGlhLmR1bG92YS5zcGlzYWtvdmFAZXViYS5zaw==
Disclaimer: All claims expressed in this article are solely those of the authors and do not necessarily represent those of their affiliated organizations, or those of the publisher, the editors and the reviewers. Any product that may be evaluated in this article or claim that may be made by its manufacturer is not guaranteed or endorsed by the publisher.
Research integrity at Frontiers
Learn more about the work of our research integrity team to safeguard the quality of each article we publish.