 Pengfei Shi
 Huibing Long2
95% of researchers rate our articles as excellent or good
Learn more about the work of our research integrity team to safeguard the quality of each article we publish.
Find out more
ORIGINAL RESEARCH article
Front. Environ. Sci. , 07 December 2023
Sec. Environmental Economics and Management
Volume 11 - 2023 | https://doi.org/10.3389/fenvs.2023.1260949
Tourism green production efficiency serves as the foundation for assessing the mutual coupling performance of the tourism economy and the ecological environment. In this paper, the tourism carbon sink is included in the measurement framework, and the TGPE of 41 cities in the Yangtze River Delta region from 2011 to 2019 is estimated by the Super-SBM model. Furthermore, kernel density estimate, spatial autocorrelation, Markov chain and spatial Durbin model are further integrated to explore its spatio-temporal evolution process, spatial effects and influencing factors. The results show that 1) TGPE in the Yangtze River Delta has been increasing during the study period. The high-efficiency and low-efficiency areas of the TGPE have a bipolar pattern characterized by “low–low convergence” and “high–high convergence.” 2) There is considerable spatial variation in TGPE from north to south. The number of hot spots and sub-hot spots increases in volatility, whereas the number of sub-cold spots and cold spots decreases. 3) Although cities with low levels of TGPE have a higher probability of moving to the next level, grade transformation across hierarchies is difficult to attain. When considering the factor of adjacent types and the influence of spatial lag on the transfer probability. 4) The positive spatial spillover effects of TGPE is significant. At the same time, economic development level, transport accessibility and tourism industry agglomeration have positive spillover effects on neighboring cities. Conversely, urbanization level and openness level have negative spillover effects.
As the scale of tourism continues to expand, the tourism industry has become disconnected from the concept of a “smokeless industry.” While this rapid development has brought economic benefits to cities, it has also resulted in environmental pollution, particularly in terms of carbon emissions, which constitute 8%–10% of the global total. Prior to the COVID-19 pandemic, carbon emissions from China’s tourism industry were increasing annually, directly impacting China’s “dual-carbon” goals. Meanwhile Transport, which accounts for more than 90% of tourism carbon emissions, has already made a major threat to human health (Li and Yue, 2023). However, scholars find that existing policies are insufficient to meet current needs and that there are significant deficiencies in climate change adaptation policies (Yu and Chen, 2022; Stephan et al., 2023). Therefore, “dual-carbon” goals have been incorporated into the overall framework of constructing an ecological civilization. Furthermore, the Chinese government has called for promoting green and low-carbon economic and social development as a key point in achieving high-quality development. The existing literature has found the circular business model is introduced as the pillar to achieve the goals of the circular economy to limit the exploitation of natural resources and waste generation (Thanh et al., 2022). For tourism industry, it is a dominant industry to promote the green transformation of China’s economy, so it should take the lead in returning to the essence of green industries, and play a leading role in efforts to reduce carbon emissions. Tourism green production efficiency (TGPE) refers to the integration of resources and environmental factors into the efficiency measurement framework to reflect the development of tourism economy, the core idea of which is to maximize economic benefits and minimize ecological damage with minimal input of tourism resources (Yao and Chen, 2016). Compared with other indicators on tourism development level, this indicator can measure the efficiency and quality of tourism development, represent the coupling and coordination degree between tourism system and ecological environment system, and directly reflect the low-carbon and sustainable development level of tourism industry. Therefore, in order to more accurately measure the TGPE, this paper further modifies the measurement framework, that is, the carbon sinks of tourism are taken into account, which is a theoretical contribution of this paper.
As an essential base for regional economic integration, the Yangtze River Delta region has the highest degree of regional openness, making it one of the most vibrant areas for China’s tourism economy. Alongside the development of the tourism economy in the region, there is a persistent issue of increasing carbon emissions, which hinders the industry’s sustainable growth (Yao et al., 2021). Given the high degree of integration within the Yangtze River Delta region, the extensive coverage and strong interdependence of the tourism industry, TGPE in the region may be affected by spatial spillover effects from neighboring regions (Lü et al., 2020). Therefore, achieving ecological development in the region’s tourism industry requires collaboration among cities and their neighbors. In light of the integrated development of tourism and the construction of an ecological civilization in the Yangtze River Delta region, it is of great significance to measure TGPE in the region and describe its spatial–temporal evolution trends, grade transformations, and spatial spillover effects from a geographical proximity perspective. It can be seen that this paper constructs a logical framework of spatial effects exist - transfer process of spatial effects—influencing factors of spatial effects, while most of the existing literature focuses on the influence of spatial effects, which is another theoretical contribution of this paper.
The current mainstream research paradigm of the TGPE follows the approach of “efficiency measurement–spatial evolution–reason analysis,” with data envelopment analysis (DEA) being the primary method for measuring efficiency. In particular, there is a tendency to employ the Slacks-Based Measure model (SBM) (Peng et al., 2017) in current literature, which takes into account non-radial and non-angular outputs and incorporates unexpected outputs (Wang et al., 2022a). Cheng et al. (2023) used the Super-SBM to calculate the TGPE of 12 cities in the Hanjiang River Basin from 2010 to 2019 and measured its spatiotemporal evolution, and found that the distribution of TGPE exhibited obvious spatial clustering and dependence. Wu and Liang (2023) also used Super-SBM to measure the TGPE of 31 provinces from 2010 to 2019 in China and analyzed the comprehensive impact of environmental regulation on TGPE. They found that there were high and low differences in the efficiency among provinces and regions with uneven distribution. This technique requires the construction of an input–output framework as a prerequisite. In most studies, input indicators include capital, resources, and energy consumption, while output indicators include total tourism revenue and tourism carbon emissions (Tsionas and Assaf, 2014). However, the aforementioned framework does not completely account for the positive externalities of tourism development. As a green industry, tourism not only generates carbon emissions but also possesses the abilities of carbon sinks. Carbon sinks are actions, activities, or mechanisms that fix and absorb carbon dioxide in the air (Wei and Shen, 2022). Tourism destinations comprise the entirety or a portion of mountains, waters, forests, farmlands, lakes, grasslands, and deserts as a complex system. Carbon emissions associated with tourism may be partially mitigated by the carbon sequestration capabilities of ecosystems such as forests, grasslands, wetlands, and oceans. Some academics have acknowledged the importance of measuring tourism carbon sinks (Dong et al., 2018; Zhu and Wang, 2022). Neglecting the carbon sequestration function of the tourism industry may lead to inaccurate TGPE measurements. Therefore, incorporating tourism carbon sinks and reconstructing the measurement framework of TGPE are the primary scientific challenges addressed in this study.
Numerous researchers have measured TFPE at various spatial scales, encompassing the entire nation (Wang et al., 2018), provinces (Yao et al., 2016), urban agglomerations (Shi et al., 2022), tourist destinations and scenic areas (Medina et al., 2012; Tang et al., 2022). These comprehensive assessments have advanced the field of research. However, intermediate regions such as the Yangtze River Delta region have received less attention, and there is a scarcity of studies focusing on individual cities within the region. Cities, being the most active unit in tourism, have shifted their development path from a “single-city” approach rooted in central place theory to a “connected cities” paradigm based on spatial network theory. The role of cities within the spatial network is crucial for achieving regional reductions in tourism-related carbon emissions. Furthermore, numerous scholars have focused on “spatial interaction” in relation to TGPE. The literature has revealed the presence of spatial correlation in TGPE (Wang et al., 2020), namely, the existence of spatial spillover effects by global and local spatial autocorrelation (Zheng and Yang, 2020). In addition, extensive research has focused on the analysis of factors affecting TGPE. Some researchers have employed spatial econometric models to determine the magnitude of spatial spillover effects, enabling a better understanding of the direct and indirect effects of influencing factors, for example, the Moran’s index and spatial Durbin model (SDM) were adopted to explore the spatial distribution and determinants of TGPE by Gao and Tsai (2023). It is evident that previous studies have primarily established the existence of spatial spillover effects and have swiftly moved on to measuring these effects, without elucidating the impact of neighborhood types on regional transitions during spatial evolution. This procedural disconnect in spatial econometric analysis highlights the inadequacy of the current system for analyzing spatial spillover effects on TGPE. Consequently, research must systematically interpret spillover effects in accordance with the logic of “effect testing–process of action–influencing factors,” which is the second essential scientific issue addressed in this study.
To sum up, there is a lot of existing research on TGPE, which has laid a theoretical foundation for the paper. However, there are still the following limitations. First, the existing TGPE measurement framework is not systematic and has not fully considered the positive externalities of tourism, that is, tourism carbon sinks have not yet been included in the measurement system as an indicator of expected output. Second, current scholars mostly focus on the analysis of spatiotemporal evolution trend and spatial spillover effects of TGPE. However, the system is not perfect, and there is no research based on the logical sequence of judgment of the existence of spatial effect, analysis of the process of spatial effect, and identification of influencing factors of spatial effect. So it is difficult to clarify the process and mechanism of the spatial impact of neighboring areas on the TGPE of the region.
In view of this, this paper incorporates the tourism carbon sinks as the expected output into the reconstructed measurement model, employs the Super-SBM model to estimate TGPE in the Yangtze River Delta region from 2010 to 2019, and uses the spatial analysis methods to describe its spatiotemporal evolution characteristics. Finally, the spatial Durbin model is employed to explore its spatial spillover effects and influencing factors.
In order to understand the spatio-temporal evolution of TGPE in the Yangtze River Delta and identify its spatial effects, this paper constructs the following theoretical framework (Figure 1).
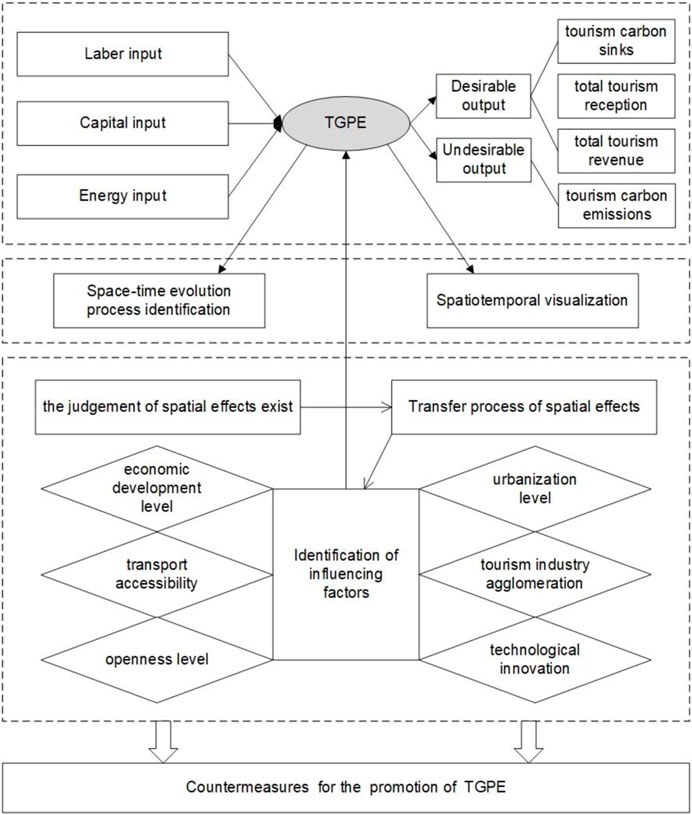
FIGURE 1. The theoretical framework of the paper.
There are three parts in the section, including the introduction of the research area, construction of index system and description of research methods. For the research methods, this paper measures TGPE with the help of Sup-SBM model, makes use of kernel density estimation and Exploratory Spatial Data Analysis (ESDA) to describe the spatial–temporal evolution characteristics of TGPE in the region, selects the Markov chain to describe the process of spatial action, and identifies the direct and indirect effects of factors affecting TGPE by spatial Durbin model.
The Yangtze River Delta region is situated in the flood plain of the lower reaches of the Yangtze River in China and comprises Shanghai city, Zhejiang province, Jiangsu province, and Anhui province (Figure 2). There are seven World Heritage sites, including West Lake, Huangshan Mountain, and the Beijing-Hangzhou Grand Canal, as well as over 2,000 A-class scenic locations in the region. The government formulated The Plan for the “Yangtze River Delta Urban Agglomeration Development Plan” in 2016, and pointed out that the Yangtze River Delta region would to be created to a national economic growth pole and world-class city cluster with global influence. The integrated development of the Yangtze River Delta has been the national strategy since 2019, and it was emphasized again to promote the cooperation capacity of inter-regional tourism supply and jointly construct an internationally renowned tourist destination in the new document. According to statistics, the total tourism revenue in the region reached 3.9 trillion yuan in 2019, accounting for 68.4% of the national and 9.8% of the global total tourism revenue, indicating that the region has become a tourism development hot spot in China and the world.
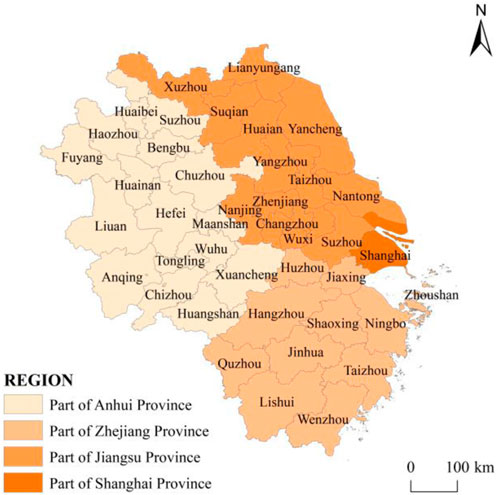
FIGURE 2. The regional division of the Yangtze River Delta.
The TGPE reflects the development status of tourism and ecology, and its measurement should fully measure the combination of input and output factors of tourism and ecology environment. A measurement indicator system for TGPE for TGPE (Table 1) was constructed based on scientific, systematic, and exhaustive principles, as well as the requirements of the Super-SBM model for multiple inputs, expected outputs, unexpected outputs, and previous research (Wang et al., 2020; Zheng and Yang, 2020; Cheng et al., 2021). The specific construction process is as follows.
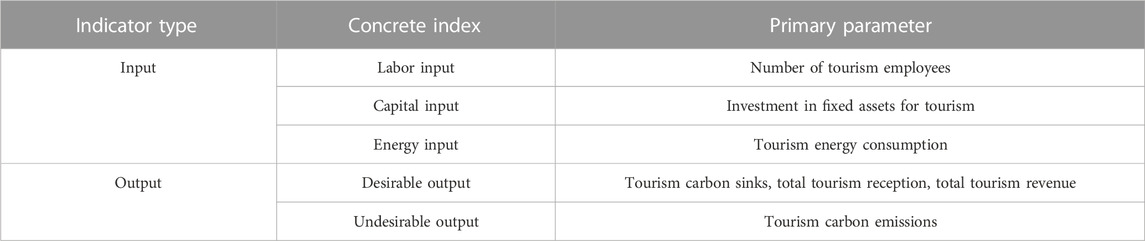
TABLE 1. TGPE measurement index system.
In the economic sense, the input of production factors mainly includes capital, land, labor and other factors. Combining tourism characteristics with reference to existing research (Wang et al., 2020; Cheng et al., 2021), the labor input indicator is represented by the number of employees in the tourism industry. According to the research by Wang and Liu (2019), the capital investment indicator is represented by the original amount of investment in fixed assets in the tourism industry. Meanwhile, drawing on Fang and Huang (2020)’s research, the capital investment indicator is represented by the original amount of investment in fixed assets in the tourism industry.
The energy input indicator is represented by the energy consumption of the tourism industry. Notably, China’s energy statistics do not separately account for energy consumption in the tourism industry; therefore, referring to Wang et al (2020) research, the necessary data from energy statistics were extracted, and specific research methods about tourism industry’s energy consumption (2013) are referenced by Huang and Huang. (2022), Irfan et al. (2023) and Katircioglu et al. (2019).
Drawing on Wang et al. (2020) and Huang and Huang (2022)’s research, output indicators in the measurement indicator system comprise expected and unexpected outputs. Based on existing literature analysis (Wang et al., 2020; Cheng et al., 2021), expected outputs include tourism carbon sinks, total tourism reception, and total tourism revenue. The calculation of tourism carbon sinks follows a common calculation method that considers land use data and carbon absorption coefficients to estimate the overall carbon sequestration of a city. Then tourism carbon sinks are derived from the overall carbon sequestration based on the degree of tourism development, and the specific calculation methods refer to the literature of Zhu and Wang (2022). Unexpected outputs are represented by carbon emissions from tourism. The calculation of carbon emissions from tourism follows the methodology proposed by scholars like Wang et al. (2013a).
Tourism development not only produces positive externalities, such as the increase of tourism revenue, but also negative externalities, such as tourism carbon emissions, that is, undesirable output. The Super-SBM model proposed by Tone (2001) addresses the limitations of the Data Envelopment Analysis (DEA) model (Farrell, 1954). While the DEA model does not account for unexpected outputs, the SBM model overcomes this limitation. However, it faces challenges in dealing with multiple units with relatively effective efficiencies, resulting in poor comparability between measurement units. Therefore, Tone (2002) developed a super-efficiency model for SBM (Super-SBM) to more effectively address the issue of ineffectual ranking by relaxing ineffective Decision Making Units (DUM) variables, and this model is also chosen as a speed measuring tool in this paper. The structure of the model is as follows:
In this model, n represents the decision-making unit, ρ* represents TGPE in the region and 41 cities, m represents the number of inputs required for tourism development, and r1 and r2 represent the number of expected and unexpected outputs of tourism.
The kernel density estimate is an estimate of the probability density of the population data based on a finite sample of data (Parzen, 1962). Its biggest advantage is that it can visually show the shape of the data distribution and help identify outliers. Therefore, it was used to investigate the dynamic distribution and evolution of TGPE in the Yangtze River Delta. Assuming that f(c) is the density function of TGPE, the following formula is as follows:
In Formula 2, K(c) denotes the kernel function, Ci denotes independent and identically distributed observations, c denotes the mean, and ρ denotes the bandwidth. Furthermore, the commonly used Gaussian kernel function is chosen to estimate the dynamic distribution of TGPE in the Yangtze River Delta. The kernel function can be expressed as follows:
In order to better describe the spatial distribution, spatial pattern and spatial interaction implied by TGPE, exploratory spatial data analysis (ESDA) is introduced in this study. ESDA mainly uses two analysis tools, global spatial autocorrelation analysis and local spatial autocorrelation analysis. Among them, global spatial autocorrelation analysis is based on the overall perspective to determine whether the spatial elements of different regions are interrelated or independent, which is represented by Moran’s I index. And the Moran’s Ⅰ index is computed as follows:
In Formula 4, xi and xj represent the measured values of TGPE in the ith and jth cities,‾x represents the average value of TGPE, wij is the spatial vector matrix, and n is the number of cities in the Yangtze River Delta.
In view of the fact that Moran’s I index is described from a global perspective, which leads to a large degree of average differences among units within a region, local spatial autocorrelation analysis is introduced to describe whether there is agglomeration among units within a region, that is, Getis-Ord G*i index characterization. The index can visually express regional cold and hot spots, and the specific formula is as follows:
The formula for standardizing Gi* is as follows:
In Formula 6, Var(Gi*) and Z(Gi*) represent the coefficient of variation and the expected value of Gi*, respectively. A positive Z(Gi*) value indicates that the region is a hot spot and a negative value indicates that the region is a cold spot.
The traditional Markov chain refers to the random evolution process of the research object which is discrete in time and state and has nothing to do with history and future, which reflects the non-after-effect of the research object. The TGPE also has no after-effect in its evolution process, so the Markov chain method can be used to explore its upward or downward transfer mobility characteristics.
The fundamental principle of this method is to discretize the research object into K different states at various time intervals, and calculate the distribution probabilities and transition characteristics of the various states, and then approximating them as a Markov process. In this study, TGPE at time t is represented by a 1 × k state probability vector Ht = [H1,t, H2,t, … , Hk,t]. The transition of TGPE at different periods can be represented by a k × k matrix M. Based on the principle of close numerical values, TGPE in the Yangtze River Delta is divided into four types according to quartiles (0.25, 0.50, 0.75), represented by k = 1, 2, 3, 4. Matrix M is the Markov transition probability matrix for TGPE, with the element Pij representing the probability of transitioning from the i-state region at time t to the j-state region at t + 1, which is estimated using the following formula:
In Formula 7, Ai represents the total number of regions belonging to type i during the research period. Aij represents the total number of regions belonging to type i at time t and type j at time t + 1.
Although traditional Markov chain overcomes the limitation, it cannot show dynamic distribution, and its assumed region is isolated and fails to consider specific spatial factors. From a spatial perspective, spatial units are not viewed as isolated entities but rather exist as spatial collateral effects during the interaction process. To capture spatial spillover effects on state transitions, the spatial Markov chain is employed. By introducing the concept of “spatial lag,” this model converts the transition probability matrix of a conventional Markov chain into k conditional probability matrices of size k × k. Specifically, the formula is as follows:
In Formula 8, Yb denotes the observed value of region b, Laga denotes the spatial lag value of region a, n denotes the total number of cities, and the spatial weight matrix Wab represents the spatial relationship between two regions. In this study, the spatial relationship between cities was established based on the principle of adjacency. Specifically, when examining the island effects of Zhoushan, previous research findings were referred to, and the city closest to Zhoushan was identified as its adjacent city (Wang et al., 2020).
In general, the traditional regression model cannot solve the spatial problem, mainly because it assumes that different samples are independent. Under this assumption, spatial autocorrelation will affect the results of regression analysis, resulting in inaccurate regression coefficient and even false correlation phenomenon. The spatial Durbin model considers not only the characteristics of the research object, but also its effect on neighboring regions. Consequently, this model has been extensively utilized in spatial effect analysis (Li and Wu, 2017; Feng et al., 2019; Han et al., 2020; Ge et al., 2021; Wang et al., 2021). The specific formula is as follows:
In Formula 9, Yit and Xit respectively represent the observed values of the ith city’s TGPE and explanatory variables in period t, ρ is the spatial autoregressive coefficient of the city’s TGPE, φ represents the spatial spillover coefficient, and Wij is the 41 × 41 spatial weight matrix.
The spatial Durbin model considers the endogenous interaction effects between the explanatory and dependent variables of both the local and neighboring areas. The model allows to examine the direct effects of the explanatory variables on the dependent variable within a spatial unit and the indirect effects of the explanatory variables on the neighboring areas, known as spatial spillover effects (LeSage and Pace, 2009). Partial differential equations are used to further decompose the coefficients estimated by Formula 9 to obtain the following formula:
In Formula 10, kIN represents the spatial error term, and Xt represents the N×M-dimensional explanatory variable matrix. Other variables are defined as in Formula 9. By taking the partial differentiation of the kth explanatory variable in Formula 10, the formula is as follows:
In Formula 11, the average of the diagonal elements on the right-hand matrix represents the direct effects, whereas the average of the off-diagonal elements represents the residual effects. The cumulative effects equal the sum of the two effects.
The original data used in this study were obtained from various sources, including China Statistical Yearbook, China Culture and Tourism Yearbook, and China Energy Statistical Yearbook from 2010 to 2019. Provincial and municipal statistical yearbooks as well as the “National Economic and Social Development Statistical Bulletin” were considered. Some data were obtained through consultations with tourism bureaus and statistical bureaus in various cities. For missing data, interpolation techniques using Stata software 2016 were applied. To adjust for inflation, the relevant value data were deflated using 2010 as the base year. Geographic data were sourced from the National Administration of Surveying, Mapping, and Geoinformation of China’s 1:1,000,000 national fundamental geographic database.
In terms of temporal dynamics, TGPE in the Yangtze River Delta region exhibited a clear upward trend during the study period, with an average increase of 9.3% in the first 5 years (Figure 3). After 2015, the average growth rate accelerated by 18.8%, rising from 0.2405 in 2010 to 0.8066 in 2019 (Figure 3). The standard deviation of TGPE in the region also increased marginally (Figure 2). Specifically, the standard deviation of TGPE increased from 0.1526 in 2010 to 0.2758 in 2019, indicating a modest increase of 0.1322. It can be seen that in recent years, the relationship between the tourism industry and the ecological environment in the region has continued to develop in a coordinated direction, which has significantly improved the TGPE, but it has not yet risen to the optimal production frontier. In addition, the standard deviation of TGPE in the region increased slightly, indicating that the dispersion of efficiency values at the end of the study period has expanded. It may be that cities with high TGPE have a “siphon effect” on surrounding cities due to the energy level, magnitude and industry correlation of their own tourism industry, that is, the production factors of TGPE flow into these cities, thereby widening the differences between cities.
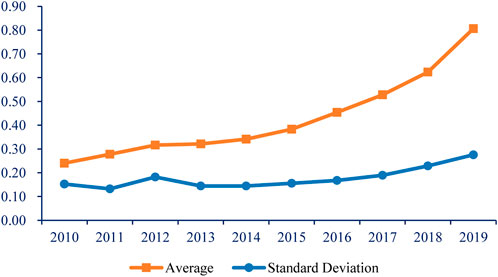
FIGURE 3. Time trend of TGPE in the Yangtze River Delta from 2010 to 2019.
Kernel density estimation was used to determine the three-dimensional map of TGPE. In terms of distribution location and form, the center position of the overall distribution curve and the range of fluctuations shifted toward the right (Figure 4), which showed that the TGPE in the region was increasing year by year. From the perspective of distribution pattern, the overall peak height exhibited an inverted V-shaped trend and the width of the main peak continued to expand (Figure 4), indicating that the distribution of TGPE in cities in the region was gradually dispersed, and regional differences were enlarged. Concerning distribution extensibility, the left tail phenomenon of the curve substantially weakened, whereas the right tail phenomenon became more pronounced and gradually increased (Figure 4), indicating that the TGPE of urban tourism in low-low agglomeration areas has further improved, while cities in the high-efficiency stage continued to maintain an absolute lead during the study period. From the perspective of distribution polarization, the curve distribution maintained a unimodal form from 2010 to 2018, and transformed into a bimodal distribution form with a lower peak height in 2019 (Figure 3), which showed that the TGPE in the region has a tendency to transform from a unipolar situation to a polarized pattern of “low-low convergence” and “high-high convergence,” that is, there is “club convergence.”
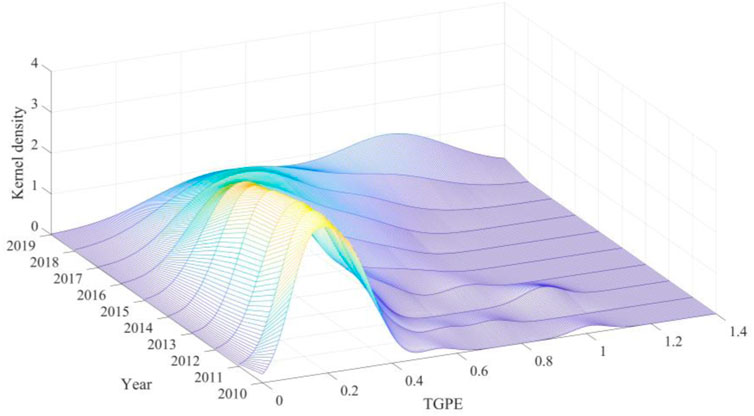
FIGURE 4. Dynamic evolution of TGPE in the Yangtze River Delta from 2010 to 2019.
To elucidate the spatial pattern changes of TGPE in the Yangtze River Delta, 4 years for spatial visualization: 2010, 2013, 2016, and 2019 were selected. Using the Getis-Ord Gi* index and the natural break point method, TGPE in the Yangtze River Delta was divided into four efficiency zones (Figure 5): hot spots, sub-hot spots, sub-cold spots, and cold spots.
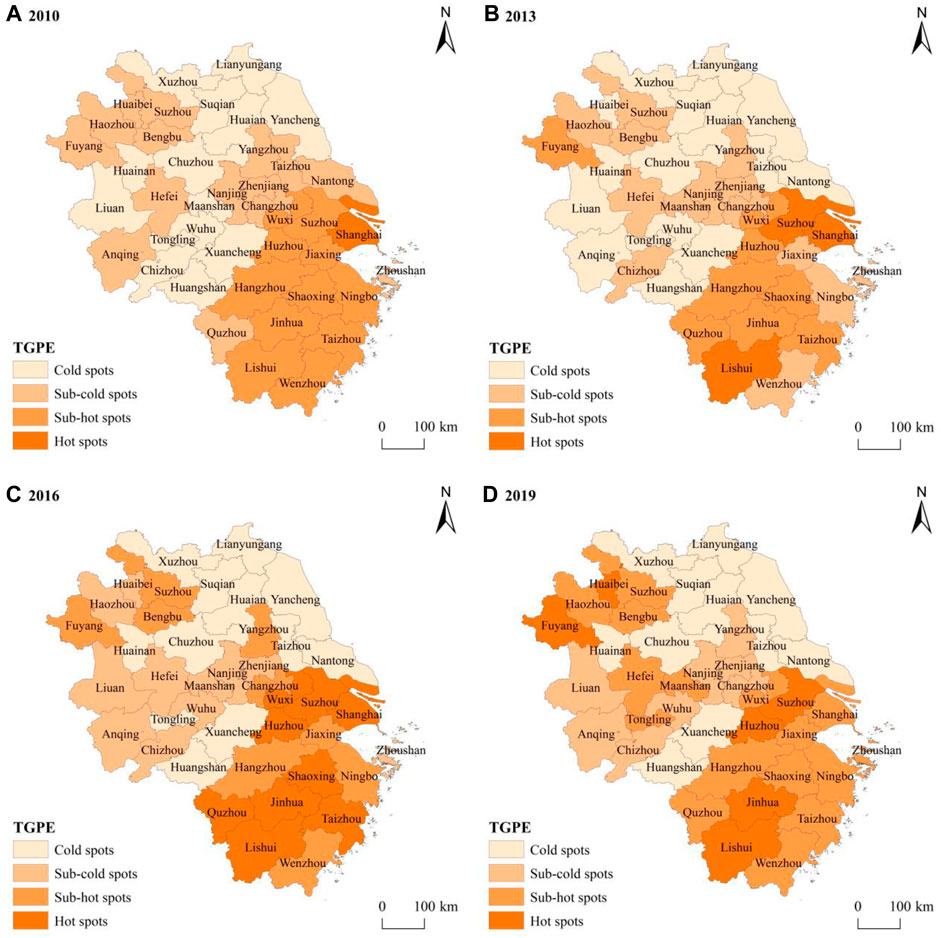
FIGURE 5. Spatial evolution of TGPE in the Yangtze River Delta in (A) 2010, (B) 2013, (C) 2016, and (D) 2019 year.
Throughout the research period, the overall spatial pattern of TGPE in the Yangtze River Delta displayed a ranking order of Shanghai > Zhejiang > Jiangsu > Anhui, forming a decreasing semi-circular layer spatial pattern from Shanghai to the adjacent areas (Figure 4). There was also a degree of spatial aggregation, and a north–south differentiation pattern was observed, with the “Hangzhou–Huzhou–Wuxi–Suzhou–Shanghai” line serving as the boundary (Figure 5).
Specifically, 1) The number of hot spots exhibited an upward trend followed by a downward trend. In 2010, there was only one TGPE hot spot in Shanghai, but the number increased to nine in 2013 and 2016 in the adjacent areas of Shanghai and the central-southern portion of Zhejiang. In 2019, the number decreased to six, with dispersed concentrations emerging in the northwest of Anhui (Figure 5). It can be seen that the evolution of hot spots was dependent on tourism central cities, and it also drived the TGPE of surrounding areas to converge towards high values, such as Shanghai and Suzhou with developed tourism economy and high degree of tourism intensification, Jinhua with rich tourism resources and Lishui with vigorous development of ecological tourism. 2) The number of sub-hot spots exhibited a decreasing trend followed by an increasing trend, ultimately increasing from 11 in 2010 to 16 in 2019, primarily concentrated in Zhejiang province, including cities like Hangzhou, Huzhou, Jiaxing, and Taizhou, with occasional distribution in central and northern Anhui and southern Jiangxi (Figure 5). This showed that many cities with medium and low efficiency had experienced the stage of tourism development’s stress on the ecosystem, and the extensive tourism development mode had reduced the sub-hot spots to some extent since 2010. However, with the deepening of the concept of low-carbon tourism, the tourism industry has gradually transformed towards intensification and efficiency. The tourism industry has achieved remarkable results in energy conservation and emission reduction, thus eventually forming a continuous urban belt with high efficiency value since 2013. 3) The number of sub-cold spots steadily decreased from 15 in 2010 to 8 in 2019, with sporadic distribution in Zhejiang in certain years. The area of sub-cold spots gradually decreased, eventually converging in Anhui and Jiangsu (Figure 4), indicating that sub-cold spot areas gradually transformed into hot spots and sub-hot spots and TGPE showed convergence in space, which was the same as the previous kernel density estimation results. 4) The cold spots mainly clustered in the outer circle of Jiangsu and Anhui, exhibiting a patchy distribution. The number of cold spots decreased slowly with time, from 14 in the early years of the study period to 11 in later years, including Yancheng, Lianyungang, Huangshan, and other cities (Figure 5). This phenomenon may be influenced by the “backflow effect” caused by the outflow of development elements. As a result, these cities have been in the cold spot area for a long time, which has widened the gap between cities in the region to a certain extent.
As observed in Table 2, the global Moran’s I index exhibited a zigzag pattern with an initial increase followed by a decrease when considering the geographic adjacency weight matrix. The highest and lowest values recorded were 0.5244 and 0.3034, respectively. Moran’s Ⅰ index of each year passed the significance test at the 1% level, demonstrating the relatively variable spatial agglomeration of TGPE in the region. A high positive spatial autocorrelation of TGPE was observed in the region, i.e., areas with high efficiency tended to congregate, whereas areas with low efficiency were relatively close in terms of layout. This finding suggested that TGPE not only depended on the degree of coupling between the tourism industry and the resource environment but also had a significant correlation with neighboring cities. This verification confirmed the existence of spatial spillover effects in the region, making the region suitable for analyzing spatial Markov transition probability matrices and spatial econometric models to investigate its mechanism of action in greater detail.
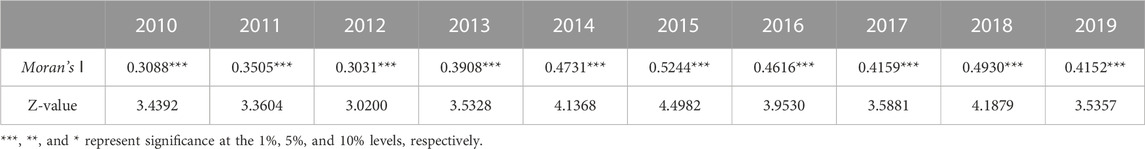
TABLE 2. Moran’s Ⅰ index of TGPE in the Yangtze River Delta from 2010 to 2019.
We created both the conventional Markov transition probability matrix and the spatial Markov transition probability matrix based on the spatial adjacency matrix to comprehensively analyze the spatial effects of TGPE in the region. We divided TGPE into four discrete categories, corresponding to k = 1, 2, 3, 4: low intensity, relatively low intensity, relatively high intensity, and high intensity. The transitions from low values to high values were classified as upward transitions, whereas those from high values to low values were classified as downward transitions. The results of the calculations (Table 3) were as follows: 1) The off-diagonal probabilities were all lower than those on the diagonal. The maximum and minimum values were 100% and 61.76%, respectively, which suggested that the lowest probability of maintaining the original state during the inspection period is about 60%, which showed that the transformation of tourism green production efficiency type in the region was stable and the probability of maintaining the original state was relatively high. Additionally, the probabilities of the low-intensity and high-intensity types remaining unchanged were 72.82% and 100%, respectively, indicating the possibility of “club convergence” toward the low- and high-intensity types of TGPE. 2) The stability of the low- and high-intensity types at both ends of the diagonal was substantially greater than that of the intermediate low- and high-intensity types (61.76% and 68.13%, respectively). In contrast, the probability of a downward transition for intermediate types (0.00% and 2.2%, respectively) was lower than that of an upward transition (61.766% and 68.13%), indicated that there was the excellent development potential of regions with intermediate types of low and high intensity, however, a decline should be avoided. 3) The probabilities on both sides of the diagonal were relatively low, with the probabilities of upward and downward transitions being 0.98% and 1.10%, respectively, which suggested that the improvement of TGPE in 41 cities in the region was a continuous and gradual process, and that achieving rapid leaps was challenging.
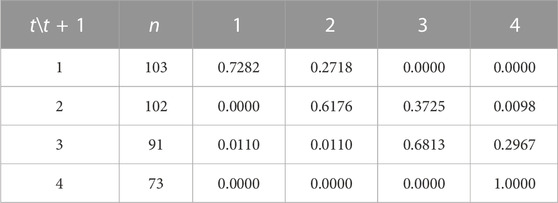
TABLE 3. Types of TGPE in the Yangtze River Delta from 2010 to 2019 (traditional Markov transfer probability matrix).
Furthermore, we conducted a hypothesis test to determine whether the effect of neighboring cities on the development of a city’s TGPE was statistically significant. The null hypothesis states that regional TGPE types are spatially independent and unrelated to spatial latency types. Using the model
We incorporated spatial latency conditions into the conventional Markov chain transition probability matrix to generate a spatial Markov transition probability matrix. Through a comparative analysis of the transition probabilities of TGPE under various neighborhood contexts, we explored the role of neighborhood context in the level transition process. The findings from Table 4 are as follows: 1) The geographical context significantly influenced the transfer process of TGPE in the region. By comparing the traditional Markov transfer probability matrix, we observed substantial changes in the transfer probability of TGPE in the region in response to various geographical contexts. 2) A complementary relationship was observed between the type of TGPE of the metropolis and the types of surrounding cities. When the neighborhood type was set to 1, the number of cities in the low-intensity type at time t was considerably greater than the number of cities in the other types. When the neighborhood type was set to 4, the number of cities in the high-intensity type at time t was substantially greater than the number of cities in other types, indicating a “club convergence” local spatial pattern for TGPE in the region. 3) The probability of downward transfer of TGPE types from the city increased for neighboring areas with low TGPE values. The probability of upward transfer increased for neighboring areas with high TGPE values.
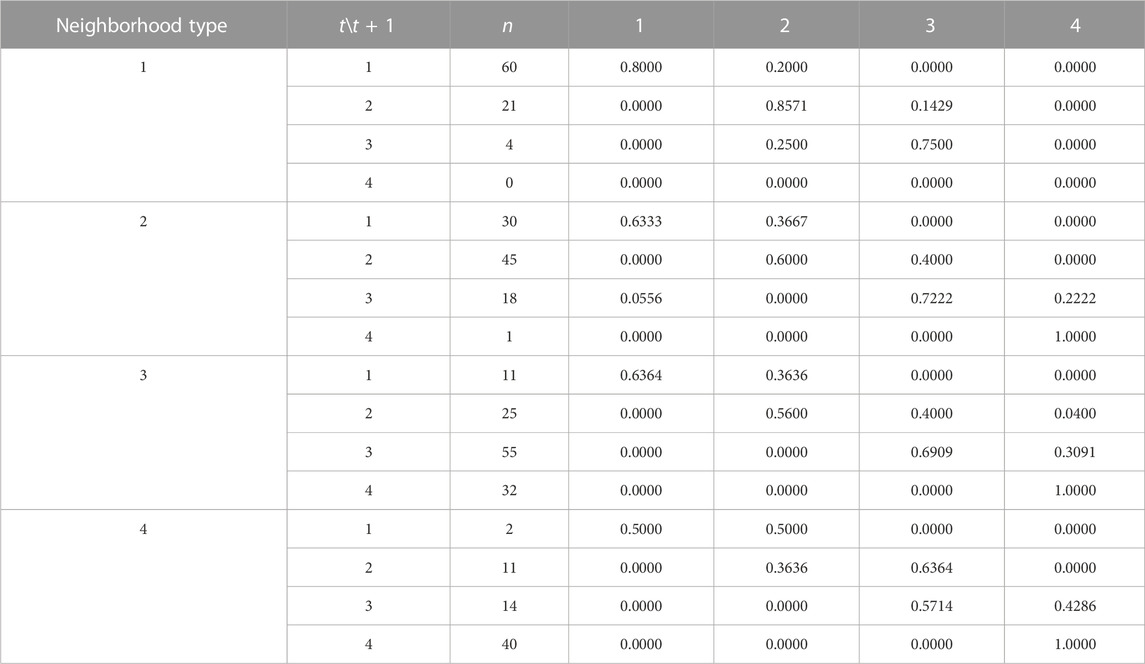
TABLE 4. Types of TGPE in the Yangtze River Delta from 2010 to 2019 (spatial Markov transition probability matrix).
We developed a spatial econometric model to precisely quantify the direction and degree of the factors influencing TGPE. Various factors related to the economy, society, and technology were considered as potential influences on TGPE. Considering the composite characteristics of the tourism industry system, the conditions and trends of tourism industry development in the Yangtze River Delta, and the comprehensive research results from the literature (Tang et al., 2014; Shi and Li, 2018; Sun et al., 2022), we used the following variables influencing the spatial spillover effects of TGPE: economic development level (EDL), measured by per capital GDP, reflecting the overall economic prosperity of the region; transport accessibility (TRA), represented by road density, indicating the ease of movement and connectivity within the area; urbanization level (UR), measured as the urban population as a percentage of the total population, indicating the degree of urban development and concentration; openness level (OE), captured through the actual utilization of foreign investment, reflecting the level of openness to international economic activities; tourism industry agglomeration (TIA), assessed using tourism revenue location entropy, measuring the concentration or dispersion of the tourism industry within the region; and technological innovation level (TEC), reflected by the total number of three types of patent authorizations, indicating the level of technological advancement and innovation in the area. To address potential heteroscedasticity, the time-series data of the selected variables were logarithmically transformed.
Prior to conducting our spatial econometric analysis, a model selection process was performed through a series of experiments (Table 5). Both LM-Lag and robust LM-Lag, as well as LM-Error and robust LM-Error, passed the hypothesis tests at the 1% significance level, indicating that the spatial Durbin model with spatial lag and spatial autocorrelation effects should be selected. Using the Wald and LR tests, we determined that both tests were significant at the 1% level, further supporting the selection of the spatial Durbin model as the best model. The Hausman test yielded a result of 47.52, rejecting the null hypothesis of random effects at the 1% significance level. Compared with time and space fixed effects, double fixed effects were rejected at the 1% significance level. Accordingly, we chosed the spatial Durbin model with double fixed effects as the appropriate model to fit and estimate TGPE in the Yangtze River Delta.
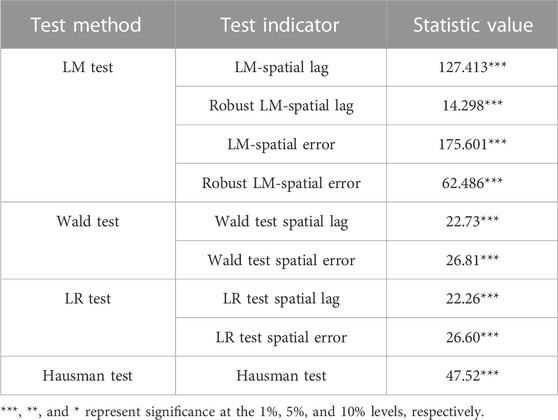
TABLE 5. Selection test of spatial metrology model.
As can be seen from Table 6, the model achieved an Adj.R2 of 0.8965. Moreover, the Log-L value was 363.5008, supporting the suitability of the spatial Durbin model as the most accurate estimation model. The spatial spillover coefficient (ρ) was 0.1692 and was significant at the 5% level, indicating that there was substantial positive spatial spillover effects of TGPE in the region, namely, the presence of clustering and demonstration effects in the coordinated development of adjacent area. However, the elasticity coefficient and its significance may not provide a complete understanding of the marginal effect of TGPE. Accordingly, we employed the SDM partial differentiation method to further divide the spatial effects into direct, indirect, and total effects.
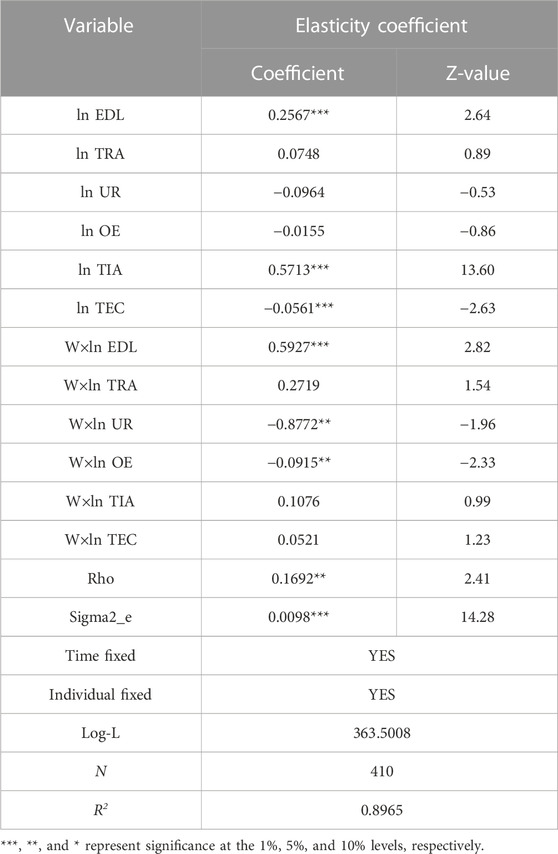
TABLE 6. Regression results of dual fixed effect space Durbin model.
From the perspective of spatial effect decomposition, the analysis revealed the following based on the Table 7:
(1) the coefficients of the direct and indirect effects of EDL were 0.2801 and 0.7371, respectively, and both were significant at the 1% level, indicating that EDL acts as a driving force for improving TGPE in the region, and it can promot the improvement of tourism green development performance in neighboring cities. On the one hand, economic development provides the economic foundation for tourists to have disposable income, which is essential to engage in tourism activities, thereby stimulating the growth of local and neighboring tourism demand. On the other hand, frequent business exchanges and trade increase the region’s visibility and influence, thereby increasing the scale of tourism flows between regions. To a certain extent, economic development can promote the rationalization and upgrading of the tourism industry’s structure. Through a large influx of capital, it can provide a material basis for enhancing the ecological environment.
(2) The coefficients of the direct and indirect effects of TRA were 0.0922 and 0.3324. However, only the indirect effects were statistically significant at the 5% level, which suggested that TRA positively promoted TGPE in surrounding cities. As an important vector of regional radiation, the increase in transport network density dismantles urban boundaries, drastically reduces the spatial and temporal distance between tourism source and destination, and facilitates the rapid movement of people, goods, and capital between regions. Besides, tourism transport is the primary source of tourism carbon emissions. Regions with higher road network density generate more tourism transport carbon emissions, and the construction of transport infrastructure may also occupy carbon sink land. Thus, the local tourism industry may endure the brunt of the impact of tourism transportation carbon emissions, as it may be decoupled from tourism economic development.
(3) The coefficient of the direct effects of UR was −0.1445, which failed the significance test. The coefficient of the indirect effects at −1.0994 was significant at the 5% level, indicating that urbanization development in the region has impeded the enhancement of TGPE, with more pronounced effects on neighboring regions. In the process of urbanization, the Yangtze River Delta region has experienced high urbanization rates and developed a comprehensive urban infrastructure. However, it has not yet transitioned to green urbanization. First, in the process of tourism urbanization, the development of resource-intensive tourism infrastructure has shifted from economic centers such as Shanghai and eastern Zhejiang to regions such as northern Jiangsu and southern Anhui to reduce costs. This shift has resulted in increased energy consumption and carbon emissions. In addition, it has led to a decrease in wetland scenic areas in northern Jiangsu and southern Anhui. Second, urbanization involves the migration of rural populations to urban areas, with the entry and departure of neighboring and tourist populations. The large influx of people increases the population density in urban areas, resulting in a heavy burden on land carrying capacity, high costs associated with supplying tourism resources, and difficulties in environmental governance.
(4) The coefficients of the direct and indirect effects of OE were −0.0173 and −0.1079, respectively, which showed the negative impact of the current level of foreign investment on TGPE in both local and neighboring cities. It is speculated that the current role of foreign investment in the Yangtze River Delta on TGPE is still in the suppression stage of the Environmental Kuznets Curve. The influx of foreign capital has been directed toward resource-intensive and labor-intensive industries, resulting in excessive pollutant emissions, which partially offsets the positive effects of tourism development. A strong spatial correlation exists between the concentration of foreign investment and environmental degradation, both exhibiting spatial spillover effects. Regions with high pollution levels may experience “pollution leakage,” thereby inhibiting TGPE in adjacent regions.
(5) The coefficients of the direct and indirect effects of TIA were 0.5703 and 0.2337, respectively, which passed the significance tests at the 1% and 5% levels. These findings suggest that TIA plays a crucial role in promoting the development of TGPE in both local and surrounding areas, with the local area experiencing the most pronounced effects. The high concentration of the tourism industry in the Yangtze River Delta has contributed to its regional brand advantage and cost advantage. By leveraging the potential for economies of scale, the local tourism industry fully utilizes its input factors, resulting in increased competitiveness. Moreover, through the sharing and opening up of resources, a favorable external environment is created for various sectors such as transportation, wholesale and retail, accommodation, and catering. In turn, it promotes the formation of regional tourism industry chains and industrial ecosystems, creating the conditions for the modernization of the tourism industry in neighboring regions.
(6) The coefficient of the direct effects of TEC was −0.0527, which passed the significance test at the 5% level, and the coefficient of the indirect effects was 0.0516, which failed the significance test. The results indicates that technological advancements have not enhanced the ecological quality of tourist destinations and may even have had a negative effect. Technological advancements have the potential to enhance the level of intelligence of tourism infrastructure and personnel services, and facilitate the development of tourism products. However, the negative effects may be attributed to the fact that the current focus of technological research and development is not well integrated with tourism development and environmental protection in the region. Insufficient investment in research funding and direction specifically focused on tourism green development has led to a less harmonious relationship between technological innovation and low-carbon development of tourism, with a slightly negative impact.
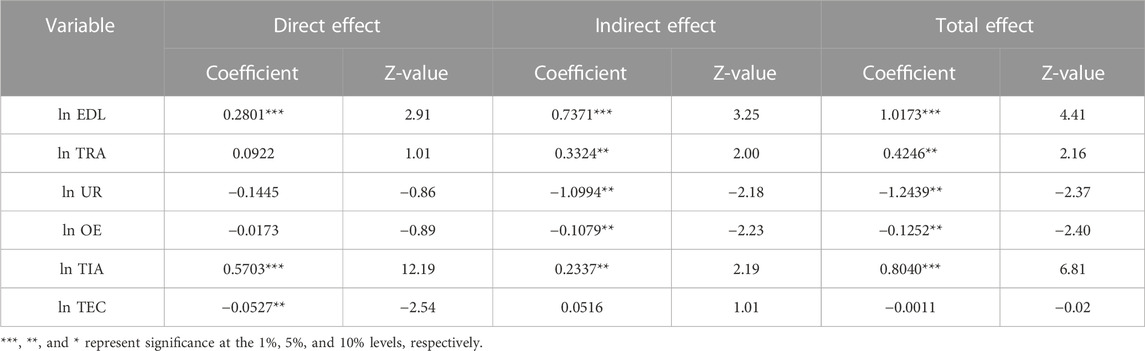
TABLE 7. Regression results and effect decomposition of spatial Dubin model.
We calculated TGPE for 41 cities in the Yangtze River Delta from 2010 to 2019 to examine the temporal and spatial characteristics of TGPE. By calculating the global Moran’s I index, we confirmed the presence of spatial agglomeration characteristics in the region. We then used a spatial Markov transition probability matrix to investigate the spatial spillover effects of TGPE in the Yangtze River Delta. Furthermore, we employed the spatial Durbin model to measure the spatial spillover effects of influencing factors. This section discusses the results of the research methodology described above.
First, we recognized that the extant measurement framework for TGPE was not systematic, which did not consider the positive externalities of tourism, such as tourism carbon sinks. Because of overlooking the ecological benefits of tourism development, the measurement of TGPE may be not accuracy. To solve the problem, the measurement framework of TGPE by incorporating tourism carbon sinks was reconstructed. Therefore, the first theoretical contribution of this paper is to construct the index system of measurement TGPE including tourism carbon sinks, which provides a new research method for the subsequent research on tourism green development. Furthermore, the TGPE showed an increasing trend in the Yangtze River Delta during the study period, however, Sun and Hou (2021) argued that the TGPE of the Yangtze River Delta exhibited a fluctuating trend (i.e., downward, then upward, then downward) during the research period. The reasons for the different results may be attributed to the authors’ failure to include tourism carbon sinks in their measurement system. For different study areas, Li and Zhang (2022) found that the TGPE in the Beijing-Tianjin-Hebei region was increasing year by year, but there was still a big gap between the efficiency value and 1, that is, the TGFE was smaller than that of the Yangtze River Delta region, which was related to the regional tourism resource endowment and development mode, and may also be related to the lack of inclusion of tourism carbon sinks in its measurement. Meanwhile, the government does not have a comprehensive understanding of the green development of the tourism industry, because the current measurement of the TGPE does not take into account tourism carbon sinks. Therefore, based on the TGPE measured in this paper, the formation of suggestions on the green development of tourism industry may be more helpful for the government to implement policies on the sustainable development of the tourism industry. Besides, due to the limited availability of data, carbon emissions were only included from the tourism industry as the ecological output variable. However, TGPE is a complex system that encompasses factors such as vegetation, water bodies, and natural disasters, which are difficult to measure directly. To deal with the issue, future research could explore the use of python to mine hard-to-obtain data and machine learning to simulate and evaluate the data of missing variables.
Second, the analysis of TGPE in the region using the Getis-Ord Gi* index and the natural break method demonstrated the formation of a north–south differentiation pattern, with the “Hangzhou–Huzhou–Wuxi–Suzhou–Shanghai” line serving as the boundary. This finding is consistent with the result of Xu et al. (2023), which revealed the spatial pattern of TGPE is higher in central and lower in north and south in the Yangtze River Delta. However, unlike the current literature, in addition to the cities around Shanghai, the hot spots are also distributed in the southwest of Zhejiang and the northwest of Anhui, which is closely related to the rich local tourism resources and large-scale tourism investment. These provides evidence for the government to identify the regional growth poles of green tourism development in regional tourism planning. Besides, within a certain spatial–temporal range, the transition of TGPE types in the Yangtze River Delta tends to form a hierarchical agglomeration pattern, which can be attributed to the influence of neighborhood types. This provides some inspiration for local governments to formulate tourism development strategies. The government’s development strategies are mostly based on the perspective of the city, and rarely from the perspective of urban cooperation. In the end, the spatial effects of TGPE between regions was measured from a geographical proximity perspective, without analyzing its complex network features, which makes it difficult to determine the role of each unit in the regional ecology. Future research could employ social network analysis to assess the connectivity of each unit within a region. By analyzing the network node advantages and core-edge characteristics of urban individuals, this approach could provide valuable insights into the overall network structure and dynamics of regional tourism.
Third, previous studies have either focused on examining the existence of spatial spillover effects in the region (Shi et al., 2021) or directly measured the spillover effects without clarifying the impact of neighborhood types on regional shifts during the spatial evolution process (Shen et al., 2022). Thus, there is a lack of a comprehensive system for analyzing spatial spillover effects on TGPE. Accordingly, we systematically clarified the spatial spillover effects following the logical sequence of “effect testing process–action influencing factors–spatial effect influencing factors,” which is also an important theoretical contribution of this paper. In terms of influencing factors, our findings align with the studies of scholars such as Yang et al. (2022), indicating that the improvement of TGPE in cities within the Yangtze River Delta is related to its tourism development conditions and is significantly influenced by neighboring cities. And the direct and indirect effects of other influential factors in our study are consistent with previous research (Jia, 2021; Wang et al., 2023), such as the positive direct and indirect effects of TIA, which showed that the tourism development strategy of the Yangtze River Delta should focus on the construction of tourism industry clusters rather than the design and planning of single tourism products. Unlike previous research (Shi, 2020; Li et al., 2023), we found that EDL has a greater effect on the TGPE of neighboring cities than on the TGPE of the city itself, indicating that there is high degree of economic integration in the region, and it is necessary to further enhance the level of economic integration from the perspective of industrial chain. We also found that only the indirect effects of TRA were statistically significant, indicating that on the basis of improving the local transportation infrastructure, the cities in the region should pay more attention to the accessibility of inter-city transportation lines. Wang et al. (2013b) suggested that the direct and indirect effects of OE had no impact, whereas we discovered there was negative impact. The reasons may be that the degree of OE in other regions of China was lower than that in the Yangtze River Delta, and it means that when introducing foreign investment to the Yangtze River Delta region, it should focus more on the development of low-carbon and green industries rather than high-energy-consuming industries. In addition, the negative effect of the TEC should also be paid attention to, indicating that the Yangtze River Delta region lacks the guidance for the coordinated development of tourism and science and technology industry, and the next step should formulate a plan for tourism science and technology innovation. In the end, this paper explored the spatial effect of regional TGPE from the perspective of the city, and the data granularity is large. Next, the spatial effect of TGPE should be explored from the perspectives of counties and towns.
The conclusions of this study are as follows. 1) From 2010 to 2019, TGPE in the Yangtze River Delta exhibited a gradual upward trend, indicating a better balance between economic development and ecological protection. However, it has not yet reached the optimal production frontier. While low-efficiency values converged to the mean, an increasing disparity and a trend toward a “dual-core” pattern were observed. 2) In terms of spatial evolution, TGPE in the Yangtze River Delta exhibited a north–south differentiation pattern with the “Hangzhou–Huzhou–Wuxi–Suzhou–Shanghai” line as the boundary, indicating significant spatial clustering effects. The number of hot spots increased before decreasing, while the number of sub-hot spots exhibited the opposite trend. The number of cold spots and sub-cold spots decreased gradually. 3) For spatial correlation, the TGPE displayed high positive spatial autocorrelation, indicating that cities with similar levels of TGPE tended to cluster together. Level transitions frequently occurred between adjacent types. After accounting for neighborhood-type factors, the transition probability was influenced by spatial latency types, resulting in “club convergence.” 4) In the Yangtze River Delta, TGPE and its influencing factors exhibited substantial spatial spillover effects. Regarding direct effects, EDL and TIA had significant growth-promoting effects on local TGPE, while TIL had growth-inhibiting effects. EDL, TRA, and TIA exhibited significant positive spillover effects on the growth of TGPE in neighboring cities, whereas UR and OE exhibited negative spillover effects.
In view of the fact that the TGPE in the Yangtze River Delta has spatial spillover effect and changes of hot and cold of TGPE, and that Shanghai, Jiangsu, Zhejiang and Anhui have only signed the Framework Agreement on High-Quality Integrated Development of Culture and Tourism in the Yangtze River Delta, which does not involve the spatial layout of tourist cities, it is suggested that the Tourism and Culture Development Committee should be established as soon as possible in this region, which should prepare to compile the “Yangtze River Delta Culture and Tourism Green Development Plan.” In the planning, the layout of different levels of growth poles and the coordinated development of urban tourism should be emphasized. Concretely speaking, the region should capitalize on the comparative advantages of Shanghai, Hangzhou, Suzhou, continually enhancing their size and energy levels and fostering the core growth poles for the green development of tourism, and it is necessary to cultivate the cities in northwest Anhui and southwest Zhejiang into secondary growth poles. In addition, considering that there is a big difference between the north and the south in the TGPE for the Yangtze River Delta region, and a continuous belt of cities with high value of TGPE, an ecological tourism metropolitan circle should be constructed from east to west in the Yangtze River Delta. The first stage is to promote the joint development of the Shanghai metropolitan circle, the Suzhou–Wuxi–Hangzhou metropolitan circle, and the Hangzhou metropolitan circle. The second step is to establish regional radiation mainlines, expanding the scope of secondary hot spot regions via axes and belts, especially, Southern Anhui, central Anhui, and northern Jiangsu should strengthen their regional ties with the Ningbo–Hangzhou ecological economic belt via the Beijing–Hangzhou Grand Canal.
Considering the positive spatial spillover effect of economic development, transport accessibility and tourism industry agglomeration, it is suggested that under the guidance of the “Outline of the Yangtze River Delta Regional Integrated Development Plan,” provincial and municipal governments such as Shanghai, Jiangsu, Zhejiang and Anhui should formulate plans for the economic integration, transportation integration and industrial coordinated development of the Yangtze River Delta as soon as possible. Additionally, taking into account the negative spatial spillover effect of openness level, the region should improve the regulatory system for the foreign investment market, shut down highly polluting foreign-funded enterprises, and promote the transformation of the foreign investment market into high-tech and low-pollution industries. Meanwhile, considering the negative spatial spillover effect of urbanization level, we suggest that the region should strengthen the construction of social space, especially the renewal and improvement of public facilities, and build tourism cultural space shared with tourists. In the end, because of the negative direct effect of technological innovation, we suggested that Shanghai and Nanjing should maximize their talent resources and research platforms, take the lead in constructing low-carbon technology research and transformation highlands in tourism, establish tourism low-carbon equipment production bases in neighboring cities, and collaborate with neighboring cities in the low-carbon development of tourism transportation, scenic spots, and activities.
The original contributions presented in the study are included in the article/supplementary material, further inquiries can be directed to the corresponding author.
PS: Data curation, Formal Analysis, Funding acquisition, Writing–original draft, Writing–review and editing. HL: Investigation, Methodology, Software, Writing–original draft, Writing–review and editing. YY: Data curation, Resources, Software, Writing–original draft, Writing–review and editing. XL: Conceptualization, Writing–original draft, Writing–review and editing. XW: Writing–review and editing.
The authors declare financial support was received for the research, authorship, and/or publication of this article. The authors are grateful for the financial support provided by the Projects of the Ministry of Education Research of Social Sciences (Grant No. 20XJC790006).
The authors declare that the research was conducted in the absence of any commercial or financial relationships that could be construed as a potential conflict of interest.
All claims expressed in this article are solely those of the authors and do not necessarily represent those of their affiliated organizations, or those of the publisher, the editors and the reviewers. Any product that may be evaluated in this article, or claim that may be made by its manufacturer, is not guaranteed or endorsed by the publisher.
Barro, R. J., and Xavier, S. M. (1992). Convergence. J. Polit. Econo. 100 (02), 223–251. doi:10.1086/261816
Cheng, H., Xu, Q., and Guo, Y. Q. (2021). Club convergence research on China’s tourism eco-efficiency. J. Centr. China Norm. Universi. Nat. sci.). 55 (02), 289–300. doi:10.19603/j.cnki.1000-1190.2021.02.017
Cheng, Y., Zhu, K., Zhou, Q., El Archi, Y., Kabil, M., Remenyik, B., et al. (2023). Tourism ecological efficiency and sustainable development in the Hanjiang River Basin: a super-efficiency slacks-based measure model study. Sustainabil 15 (7), 6159–6219. doi:10.3390/su15076159
Dong, H. Y., Liu, Q. P., Zhou, L., and Yu, Z. P. (2018). Dynamics comparison of tourism carbon footprint with tourism carbon capacity in Jiangsu province. Ecol. Econo. 34 (11), 183–187.
Fang, S. M., and Huang, Y. (2020). Spatio-temporal evolutions and coordination of tourism efficiency and scale in the Yangtze River Economic Belt. Act. Geographic. Sinic 75 (08), 1757–1772. doi:10.11821/dlxb202008014
Farrell, M. J. (1954). The measurement of productive efficiency. J. Th. Roy. Stat. Soci. Ser. A Gener. 120 (03), 253–290. doi:10.2307/2343100
Feng, Y. C., Wang, X. H., Du, W. C., Wu, H. Y., and Wang, J. T. (2019). Effects of environmental regulation and FDI on urban innovation in China: a spatial Durbin econometric analysis. J. Clean. Product. 235, 210–224. doi:10.1016/j.jclepro.2019.06.184
Ge, T., Hao, X. L., and Li, J. Y. (2021). Effects of public participation on environmental governance in China: a spatial Durbin econometric analysis. J. Clean. Product. 321, 129042. doi:10.1016/j.jclepro.2021.129042
Han, Z., Han, C., and Yang, C. (2020). Spatial econometric analysis of environmental total factor productivity of ranimal husbandry and its influencing factors in China during 2001-2017. Sci. Th. Tot. Environm. 723, 137726. doi:10.1016/j.scitotenv.2020.137726
Huang, M. Z., and Huang, X. K. (2022). Measurement and spatial differentiation of decoupling effect of tourism carbon emissions in Yangtze River Delta Urban Agglomeration. J. Centr. Sou. Univers. Fore. Technol. 42 (05), 170–180. doi:10.14067/j.cnki.1673-923x.2022.05.019
Irfan, M., Ullah, S., Razzaq, A., Cai, J. Y., and Adebayo, T. S. (2023). Unleashing the dynamic impact of tourism industry on energy consumption, economic output, and environmental quality in China: a way forward towards environmental sustainability. J. Clean.Product. 387, 135778. doi:10.1016/j.jclepro.2022.135778
Jia, Y. F. (2021). Regional differences and the contributory factors based on tourism economy in river delta of Yangtze of China using fuzzy analytic hierarchy process. J. Intellig. Fu. Syst. 40 (04), 8307–8315. doi:10.3233/JIFS-189653
Katircioglu, S., Gokmenoglu, K. K., and Eren, B. M. (2019). The role of tourism growth in generating additional energy consumption: empirical evidence from major tourist destinations. Environm. Ecol. Statist. 26, 303–323. doi:10.1007/s10651-019-00429-0
LeSage, J. P., and Pace, R. K. (2009). Introduction to spatial econometrics. New York: Chapman and Hall/CRC, 5–6.
Li, B., and Wu, S. (2017). Effects of local and civil environmental regulation on green total factor productivity in China: a spatial Durbin econometric analysis. J. Clean. Product. 153, 342–353. doi:10.1016/j.jclepro.2016.10.042
Li, S., and Yue, Q. (2023). Analysis on the energy demand, CO2 and pollutant emissions, and health benefits from urban road transport sector: a case study of Shenyang. Gr. Low-Carb. Econo. 26 (5), 1–11. doi:10.47852/bonviewGLCE3202682
Li, X. Z., Han, L. L., Yang, L. X., and Zhang, T. Z. (2023). Green development efficiency and spatial characteristics of urban clusters: a case of Yangtze River Delta city cluster. Emerg. Mark. Fin. Tr. 59 (07), 1993–2007. doi:10.1080/1540496X.2022.2161301
Li, Y., and Zhang, Y. (2022). Spatial-temporal evolution and influencing factors of tourism eco-efficiency in China’s Beijing-Tianjin-Hebei region. Front. Environme. Scie. 10, 1067835–1067940. doi:10.3389/fenvs.2022.1067835
Lü, J. H., Liu, Z. T., Zhang, B., and Wang, X. H. (2020). Ecological efficiency and spatial effects of tourism industry in China. J. North. For. Univer. 48 (10), 49–54+60. (In Chinese). doi:10.13759/j.cnki.dlxb.2020.10.009
Medina, L. F., Gomez, I. G., and Marrero, S. M. (2012). Measuring efficiency of sun & beach tourism destinations. Ann. Tour. Res. 39 (02), 1248–1251. doi:10.1016/j.annals.2011.12.006
Parzen, E. (1962). On estimation of a probability density function and mode. Ann. Math. Stat. 3 (33), 1065–1076. doi:10.1214/AOMS/1177704472
Peng, H. S., Zhang, J. H., Han, Y., Tang, G. R., and Zhang, Y. (2017). Measurement and empirical analysis of eco-efficiency in tourism destinations based on a slack-based measure-data envelopment analysis model. Act. Ecol. Sin. 37 (02), 628–638. doi:10.5846/stxb201507311616
Shen, W. L., Huang, Z. F., Yin, S. G., and Hsu, W. L. (2022). Temporal and spatial coupling characteristics of tourism and urbanization with mechanism of high-quality development in the Yangtze River Delta Urban Agglomeration, China. Appl. Sci.-Bas. 12 (07), 3403. doi:10.3390/app12073403
Shi, L. Y. (2020). Industrial structure changes, spatial spillover and economic growth in the Yangtze River Delta. J. Coast. Res. 107 (SI), 377–382. doi:10.2112/JCR-SI107-086.1
Shi, P. F., Geng, B., Li, X. M., Zhou, J. A., and Li, W. J. (2022). Measurement, spatial heterogeneity and driving mechanism of environment total factor productivity in tourism: a case study of the Yangtze River economic belt in China. China. s. Sci. 375 (03), 78–87+111.
Shi, X. C., and Li, X. Y. (2018). Research on three-stage dynamic relationship between carbon emission and urbanization rate in different city groups. Ecol. Indic. 91, 195–202. doi:10.1016/j.ecolind.2018.03.056
Shi, Z. Y., Cheng, Q., and Xu, D. (2021). Spatial econometric analysis of cultural tourism development quality in the Yangtze River Delta. Asia. Pacif. J. Tour. Res. 26 (06), 597–613. doi:10.1080/10941665.2021.1886131
Stephan, G. (2023). Intergenerational fairness and climate change adaptation policy: an economic analysis. Gr. Low-Carb. Econo. 3 (2), 1–15. doi:10.47852/bonviewGLCE3202670
Sun, Y. H., Ding, W. W., and Yang, G. C. (2022). Green innovation efficiency of China's tourism industry from the perspective of shared inputs: dynamic evolution and combination improvement paths. Ecol. Indic. 138, 108824. doi:10.1016/j.ecolind.2022.108824
Sun, Y. Y., and Hou, G. L. (2021). Analysis on the spatial-temporal evolution characteristics and spatial network structure of tourism eco-efficiency in the Yangtze River Delta urban agglomeration. Int. J. Environmen. Res. Public Health 18 (05), 2577. doi:10.3390/ijerph18052577
Tang, J. X., Li, S. S., Liu, Y. J., Liu, J., and Ma, M. Y. (2022). Research on characteristics of tourism flow networks of a-level scenic spots in Henan province based on digital footprint. Ar. Res. Dev. 41 (01), 79–84+97. doi:10.12118/j.issn.1000-6060.2022.188
Tang, Z., Shang, J., Shi, C. B., Liu, Z., and Bi, K. X. (2014). Decoupling indicators of CO2 emissions from the tourism industry in China: 1990-2012. Ecol. Indic. 46, 390–397. doi:10.1016/j.ecolind.2014.06.041
Thanh, T. T. T., Phuong, A. N. T., and Thu, H. N. (2022). Advancing the circular business models in developing countries: lessons from China. Gr. Low-Carb. Econo 11 (25), 1–12. doi:10.47852/bonviewGLCE2202402
Tone, K. (2001). A slacks-based measure of efficiency in data envelopment analysis. Eur. J. Oper. Res. 130 (03), 498–509. doi:10.1016/S0377-2217(99)00407-5
Tone, K. (2002). A slacks-based measure of super-efficiency in data envelopment analysis. Eur. J. Oper. Res. 143 (01), 32–41. doi:10.1016/s0377-2217(01)00324-1
Tsionas, E. G., and Assaf, A. G. (2014). Short-run and long-run performance of international tourism: evidence from Bayesian dynamic models. Tour. Manag. 42, 22–36. doi:10.1016/j.tourman.2013.08.003
Wang, B., Yu, M. X., Zhu, Y. C., and Bao, P. J. (2021). Unveiling the driving factors of carbon emissions from industrial resource allocation in China: a spatial econometric perspective. En. Pol. 158, 112557. doi:10.1016/j.enpol.2021.112557
Wang, K., Huang, Z. F., Tao, Y. G., and Fang, Y. L. (2013a). Study on spatial characteristics and spillover effects of urban tourism efficiency: a case of Yangtze River Delta. Econo. Geogr. 33 (04), 161–167. doi:10.15957/j.cnki.jjdl.2013.04.030
Wang, K., Li, J., Tang, Y. L., and Liu, H. L. (2013b). Carbon emissions accounting and decomposition analysis of energy consumptionof service industry in China. China. Populat., Resour. Environ. 23 (05), 21–28. doi:10.3969/j.issn.1002-2104.2013.05.004
Wang, K., Liu, Y. F., and Gan, C. (2022a). Spatial spillovers of tourism agglomeration on the carbon emission efficiency of tourism industry. Act. Ecol. Sin. 42 (10), 3909–3918. doi:10.5846/stxb202105091211
Wang, K., Shao, H. Q., Zhou, T. T., and Liu, H. L. (2018). A study on carbon emissions efficiency of tourism and its spatial correlation characteristics in China. Resour. Environ. th. Yangtze. Basin. 27 (03), 473–482. doi:10.11870/cjlyzyyhj201803003
Wang, K., Zhang, S. W., Gan, C., Yang, Y. P., and Liu, H. L. (2020a). Spatial network structure of carbon emission efficiency of tourism industry and its effects in China. Sci. Geogr. Sin. 40 (03), 344–353. doi:10.13249/j.cnki.sgs.2020.03.002
Wang, K., Zou, N., and Gan, C. (2022b). Convergence and influencing factors of tourism technical efficiency, green productivity. Econo. Geogr. 42 (06), 215–224. doi:10.15957/j.cnki.jjdl.2022.06.022
Wang, S. J., Gao, S., Huang, Y. Y., and Shi, C. Y. (2020b). Spatio-temporal evolution and trend prediction of urban carbon emission performance in China based on super-efficiency SBM model. Act. Geogr. Sin. 75 (6), 1316–1330. CNKI:SUN:DLXB.0.2020-06-017. doi:10.11821/dlxb202006016
Wang, S. P., Teng, T. W., and Bao, H. (2023). Spatio-temporal evolution and driving factors of urban tourism efficiency in the Yellow River Basin. Statistic. Info. For. 38 (05), 105–117.
Wei, J. M., and Shen, M. H. (2022). Analysis of the efficiency of forest carbon sinks and its influencing factors—evidence from China. Sustainabil 14 (18), 11155. doi:10.3390/su141811155
Wu, X., and Liang, X. (2023). Tourism development level and tourism eco-efficiency: exploring the role of environmental regulations in sustainable development. Sustain. Dev. 30 (3), 2863–2873. doi:10.1002/sd.2555
Xu, J. H., Li, Y. Y., Hu, F., Wang, L., Wang, K., Ma, W. H., et al. (2023). Spatio-temporal variation of carbon emission intensity and spatial heterogeneity of influencing factors in the Yangtze River Delta. Atmosph 14 (01), 163. doi:10.3390/atmos14010163
Yang, Y. Z., Yan, J. X., and Yang, Y. (2022). The spatio-temporol evolution and spatial spillover effect of tourism eco-efficiency in he Yellow River Basin: based on data from the 73 cities. Act. Ecol. Sin. 42 (20), 8202–8212. doi:10.5846/stxb202108232348
Yao, D., Ren, L. Y., Ma, R. F., Li, Z. K., and Wang, C. J. (2021). Analysis of spatial pattern and influencing factors of carbon emission ntensity of tourism industry in Yangtze River Delta. Ecol. Sci. 40 (02), 89–98. doi:10.14108/j.cnki.1008-8873.2021.02.012
Yao, Z. G., and Chen, T. (2016). A literature review of tourism Eco-efficiency. Tour. Sci. 30 (06), 74–91. doi:10.16323/j.cnki.lykx.2016.06.007
Yao, Z. G., Chen, T., Yin, S. B., and Li, X. G. (2016). Regional tourism eco-efficiency model and an empirical research of Hainan province. Sci. Geogr. Sin. 36 (03), 417–423. doi:10.13249/j.cnki.sgs.2016.03.013
Yu, X., and Chen, H. (2022). Study on coupling coordination of the human settlement environment and tourism industry in the yellow river basin. Fronti. Environmen. Scie. 10, 1016839–1016910. doi:10.3389/fenvs.2022.1016839
Zheng, B. Y., and Yang, H. F. (2020). Spatial and temporal evolution of eco-efficiency of inter-provincial tourism in China based on ecological footprint. East China. econo. Manag. 34 (04), 79–91. doi:10.19629/j.cnki.34-1014/f.191105005
Keywords: tourism green production efficiency (TGPE), space-time characteristics, spatial spillover effect, Yangtze, influence factors
Citation: Shi P, Long H, Yao Y, Li X and Wang X (2023) Study of the space–time transition and spatial spillover effects of tourism green production efficiency in the Yangtze River Delta—a reanalysis from the perspective of tourism carbon sinks. Front. Environ. Sci. 11:1260949. doi: 10.3389/fenvs.2023.1260949
Received: 18 July 2023; Accepted: 02 November 2023;
Published: 07 December 2023.
Edited by:
Zhen Wang, Huazhong Agricultural University, ChinaReviewed by:
Mahmood Ahmad, Shandong University of Technology, ChinaCopyright © 2023 Shi, Long, Yao, Li and Wang. This is an open-access article distributed under the terms of the Creative Commons Attribution License (CC BY). The use, distribution or reproduction in other forums is permitted, provided the original author(s) and the copyright owner(s) are credited and that the original publication in this journal is cited, in accordance with accepted academic practice. No use, distribution or reproduction is permitted which does not comply with these terms.
*Correspondence: Xingming Li, bGl4aW5nbWluZzIwMjNAMTYzLmNvbQ==
Disclaimer: All claims expressed in this article are solely those of the authors and do not necessarily represent those of their affiliated organizations, or those of the publisher, the editors and the reviewers. Any product that may be evaluated in this article or claim that may be made by its manufacturer is not guaranteed or endorsed by the publisher.
Research integrity at Frontiers
Learn more about the work of our research integrity team to safeguard the quality of each article we publish.