 Piotr Janiec
 Luiza Tymińska-Czabańska1
 Jarosław Socha
- 1Department of Forest Resources Management, Faculty of Forestry, University of Agriculture in Krakow, Kraków, Poland
- 2Forest Management and Geodesy Bureau, Sekocin Stary, Poland
The rapid development of remote sensing technologies is creating unprecedented opportunities for monitoring and inventorying forest ecosystems. One advantage of remote sensing data is that it can be used to monitor and measure tree growth in near real-time, providing extremely useful data for growth modelling. This study used Aerial Laser Scanning (ALS) data from 14,920 Scots pine stands for the Katowice Regional Directorate of State Forests in southwestern Poland. We tested the possibility of calibrating a regional height growth model for Scots pine for a study area covering 754 thousands of hectares of forests. The model was validated with models developed for Scots pine using the traditional approach based on field data. Our results show that the model calibrated using remote sensing data does not differ significantly from the model calibrated using traditional field measurements from stem analysis. What is more, using a model developed from ALS data gives even better accuracy in modelling height growth than a traditional model calibrated with ground data. Our results are promising for the application of repeated ALS data to the development of regional height growth models, allowing long-term prediction of tree growth under current climatic conditions.
1 Introduction
Forest ecosystems play a key role in the Earth system, thus monitoring and modelling the dynamics of forest growth is of great importance. Many recent studies (Pretzsch et al., 2014; Socha et al., 2020a; Mensah et al., 2021) provided evidence of changing growth patterns in the Northern Hemisphere as a result of climate and anthropogenic pressures. Therefore, near real-time monitoring of forest is needed to understand and model current growth dynamics.
To date, monitoring and modelling of forest growth has mostly been based on data from repeated measurements of permanent sample plots or data from National Forest Inventories (NFIs). However, these approaches require long-term measurements on a large number of plots, which is a major limitation of them (Perin et al., 2013; Raulier et al., 2003). In addition, permanent sample plots are usually established for experimental purposes, mainly at sites with better conditions for tree growth, which limits the range of site conditions represented by the data. Similarly, for NFIs data, results from permanent sample plots are usually representative of large areas and do not ensure representation of rare sites. Therefore, modelling over large areas using traditional field measurements often doesn’t take into account the full variability of growing conditions and leads to simplifications, resulting in over- or underestimation of tree growth (Marziliano et al., 2019; Raulier et al., 2003; Socha and Tymińska-Czabańska, 2019). Another important challenge is to capture short-term growth fluctuations due to climate change on tree growth patterns, which is particularly difficult when using field inventory data. Furthermore, the use of these data sources is associated with high labour and time intensity (Noordermeer et al., 2018). Most of the problems associated with field inventories can be addressed by inventory and monitoring using remote sensing technologies. The spatial and temporal resolution of these technologies overcomes the limitations of the sample plots available from traditional NFI or long-term experimental networks (White et al., 2016).
Unprecedented opportunities for monitoring and inventorying forest ecosystems are arising from the rapid development of remote sensing technologies. One advantage of remote sensing data is that it can be used to monitor and measure tree growth in near real time, providing extremely useful data for growth modelling. One of the main technologies is Light Detection and Ranging (LiDAR). It has been proven useful in measuring forest structure characteristics due to its speed, coverage, and ability in describing 3D attributes (Beland et al., 2019). ALS is an accurate tool for measuring topography, but also more complex attributes of the structure of the forests (Jurjević et al., 2020; Lefsky et al., 2002; Wang et al., 2019). ALS data have a great capacity to be a tool for the estimation of tree and forest height (Næsset et al., 2004; Holmes et al., 2015). The results of measurements of the height of trees from the upper storey of a stand using the ALS are even much more accurate than the ground measurements that are traditionally used (Jurjević et al., 2020; Wang et al., 2019). LiDAR data are particularly effective in measuring tree height increment (Hopkinson et al., 2008).
Due to its close correlation with timber and biomass increment, tree height is an indirect proxy for estimating forest productivity, so measuring height and growth is important for both forest research and management. Monitoring and assessment of the impact of climate change on site productivity by measuring changes in height growth rate can be extremely useful in assisting researchers and forest managers to develop effective adaptation strategies for sustainable forest management.
The first attempts to use ALS data to calibrate height growth models have been made in recent years (Socha et al., 2017; Tompalski et al., 2015; Tymińska-Czabańska et al., 2021). However, these models have been developed for relatively small areas at a local scale, with a relatively low degree of variation in site conditions. Increasing availability of data from repeated ALS acquisitions enables growth monitoring and model development for increasingly larger areas. Spreading the data allows calibrating growth models for whole regions or even countries. Therefore, this study aims to test and demonstrate that bi-temporal ALS height growth data collected at an unprecedented quantitative and spatial scale from 16 688 232 trees growing in 27 753 stands are robust for modelling height growth.
The study was carried out for Scots pine, which is one of the most important European forest tree species. In Poland, it is the most widespread and most important species in both ecological and economic terms (Zajączkowski et al., 2018). Thus, the ability to monitor increment and develop growth models for Scots pine using repeated ALS data may be of interest to forest science and has great practical importance for forest management. To achieve our objectives, we tested the possibility of calibrating a height growth model for Scots pine using wall-to-wall data from the entire Katowice Regional Directorate of State Forests in southern Poland covering 754 thousands of hectares of forests. In addition to demonstrating the ability to calibrate the height growth model for the study area, the developed model was tested against models developed for Scots pine using the traditional approach based on field data.
2 Materials and methods
2.1 Study area description
The study area covers Scots pine stands in the Katowice Regional Directorate of State Forests located in three natural forest regions of southwestern Poland (Figure 1). The main species within the study area is Scots pine (about 66%) with a mean age of stands 56 years. For model calibration, pine stands for which ALS data were available for two different years were selected. The selected stands had a Scots pine share of more than 70% from Scots pine and were aged between 10 and 140 years.
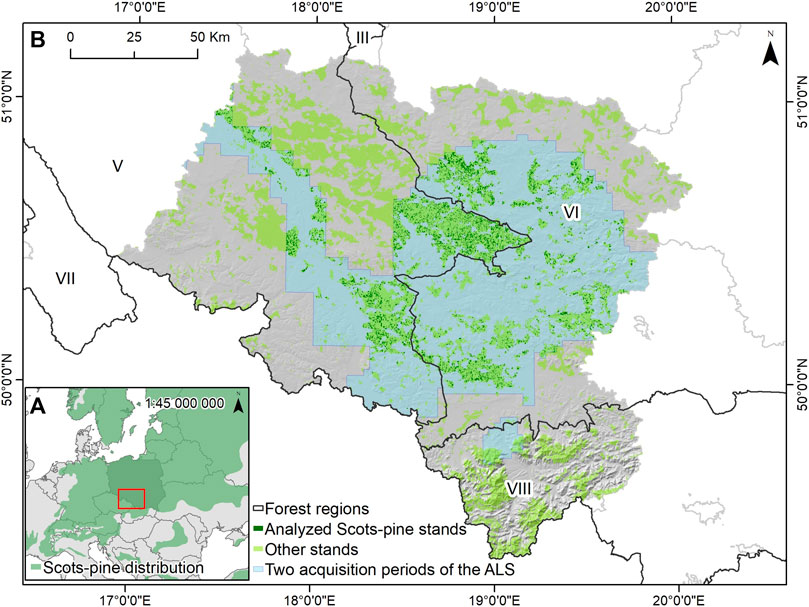
FIGURE 1. (A) Location of the study area within the distribution of Scots pine in Central Europe. (B) Distribution of the tree stands within the study area, where two periods ALS data were available (light blue). Analyzed tree stands (share of Scots pine above 70%) are in dark green other stands are in light green.
The study area is located within two natural forest regions. 14 920 stands were located in Region V (14 920) and 12 833 were located in region VI. Natural forest regions in Poland are adopted as regionalisation units. They are characterised by high natural diversity, especially in terms of climatic and geological conditions, naturally occurring ranges of the main forest-forming tree species, the presence and distribution of natural landscapes, and the distribution of primary units of potential natural vegetation (Zielony and Kliczkowska, 2012).
2.2 TH estimation from repeated ALS data
The ALS data were collected from the General Office of Geodesy and Cartography (GUGiK) repository and are publicly available on the Geoportal webpage (https://mapy.geoportal.gov.pl/). The ALS data were acquired in leaf-off conditions which is significant in the tree stands with well-developed deciduous undergrowth during the classification of ground points and therefore determination of the top height. The mean density of the data was 4 points/m2. The positional accuracy of the ALS was not worse than 0.5 m. The acquisition period is between 2011–2019 years however most of the data were acquired in the 2011 and 2019 years (Table 1).
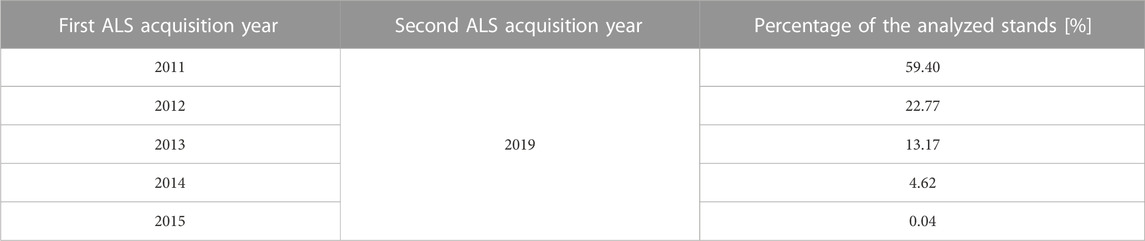
TABLE 1. Time and percentage of the bi-temporal aerial laser scanning (ALS) data acquisition in the analyzed tree stands.
We used the lidR package in the R environment (Computing, 2013) for point cloud processing (Roussel et al., 2020). We used the “normalize_height” algorithm to preprocess the point cloud for each date and normalize it. The canopy height models (CHMs) have been created with the “p2r” algorithm. The spatial resolution of the CHMs was 1.0 m.
For the TH (top height) estimation we used the modified approach proposed by Socha et al. (2020a) (Figure 2). To avoid the edge effect we have created, an internal buffer (15 m) for each forest stand. The CHMs were resampled into 10 × 10 grid cells. For each year in each forest subdivision, the TH has been calculated as the average of two-thirds of the highest values in the 10 × 10 grid. We excluded tree stands with the TH variance in the forest subdivision higher than 2 and the percentage of no data higher than 0.5. We assumed that these tree stands are in the process of reconstruction or there are outliers caused by tilting the top of the tree to another cell.
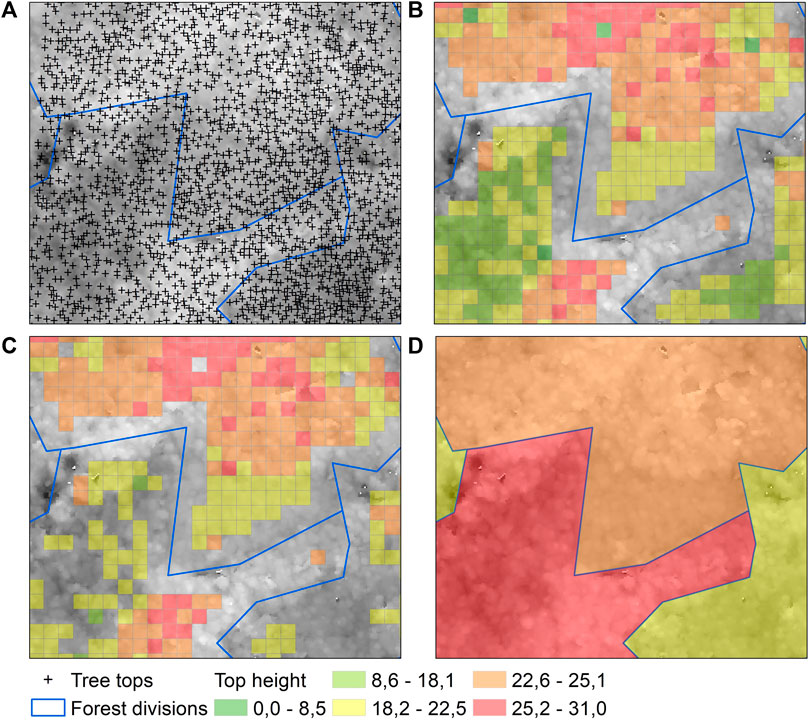
FIGURE 2. (A) Tree tops detected based on the canopy height model (CHM) generated from the ALS data. (B) Top height (TH) calculated in the 10 × 10 grid cells, with the consideration of an internal buffer (15 m) for each forest stand. (C) Grid cells after the exclusion of cells with the TH lower than two-thirds of the highest values in each subdivision. (D) TH calculated for each subdivision.
To remove the outliers we have applied the standard outlier elimination proposed by Tukey (1977) and used by Socha et al. (2017) for the TH estimation based on the ALS data. We calculated differences between TH in two subsequent periods for each grid cell. Outliers were separated using lower and upper quartiles (Q1–Q3), and the interquartile range (IQ) was calculated. We defined extreme values in the tails of the distribution by the lower inner bound Q1 − 1.5 × IQ and the upper inner bound Q3 + 1.5 × IQ according to Tukey (1977), which picked 1.5 × IQ as the demarcation line for outliers. The reasonableness of this measure for bell-curve-shaped data means that usually, about one percent of the data will ever be outliers. The outliers elimination has been performed for age classes based on the 20 years interval.
2.3 Height growth models calibration
For the height growth model calibration we have used the dynamic equation based on the Bertalanffy–Richards function using the generalized algebraic difference approach (GADA), proposed by (Cieszewski, 2001):
where
and β1, β2, and β3 are global model parameters, TH is the top height at age T and TH1 is the top height at age T1.
We have used all prepared and filtered earlier data. We fitted the global parameters and site-specific parameters simultaneously using the nonlinear least-squares optimization and the Levenberg-Marquardt algorithm (Moré, 2006) in the R environment (Computing, 2013) using the gslnls library. Levenberg-Marquardt algorithm, attempt to find a local minimum of the objective function by making iterative steps in the direction of the solution informed by the gradient of a first- or second-order Taylor approximation of the nonlinear objective function (Moré, 2006). As starting parameters we choose b1 = 1, b2 = 10000, and b3 = 28, according to (Socha et al., 2017).
Due to the significant variation in growth conditions within the study area, we decided to develop three height growth models using ALS data. The first model has been developed for the entire study area, while the other two models have been developed for areas located in the natural forest region V and VI respectively. For each model, we used the maximum number of iterations. To estimate the model significance of the calibrated parameters we performed a t-test and calculated Standard Error (SE), t-value and p-value.
2.4 Models validation
We compared the obtained models with the height growth models for Scots pine in Poland developed based on Stem Analysis (SA) data (Socha et al., 2021a) (Table 2). Models calibrated on SA data were used as a reference. Model developed using repeated ALS data for whole study area was compared with global height growth models for Scots pine for Poland. Models developed for areas located in the natural forest regions V and VI was compared with SA regionals models.
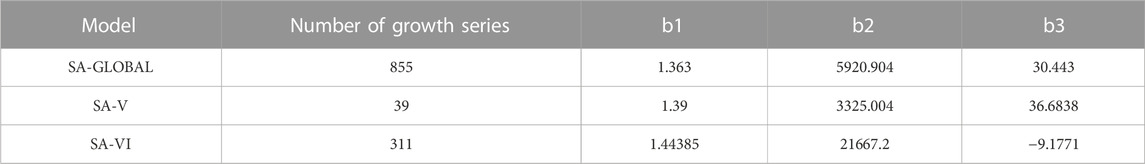
TABLE 2. The number of growth series and the parameters of the global and regional height growth models used for the validation of the aerial laser scanning (ALS) models (Socha et al., 2021b).
For each model we have calculated mean absolute error (MAE) and RMSE (root mean squared error) based on the equations:
where,
3 Results
3.1 ALS-derived TH growth model
By estimating the parameters of the growth function, we developed three TH growth models for the Scots pine stands based on the bi-temporal ALS data (Table 3).
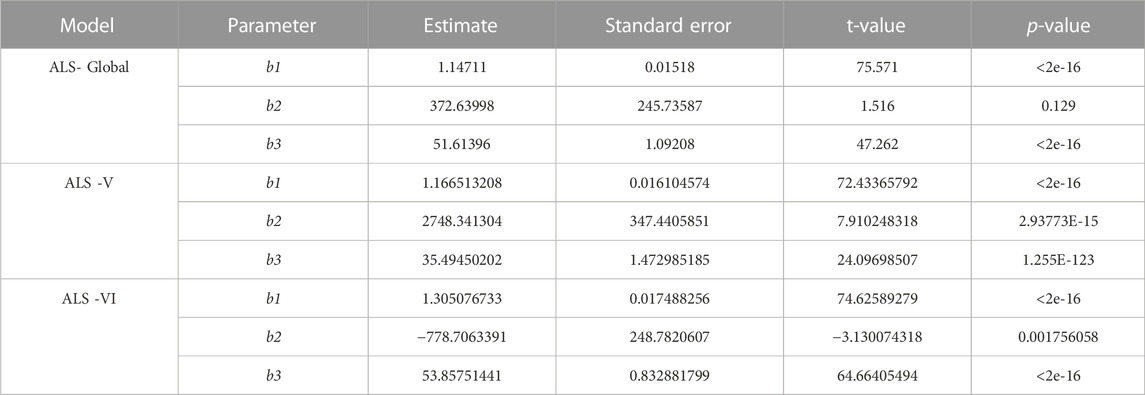
TABLE 3. Parameters and fit characteristics of the regional top height growth models for the Scots pine for Katowice Regional Directorate of State Forests based on the bi-temporal aerial laser scanning (ALS) data.
The parameters fitted based on the ALS data differ from regional and global parameters for the models developed from SA. Across the range of site conditions, the developed global ALS model demonstrate a good fitting to the data (Figure 3). For the sites with the highest productivity, the course of the model curves is almost identical. Some slight differences are visible in the younger stands growing on more poor site conditions.
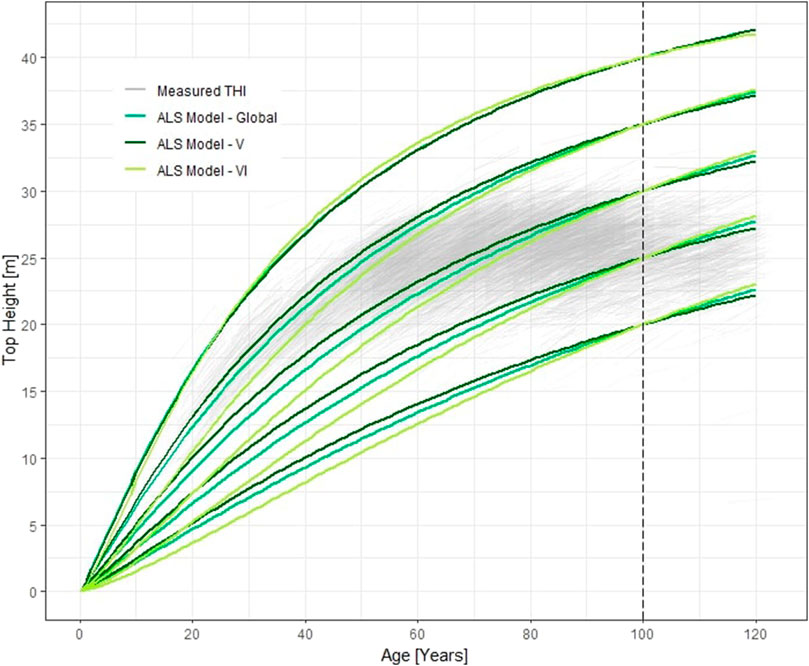
FIGURE 3. Growth trajectories of three top height growth models developed using aerial laser scanning (ALS) data against the observed top height increment (THI) values from ALS measurements over two periods (thin grey), black dashed line represent base age.
The modeled TH values did not differ significantly from the reference data (Figure 4). The smooth lines were well fitted across most of the TH observation distributions, only on the edge of the distribution slight differences were visible.
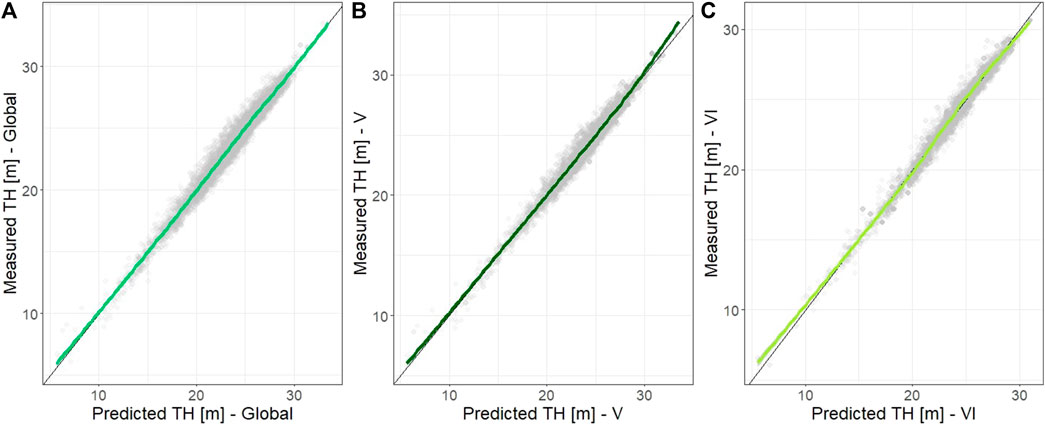
FIGURE 4. Predicted vs. measured values of top height (TH) based on the aerial laser scanning (ALS) derived TH growth model for Scots pine stands in the Katowice Regional Directorate of State Forests: (A) Global ALS Model; (B) V natural forest region ALS Model; (C) VI natural forest region ALS Model.
Errors in TH estimation for the ALS-derived models were not correlated with stand age (Figure 5). In most cases the errors in TH estimation are within about 1 m. The ALS models were characterized by lower error values, comparing to the SA models. The residuals are evenly distributed across the Global and V region models. For the model from the VI region, more residuals have negative values, especially for the SA model, where majority of the residuals are below 0.
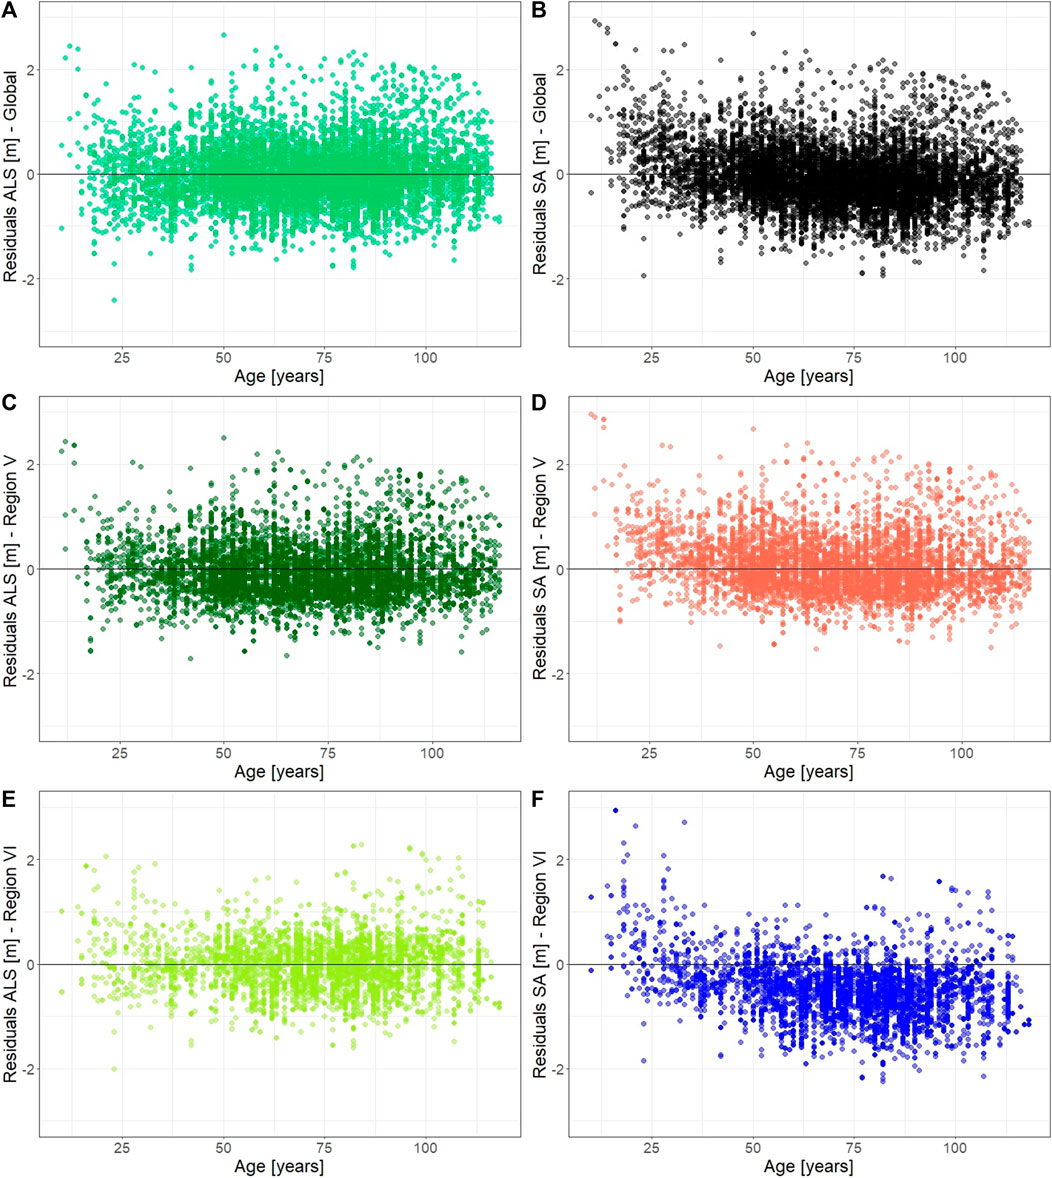
FIGURE 5. Residual top height versus age and aerial laser scanning (ALS) derived top height based on bi-temporal ALS data for the Katowice Regional Directorate of State Forests Scots pine stands: Global ALS (A) and Stem Analysis (SA) Models (B); V natural forest region ALS (C) and SA Models (D); VI natural forest region ALS (E) and SA Models (F).
Using the global ALS model, a site index map was produced for the study area (Figure 6). As the site productivity indicator we used the site index (SI), which is commonly used indicator of the site productivity assessment in the forestry (Hägglund and Lundmark, 1977). We calculated the SI as the height that the tree stand will reach at the base age of 100 years. Our results show large variation in site conditions throughout the study area. These differences are also visible within the forest regions. The V-forest region is characterized by higher SI, especially in the north-western part, while Scots pine stands in the central part of Region V and most stands in Region VI are characterized by substantially lower site productivity. The majority of the stands in Region VI are characterized by an SI of between 20 and 35 m.
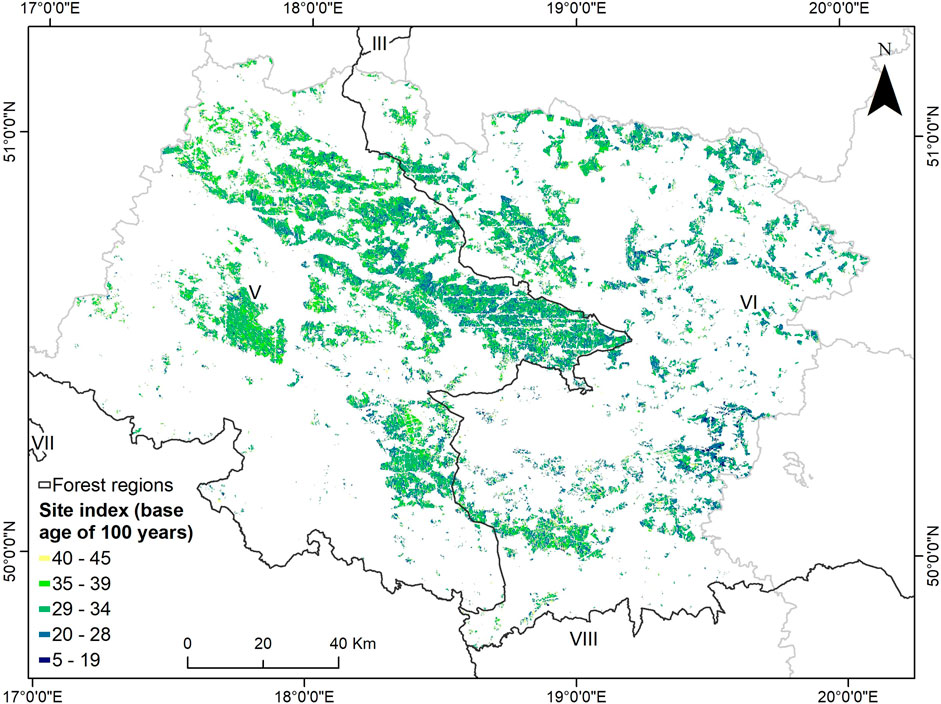
FIGURE 6. Modeled site index (base age of 100 years) for Scots pine stands based on aerial laser scanning (ALS) global model in the Regional Directorate of State Forests in Katowice.
3.2 Models validation
In the first step, we compared the ALS-derived global model with the global model developed by Socha et al. (2021b) for Scots pine in Poland based on SA data. We found that the model TH growth trajectories developed from the ALS data do not differ significantly from the global model developed from the SA data (Figure 7). Compared to the global model for Poland developed from SA data, the model calibrated with ALS data showed only slightly higher values of height increment for younger stands from the most productive sites.
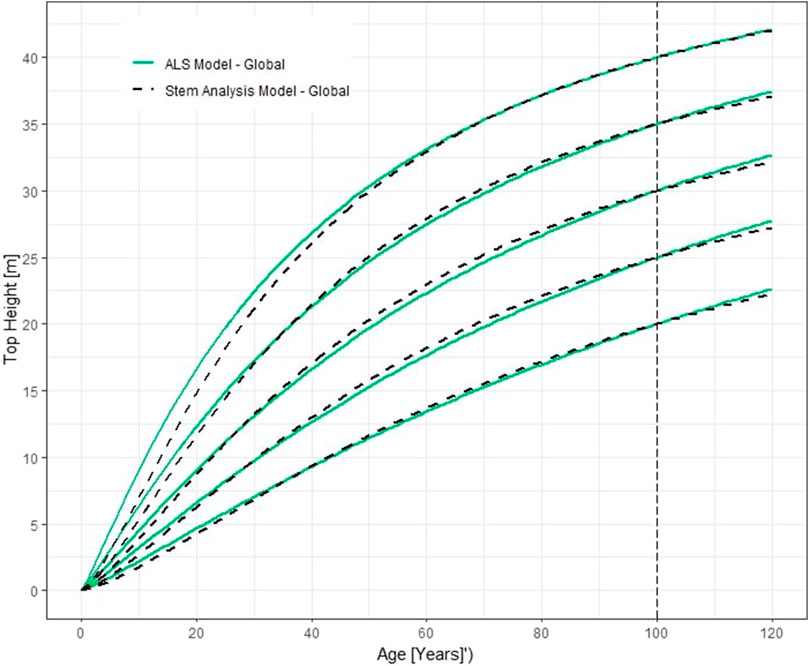
FIGURE 7. Comparison of growth curves for top height global model calibrated with aerial laser scanning (ALS) derived point cloud (green, thick lines) and global Stem Analysis model (dashed, black line).
Next, we compared the regional ALS-derived model with models built from SA data for natural forest region V and VI (Figure 8). The ALS model curves for stands located in V Natural forest region was compared with SA model for region V. Models show a high similarity, only in the younger stands especially growing on poor site conditions slightly differences are noticeable (Figure 8A). Larger differences are evident when comparing the ALS model with the model-based SA data from natural forest region VI (Figure 8B). While, for the most productive sites the model curves for these models are very similar, for the poorest sites, the TH growth model developed from ALS data shows an overall lower increment than the model developed from SA data.
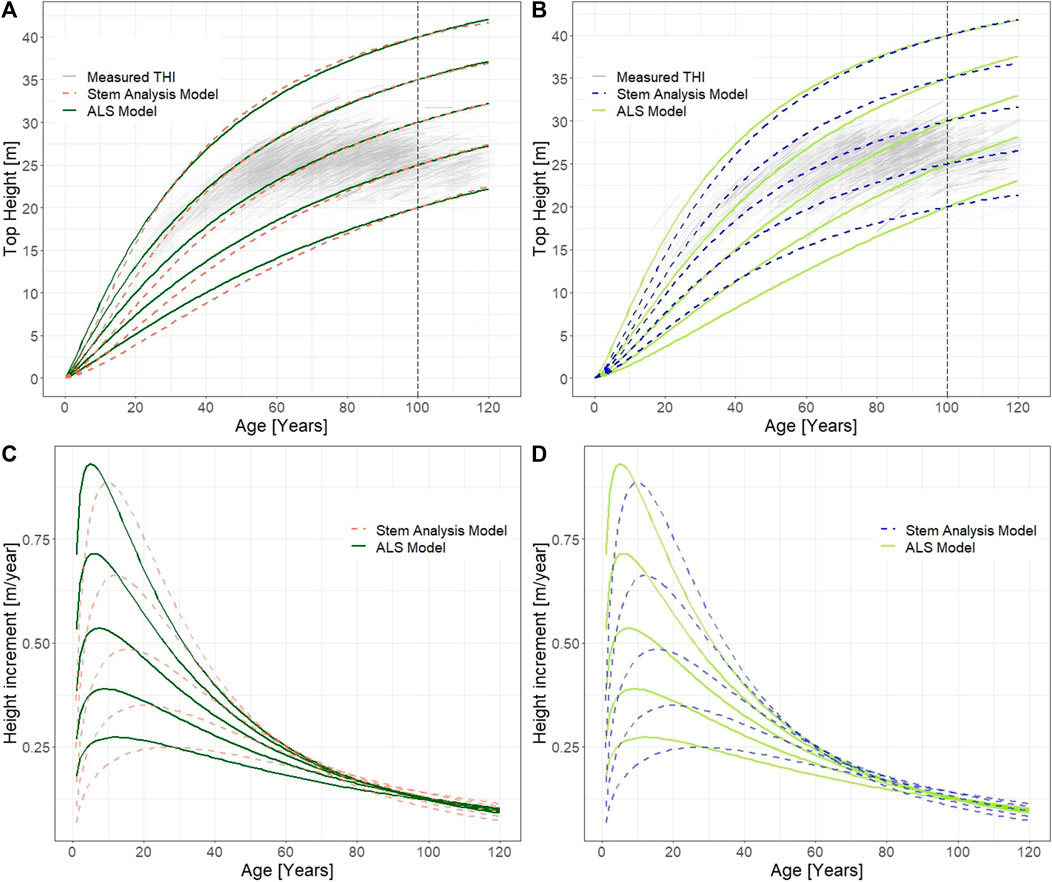
FIGURE 8. Comparison of the top height growth regional model for Scots pine stands with aerial laser scanning (ALS) derived point cloud and stem analysis model from the area of V natural forest region (A), and the VI natural forest region (B). Comparison of the top height increment for Scots pine stands with ALS-derived point cloud and Stem Analysis model from the area of V natural forest region (C), and the VI natural forest region (D).
Despite satisfactory model-fitting results, the THI trajectories for the V (Figure 8C) and VI (Figure 8D) natural forest regions developed with the use of ALS data slightly differed from the SA model THI trajectories. According to the THI from ALS data, the culmination of growth occurs faster and THI is slight higher, especially in the stands with the higher SI.
Finally, we compared the fit statistics for three ALS-derived models with the two regional models and the global model developed on SA data (Table 4). The ALS-derived TH was taken as reference data. All models are characterized by the similar R2. However, the all ALS models have lower RMSE and MAE errors. The highest RMSE and MAE (0.645 m, 0.519 m) have a regional model for natural forest region VI developed using SA. In comparison the ALS model for the VI natural forest region has lowest RMSE (0.48 m) and MAE (0.36 m) errors.
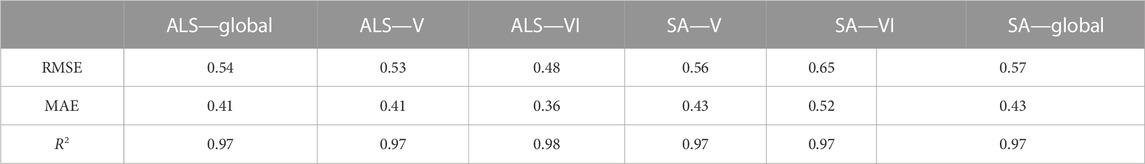
TABLE 4. Fit statistics of the top height growth models developed on the basis of aerial laser scanning (ALS) data and of the top height growth models developed on the basis of Stem Analysis (SA) data.
The residual distribution is quite similar for all models (Figure 9). However, it can be seen that the SA models have higher errors, especially for the natural forest region VI. Both positive and negative residuals are evenly distributed across the models, except the SA model from the VI natural forest region. In all the models we can see that the outliers are higher in the lower stands where there are a smaller number of observations.
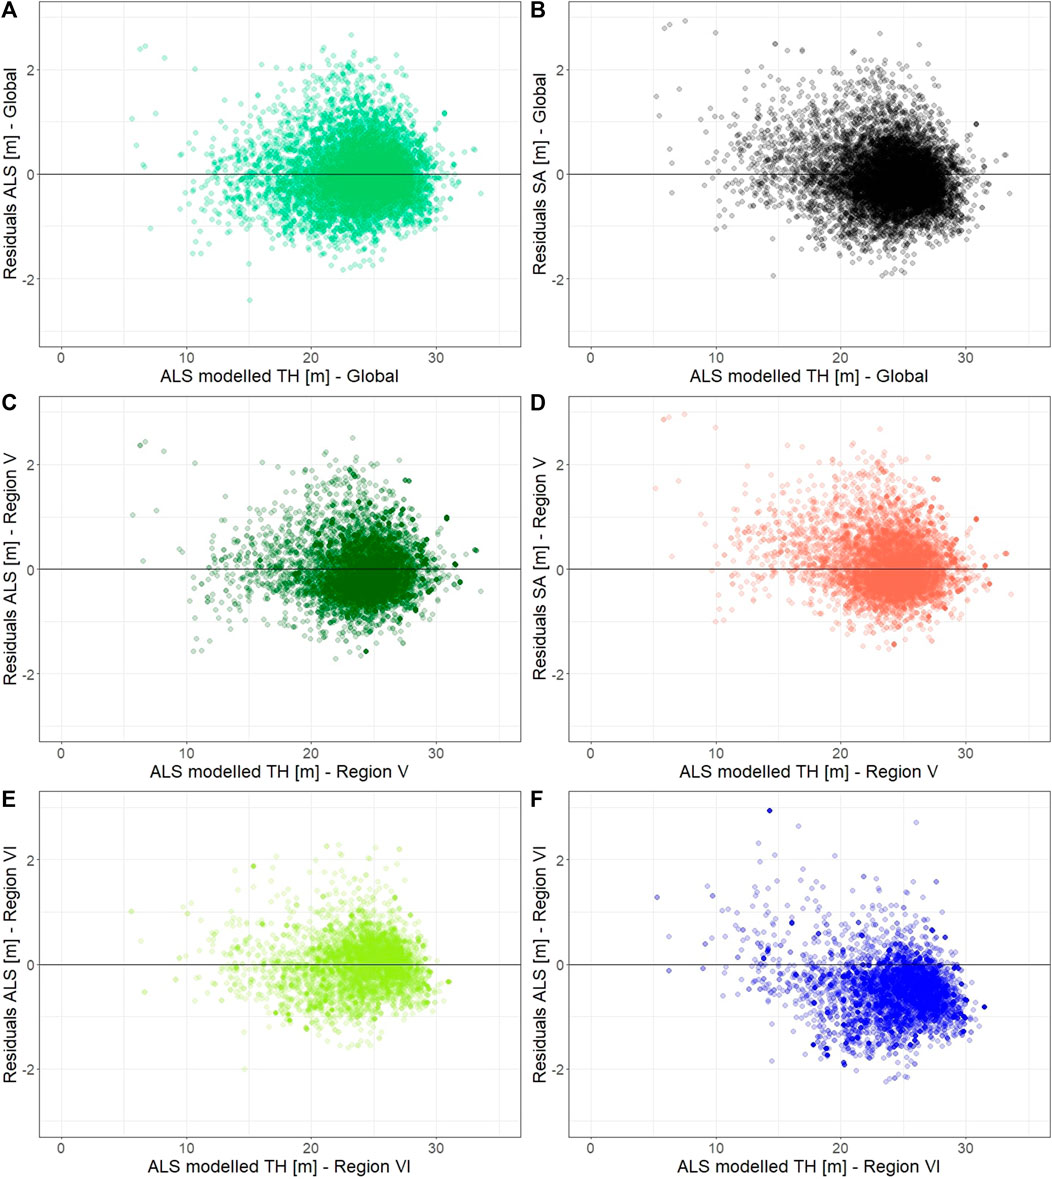
FIGURE 9. Top height residuals against values predicted from aerial laser scanning (ALS) derived models and three models based on the Stem Analysis (SA) for Scots pine stands in Katowice Regional Directorate of State Forests: Global ALS (A) and Stem Analysis (SA) Models (B); V natural forest region ALS (C) and SA Models (D); VI natural forest region ALS (E) and SA Models (F).
4 Discussion
Our study demonstrate the usefulness of ALS data for calibration height growth models for large areas. We calibrated the height growth model of Scots pine stands in the Katowice Regional Directorate of State Forests based on the bi-temporal ALS measurements. Our results show that the model calibrated using remote sensing data does not differ substantially from the model calibrated using traditional field measurements from SA. Bi-temporal ALS data have been used previously to calibrate growth models, but for relatively small areas (Socha et al., 2017; Socha et al., 2020b; Tompalski et al., 2015; Tymińska-Czabańska et al., 2021). The growth trajectories obtained from models developed on ALS data are similar to those obtained from models calibrated on SA data.
We found that model curves constructed from ALS data for entire study area were almost identical to model curves derived from SA data. Very slight differences can be observed in the younger and middle age classes (Figure 5). However, the ALS model was developed based on data from 27 753 stands while the SA model was based on data from 855 trees. Therefore, the model developed from ALS data may even better reflect the growth patterns currently observed for Scots pine on the most productive sites of the study area. ALS models developed for stands located in natural forest region V and VI are characterised by slightly different model curves, but also show a very high similarity to the models developed on the basis of data from SA. The model developed on the basis of the ALS for natural region VI shows larger differences in the course of growth trajectories, especially in the lowest productivity areas, compared to the SA model. This is most likely due to the local specificity of the site conditions. We also found that the model calibrated with ALS data has better accuracy in the prediction of height growth than the traditional model calibrated with field data.
Compared to the SA data, the period of availability of the ALS data is relatively short, which is one of the limitations in modelling forest growth (Coops, 2015). Moreover, in the case of growth models developed using data from a short observation period, height growth trajectories may be affected by weather conditions between ALS acquisitions (Tymińska-Czabańska et al., 2021). However, Hopkinson et al. (2008) observed that after the 5-year ALS observation period the uncertanities in the THI decreased to 6%. Furthermore, the advantage of the ALS data on height growth over a short period of time is that they reflect the actual growth trends. In addition, the ALS makes it possible to collect data from the entire region, which makes it possible to cover the whole distribution of forest age and site conditions. By calibrating the growth model using SA data, we are able to capture long-term trends. However, due to climate change, such models may reflect historical growth patterns that are not necessarily observed under current climate conditions. Moreover, Raulier et al. (2003) claim that SA models often overestimate the TH increment when compared to the permanent sample plots. In contrast, ALS data reflect current growth trends. ALS data allow to observe changes in the height of individual stands and trees for the whole area of interest, and therefore may better represent height growth trends compared to sample plot data or growth trajectory reconstructions from SA traditionally used in forestry research. In addition, a major advantage of remote sensing data is that it can be collected using a consistent methodology. Remote sensing provides a standardized way of collecting data, reducing the risk of human error and bias (Jurjević et al., 2020). This allows more reliable comparisons to be made over time and between regions.
Currently, the main limitation related to the applicability of multi-temporal ALS data in monitoring and modelling forest growth is connected with the availability of repeated ALS data (Tompalski et al., 2021). Another limitation is the need for data from a specific point in the growing season. If ALS is acquired during the height growth period, there is no certainty that growth from a given year is already included in the measurement. For this reason, data collected outside the height growth period is preferable. Remote sensing can also be used to accurately measure the height of trees in the upper canopy layer. Trees growing below the canopy are more difficult to detect and the accuracy of the measurement is much lower due to the number of individual laser beams (Xu et al., 2021). However, over time, as ALS becomes more widely used, it may become an alternative to traditional data collection methods, especially for measuring forest height and growth increment (Tompalski et al., 2021). Another limitation of ALS data to date has been its accuracy with respect to point cloud density (Nilsson et al., 2017). However, developments in remote sensing technologies are increasing the availability of dense point clouds covering entire countries (Kurczyński and Bakuła, 2013). The use of multi-temporal data appears to be very promising, as it avoids the problems associated with short-term growth fluctuations driven by weather conditions, while at the same time exploiting the advantage of models that capture current growth trends. Therefore, ALS appears to be a promising source of data for height growth modelling. It is expected that repeated ALS will become increasingly important and a common data source in forestry (Socha et al., 2020a; Tompalski et al., 2021). The biggest advantage of remote sensing is its ability to cover large geographical areas, allowing us to monitor forest growth on a global scale (Tompalski et al., 2021). It would be incredibly time-consuming and costly to collect data on a similar scale using field measurements. In addition, remote sensing data can be collected repeatedly over the same area, allowing time-series analysis. This allows scientists to track changes in forest growth and health status over time, which can provide important insights about the effects of climate change, pest outbreaks or other disturbances (Tymińska-Czabańska et al., 2022).
What is important, some remote sensing technologies can provide near real-time data, making it possible, for example, to track the response of forests to changing climatic conditions. A model developed using the most up-to-date data provides a reliable prediction of forest growth under currently observed climatic conditions, which may differ significantly from those observed in the past (Socha et al., 2021a; Mensah et al., 2021). In the future, different remote sensing data fusion should be utilized. The use of machine learning methods allows to implementation of robust models for the site productivity assessment (Bombrun et al., 2020). The implementation of optical remote sensing data and climatic variables could substantially increase the results of the ALS model (Rahimzadeh-Bajgiran et al., 2020; Schneider et al., 2023; Tymińska-Czabańska et al., 2021). The data fusion approach could help us to create and integrate the forest productivity and forest growth models from local to global scale (Schneider et al., 2023). This is particularly important for both the adaptation of forests to climate change and the provision of ecosystem services. For example, it can help identify areas of environmental stress (Tymińska-Czabańska et al., 2022) or assess the effectiveness of forest management and adaptation efforts. In this context, regional height growth models can be a tool to predict the future role of forest tree species under changing climatic conditions, which can help to select appropriate forest management strategies.
Numerous studies have shown that growth modelling, especially on a regional scale, provides information for a more accurate assessment of forest growth and should be an important component of regional forest planning and management (Coops et al., 2007; Coops et al., 2010; Socha et al., 2020b). Variability in growth dynamics can lead to differences in height growth trajectories due to local variations in climate, soils and genotype-environment interactions (Viet et al., 2022). Thus, regional variation in growth trajectories can lead to inappropriate estimates of site productivity (Socha et al., 2021b). This can result in under- or overestimation of growth potential at a given site (Monserud and Rehfeldt, 1990; González et al., 2005). Research results indicate that variability due to environmental factors is the main reason why a more flexible approach should be used in the development of height growth models in order to accurately reflect height growth variability at the regional scale (Bravo-Oviedo et al., 2008). Therefore, more reliable predictions of stand growth and more accurate forest management decisions can be made by taking into account the local specificity of site conditions through the construction of regional growth models. Both biomass production and carbon sequestration are closely linked to the dynamics of height growth. Furthermore, one of the most important demands of modern forestry is to determine the global CO2 sequestration capacity of forests (Smith et al., 2014; Shukla et al., 2019). A reliable assessment of the biomass production and carbon sequestration capacity of forest ecosystems therefore depends on the ability to adequately estimate forest growth (Pretzsch, 2009; Bontemps and Bouriaud, 2014; Coops, 2015). Therefore, monitoring regional forest growth helps scientists understand the role of forests in the global carbon cycle, which is crucial for climate change research and mitigation strategies.
Research aimed at developing forest growth models is of great importance both for the development of forest science and for forest management practice. Further research into remote sensing data processing methods and their application in forestry can contribute to the scientific understanding of many forest ecosystem processes, which is particularly important in an era of climate change and anthropopression. Previous studies have demonstrated the feasibility of developing local height growth models using ALS data. Our study demonstrates the high suitability of bi-temporal ALS data for the development of regional models. The regional variability in site conditions and most recent data should be taken into account when modelling height growth, especially if up-to-date models are desired. The longer observation period with multi-temporal ALS data collections and the extension of the study area to the country level may allow further development of the proposed approach.
5 Conclusion
We have demonstrated that ALS data can be used for height growth modelling on a regional scale. We developed three TH growth models for the Scots pine stands based on the bi-temporal ALS data and validated them with models developed for Scots pine using the traditional approach based on field data. Our results show that the model calibrated with remote sensing data does not differ significantly from the model calibrated with traditional field measurements from stem analysis, and that the model calibrated with ALS data has better accuracy than the traditional model calibrated with field data. Our study highlights that modelling height growth for regions allows local patterns of growth to be captured. This may be important for determining forest productivity at the scale of regions, as well as having implications for regional forest management. Our results are also promising for long-term prediction of tree growth under current climatic conditions using repeated ALS data for the development of regional height growth models.
Data availability statement
Publicly available datasets were analyzed in this study. This data can be found here: https://mapy.geoportal.gov.pl/imap/Imgp_2.html?gpmap=gp0.
Author contributions
PJ: Conceptualization, Data curation, Formal Analysis, Methodology, Validation, Writing–original draft. LT-C: Conceptualization, Writing–original draft. PH: Conceptualization, Writing–review and editing. JS: Conceptualization, Funding acquisition, Writing–review and editing.
Funding
The authors declare financial support was received for the research, authorship, and/or publication of this article. This research was funded by General Directorate of State Forests in Poland under the project entitled: Modele przyrostu miąższości głównych gatunków lasotwórczych Polski (Volume increment models for the main forest-forming species of Poland), contract no. EZ.271.3.20.2021.
Conflict of interest
The authors declare that the research was conducted in the absence of any commercial or financial relationships that could be construed as a potential conflict of interest.
Publisher’s note
All claims expressed in this article are solely those of the authors and do not necessarily represent those of their affiliated organizations, or those of the publisher, the editors and the reviewers. Any product that may be evaluated in this article, or claim that may be made by its manufacturer, is not guaranteed or endorsed by the publisher.
References
Beland, M., Parker, G., Sparrow, B., Harding, D., Chasmer, L., Phinn, S., et al. (2019). On promoting the use of lidar systems in forest ecosystem research. For. Ecol. Manag. 450, 117484. doi:10.1016/j.foreco.2019.117484
Bombrun, M., Dash, J. P., Pont, D., Watt, M. S., Pearse, G. D., and Dungey, H. S. (2020). Forest-Scale Phenotyping: Productivity Characterisation Through Machine Learning. Front. Plant Sci. 11, 99. doi:10.3389/fpls.2020.00099
Bontemps, J.-D., and Bouriaud, O. (2014). Predictive approaches to forest site productivity: Recent trends, challenges and future perspectives. Forestry 87 (1), 109–128. doi:10.1093/forestry/cpt034
Bravo-Oviedo, A., Tomé, M., Bravo, F., Montero, G., and del Río, M. (2008). Dominant height growth equations including site attributes in the generalized algebraic difference approach. Can. J. For. Res. 38 (9), 2348–2358. doi:10.1139/X08-077
Cieszewski, C. J. (2001). Three methods of deriving advanced dynamic site equations demonstrated on inland Douglas-fir site curves. Can. J. For. Res. 31 (1), 165–173. doi:10.1139/x00-132
Computing, Rf. (2013). R: a language and environment for statistical computing. Vienna: R Core Team.
Coops, N. C. (2015). Characterizing forest growth and productivity using remotely sensed data. Curr. For. Rep. 1, 195–205. doi:10.1007/s40725-015-0020-x
Coops, N. C., Gillanders, S. N., Wulder, M. A., Gergel, S. E., Nelson, T., and Goodwin, N. R. (2010). Assessing changes in forest fragmentation following infestation using time series Landsat imagery. For. Ecol. Manag. 259 (12), 2355–2365. doi:10.1016/j.foreco.2010.03.008
Coops, N. C., Hilker, T., Wulder, M. A., St-Onge, B., Newnham, G., Siggins, A., et al. (2007). Estimating canopy structure of Douglas-fir forest stands from discrete-return LiDAR. Trees 21, 295–310. doi:10.1007/s00468-006-0119-6
González, J. G. Á., González, A. D. R., Soalleiro, R. R., and Anta, M. B. (2005). Ecoregional site index models for Pinus pinaster in Galicia (northwestern Spain). Ann. For. Sci. 62 (2), 115–127. doi:10.1051/forest:2005003
Holmes, K. R., Coops, N. C., Nelson, T. A., Fontana, F. M., and Wulder, M. A. (2015). Indicators of vegetation productivity under a changing climate in British Columbia, Canada. Appl. Geogr. 56, 135–144. doi:10.1016/j.apgeog.2014.11.020
Hopkinson, C., Chasmer, L., and Hall, R. J. (2008). The uncertainty in conifer plantation growth prediction from multi-temporal lidar datasets. Remote Sens. Environ. 112 (3), 1168–1180. doi:10.1016/j.rse.2007.07.020
Jurjević, L., Liang, X., Gašparović, M., and Balenović, I. (2020). Is field-measured tree height as reliable as believed – Part II, A comparison study of tree height estimates from conventional field measurement and low-cost close-range remote sensing in a deciduous forest. ISPRS J. Photogrammetry Remote Sens. 169, 227–241. doi:10.1016/j.isprsjprs.2020.09.014
Kurczyński, Z., and Bakuła, K. (2013). Generowanie referencyjnego numerycznego modelu terenu o zasięgu krajowym w oparciu o lotnicze skanowanie laserowe w projekcie ISOK. Arch. Fotogram. Kartogr. i Teledetekcji, 59–68.
Lefsky, M. A., Cohen, W. B., Parker, G. G., and Harding, D. J. (2002). Lidar Remote Sensing for Ecosystem Studies: Lidar, an emerging remote sensing technology that directly measures the three-dimensional distribution of plant canopies, can accurately estimate vegetation structural attributes and should be of particular interest to forest, landscape, and global ecologists. BioScience 52 (1), 19–30. doi:10.1641/0006-3568(2002)052[0019:LRSFES]2.0.CO;2
Marziliano, P. A., Tognetti, R., and Lombardi, F. (2019). Is tree age or tree size reducing height increment in Abies alba Mill. At its southernmost distribution limit? Ann. For. Sci. 76 (1), 17. Article 1. doi:10.1007/s13595-019-0803-5
Mensah, A. A., Holmström, E., Petersson, H., Nyström, K., Mason, E. G., and Nilsson, U. (2021). The millennium shift: Investigating the relationship between environment and growth trends of Norway spruce and Scots pine in northern Europe. For. Ecol. Manag. 481, 118727. doi:10.1016/j.foreco.2020.118727
Monserud, R. A., and Rehfeldt, G. E. (1990). Genetic and environmental components of variation of site index in inland Douglas-fir. For. Sci. 36 (1), 1–9.
Moré, J. J. (2006).The Levenberg-Marquardt algorithm: Implementation and theory, Numerical Analysis: Proceedings of the Biennial Conference Held at Dundee, June 28–July 1, USA. IEEE, 105.
Næsset, E., Gobakken, T., Holmgren, J., Hyyppä, H., Hyyppä, J., Maltamo, M., et al. (2004). Laser scanning of forest resources: The Nordic experience. Scand. J. For. Res. 19 (6), 482–499. doi:10.1080/02827580410019553
Nilsson, M., Nordkvist, K., Jonzén, J., Lindgren, N., Axensten, P., Wallerman, J., et al. (2017). A nationwide forest attribute map of Sweden predicted using airborne laser scanning data and field data from the National Forest Inventory. Remote Sens. Environ. 194, 447–454. doi:10.1016/j.rse.2016.10.022
Noordermeer, L., Bollandsås, O. M., Gobakken, T., and Næsset, E. (2018). Direct and indirect site index determination for Norway spruce and Scots pine using bitemporal airborne laser scanner data. For. Ecol. Manag. 428, 104–114. doi:10.1016/j.foreco.2018.06.041
Perin, J., Hébert, J., Brostaux, Y., Lejeune, P., and Claessens, H. (2013). Modelling the top-height growth and site index of Norway spruce in Southern Belgium. For. Ecol. Manag. 298, 62–70. doi:10.1016/j.foreco.2013.03.009
Pretzsch, H., Biber, P., Schütze, G., Uhl, E., and Rötzer, T. (2014). Forest stand growth dynamics in Central Europe have accelerated since 1870. Nat. Commun. 5 (1), 4967. doi:10.1038/ncomms5967
Pretzsch, H. (2009). “Forest Dynamics, Growth, and Yield,” in Forest dynamics, growth and yield: from measurement to model. Editor H. Pretzsch (Germany: Springer), 1–39. doi:10.1007/978-3-540-88307-4_1
Rahimzadeh-Bajgiran, P., Hennigar, C., Weiskittel, A., and Lamb, S. (2020). Forest Potential Productivity Mapping by Linking Remote-Sensing-Derived Metrics to Site Variables. Remote Sens. 12 (12), 2056. Article 12. doi:10.3390/rs12122056
Raulier, F., Lambert, M.-C., Pothier, D., and Ung, C.-H. (2003). Impact of dominant tree dynamics on site index curves. For. Ecol. Manag. 184 (1–3), 65–78. doi:10.1016/s0378-1127(03)00149-x
Roussel, J.-R., Auty, D., Coops, N. C., Tompalski, P., Goodbody, T. R., Meador, A. S., et al. (2020). lidR: An R package for analysis of Airborne Laser Scanning (ALS) data. Remote Sens. Environ. 251, 112061. doi:10.1016/j.rse.2020.112061
Schneider, F. D., Longo, M., Paul-Limoges, E., Scholl, V. M., Schmid, B., Morsdorf, F., et al. (2023). Remote Sensing-Based Forest Modeling Reveals Positive Effects of Functional Diversity on Productivity at Local Spatial Scale. J. Geophys. Res. Biogeosciences 128 (6), e2023JG007421. doi:10.1029/2023JG007421
Shukla, P. R., Skea, J., Calvo Buendia, E., Masson-Delmotte, V., Pörtner, H. O., Roberts, D. C., et al. (2019). IPCC, 2019: climate change and land: An IPCC special report on climate change, desertification, land degradation, sustainable land management, food security, and greenhouse gas fluxes in terrestrial ecosystems.
Smith, P., Bustamante, M., Ahammad, H., Clark, H., Dong, H., Elsiddig, E. A., et al. (2014). “Agriculture, forestry and other land use (AFOLU),” in Climate change 2014: mitigation of climate change. Contribution of working group III to the fifth assessment report of the intergovernmental panel on climate change (Cambridge: Cambridge University Press), 811–922.
Socha, J., Hawryło, P., Stereńczak, K., Miścicki, S., Tymińska-Czabańska, L., Młocek, W., et al. (2020a). Assessing the sensitivity of site index models developed using bi-temporal airborne laser scanning data to different top height estimates and grid cell sizes. Int. J. Appl. Earth Observation Geoinformation 91, 102129. doi:10.1016/j.jag.2020.102129
Socha, J., Pierzchalski, M., Bałazy, R., and Ciesielski, M. (2017). Modelling top height growth and site index using repeated laser scanning data. For. Ecol. Manag. 406, 307–317. doi:10.1016/j.foreco.2017.09.039
Socha, J., Solberg, S., Tymińska-Czabańska, L., Tompalski, P., and Vallet, P. (2021a). Height growth rate of Scots pine in Central Europe increased by 29% between 1900 and 2000 due to changes in site productivity. For. Ecol. Manag. 490, 119102. doi:10.1016/j.foreco.2021.119102
Socha, J., and Tymińska-Czabańska, L. (2019). A method for the development of dynamic site index models using height–age data from temporal sample plots. Forests 10 (7), 542. doi:10.3390/f10070542
Socha, J., Tymińska-Czabańska, L., Bronisz, K., Zięba, S., and Hawryło, P. (2021b). Regional height growth models for Scots pine in Poland. Sci. Rep. 11 (1), 10330–10414. doi:10.1038/s41598-021-89826-9
Socha, J., Tymińska-Czabańska, L., Grabska, E., and Orzeł, S. (2020b). Site index models for main forest-forming tree species in Poland. Forests 11 (3), 301. doi:10.3390/f11030301
Tompalski, P., Coops, N. C., White, J. C., Goodbody, T. R. H., Hennigar, C. R., Wulder, M. A., et al. (2021). Estimating Changes in Forest Attributes and Enhancing Growth Projections: A Review of Existing Approaches and Future Directions Using Airborne 3D Point Cloud Data. Curr. For. Rep. 7 (1), 1–24. doi:10.1007/s40725-021-00135-w
Tompalski, P., Coops, N. C., White, J. C., and Wulder, M. A. (2015). Augmenting site index estimation with airborne laser scanning data. For. Sci. 61 (5), 861–873. doi:10.5849/forsci.14-175
Tymińska-Czabańska, L., Hawryło, P., Janiec, P., and Socha, J. (2022). Tree height, growth rate and stand density determined by ALS drive probability of Scots pine mortality. Ecol. Indic. 145, 109643. doi:10.1016/j.ecolind.2022.109643
Tymińska-Czabańska, L., Socha, J., Hawryło, P., Bałazy, R., Ciesielski, M., Grabska-Szwagrzyk, E., et al. (2021). Weather-sensitive height growth modelling of Norway spruce using repeated airborne laser scanning data. Agric. For. Meteorology 308, 108568. doi:10.1016/j.agrformet.2021.108568
Viet, H. D. X., Tymińska-Czabańska, L., and Socha, J. (2022). Drivers of site productivity for oak in Poland. Dendrobiology 88, 81–93. doi:10.12657/denbio.088.006
Wang, Y., Lehtomäki, M., Liang, X., Pyörälä, J., Kukko, A., Jaakkola, A., et al. (2019). Is field-measured tree height as reliable as believed–A comparison study of tree height estimates from field measurement, airborne laser scanning and terrestrial laser scanning in a boreal forest. ISPRS J. Photogrammetry Remote Sens. 147, 132–145. doi:10.1016/j.isprsjprs.2018.11.008
White, J. C., Coops, N. C., Wulder, M. A., Vastaranta, M., Hilker, T., and Tompalski, P. (2016). Remote sensing technologies for enhancing forest inventories: A review. Can. J. Remote Sens. 42 (5), 619–641. doi:10.1080/07038992.2016.1207484
Xu, D., Wang, H., Xu, W., Luan, Z., and Xu, X. (2021). LiDAR Applications to Estimate Forest Biomass at Individual Tree Scale: Opportunities, Challenges and Future Perspectives. Forests 12 (5), 550. Article 5. doi:10.3390/f12050550
Zajączkowski, G., Jabłoński, M., Jabłoński, T., Małecka, M., Kowalska, A., Małachowska, J., et al. (2018). Raport o stanie lasów w polsce 2017. Państwowe gospodarstwo leśne lasy państwowe. Warszawa: Centrum Informacyjne Lasów Państwowych.
Keywords: ALS, height growth increment, growth dynamic, ecosystem modelling, site productivity
Citation: Janiec P, Tymińska-Czabańska L, Hawryło P and Socha J (2023) Development of regional height growth model for Scots pine using repeated airborne laser scanning data. Front. Environ. Sci. 11:1260725. doi: 10.3389/fenvs.2023.1260725
Received: 18 July 2023; Accepted: 28 September 2023;
Published: 12 October 2023.
Edited by:
Qingwang Liu, Chinese Academy of Forestry, ChinaReviewed by:
Lin Zhang, Chinese Academy of Sciences (CAS), ChinaXueqian Hu, China Agricultural University, China
Copyright © 2023 Janiec, Tymińska-Czabańska, Hawryło and Socha. This is an open-access article distributed under the terms of the Creative Commons Attribution License (CC BY). The use, distribution or reproduction in other forums is permitted, provided the original author(s) and the copyright owner(s) are credited and that the original publication in this journal is cited, in accordance with accepted academic practice. No use, distribution or reproduction is permitted which does not comply with these terms.
*Correspondence: Piotr Janiec, cGlvdHJqYW5pZWMyQGdtYWlsLmNvbQ==