 Yanfang Lyu
 Yun Xiang
 Dong Wang
- 1School of Statistics and Institute of Quantitative Economics, Huaqiao University, Xiamen, China
- 2School of Economics and Finance, Huaqiao University, Quanzhou, China
- 3School of Business, Minnan Normal University, Zhangzhou, China
Objective: Digitalization supported by digital technology presents a potential solution for improving the efficiency of resource utilization. However, the impacts of digitalization on trade-related carbon emissions intensity have not been studied systematically.
Methods: Based on panel data of 41 countries and regions over the period 2000–2014, this study examines how different types of digital value chain embeddedness can affect carbon emissions intensity using a semi-parametric partially linear model.
Results: Research findings indicate that there is an inverted U-shaped relationship between digital domestic value chain embeddedness and carbon emissions intensity embodied in domestic trade; only when digitalization reaches a threshold of approximately 0.88, does the effects on carbon emissions intensity become negative. In addition, the impacts of digital global value chain embeddedness on carbon emissions intensity embodied in import trade and export trade are recognized as being non-linear; the thresholds of digitalization are approximately 0.1 and 0.3 for import trade and approximately 0.03 and 0.21 for export trade. Although participating in global value chains is conducive to accelerating digital technology diffusion, the actual environmental effects are constrained by a country’s absorptive capacity and high economic system complexity. Compared with developed countries, developing countries lag behind in entering the downward stage of the inverted U-shaped curve, thereby gaining environmental benefits from digital value chain embeddedness. Moreover, in terms of utilizing digital value chain embeddedness to improve energy efficiency, measures include optimizing trade conditions, adjusting energy structure, and increasing trade scale, which can play an active role.
Value: This study sheds light on the exploration of the potential of digitalization and the facilitation of economic development in a more environmentally friendly manner.
1 Introduction
The advent of global value chains (GVCs) has significantly changed international trade patterns (Meng et al., 2018). Depending on comparative advantages, the production of a commodity can be undertaken in different regions, and intermediate products may be traded across borders many times (Grossman and Rossi-Hansberg, 2008; Baldwin and Venables, 2013; Antràs and Gortari, 2020). Under the trend of international production fragmentation, some side effects arise from trade activities, especially environmental issues such as increased carbon dioxide (CO2) emissions. It is estimated that approximately a quarter of global carbon emissions are derived from international trade, with a serious asymmetry in environmental costs between developed and developing countries (Peters et al., 2011; Huang and Zhang, 2023). Therefore, participating in GVCs in a more environmentally friendly way is becoming increasingly important, among which improving energy efficiency is regarded as key to balancing steady economic growth and carbon emissions reduction (Sun et al., 2019; Li et al., 2022; Zhang et al., 2023).
Digitalization supported by digital technology has been considered as a potential driver for sustainable economic development (Gouvea et al., 2020; Ren et al., 2021). Encouraging and promoting cleaner production is conducive to reducing carbon emissions (Nguyen et al., 2020). On the other hand, some researchers argue that environmental degradation may also occur (Moyer and Hughes, 2012). In recent years, with the continuous penetration of digital technology into the real economy, GVCs have undergone drastic changes. A new channel of digitally driven globalization has arisen (van der Marel, 2021; Blazquez et al., 2022), which is defined as digital value chain embeddedness in this study. Concerning the interaction between digital technology and GVCs, a large body of research has been carried out to analyze the impacts of digitalization on productivity, economic growth, and GVC specialization (Niebel, 2018; Szalavetz, 2019; Lahouel et al., 2021; Banga, 2022). However, there has only been a very limited attempt to link digitalization, GVCs, and carbon emissions intensity together (Wiedmann and Lenzen, 2018). With the rapid digital transformation of GVCs, carbon emissions embodied in international trade might be altered due to the change in trade patterns. Moreover, as domestic trade accounts for a considerable proportion of overall trade in some countries, the environmental effects of digitalization along domestic value chains have also yet to be investigated. In this regard, the study aims to clarify the impacts of digital value chain embeddedness on carbon emissions intensity, which is critical for fully utilizing the energy-saving effects of digitalization and identifying the probable pressures during a low-carbon transition process.
Although digitalization is generally perceived as an engine for a low-carbon economy, controversy remains about the role of digitalization in trade-related carbon emissions (Danish, 2019; Lin and Huang, 2023). According to the study of Copeland and Taylor (1994); Antweiler et al.(2001), the environmental effects of trade bring into play due to trade scale, trade embedded technique and trade composition. One view suggests that digitalization induces large-scale data trading, and the supporting operation of digital industries increases carbon consumption (Jones, 2018; Xiao et al., 2020; He and Xie, 2022). The direct effects of a cyclic process of digitalization, as well as the indirect effects of an expanding economy, tend to increase carbon emissions (Lange et al., 2020). Moreover, the rebound effect also leads to a surge in carbon-intensive product consumption (Peng et al., 2023). By contrast, another view supporting the emission reduction effects of digitalization suggests that through technological progress, learning by exporting, and trade barrier pushback (Banga, 2022), it will bring significant energy savings. In addition, several studies have confirmed that digitalization promotes technological innovation and further optimizes energy utilization structures (Ollo-López and Aramendía-Muneta, 2012; Usman et al., 2015; Bastida et al., 2019; Xu et al., 2022), which contribute to carbon emissions reduction. From the perspective of countries of different economic development levels, developing countries are at a disadvantage in terms of the trade environment (Wang et al., 2021), and even become a “pollution refuge” by taking part in global production networks (Peng, 2020; Li et al., 2021). Although the relationship between digital value chain embeddedness and carbon emissions intensity is intricate, most scholars identify with the energy saving effects for developed countries (Danish et al., 2019; Qayyum et al., 2021; Shi et al., 2022). Furthermore, apart from the above two opposite propositions on the carbon emission effects of digitalization, it is also argued that the relationship between digitalization and environmental performance is probably non-linear (Higon et al., 2017). However, based on the viewpoint of energy efficiency, the potential non-linear relationship between digitalization and carbon emissions intensity has been investigated less (Bekaroo et al., 2016; Li and Wang, 2022).
A challenge to achieving a consensus on the relationship between digitalization and energy efficiency is the accounting framework. A large body of literature has applied the “consumption-based carbon accounting” method to compute carbon emissions, which is a modification of the conventional “territorial-based carbon accounting” method (Su et al., 2010; Liddle, 2018). Both measures are based on gross trade statistics, which would give rise to the issue of double counting and non-conformity with the System of National Accounts. As an improvement, the accounting method of value-added trade provides powerful tools for calculating carbon emissions embodied in trade (Meng et al., 2018). On this ground, existing efforts have been made to trace the carbon footprint from the point of life-cycle assessment, and the methods are mainly based on bilateral trade input-output models or single regional input-output models (Fan et al., 2021). Additionally, some scholars have conducted research on GVCs and carbon emissions embodied in trade separately (Dolter and Victor, 2016; Pothen, 2017; Jiborn et al., 2018). However, these attempts did not distinguish the carbon content difference between imported and domestic intermediate goods, causing the measurement results to deviate from the actual situation (Xu et al., 2011; Liu et al., 2013). With the worldwide prevalence of intra-product trade, applying multiregional input-output models (MRIOs) to track carbon emissions back to the production sector is gradually becoming mainstream. As Jin et al. (2020) have pointed out, although CO2 emissions are probably increasing year-on-year, the energy utilization efficiency indicator characterized by carbon emissions intensity might show different results and more convincingly evaluate the performance of energy conservation.
Overall, there is room for improvement in existing studies. In terms of measurement, digital value chain embeddedness is not clearly reflected by the statistical indicators, such as the digital input ratio and digital development index. These pertinent measures provide a limited reference for the real level of digital value chain embeddedness. As for the potential non-linear relationship between digital value chain embeddedness and carbon emissions intensity, it has received less attention, and the evolvement of the marginal effect has not been investigated either. Furthermore, the phenomenon of the digital divide across countries is probably an influential factor in mediating the effects of digitalization on energy efficiency, which needs to be further verified. In this study, based on panel data of 41 economies over the period 2000–2014, we construct the carbon emissions intensity indicator to reflect adversely on domestic and international trade-related energy efficiency. In addition, we identify digital economy sectors from all sectors and establish the measurement and decomposition framework of digital value chain embeddedness. Furthermore, we use a semi-parametric partially linear model to test the non-linear effects of digital value chain embeddedness on carbon emissions intensity, with the purpose of emphasizing the evolvement of the marginal impact concerning different digital development levels. Compared with other econometric models, on the one hand, it avoids the weakness of setting a specific functional relationship subjectively and can better grasp the true impacts of digital value chain embeddedness on carbon emissions intensity; on the other hand, the marginal effect graph can directly show the effects of the core explanatory variable on the dependent varible. The empirical results prove that there is an inverted U-shaped relationship between digital domestic value chain embeddedness and carbon emissions intensity. We identify a threshold of 0.88 that divides the range of digitalization into two intervals; when it is in the low range of digital domestic value chain embeddedness, its marginal effect on carbon emissions intensity is positive; when it is in the higher range, the impact is reversed. Comparatively, we recognize two thresholds in the case of digital GVC embeddedness, which are 0.1 and 0.3 for import trade and 0.03 and 0.21 for export trade. This reveals that a country’s pertinent absorptive capacity lags behind in digital technological development as the enhancement of the adaptive capability needs to take a dynamic process.
The marginal contributions of this study are reflected in three aspects: first, compared with the single indicator of CO2 emissions that is based on the absolute quantity perspective, in this study, we construct carbon emissions intensity indicators to reflect adversely on energy efficiency. Specifically, through the lens of value chains, we focus on carbon emissions intensity embodied in domestic trade, import trade, and export trade. Additionally, the digital domestic value chain embeddedness and digital GVC embeddedness are measured. This study provides statistical backing for the research fields of digitalization and its environmental effects. Second, in the era of the digital economy, the relationship between value chain activities and environmental impacts may shed some new light. However, relevant research that combines digitalization, GVCs, and carbon emissions intensity is still lacking. By integrating them into a unified framework, this study provides a novel insight into boosting decarbonization through digital value chain embedding while enhancing steady economic growth. Third, different from existing studies that focus on the linear environmental effects of digitalization, based on theoretical analysis of probable non-linear effects, this study applies a semi-parametric partially linear model to explore the non-linear relationship between different types of digital value chain embeddedness and carbon emissions intensity. The findings reveal that only when digital value chain embeddedness reaches a certain value, it has virtual impacts on energy saving. Targeted policy implications are thus put forward, especially that each economy should adjust its digital transformation strategy based on its stage of economic development and the technology absorptive capacity.
2 Theoretical analysis
Compared with conventional industries, digital industry is much more environmentally friendly, with the advantages of high energy efficiency (Amri et al., 2019). It is well-recognized that digitalization provides a new impetus for technological progress. As intermediate inputs, digital elements contribute to upgrading conventional manufacturing industries and improving the efficiency of R&D. Thus, digitalization is conducive to reducing carbon emissions intensity. However, the effectiveness of digitalization is constrained by its connectivity characteristics (Lin and Huang, 2023). Conditional on different levels of digital value chain embeddedness, both the energy consumption impact and the energy saving benefit of digitalization take effect. The net impact depends on which mechanism prevails, and a simple linear assumption would not be valid (Ren et al., 2021). To inspect the win-win influence of digitalization in facilitating economic growth and carbon emissions reduction (Xu et al., 2022), the indicator of carbon emissions intensity is chosen to manifest the environmental performance, which is more comprehensive than that of the absolute carbon emissions indicator. Concerning the mixed effects of digitalization, we refer to the studies of Lange et al. (2020) and Azam et al. (2021) and propose that digital value chain embeddedness has a complex non-linear relationship with carbon emissions intensity.
From a perspective of technology adoption life cycle, the process of digital technology diffusion takes place gradually (Rao and Kishore, 2010). As Bai et al. (2023) have pointed out, there are innovators, early adopters, early majority, late majority, and laggards according to the adoption stages. While it is in a low range of digital value chain embeddedness, the construction of digital supportive resources is insufficient. The host country’s absorption capacity is limited because of the low degree of digital embedding (Huang et al., 2022). To sustain digital connectivity, many energy-intensive applications, such as data centers, electronic equipment, and data transmission networks, require massive energy consumption (Galvin, 2015; Bieser and Hilty, 2020). Owing to a high dependence of digital infrastructure on electric power, carbon emissions and carbon intensity increase when digital value chain embeddedness is in the early development stage (Morley et al., 2018; Jin and Yu, 2022). In addition, the rebound effect that refers to the production expansion of other industries incurred by digitalization poses another threat to energy efficiency endeavors (Joyce et al., 2019; Lin and Zhu, 2021). Additionally, digital trade operations have reshaped traditional trade models by expanding market reach and enhancing trade efficiency, which promotes economic growth (Zheng et al., 2023). In this regard, we conclude that digital value chain embeddedness indirectly increases carbon emissions intensity by broadening the economy.
As digital technology progresses, the ability of host countries to make use of advanced technologies is enhanced, and it will result in a declining trend in energy consumption. The deep integration of digital elements with conventional industries can decrease carbon emissions intensity by facilitating technological innovation, alleviating resource distortion, upgrading industrial structures, and accelerating the accumulation of human capital (Lin and Zhou, 2021; Zhong et al., 2022; Zhang et al., 2023). Based on innovation and signaling theory, participating in GVCs enhances the flow of digital elements, which is beneficial for technology spillovers. Positive externalities of internal and external communications about the knowledge-intensive technology provide impetus for the low-carbon transformation. From the perspective of manufacturing industry servicing, digitally enabled services can be traded by overcoming the constraints of geographical distance (Zhou et al., 2018; Blazquez et al., 2023). More varieties of high-quality services are available for manufacturers to make use of, which not only contributes to the growth of value-added trade but also enhances the environmental benefits.
Overall, owing to the overlap of direct and indirect environmental influences of digital value chain embeddedness, there may be an intricate relationship between digital value chain embeddedness and carbon emissions intensity. Energy consumption is often larger than the energy savings in the early stage of digitalization, and the energy saving effect takes precedence when the digitalization surpasses a certain level during its exponential growth path. Given the abovementioned analysis, we put forward the first hypothesis:
H1. There is an inverted U-shaped relationship between digital value chain embeddedness and carbon emissions intensity.
In addition to the threshold environmental effect of digital value chain embeddedness, developing and developed countries may exhibit significant differences in practice. Depending on their contrastive ways of embedding GVCs, developing countries typically take part in GVCs through backward embedding, which puts them in a position to generate more carbon emissions (Zhang et al., 2017). Participation in GVCs provides developing countries with opportunities to obtain advanced technologies and knowledge (Hummels et al., 2001; Wang et al., 2021). However, as developing countries are constrained to the lower end of the value chain, they are disadvantaged in upgrading industrial structures because they lack key technologies. There are significant gaps in digital technology between developing and developed countries. Compared with conventional production technology, it is more difficult to learn digital technology through demonstration and observational learning. Under the conditions of the core technologies grasped by developed countries (Huang et al., 2022), developing countries have to strengthen their absorption capacity, which depends on the accumulation of human capital, R&D ability, and the institutional environment.
Based on the standpoint of “pollution heaven” (Copeland and Taylor, 1994), pollution-intensive industries are shifted from developed countries to developing countries. Through importing intermediate products and exporting high-pollution final goods, developing countries generally gain low additional value and become net exporters of carbon embodied in trade (Xing, 2018; Liu et al., 2020). To cope with the pressure of carbon emissions reduction while realizing economic growth, improving environmental efficiency is more urgent for developing countries. In the global production network, long-term dependence on gaining technology spillovers from developed countries means it is difficult for developing countries to form independent intellectual property rights. As the application of digital technology requires substantial catch-up cosst for developing countries, it is challenging to improve GVCs by relying on the introduction of digital technology (Huang and Zhang, 2023). Furthermore, when confronted with digital technical blockades, such as digital patent protection strategies (Sun et al., 2019), developing countries lag further behind in exploiting the potential of digitalization. As a result, the risks of locking in low-end value chains are magnified in the digital era. In summary, we put forward the second hypothesis:
H2. Compared with developing countries, developed countries take the initiative in utilizing the energy-saving effects of digitalization.
3 Measurement
3.1 Measurement of carbon emissions intensity
We calculate trade-related carbon emissions intensity following the MRIO framework. In a global multi-regional input-output table comprising G countries, with each having N sectors, the basic row balance relation can be expressed as (Leontief, 1936):
where X is the gross output, a GN × 1 vector; A represents the direct consumption coefficient matrix, a GN×GN matrix; Y denotes the demand for the final goods, a GN×G matrix; and I is an identity matrix with the same dimensions of GN×GN. Define
To measure the transfer of carbon emissions embodied in domestic and international trade, this study set the coefficient vector of carbon emissions as follows:
where
In Eq. 3, Cm1 refers to the carbon emissions of country m induced by the final demand of country 1. The first subscript denotes the exporting country, and the second subscript represents the importing country. By categorizing traded goods into intermediate goods and final goods, we distinguished the carbon emissions embodied in exported and imported trade along GVCs, as shown in the following equations:
Thus, the net carbon flow of a country is given as:
Similar to the construction of carbon flow matrix, when the matrix of CRi in Eq. 2 is replaced by the value-added factor matrix Vi, which refers to the value-added per unit of the gross output. Accordingly, we could obtain a global value-added flow matrix
where
3.2 Measurement of digital value chain embeddedness
Based on where goods are consumed, the direct consumption coefficient matrix (A) could be divided into
With reference to the study by Ma et al. (2023), by using superscript to separate the digital (d) sectors from the non-digital (n) sectors of an economy, the domestic direct consumption coefficient matrix was given as
According to the nature of the sector that is digital or non-digital, domestic value added by country i could be divided into digital domestic value added (
(1) the digital value added by final goods to meet domestic demands (VA1)
The direct VA1 (
(2) The digital value added by exports of final goods (VA2)
The direct VA2 (
(3) The digital value added that returns to the domestic country (VA3)
The direct VA3 (
(4) The digital value added that meets the foreign market demand (VA4)
The direct VA4 (
In a similar way, the value added from the non-digital sector in country i could also be categorized into eight parts, denoted as
In light of the connotation of digital economy, and the availability of related data, this study referred to the study by Lyu et al. (2020) about digital economy sector classification. The digital economy was categorized into three parts: digital infrastructure, digital media, and digital trading; the details are shown in Table 1.
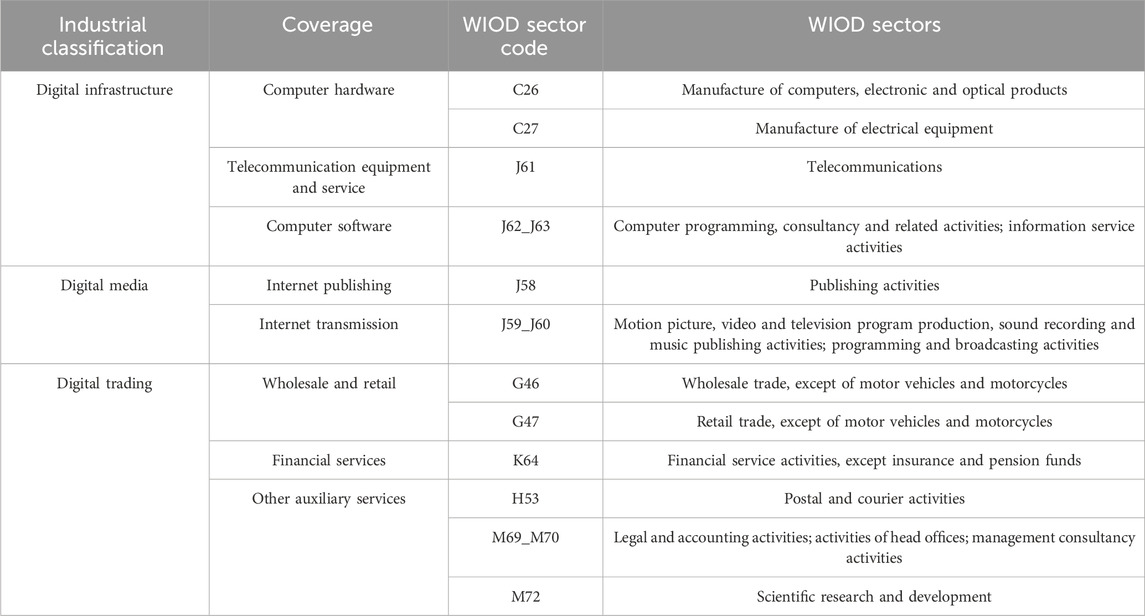
TABLE 1. Digital economy sectors of the WIOD.
4 Empirical design
4.1 Model setting
As illustrated above, there is no specific functional relationship between digital value chain embeddedness and carbon emissions intensity. If a parameter estimation method is applied, a prior parameter model needs to be determined. Thus, the parameter method is very sensitive to the selected model, which may lead to the misspecification of the problem (Li and Wang, 2019; Du et al., 2020). In this regard, the non-parametric method has attracted increasing attention due to its flexibility and accuracy, and its specific functional form does not need to be determined in advance. However, it should be noted that this highly data-dependent method easily leads to an overfitting phenomenon, which, in particular, incurs the issue of the “curse of dimensionality” (Li and Racine, 2006).
In view of this, we selected the semi-parametric model to analyze the non-linear effects. As both linear parameter and non-parametric components are included in the model, it can improve the explanatory power of the model and effectively overcome the drawbacks of overfitting (Härdle et al., 1998). The most commonly used semi-parametric models are semi-parametric partially linear models, which have some additional advantages (Li and Liang, 2015): First, they allow for a more flexible model that can adapt to different types of data and relationships. Second, they offer a wider range of link functions and analytical forms compared with traditional parametric or non-parametric models. Third, the smoothing parameters can be estimated using generalized cross-validation techniques, which is a robust method for parameter estimation.
This study constructed the following semi-parametric partial linear model to test the impacts of digital value chain embeddedness on carbon emissions intensity:
where
Using a p*1 vector of base functions
Referring to the research by Du et al. (2020), we employed a B-spline method to approximate the unknown functions, as well as apply the least-squares cross-validation to determine the number of knots.
By rearranging Eq. 21, we obtained:
where
Taking the first-time difference of Eq. 23 to eliminate the fixed effects, we then obtained:
Applying the least square estimator to estimate Eq. 24, we defined:
Estimate the functional coefficients as follows:
On the basis of the benchmark model, the mechanisms through which digital value chain embeddedness can affect trade-related carbon emissions intensity need to be further explored. Among the factors influencing carbon emissions intensity, the facility of advanced green knowledge and technology being transferred through international trade is essential for promoting cleaner production (Lee et al., 2022). In addition, the rise of tertiary industry may explain the decoupling of economic growth and carbon emissions (Xie et al., 2024). Additionally, trade scale is usually regarded as an indirect factor in explaining the variations in a country’s carbon emissions (Liu et al., 2020).
Based on the analyses, we build the following model to investigate the terms of trade effect, structural effect, and export trade scale effect:
where
4.2 Variables
The explained variable is the carbon intensity indicator (
With reference to the studies by Du et al. (2020) and He and Xie (2022), the control variables in this study were: (1) the forest area proportion (denoted as forest), which was used to reflect the impact of forest resources; (2) income level (denoted as lnpgdp), which was represented by the real GDP per capita, and take log of it; (3) the renewable energy share (denoted as renewable), which represented the energy consumption structure to some extent; (4) trade openness (denoted as open), which was calculated by adding up the exports of goods and services (percentage of GDP) and imports of goods and services (percentage of GDP); (5) urbanization level (denoted as urban), which was measured by 1 minus the ratio of the rural population to the total population; (6) research and development intensity (denoted as r&d), which was the ratio of research and development expenditure to GDP, which was used to manifest the roles of technological innovation; (7) financial development (denoted as financial), which was measured by the market capitalization of listed domestic companies (percentage of GDP); and (8) industrial development (denoted as industrial), which was proxied by the proportion of industrial added value in the GDP.
4.3 Data source and descriptive statistics
This study used balanced panel data for 41 countries (or regions) spanning from 2000 to 2014, excluding the Netherlands, Taiwan, and the rest of the world due to the lack of available and consistent data. The input-output data used for calculating digital value chain embeddedness were obtained from the World Input-Output Database (WIOD), the original data for CO2 emissions were obtained from the Environmental Accounts published by the WIOD in 2016, and data on control variables was obtained from World Development Indicators (WDI). Descriptive statistics for major variables are illustrated in Table 2.
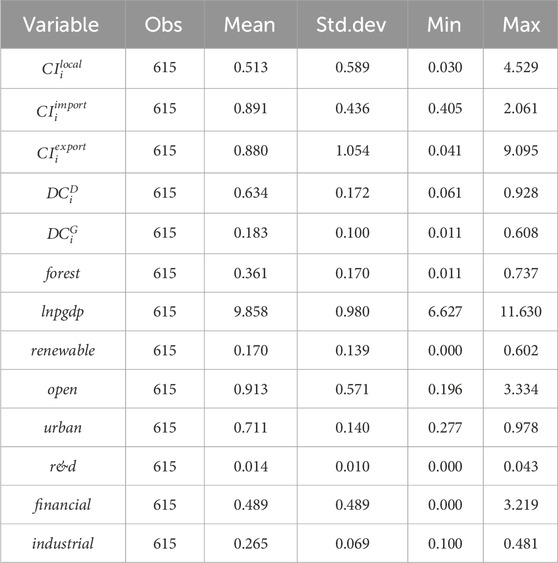
TABLE 2. Descriptive statistics of major variables.
5 Results and discussion
5.1 Overview of CO2 emissions in global value chains
The CO2 emissions embodied in the total global intermediate goods trade and global final goods trade over the period 2000–2014 are shown in Figure 1, 2, respectively. There is a higher growth rate of CO2 emissions embodied in global intermediate goods trade than that embodied in global final goods trade. It reveals a slight decrease in CO2 emissions embodied in the global intermediate goods trade in 2009 because of the economic crisis, which conforms with the findings of Fan et al. (2021). Meanwhile, for both the global intermediate goods trade and final goods trade, the carbon embodied in international trade is far larger than that in domestic trade. The findings indicate that world economic development and trade networks are closely related to CO2 emissions. In the long term, CO2 emissions embodied in global trade still shows an upward trend. Thus, putting more emphasis on decreasing carbon intensity is a more important concern.
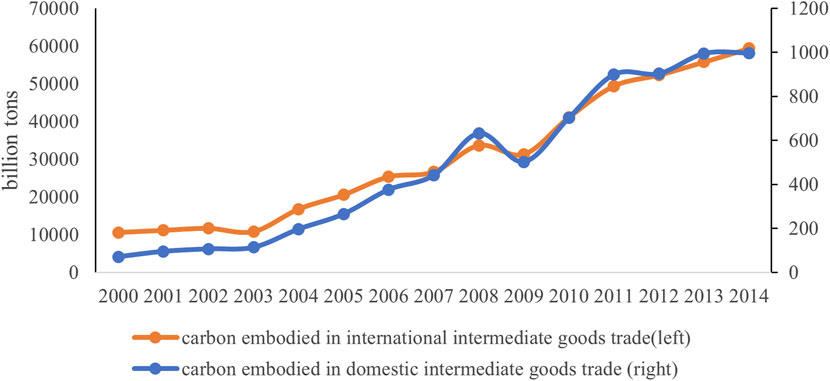
FIGURE 1. CO2 emissions of global intermediate goods trade from 2000 to 2014.
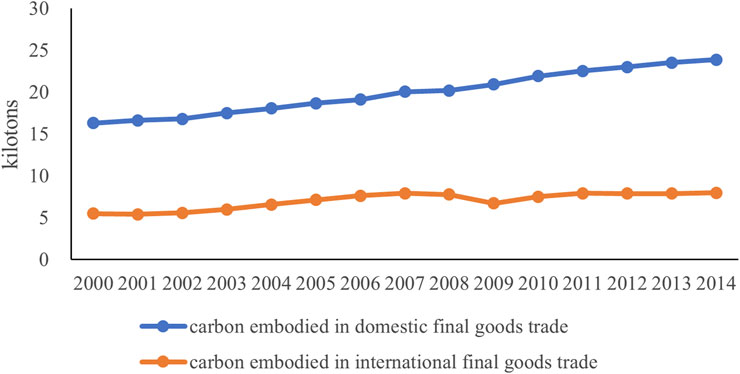
FIGURE 2. CO2 emissions of global final goods trade from 2000 to 2014.
Figure 3 shows a comparison among carbon intensities that are related to the domestic trade, import trade, and export trade of the sample countries. In this study, we extend the time range to 2014. Compared with the research by Fan et al. (2021), this study shows that for most developed countries, the carbon intensity embodied in import trade is higher than that in export trade, and is higher still than that in domestic trade; Australia (AUS) is not an exception. In addition, for some transitional economies, such as Russia (RUS), India (IND), Bulgaria (BGR), and China (CHN), the carbon intensity of their export trade is considerably higher than the average of the sample. Based on the findings, there are significant differences in the three types of carbon intensity, not only within a country but also from the perspective of countries with different levels of economic development. Additionally, the findings signify that developing countries have experienced higher negative externalities from export trade than developed countries; this revelation is consistent with the research by Dorninger et al. (2021). As a result, developing countries are under greater pressure to reduce carbon emissions intensity.
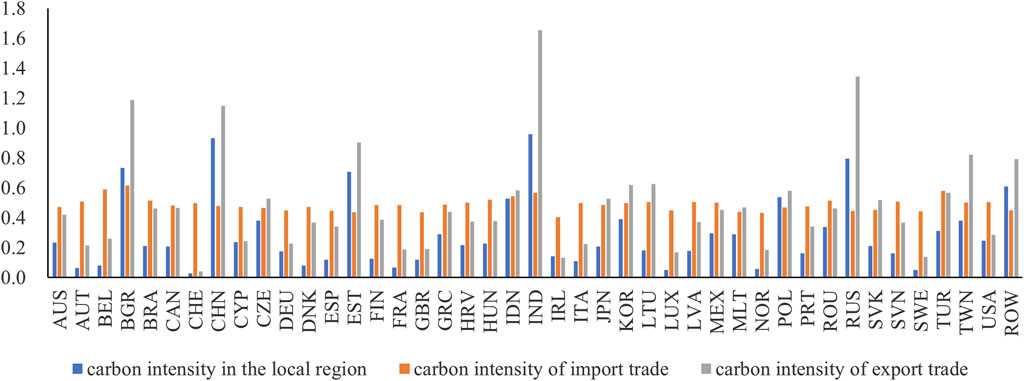
FIGURE 3. Carbon intensities of sample economies in 2014.
5.2 Benchmark analysis of digital value chain embeddedness on carbon emissions intensity
The estimation results with

TABLE 3. Estimation results of the partially linear functional-coefficient panel model.

FIGURE 4. Marginal effect of DCd on local CI.
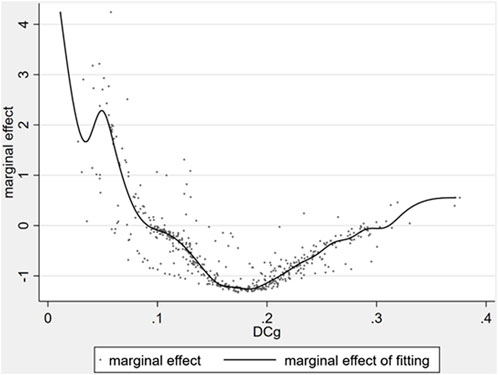
FIGURE 5. Marginal effect of DCg on import CI.

FIGURE 6. Marginal effect of DCg on export CI.
The possible explanations for the non-linear relationship between different types of digital value chain embeddedness and the carbon emissions intensity may be that, on the one hand, the process of digital value chain embedding is accompanied by the continuous integration of digital technology and conventional industries. However, the cultivation of digital ability is not synchronized, and it requires vast amounts of upfront investment. From a dynamic process perspective, adaptive capacity is built on the basis of the improvement of data analysis, data operation, and data empowerment (Yang et al., 2023). Therefore, there is a transitional period of digital transformation. It is necessary to cross the first threshold of digital value chain embeddedness; then, the benefits of digitally empowering low-carbon development can be exploited significantly. On the other hand, under the condition that some experience has been accumulated during the digital transformation, and the synergy between digital technology and other input factors in the economic system is strengthened, digitalization can improve the input-output efficiency of an economy and obtain environmental benefits.
Comparing the thresholds of digital value chain embeddedness as for the trade types of export trade, import trade and domestic trade, i.e., 0.03 < 0.1 < 0.88. For digital GVC embeddedness, as a large amount of cross-border trade of intermediate goods accelerates the spillover and diffusion of digital technology, the impacts on reducing carbon emissions intensity are manifested. In addition, it should be noted that the continuous increase in the degree of digital GVC embeddedness will eventually follow the law of diminishing marginal effect. With the bottlenecks of digital technology upgrading and industrial structure optimization, when the digital GVC embeddedness surpasses the second threshold, the environmental burden will be aggravated if the complexity of the economic system is high.
5.3 Further analysis concerning differences in economic development
Considering the possible digital divide between economies at different stages of economic development, this study divides the sample into high-income economies (ECON = 1) and middle- and low-income economies (ECON = 0) according to the World Bank’s classification. The economies in the ECON = 0 group in this sample are mostly developing countries. The estimation results are shown in Table 4, and the estimation of the marginal effect of each core explanatory variable is shown in Figures 7–9. The results show that in different subsamples, there is a non-linear relationship between digital value chain embeddedness and carbon emissions intensity. When comparing the thresholds of digital value chain embeddedness in different sample groups, the thresholds of high-income economies are lower than those of middle- and low-income economies, indicating that high-income economies take precedence over middle- and low-income economies in terms of obtaining environmental benefits, which verifies H2. When many high-income economies have been at the stage of reducing carbon emissions intensity through digitalization, most middle- and low-income economies still bear the pressure of increasing environmental pollution, which is in conformity with the findings of Huang and Zhang (2023). The reason for this is that high-income economies have the first-mover advantage in the development of digital technology and are motivated to implement trade restrictions to hinder the spillover of core digital technology, which slows down the pace of green and low-carbon development in middle- and low-income economies.
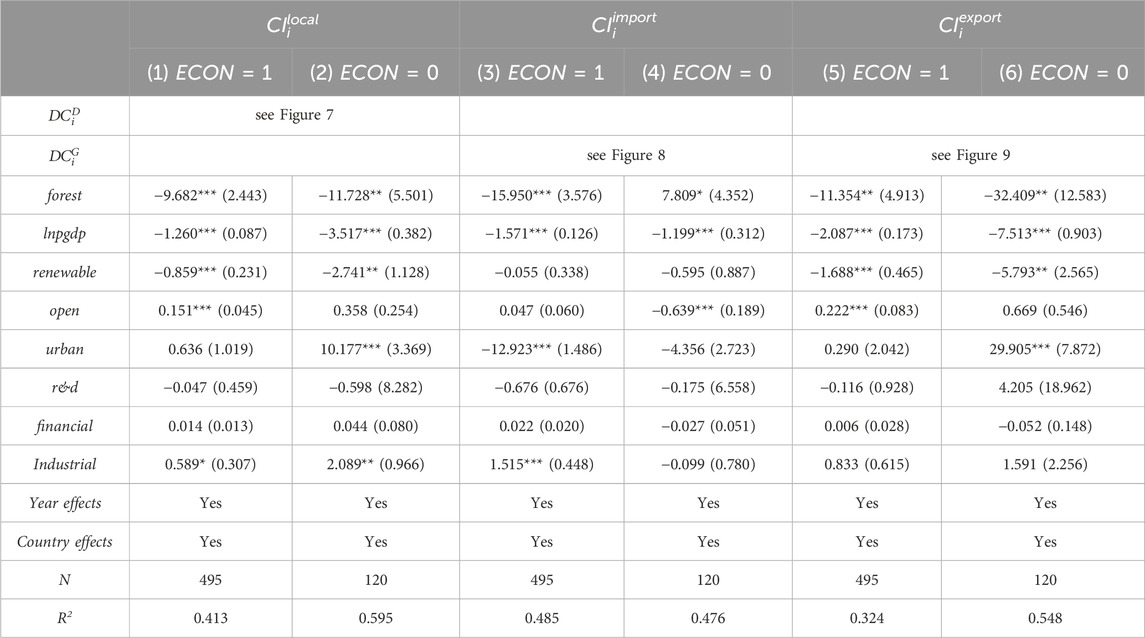
TABLE 4. Estimation results concerning differences in economic development.

FIGURE 7. Marginal effect of DCg on local CI based on economic development.
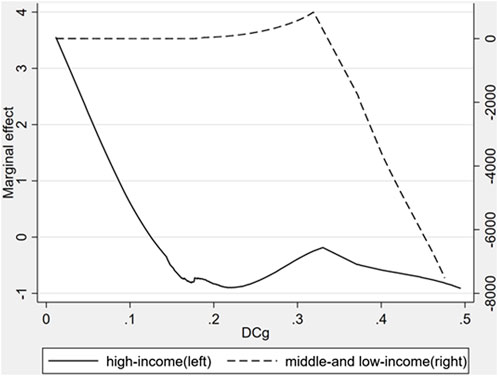
FIGURE 8. Marginal effect of DCg on import CI based on economic development.
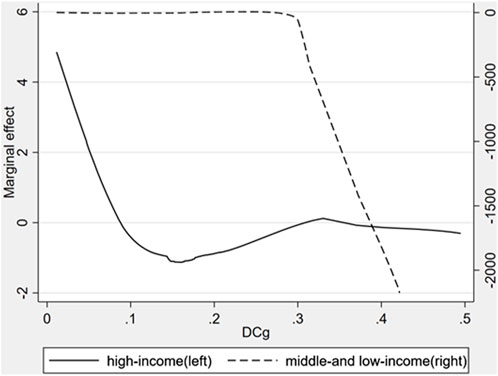
FIGURE 9. Marginal effect of DCg on export CI based on economic development.
5.4 Heterogeneity analysis
5.4.1 Heterogeneity analysis based on the terms of trade
Among the indicators that can reflect the convenience of trade, compared with the trade openness index or transaction costs indicator of international trade (Bogmans, 2015; Murshed, 2020), this study innovatively selects the net barter terms of the trade index released by the World Bank WDI database to reflect the terms of trade (FC). The index represents the number of imported products that can be obtained by exporting one unit product, where an FC of 100 in the year 2000 is used as the benchmark value. The higher the index value, the more advantageous it is for international trade. This study takes the logarithm and includes it in the empirical model in the form of an interaction term. The empirical results are shown in Table 5. The coefficient of the interaction term is significantly negative in the types of carbon intensity embodied in domestic trade and export trade. It indicates that optimizing terms of trade and reducing trade barriers are conducive to promoting digital value chain embeddedness and improving environmental quality. This may be due to a close communication of digital technology through trade activities, which is very important for improving green production capacity. Comparatively, the interaction coefficient in column (2) of Table 5 is not significant, which reveals that the net barter terms of the trade index focus on the measurement from the perspective of exports; therefore, it is unlikely to have a significant impact on the carbon intensity embodied in import trade.
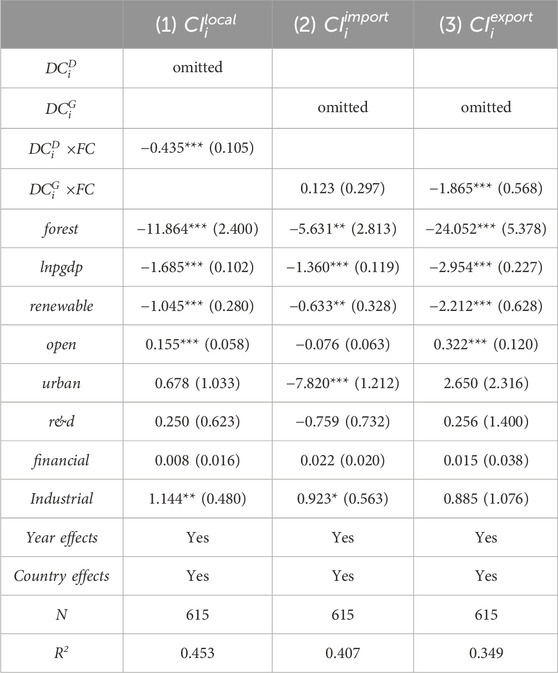
TABLE 5. Heterogeneity test results based on the terms of trade.
5.4.2 Heterogeneity analysis based on structural effects
Concerning the industrial upgrading process which increases the supply of low-energy consuming products, the transformation promotes the need of skilled labor with environmental awareness and the ability to reduce existing carbon emissions (Mahmood et al., 2019). To further test the role of the structural effect in the process of digital value chain embedding, this study takes the ratio of tertiary industry output to GDP as the index of structural effect (ST), and includes it in the model in the form of an interaction term. The empirical results are shown in Table 6. The interaction coefficient is negative in the three types of carbon intensity, and it is significant in the type of carbon intensity embodied in domestic trade. This is because as the energy consumption of the tertiary industry is significantly lower than that of the secondary industry, which represents the main direction of industrial upgrading, the higher the ratio of the tertiary industry output to GDP, resulting in the optimization of the energy structure. The empirical results reveal that adjusting energy structure is an important mechanism for an economy utilizing digital value chain embeddedness to achieve environmental improvement.
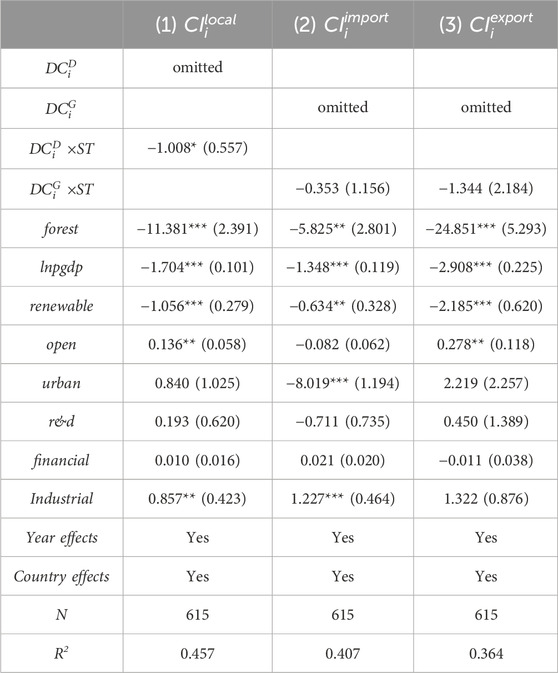
TABLE 6. Heterogeneity test results based on structural effects.
5.4.3 Heterogeneity analysis based on the scale effect
According to the study by Yan et al. (2023), the export scale effect is an important mechanism affecting trade-embodied carbon emissions. With the purpose of examining the scale effect, this study uses the actual value of a country’s total exports to reflect the scale effect (SC) and includes it in the benchmark model in the form of an interaction term. The empirical results are shown in Table 7. The interaction coefficient is significantly negative in the types of carbon intensity embodied in domestic trade and import trade. In addition, it is negative in the type of carbon intensity embodied in export trade, revealing that the scale effect is also the mechanism of the green and low-carbon development of digital empowerment. The existing research applying the absolute amount of carbon emissions embodied in trade generally holds that the scale effect is a main mechanism for environmental degradation. From the perspective of carbon intensity, this study confirms that promoting economic growth and improving carbon emission reduction capacity can go hand in hand. By reducing carbon intensity, it is beneficial to balance the dual pressures between a country’s economic slowdown and total carbon emissions.
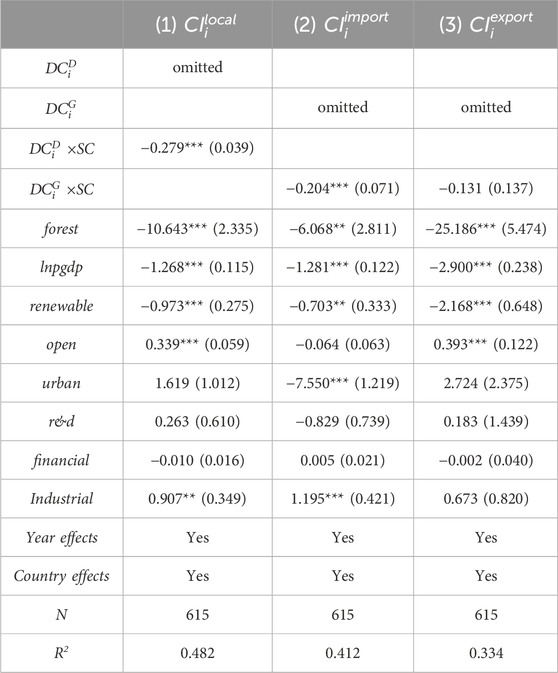
TABLE 7. Heterogeneity test results based on scale effects.
5.5 Discussion
In this study, we focused on measuring digital value chain embeddedness, as well as discussing the impacts of different types of digital value chain embedding on trade-related carbon emissions intensity. Previous studies have investigated the relationship between digital progress and environmental performance, GVCs and carbon emissions embodied in trade, and digitalization and GVCs. However, studies concerning the three aspects are rare and limited to the absolute carbon emissions indicator, neglecting the value-added dimension of trade activities. By unifying digital value chain embeddedness and carbon emissions intensity, it is recognized that in the early stage of digital domestic value chain embeddedness, the marginal effect on carbon emissions intensity is positive. When it is larger than a certain level, the impact is reversed. This is generally consistent with the findings of Wang et al. (2021) and Ma et al. (2023), indicating that the carbon emission effect appears until the tipping point of digitalization is reached.
The new finding in this study is that compared with the single threshold associated with digital domestic value chain embeddedness, we have discovered two thresholds in the case of digital GVC embeddedness. The explanation may be that as digitalization is in the high range, a country’s corresponding absorptive capacity is not synchronized with digital technological development, resulting in the aggravation of pollution (Huang et al., 2022). In the era of the knowledge-based economy, soft power, especially human capital, plays a very influential role in providing innovation impetus (Haini, 2018). Thus, strengthening the awareness of environmental protection is closely related to the cultivation of high-quality human capital.
This study also explores the heterogeneous impacts of digital value chain embeddedness on carbon emissions intensity in countries of different economic development, which reveals new empirical proof for the digital divide between developed and developing countries. In reality, developed countries take the initiative in utilizing digital technologies. With the purpose of maintaining the dominant position in GVC embedding, they usually control the outflow of high-tech products or services, which poses a greater environmental pressure from the global perspective. In this regard, developing countries have to cultivate their own digital innovation ability (Yang et al., 2023) and strive to get rid of the digital technology barriers in the long term.
6 Conclusion
Based on the panel data of 41 countries and regions from 2000 to 2014, this study investigated the non-linear impacts of digital value chain embeddedness on trade-related carbon emissions intensity. The empirical results show that: (1) the impact of digital domestic value chain embeddedness on carbon intensity embodied in domestic trade is an inverted U-shape. The integration of digital technology and conventional industries requires a transitional period. As the digital domestic value chain embeddedness crosses the threshold, which is approximately 0.88, it can promote the green and low-carbon development of the economy. (2) Digital GVC embeddedness has a non-linear effect on carbon intensity embodied in import and export trade, which first rises in a deceleration, then falls, and finally rises after the inflection point. Although participating in GVCs can strengthen the spillover and diffusion of digital technology, when digital GVC embeddedness is higher than the second threshold, it is also necessary to be alert to the bottlenecks encountered in the re-upgrading of technology. (3) The impacts of digital value chain embeddedness on carbon emissions intensity are closely related to economic development levels. Developed countries still dominate in digital value chain embeddedness, and developing countries lag behind developed countries in the environmental benefits of digital technology utilization. (4) Optimizing the terms of trade, adjusting the energy structure, and increasing the scale of trade are conducive to promoting the environmental benefits of digital empowerment. When there is an economic slowdown and energy consumption pressure, making more efforts to reduce carbon intensity is an important starting point for a country attempting to achieve sustainable economic development.
The findings of this study contain crucial policy recommendations. To improve energy efficiency and promote economic growth, it is essential to implement incentive measures to fully utilize digital technology. At the moment, the digital divide between developed economies and developing economies hinders the spread of new energy technology via digital spillover effects. As participating in GVCs provides opportunities for learning through trade, especially for the main carbon-emitting countries, overcoming the shortcomings in digital technology and strengthening cross-border cooperation in R&D can help achieve sustainable development. In addition, instead of focusing exclusively on digital value chain embedding, developing economies should pay much more attention to nurturing and refining the technology absorptive capacity of conventional industries. Although the digital transformation process might take a long time, it can be regarded as a long-term environmentally friendly investment, which is beneficial for cultivating the ability to develop independently. Furthermore, accelerating domestic digital R&D is fundamental for improving a country’s GVC competitiveness when economic development surpasses a certain stage. Additionally, it has been suggested that energy efficiency can be boosted by promoting scale effects and the learning mechanism to the utmost extent.
Owing to data availability, this study only covers a time span from 2000 to 2014. Future research might discover more countries over a longer period. Moreover, contrasting more industrialized categorizations in depth is also an extension research project.
Data availability statement
The raw data supporting the conclusion of this article will be made available by the authors, without undue reservation.
Author contributions
YL: Conceptualization, Funding acquisition, Project administration, Validation, Visualization, Writing–review and editing. YX: Methodology, Resources, Software, Writing–original draft. DW: Conceptualization, Data curation, Formal Analysis, Investigation, Methodology, Writing–review and editing.
Funding
The author(s) declare financial support was received for the research, authorship, and/or publication of this article. This study was supported by the Fujian Province Innovation Strategy Research Joint Project (2022R0153).
Conflict of interest
The authors declare that the research was conducted in the absence of any commercial or financial relationships that could be construed as a potential conflict of interest.
Publisher’s note
All claims expressed in this article are solely those of the authors and do not necessarily represent those of their affiliated organizations, or those of the publisher, the editors and the reviewers. Any product that may be evaluated in this article, or claim that may be made by its manufacturer, is not guaranteed or endorsed by the publisher.
References
Amri, F., Ben Zaied, Y., and Ben Lahouel, B. (2019). ICT, total factor productivity, and carbon dioxide emissions in Tunisia. Technol. Forecast. Soc. Change 146, 212–217. doi:10.1016/j.techfore.2019.05.028
Antràs, P., and Gortari, A. (2020). On the geography of global value chains. Econometrica 88, 1553–1598. doi:10.3982/ECTA15362
Antweiler, W., Copeland, B., and Taylor, M. S. (2001). Is free trade good for the environment? Am. Econ. Rev. 91, 877–908. doi:10.1257/aer.91.4.877
Azam, A., Rafiq, M., Shafique, M., and Yuan, J. H. (2021). An empirical analysis of the non-linear effects of natural gas, nuclear energy, renewable energy and ICT-Trade in leading CO2 emitter countries: policy towards CO2 mitigation and economic sustainability. J. Environ. Manag. 286, 112232. doi:10.1016/j.jenvman.2021.112232
Bai, L., Guo, T. R., Xu, W., Liu, Y. B., Kuang, M., and Jiang, L. (2023). Effects of digital economy on carbon emission intensity in Chinese cities: a life-cycle theory and the application of non-linear spatial panel smooth transition threshold model. Energy Policy 183, 113792. doi:10.1016/j.enpol.2023.113792
Baldwin, R., and Venables, A. J. (2013). Spiders and snakes: offshoring and agglomeration in the global economy. J. Int. Econ. 90 (2), 245–254. doi:10.1016/j.jinteco.2013.02.005
Banga, K. (2022). Digital technologies and product upgrading in global value chains: empirical evidence from Indian manufacturing firms. Eur. J. Dev. Res. 34, 77–102. doi:10.1057/s41287-020-00357-x
Bastida, L., Cohen, J. J., Kollmann, A., Moya, A., and Reichl, J. (2019). Exploring the role of ICT on household behavioural energy efficiency to mitigate global warming. Renew. Sustain. Energy Rev. 103, 455–462. doi:10.1016/j.rser.2019.01.004
Bekaroo, G., Bokhoree, C., and Pattinson, C. (2016). Impacts of ICT on the natural ecosystem: a grassroot analysis for promoting socio-environmental sustainability. Renew. Sustain. Energy Rev. 57, 1580–1595. doi:10.1016/j.rser.2015.12.147
Bieser, J., and Hilty, L. M. (2020). Conceptualizing the impact of information and communication technology on individual time and energy use. Telematics Inf. 49, 101375. doi:10.1016/j.tele.2020.101375
Blazquez, L., Diaz-Mora, C., and Gonzalez-Diaz, B. (2022). Slowbalisation or a "New" type of GVC participation? The role of digital ser-vices. J. Industrial Bus. Econ. 50, 121–147. doi:10.1007/s40812-022-00245-x
Blazquez, L., Diaz-Mora, C., and Gonzalez-Diaz, B. (2023). Understanding digital services in GVCs: an extended gravity model through the lens of network analysis. World Econ. 46 (9), 2598–2623. doi:10.1111/twec.13454
Bogmans, C. (2015). Can the terms of trade externality outweigh free-riding? The role of vertical linkages. J. Int. Econ. 95 (1), 115–128. doi:10.1016/j.jinteco.2014.10.006
Chen, H. X., Zhang, C. X., and Yin, K. D. (2022). The impact of global value chain embedding on carbon emissions embodied in China's exports. Front. Environ. Sci. 10, 950869. doi:10.3389/fenvs.2022.950869
Copeland, B. R., and Taylor, M. S. (1994). North-South trade and the environment. Q. J. Econ. 109, 755–787. doi:10.2307/2118421
Danish, S. (2019). Effects of information and communication technology and real income on CO2 emissions: the experience of countries along Belt and Road. Telematics Inf. 45, 101300. doi:10.1016/j.tele.2019.101300
Danish, S., Zhang, J. W., Wang, B., and Latif, Z. (2019). Towards cross-regional sustainable development: the nexus between information and communication technology, energy consumption, and CO2 emissions. Sustain. Dev. 27 (5), 990–1000. doi:10.1002/sd.2000
Dolter, B., and Victor, P. A. (2016). Casting a long shadow: demand-based accounting of Canada’s greenhouse gas emissions responsibility. Ecol. Econ. 127, 156–164. doi:10.1016/j.ecolecon.2016.04.013
Dorninger, C., Hornborg, A., Abson, D. J., von Wehrden, H., Schaffartzik, A., Giljum, S., et al. (2021). Global patterns of ecologically unequal exchange: implications for sustainability in the 21st century. Ecol. Econ. 179, 106824. doi:10.1016/j.ecolecon.2020.106824
Du, K. R., Yu, Y., and Li, J. (2020). Does international trade promote CO2 emission performance? An empirical analysis based on a partially linear functional-coefficient panel data model. Energy Econ. 92, 104983. doi:10.1016/j.eneco.2020.104983
Fan, J. L., Zhang, X., Wang, J. D., and Wang, Q. (2021). Measuring the impacts of international trade on carbon emissions intensity: a global value chain perspective. Emerg. Mark. Finance Trade 57, 972–988. doi:10.1080/1540496X.2019.1662783
Galvin, R. (2015). The ICT/electronics question: structural change and the rebound effect. Ecol. Econ. 120, 23–31. doi:10.1016/j.ecolecon.2015.08.020
Gouvea, R., Kapelianis, D., and Kassicieh, S. (2020). Assessing the nexus of sustainability and information & communications technology. Technol. Forecast. Soc. Change 130, 39–44. doi:10.1016/j.techfore.2017.07.023
Grossman, G. M., and Rossi-Hansberg, E. (2008). Trading tasks: a simple theory of offshoring. Am. Econ. Rev. 98 (5), 1978–1997. doi:10.1257/aer.98.5.1978
Haini, H. (2018). Examining the impact of ICT, human capital and carbon emissions: evidence from the ASEAN economies. Int. Econ. 166, 116–125. doi:10.1016/j.inteco.2021.03.003
Härdle, W., Mammen, E., and Müller, M. (1998). Testing parametric versus semiparametric modeling in generalized linear models. J. Am. Stat. Assoc. 93 (444), 1461–1474. doi:10.1080/01621459.1998.10473806
He, Y. X., and Xie, C. (2022). Measurement, decomposition and emission reduction effects of digital global value chains. J. Clean. Prod. 378, 134307. doi:10.1016/j.jclepro.2022.134307
Higon, D. A., Gholami, R., and Shirazi, F. (2017). ICT and environmental sustainability: a global perspective. Telematics Inf. 34 (4), 85–95. doi:10.1016/j.tele.2017.01.001
Huang, H. R., Zhang, Z. Y., and Jiang, F. X. (2022). Environmental effects of global value chain embedding in manufacturing industry in countries along the Belt and Road. Front. Environ. Sci. 10, 1039358. doi:10.3389/fenvs.2022.1039358
Huang, Y. M., and Zhang, Y. N. (2023). Digitalization, positioning in global value chain and carbon emissions embodied in exports: evidence from global manufacturing production-based emissions. Ecol. Econ. 205, 107674. doi:10.1016/j.ecolecon.2022.107674
Hummels, D., Ishii, J., and Yi, K. (2001). The nature and growth of vertical specialization in world trade. J. Int. Econ. 54 (1), 75–96. doi:10.1016/s0022-1996(00)00093-3
Jiborn, M., Kander, A., Kulionis, V., Nielsen, H., and Moran, D. D. (2018). Decoupling or delusion? Measuring emissions displacement in foreign trade. Glob. Environ. Change 49, 27–34. doi:10.1016/j.gloenvcha.2017.12.006
Jin, G., Guo, B. S., and Deng, X. Z. (2020). Is there a decoupling relationship between CO2 emission reduction and poverty alleviation in China? Technol. Forecast. Soc. Change 151, 119856. doi:10.1016/j.techfore.2019.119856
Jin, X., and Yu, W. H. (2022). Information and communication technology and carbon emissions in China: the rebound effect of energy intensive industry. Sustain. Prod. Consum. 32, 731–742. doi:10.1016/j.spc.2022.06.004
Jones, J. (2018). How to stop data centres from gobbling up the world’s electricity. Nature 561, 163–166. doi:10.1038/d41586-018-06610-y
Joyce, P. J., Finnveden, G., Hakansson, C., and Wood, R. (2019). A multi-impact analysis of changing ICT consumption patterns for Sweden and the EU: indirect rebound effects and evidence of decoupling. J. Clean. Prod. 211, 1154–1161. doi:10.1016/j.jclepro.2018.11.207
Lahouel, B. B., Taleb, L., Zaied, Y. B., and Managi, S. (2021). Does ICT change the relationship between total factor productivity and CO2 emissions? Evidence based on a nonlinear model. Energy Econ. 101, 105406. doi:10.1016/j.eneco.2021.105406
Lange, S., Pohl, J., and Santarius, T. (2020). Digitalization and energy consumption. Does ICT reduce energy demand? Ecol. Econ. 176, 106760. doi:10.1016/j.ecolecon.2020.106760
Lee, C. C., Yuan, Z. H., Lee, C. C., and Chang, Y. F. (2022). The impact of renewable energy technology innovation on energy poverty: does climate risk matter? Energy Econ. 116, 106427. doi:10.1016/j.eneco.2022.106427
Leontief, W. W. (1936). Quantitative input and output relations in the economic systems of the United States. Rev. Econ. Statistics 18 (3), 105–125. doi:10.2307/1927837
Li, C., and Liang, Z. (2015). Asymptotics for nonparametric and semiparametric fixed effects panel models. J. Econ. 185 (2), 420–434. doi:10.1016/j.jeconom.2014.12.004
Li, Q., and Racine, J. S. (2006). Nonparametric econometrics: theory and practice. Princeton, New Jersey: Princeton University Press.
Li, Q. P., Wu, S. M., and Li, S. T. (2022). Weighing China's embodied CO2 emissions and value added under global value chains: trends, characteristics, and paths. J. Environ. Manag. 316, 115302. doi:10.1016/j.jenvman.2022.115302
Li, S., and Wang, S. J. (2019). Examining the effects of socioeconomic development on China's carbon productivity: a panel data analysis. Sci. Total Environ. 659, 681–690. doi:10.1016/j.scitotenv.2018.12.409
Li, X. P., Yu, Y., Shi, X. P., and Hu, X. (2021). Tracking the domestic carbon emission intensity of China's construction industry: a global value chain perspective. Front. Environ. Sci. 9, 728787. doi:10.3389/fenvs.2021.728787
Li, Z. G., and Wang, J. (2022). The dynamic impact of digital economy on carbon emission reduction: evidence city-level empirical data in China. J. Clean. Prod. 351, 131570. doi:10.1016/j.jclepro.2022.131570
Liddle, B. (2018). Consumption-based accounting and the trade-carbon emissions nexus. Energy Econ. 69, 71–78. doi:10.1016/j.eneco.2017.11.004
Lin, B. Q., and Huang, C. C. (2023). Nonlinear relationship between digitization and energy efficiency: evidence from transnational panel data. Energy 276, 127601. doi:10.1016/j.energy.2023.127601
Lin, B. Q., and Zhou, Y. C. (2021). Does the Internet development affect energy and carbon emission performance? Sustain. Prod. Consum. 28, 1–10. doi:10.1016/j.spc.2021.03.016
Lin, B. Q., and Zhu, P. H. (2021). Measurement of the direct rebound effect of residential electricity consumption: an empirical study based on the China family panel studies. Appl. Energy 301, 117409. doi:10.1016/j.apenergy.2021.117409
Liu, H. Z., Zong, Z., Hynes, K., and De Bruyne, K. (2020). Can China reduce the carbon emissions of its manufacturing exports by moving up the global value chain? Res. Int. Bus. Finance 51, 101101. doi:10.1016/j.ribaf.2019.101101
Liu, Y., Jayanthakumaran, K., and Neri, F. (2013). Who is responsible for the CO2 emissions that China produces? Energy Policy 62, 1412–1419. doi:10.1016/j.enpol.2013.08.017
Lyu, Y. F., Fang, R. N., and Wang, D. (2020). Measurement and characteristics of the integration of China’s trade in services into digital global value chain (in Chinese). J. Quantitative Tech. Econ. 37, 25–44. doi:10.13653/j.cnki.jqte.2020.12.002
Ma, D., Tang, J. Q., and Jiang, X. M. (2023). Effects of digital global value chain participation on CO2 emissions embodied in digital exports: new evidence from PSTR approach. Energy Econ. 126, 106913. doi:10.1016/j.eneco.2023.106913
Mahmood, N., Wang, Z., and Hassan, S. T. (2019). Renewable energy, economic growth, human capital, and CO2 emission: an empirical analysis. Environ. Sci. Pollut. Res. 26 (20), 20619–20630. doi:10.1007/s11356-019-05387-5
Meng, B., Peters, G. P., Wang, Z., and Li, M. (2018). Tracing CO2 emissions in global value chains. Energy Econ. 73, 24–42. doi:10.1016/j.eneco.2018.05.013
Morley, J., Widdicks, K., and Hazas, M. (2018). Digitalisation, energy and data demand: the impact of Internet traffic on overall and peak electricity consumption. Energy Res. Soc. Sci. 38, 128–137. doi:10.1016/j.erss.2018.01.018
Moyer, J. D., and Hughes, B. B. (2012). ICTs: do they contribute to increased carbon emissions? Technol. Forecast. Soc. Change 79 (5), 919–931. doi:10.1016/j.techfore.2011.12.005
Murshed, M. (2020). An empirical analysis of the non-linear impacts of ICT-trade openness on renewable energy transition, energy efficiency, clean cooking fuel access and environmental sustainability in South Asia. Environ. Sci. Pollut. Res. 27 (29), 36254–36281. doi:10.1007/s11356-020-09497-3
Nguyen, T. T., Pham, T. A. T., and Tram, H. T. X. (2020). Role of information and communication technologies and innovation in driving carbon emissions and economic growth in selected G-20 countries. J. Environ. Manag. 261, 110162. doi:10.1016/j.jenvman.2020.110162
Niebel, T. (2018). ICT and economic growth – comparing developing, emerging and developed countries. World Dev. 104, 197–211. doi:10.1016/j.worlddev.2017.11.024
Ollo-López, A., and Aramendía-Muneta, M. E. (2012). ICT impact on competitiveness, innovation and environment. Telematics Inf. 29 (2), 204–210. doi:10.1016/j.tele.2011.08.002
Peng, H. R., Zhang, Y. J., and Liu, J. Y. (2023). The energy rebound effect of digital development: evidence from 285 cities in China. Energy 270, 126837. doi:10.1016/j.energy.2023.126837
Peng, X. (2020). Strategic interaction of environmental regulation and green productivity growth in China: green innovation or pollution refuge? Sci. Total Environ. 732, 139200. doi:10.1016/j.scitotenv.2020.139200
Peters, G. P., Minx, J. C., Weber, C. L., and Edenhofer, O. (2011). Growth in emission transfers via international trade from 1990 to 2008. Proc. Natl. Acad. Sci. U. S. A. 108 (21), 8903–8908. doi:10.1073/pnas.1006388108
Pothen, F. (2017). A structural decomposition of global Raw Material Consumption. Ecol. Econ. 141, 154–165. doi:10.1016/j.ecolecon.2017.05.032
Qayyum, M., Yu, Y. Y., and Li, S. J. (2021). The impact of economic complexity on embodied carbon emission in trade: new empirical evidence from cross-country panel data. Environ. Sci. Pollut. Res. 28 (38), 54015–54029. doi:10.1007/s11356-021-14414-3
Rao, K. U., and Kishore, V. V. N. (2010). A review of technology diffusion models with special reference to renewable energy technologies. Renew. Sustain. Energy Rev. 14 (3), 1070–1078. doi:10.1016/j.rser.2009.11.007
Ren, S. Y., Hao, Y., Xu, L., Wu, H. T., and Ba, N. (2021). Digitalization and energy: how does internet development affect China's energy consumption? Energy Econ. 98, 105220. doi:10.1016/j.eneco.2021.105220
Shi, Q. L., Zhao, Y. H., Qian, Z. L., Zheng, L., and Wang, S. (2022). Global value chains participation and carbon emissions: evidence from Belt and Road countries. Appl. Energy 310, 118505. doi:10.1016/j.apenergy.2021.118505
Su, B., Huang, H. C., Ang, B. W., and Zhou, P. (2010). Input–output analysis of CO2 emissions embodied in trade: the effects of sector aggregation. Energy Econ. 32 (1), 166–175. doi:10.1016/j.eneco.2009.07.010
Sun, H. P., Edziah, B. K., Sun, C. W., and Kporsu, A. K. (2019). Institutional quality, green innovation and energy efficiency. Energy Policy 135, 111002. doi:10.1016/j.enpol.2019.111002
Szalavetz, A. (2019). Digitalisation, automation and upgrading in global value chains-factory economy actors versus lead companies. Post-Communist Econ. 31 (5), 646–670. doi:10.1080/14631377.2019.1578584
Usman, A., Ozturk, I., Hassan, A., Zafar, S. M., and Ullah, S. (2021). The effect of ICT on energy consumption and economic growth in South Asian economies: an empirical analysis. Telematics Inf. 58, 101537. doi:10.1016/j.tele.2020.101537
van der Marel, E. (2021). Digital-based services globalization and multilateral trade cooperation. Glob. Policy 12 (3), 392–398. doi:10.1111/1758-5899.12941
Wang, S. H., He, Y. Q., and Song, M. L. (2021). Global value chains, technological progress, and environmental pollution: inequality towards developing countries. J. Environ. Manag. 277, 110999. doi:10.1016/j.jenvman.2020.110999
Wiedmann, T., and Lenzen, M. (2018). Environmental and social footprints of international trade. Nat. Geosci. 11, 314–321. doi:10.1038/s41561-018-0113-9
Xiao, H., Sun, K. J., Tu, X. W., Bi, H. M., and Wen, M. (2020). Diversified carbon intensity under global value chains: a measurement and decomposition analysis. J. Environ. Manag. 272, 111076. doi:10.1016/j.jenvman.2020.111076
Xie, B., Liu, R., and Dwivedi, R. (2024). Digital economy, structural deviation, and regional carbon emissions. J. Clean. Prod. 434, 139890. doi:10.1016/j.jclepro.2023.139890
Xing, Y. Q. (2018). Rising wages, yuan's appreciation and China's processing exports. China Econ. Rev. 48, 114–122. doi:10.1016/j.chieco.2017.04.002
Xu, M., Li, R., Crittenden, J. C., and Chen, Y. S. (2011). CO2 emissions embodied in China's exports from 2002 to 2008: a structural decomposition analysis. Energy Policy 39 (11), 7381–7388. doi:10.1016/j.enpol.2011.08.068
Xu, Q., Zhong, M. R., and Cao, M. Y. (2022). Does digital investment affect carbon efficiency? Spatial effect and mechanism discussion. Sci. Total Environ. 827, 154321. doi:10.1016/j.scitotenv.2022.154321
Yan, Y. F., Li, X. Y., Wang, R., and Pan, A. (2023). Global value chain and export-embodied carbon emissions: new evidence from foreign-invested enterprises. Econ. Model. 127, 106449. doi:10.1016/j.econmod.2023.106449
Yan, Y. F., Wang, R., Zheng, X. X., and Zhao, Z. X. (2020). Carbon endowment and trade-embodied carbon emissions in global value chains: evidence from China. Appl. Energy 277, 115592. doi:10.1016/j.apenergy.2020.115592
Yang, G. Q., Nie, Y. M., Li, H. G., and Wang, H. S. (2023). Digital transformation and low-carbon technology innovation in manufacturing firms: the mediating role of dynamic capabilities. Int. J. Prod. Econ. 263, 108969. doi:10.1016/j.ijpe.2023.108969
Zhang, T. D., Wei, L. X., and Liu, J. W. (2023). How China's digital technology development affects the environmental costs related to global value chains? Evidence from regional manufacturing sectors. Sci. Total Environ. 886, 163978. doi:10.1016/j.scitotenv.2023.163978
Zhang, Z. K., Zhu, K. F., and Hewings, G. J. D. (2017). A multi-regional input–output analysis of the pollution haven hypothesis from the perspective of global production fragmentation. Energy Econ. 64, 13–23. doi:10.1016/j.eneco.2017.03.007
Zheng, R., Wu, G., Cheng, Y., Liu, H., Wang, Y., and Wang, X. (2023). How does digitalization drive carbon emissions? The inverted U-shaped effect in China. Environ. Impact Assess. Rev. 102, 107203. doi:10.1016/j.eiar.2023.107203
Zhong, M. R., Cao, M. Y., and Zou, H. (2022). The carbon reduction effect of ICT: a perspective of factor substitution. Technol. Forecast. Soc. Change 181, 121754. doi:10.1016/j.techfore.2022.121754
Zhou, J., Li, P. G., Zhou, Y. H., Wang, B. C., Zang, J. Y., and Meng, L. (2018). Toward new-generation intelligent manufacturing. Engineering 4 (1), 11–20. doi:10.1016/j.eng.2018.01.002
Glossary
Keywords: CO2 emissions, global value chain, carbon intensity, digital embeddedness, panel model
Citation: Lyu Y, Xiang Y and Wang D (2024) The impacts of digital value chain embeddedness on trade-related carbon emissions intensity. Front. Environ. Sci. 11:1256544. doi: 10.3389/fenvs.2023.1256544
Received: 11 July 2023; Accepted: 15 December 2023;
Published: 08 January 2024.
Edited by:
Tsun Se Cheong, Hang Seng University of Hong Kong, ChinaReviewed by:
Yuting Dang, Tianjin University of Technology, ChinaGui Jin, China University of Geosciences Wuhan, China
Zhengyu Zhang, China University of Geosciences Wuhan, China, in collaboration with reviewer GJ
Copyright © 2024 Lyu, Xiang and Wang. This is an open-access article distributed under the terms of the Creative Commons Attribution License (CC BY). The use, distribution or reproduction in other forums is permitted, provided the original author(s) and the copyright owner(s) are credited and that the original publication in this journal is cited, in accordance with accepted academic practice. No use, distribution or reproduction is permitted which does not comply with these terms.
*Correspondence: Yanfang Lyu, eWFuZmFuZzkwMkBzaW5hLmNvbQ==; Dong Wang, d2FuZ3JpY2hhcmQ3MkBzaW5hLmNvbQ==