
94% of researchers rate our articles as excellent or good
Learn more about the work of our research integrity team to safeguard the quality of each article we publish.
Find out more
ORIGINAL RESEARCH article
Front. Environ. Sci., 18 September 2023
Sec. Environmental Informatics and Remote Sensing
Volume 11 - 2023 | https://doi.org/10.3389/fenvs.2023.1253932
This article is part of the Research TopicWomen in Environmental Informatics and Remote SensingView all 8 articles
 Giacomo Montereale Gavazzi1,2*
 Silvia Paoletti1*
 Pavlina Podholova1Danae-Athena Kapasakali1Francis Kerckhof1
Stony reefs are ecologically important, providing irreplaceable ecosystem services. These fragile environments are recognised as conservation priorities by all relevant global and European policies. Bottom-contacting fisheries are an important source of anthropogenic disturbance to the seafloor’s physical and ecological integrity having immediate and destructive consequences on stony reefs and compromising ecological functions. This study, aimed to assess the ecological status (community composition and functions) of two stony reef areas -Northwest and Hinder Banks study sites -in Belgian waters using multiple remote sensing tools. Insights on the study sites’ geomorphological context and fishing patterns were gained using echo-sounding and publicly available satellite data. Video-based benthic community data were assessed against the exposure to fishing pressure using a trait-based approach linked to the biotas’ resistance and recovery potential. In the Northwest study site, between 2019 and 2022 there was a significant decline in the abundance of benthic species classified with low resistance and recovery potential to trawling. Conversely, there was a notable increase in species with moderate scores. During the same period, this site experienced an eight-fold increase in fishing effort and the hydroacoustic data revealed the presence of several trawl-marks in 2022. Similar changes in benthic communities were observed in the Hinder Banks too. Here, the abundance of species with low resistance and recovery potential was significantly lower in locations that were geomorphologically exposed to trawling compared to sheltered ones. Exposed locations had a higher abundance of opportunistic species, with moderate to high scores. The presence of several trawl marks on the seafloor was observed in the exposed locations, corresponding to fishing hotspots identified in the satellite data. Trawling activities marginally impacted richness and total abundance, but negatively altered benthic functional composition. The findings of this study provide scientific evidence of the detrimental impact of bottom-contacting fisheries on conservation priority biotopes and argues against the coexistence of such activities with Marine Protected Areas. The results of our investigation are of interest to environmental managers for the adequate implementation of environmental legislation in the face of rapid and widespread anthropogenic changes.
Subtidal natural hard substrates (SNHS), commonly referred to as “stony reefs” (Irving et al., 2009) or gravel beds, whether of geogenic or biogenic origin, represent important ecological habitats and cover essential ecosystem functions (Wahl, 2009; Sheehan et al., 2013a; Sheehan et al., 2013b; Papenmeier et al., 2020; Irving et al., 2009; Michaelis et al., 2019a, b). The structural complexity provided by SNHS at various spatial scales enhances benthopelagic coupling and subsequently, the associated ecological succession phases by acting as settling, shelter, feeding and nursery grounds for a wide range of sessile and vagile marine organisms at multiple trophic levels (Wahl, 2009; McArthur et al., 2010). In sedimentary continental shelves, such as the Southern North Sea region, where foundation species are scarce or absent, the ecological relevance of SNHS increases significantly. They can act as oases, promoting high biomass and species richness with diverse functional traits (Papenmeier et al., 2020; Hiddink et al., 2019; Hinz et al., 2021). Nevertheless, SNHS biotopes are fragile i.e., they are characterised by benthic species with low resistance and resilience to anthropogenic disturbance and are particularly susceptible to bottom-disturbing and free-ranging anthropogenic activities (Kaiser et al., 2006; Hiddink et al., 2017).
Bottom-contact fishing, by towing heavy-duty gear over the seafloor, is the most widespread anthropogenic source of physical disturbance to seafloor habitats, globally, with a predominantly impact on continental shelves (Eigaard et al., 2016; Hiddink et al., 2017; McLaverty et al., 2023). At the European (EU) level, the most used bottom fishing gear types are otter trawls, beam trawls, demersal seines, and dredges targeting various invertebrate and demersal fish species (Eigaard et al., 2016). In Belgian waters, bottom trawling has a centenarian history, and it brought historically documented SNHS biotopes such as native European oyster Ostrea edulis beds to the brink of extinction. Historical data from the late 19th and early 20th century (Pype, 1911; Gilson, 1921; Houziaux et al., 2008b and references therein) showed that a typical rich and diverse sessile fauna associated with SNHS was present in the Hinder Banks region. Nowadays, such biotopes are assessed as degraded and in an unfavourable ecological condition (Houziaux et al., 2008a; Belgische Staat, 2018; Pecceu et al., 2021).
The impacts of bottom trawling on the seafloor’s physical and ecological integrity have been extensively studied and their severity is widely acknowledged (Pitcher et al., 2022; Seto et al., 2023). The degree of these impacts varies depending on factors such as the specific design of the trawling gear, the type of seafloor and the resilience of the affected organisms (Eigaard et al., 2016; Sciberras et al., 2018; Rijnsdorp et al., 2020). In general, trawling gears cause sediment resuspension (Mengual et al., 2016; Oberle et al., 2016), compaction (O’Neill and Ivanovic, 2015) and the disruption of habitat heterogeneity (Kaiser et al., 2002; e.g., overturning and displacement of stones). The remobilization of sediments can expose deeper stratigraphic layers (O’Neill and Ivanovic, 2015) and the subsequent redeposition can have negative impacts such as burial and smothering of SNSH biotopes. These impacts can lead to suffocation and increased mortality of associated target and non-target species (Kaiser et al., 2006; van Hoey et al., 2020; Pecceu et al., 2021). Cumulatively, these impacts result in changes in the benthic community composition (Kaiser et al., 2006), which may experience shifts towards short-lived, fast-growing, opportunistic, and R-strategist species (Collie J. S. et al., 2000; Hiddink et al., 2017; Kaiser et al., 2002; Hinz et al., 2022) while the abundance, richness, and biomass of typical and long-lived species decreases (McLaverty et al., 2023).
SNHS biotopes are included in all relevant EU directives and regional seas conventions. However, owing to a combination of operational criteria such as the lack of scientifically validated mapping/delineation standards (Papenmeier et al., 2020) and conceptual challenges including the lack of proper definitions (Irving et al., 2009), they have remained largely underrepresented in all legislation. This underrepresentation has led to a lack of adequate underlying data on their spatial distribution (Papenmeier et al., 2020), natural and anthropogenic drivers (Michaelis et al., 2019a, b,), hindering their efficient stewardship (van der Reijden et al., 2021). In European waters, SNHS biotopes are protected by three interconnected legislative frameworks: the EU Marine Strategy Framework Directive (MSFD; Council Directive 2008/56/EC), the EU Habitats Directive (HD; Council Directive 92/43/EEC) and the EU’s Common Fisheries Policy (CFP, SWD-2023–103). The HD specifically provides a framework for the designation of marine protected areas (MPAs) where “Member States must prohibit: all forms of deliberate disturbance, deterioration and destruction…all forms of deliberate capture or killing in the wild…and Member States must designate, protect and manage core areas for habitat types listed in Annex I and species listed in Annex II of the Habitats Directive.” Within the context of the HD, Belgium has designated the “Vlaamse Banken” area as an MPA (Figure 1). This region encompasses conservation priority biotopes such as “sandbanks permanently covered with seawater” (Habitat 1110) and “Reefs” (Habitat 1170 listed under Annex I, and which include SNHS of biogenic and geogenic origin).
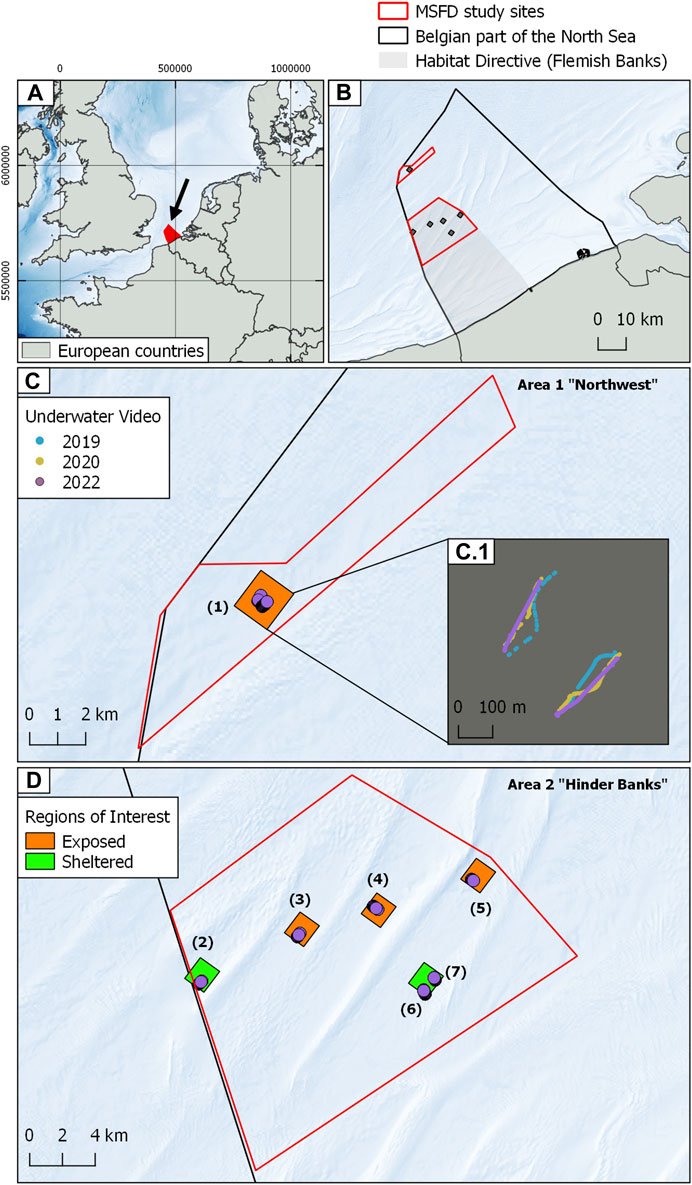
FIGURE 1. Cartographic overview of the study areas. (A) Geographical setting of the BPNS (denoted by the black arrow) within the Greater North Sea Region. (B) Detail of the BPNS displaying the HD area “Vlaamse Banken” (Flemish Banks, large grey shaded polygon), the two MSFD “search” areas (red outlined polygons) and the MSFD regions of interest or ROIs (small grey (black?) shaded polygons). (C) Overview of the Northwest study site displaying the region of interest and an inset detail (C.1) of the serial underwater videos herein acquired colour-coded by year of acquisition. (D) Overview of the Hinder Banks study site displaying the regions of interest and the video data. The green and orange colour of the regions of interest denotes their location relative to the surrounding geomorphology, hence their sheltered or exposed status relative to fishing impact. Background bathymetry from European Marine Data Observation Network (EMODnet bathymetry https://emodnet.ec.europa.eu/en/bathymetry).
The comprehensive collection and analysis of multidisciplinary datasets plays a crucial role in the assessment of the ecological status of SNHS biotopes. These datasets provide background information to scientifically guide decision-making processes regarding conservation measures and adequate implementation of environmental policies. Remote sensing technologies are particularly suited to the study and observation of such fragile benthic habitats and understanding their natural and anthropogenic drivers by minimising the adverse effects of destructive sampling approaches such as conventional grab or dredge sampling. Starting with broad-scale satellite-based imagery, it becomes possible to acquire area-wide and information-rich data on commercial fishing activities (Lacey et al., 2023). Vessel monitoring and automatic identification systems (VMS and AIS) enable the quantification of the magnitude of this anthropogenic pressure, providing a cost-efficient and relatively unbiased spatial description of fisheries activity including its origin, type, and effort (Fournier et al., 2018; Russo et al., 2016).
At the mesoscale (10 m2-1 km2), hydroacoustic tools, such as multibeam echosounder systems (MBES), have become the mainstream technology for seafloor and benthic habitat mapping (Brown et al., 2011; Porskamp et al., 2022), including the mapping of SNHS biotopes (Papenmeier et al., 2020; van der Reijden et al., 2021), and the imaging of the local or shelf-wide physical impact of bottom trawling on the seafloor’s morpho-sedimentary integrity (Oberle et al., 2016; Bruns et al., 2020; Ludman et al., 2021; Schönke et al., 2022). MBES allows the acquisition of high-density, high-resolution, and co-registered bathymetry (depth) and backscatter strength data (a proxy of the seafloor’s nature). This technology has the potential for detailed and spatially explicit investigations of the footprint of commercial bottom fishing activities.
Over the past decade, advancements in underwater photography, particularly still imagery, has revolutionised the study of SNHS biotopes (Michaelis et al., 2019a, b; van der Reijden et al., 2019; Becker et al., 2020; Montereale Gavazzi et al., 2021; Romoth et al., 2023). This technology allows for the observation of micro-scale (1 mm2-1 cm2) features and processes at ecologically relevant spatial scales, while also ground truthing hydroacoustic remote sensing data. Underwater photography can be collected via different approaches with drop and/or drift video frames representing a cost-effective and optimal solution to biological data acquisition within operationally challenging marine environments.
Several of the insights gained from underwater photography can be used as indicators of benthic ecological status. Conventional metrics such as species density, biomass, and richness offer little information on the functions covered by the benthic community and may bias the detection of changes in the ecosystem’s functionality and integrity (Bolam et al., 2014). Recent advances in the study of impacts on benthic environments have therefore shifted focus on biological trait-based approaches (e.g., Bolam et al., 2014; De Juan et al., 2015). When it comes to bottom trawling and species vulnerability, the susceptibility of a species and the function it performs depends on its life history traits, morphology, and behaviour (Hinz et al., 2021). Hinz and co-workers (2021) developed a standalone index known as the Resistance and Recovery Potential Index that categorises vulnerability or resistance to bottom trawling by categorising species based on a set of biological traits linked to trawling disturbance. This method makes it possible to link changes in the occurrence of specific traits to changes in functional status and ecological integrity.
The objective of this study is to assess the effects of commercial bottom-disturbing fishing impacts on the community composition, function, and ecological status of SNHS in Belgian waters. Therefore, a comprehensive set of hierarchically spatially nested data types (from broad to micro-scale) obtained by means of remote sensing technologies was used, integrating satellite observations with hydroacoustics and underwater photography. The study aims to provide background information and methodologies that can be used in the framework of conservation-ready maritime spatial planning (MSP). Our findings will support legal enforcement and environmental conservation and mainstream the stewardship of SNHS biotopes. The investigation focuses on two key offshore study sites: an MPA under the EU HD (“Vlaamse Banken”), and a recently discovered biodiversity hotspot (Montereale Gavazzi et al., 2021) situated underneath the busiest shipping lane in the world, currently being proposed as an MPA in the framework of the new Belgian MSP.
Specifically, this study aimed to: 1) analyse temporal changes in SNHS community composition as a function of increasing fishing effort at three yearly time intervals, and 2) analyse spatial changes in SNHS community composition as a function of seafloor geomorphology in determining the biotope’s exposure to bottom trawling impacts. The observed changes are discussed in relation to their implications for the ecological integrity and functionality of SNHS and are linked to the detrimental effects of commercial ground fishing activities.
The Belgian part of the North Sea (BPNS) is a shallow (max. depth 54 mLAT (Lowest Astronomical Tide); average depth 20 mLAT) and semi-enclosed shelf sea. It covers ca. 3,600 km2 accounting for ca. 0.5% of the North Sea surface. The Belgian continental shelf is siliciclastic, composed of quaternary sands with sporadic outcrops of tertiary layers, remnants of the paleo landscape, which include compact clay and lag deposits, with variable biogenic and geogenic SNHS, ranging from bioclastic detritus to gravel and boulder stones. A system of very large (sensu Ashley, 1990) sandbanks marks the salient geomorphological characteristic, forming a unique and dynamic system of alternating gullies (large-scale troughs), modulated by strong tidal currents (exceeding 1.5 m/s; Kerckhof and Houziaux, 2003) with a tidal ellipse orientation along the NE-SW axis.
In Belgian waters, the existence of SNHS is relatively well documented geologically and sedimentologically (Veenstra, 1969; Gullentops et al., 1978; Deleu, 2002; Deleu and Van Lancker, 2007; Montereale Gavazzi et al., 2023). However, from a biological point of view, SNHS biotopes have remained poorly explored. They are generally referred to as “gravel beds”. To date, maps of potential SNHS distribution, based on a combination of geological, geophysical, sedimentological, and visual observations, have been produced (Van Lancker et al., 2023), pointing at an overall ca. 16% coverage of variable SNHS. In this North Sea region, SNHS are representative of “matrix-supported” geogenic reefs (see Irving et al., 2009, p. 20), hence defined as “A spatial aggregation comprising natural surfacing non-mobile geogenic and/or bioclastic sediments allowing for the growth of sessile/epilithic fauna” (Montereale Gavazzi et al., 2023). “Clast-supported” SNHS areas are not to be excluded though they are merely present in the Northwestern most corner of the BPNS.
The SNHS areas targeted in our investigation (see MSFD study sites in Figure 1) are sites acknowledged in the framework of three Belgian monitoring programs conducted under the umbrella of three EU Directives, namely, the HD, MSFD, and the CFP, designed in line with the OSPAR Coordinated Environmental Monitoring Program guidelines (CEMP; https://www.ospar.org/work-areas/cross-cutting-issues/cemp) to assess GES in terms of Biodiversity and Seafloor Integrity of SNHS biotopes.
This study area is situated beyond the 24 NM delimitation, in the northwesternmost (top left) part of the BPNS, aligning with intense routed navigation and bordering with French and English waters (Figure 1C). It covers ca. 37 km2. Here, water depths range between 37 and 43 mLAT. Topographically, the area is relatively flat, exhibiting an East to West transition of the substrate type progressing from a sandier domain, typified by sedimentary bedforms with ripples and small dunes (Ashley et al., 1990), to a gravelly and rougher substrate, characterised by a complex bathymetric relief and a hillocky terrain typical of SNHS areas. In the current Belgian MSP (MSP; 2020–2026) it is designated as a search zone for biodiversity protection as well as a prospecting area for marine aggregate extraction. Here, SNHS biotopes (namely, geogenic reefs similar to those observed in the German Exclusive Economic Zone (EEZ) in Michaelis et al., 2019a, b) have been first observed in 2018 (OD Nature, 2018; Montereale Gavazzi et al., 2021; Montereale Gavazzi et al., 2022) and yearly followed up since.
The second study site is situated in the Hinder Banks region, part of a sandbank complex between 12 and 24 NM delimitation, bordering French waters on the western side (Figure 1D). This site covers ca. 320 km2 and partly overlaps the Vlaamse Banken HD area, established in 2012 to protect 1110 (sandbanks) and 1170 (reefs) habitat types. Water depths range between −39 and −10 mLAT. Topographically the Hinder Banks site can be subdivided into two main large-scale geomorphological features: sandbanks and gullies (or large-scale troughs). The former geomorphological features are represented by four systems (namely, Fairy, North, West and South Hinder systems) composed of siliciclastic sediments (medium to coarse sands) giving rise to large and very-large dunes (ranging from 4 to >10 m height, Ashley, 1990), including widespread flood-dominated barchanoid dunes developing at the foot of the sandbanks. Valleys alternate between sandbanks and are characterised by a relatively flat and hillocky bathymetric relief. The occurrence of SNHS is restricted to the throughs and at the foot of the sandbank between alternating barchan dunes. In this region, the presence of SNHS biotopes has been known for over a century (van Loen and Houziaux, 2002; Houziaux et al., 2008b; Houziaux et al., 2011). About 175 km2 of this study site overlaps with the Princess Elisabeth Zone, designated in the Belgian MSP as a renewable energy development concession area. Major infrastructural developments are planned here.
Both study sites are at the centre of attention in the new Belgian MSP 2020–2026 (Article 6) with ongoing governmental discussions on their closure to all bottom-disturbing anthropogenic activities.
The study benefits from three main data sources, reflecting three hierarchically nested scales of observation: 1) Satellite-derived broad-scale (>1 km2) publicly available data on serial commercial fishing activities, providing a comprehensive spatiotemporal overview of the fishing type, frequency and extent at the BPNS level and within each study site; 2) Serial MBES hydroacoustic surveys, recording bathymetry and backscatter, providing a detailed mesoscale (10 m2-1 km2) interpretation of the fishing impact in each study site and region of interests (ROI), and 3) underwater imagery within each ROI, enabling the study of the benthic community and appraise the resistance and resilience of the SNHS biotope at the ecologically relevant micro-scale (<1 m2). Together, these data provide a unique opportunity to evaluate the ecological status of conservation priority SNHS biotopes in response to the impact caused by commercial fishing activities.
Publicly available serial data of commercial fishing activities were extracted from the Global Fishing Watch (GWF) data portal (GWF, 2023). The GFW data were based on the Automatic Identification System (AIS) derived from the vessel’s identity, flag, type, location, speed, and direction, and it is used to compute the Apparent Fishing Effort (AFE), expressed in hours. Data were downloaded as point occurrences (comma-separated value-CSV) and raster (GTiff) files. The former comprises fishing efforts expressed as punctual occurrences of AFE, categorised by gear type and flag (country), and are available at a daily temporal resolution. The latter represented gridded raster data combining all gear types and flags at a horizontal spatial resolution of 0.01 × 0.01 and were downloaded as yearly layers. Data were obtained between 2016 and 2022 to provide a comprehensive overview of the fishing activities in each study site within a time frame that reflects the 2nd cycle of the EU MSFD monitoring programme. Data between 2016 and 2021 were downloaded on 6 October 2022, and from 2022 on 10 February 2023. Additionally, for the Northwest study area, the monthly number of active fishing vessels between 2019 and 2022 in Belgian waters was provided by DG Shipping (Sven Vercammen pers. comm.).
The CSV data were grouped by month by summing all AFE data points within each month and were displayed by means of serial bar plots summarising the monthly fishing effort over the duration of the time series. The AFE by gear type and flag were displayed by year by summing all AFE data points within each year (Supplementary Material S1).
Yearly average AFE maps were overlapped with SNHS distributions (Van Lancker et al., 2023) to visualise the spatial distribution of fishing activities and the spatial extent of their impact on the biotope within the two MSFD “search” areas. Two maps from 2016 to 2022 were computed at the BPNS level to visualise the spatial evolution of fishing activities in Belgian waters within the time frame considered. This data was used to assess spatiotemporal trends of commercial fishing activities and to evaluate the presence of preferential hotspots.
A considerable number of MBES surveys are featured in this investigation (overall seven oceanographic campaigns; Table 1). Surveys were conducted in recent years on board RV Belgica in the framework of the Belgian MSFD monitoring program on SNHS biotopes (Operationele Directie Natuurlijk Milieu, 2020), and other mapping initiatives (Belgian Federal Public Service Economy, Continental Shelf Service). These provide the basis to map ground-fishing activities (namely, trawl marks) in a spatially explicit manner, identify spatial patterns at the study sites, and acoustically interpret their impact on the seafloor’s physical integrity. Both study sites include serial MBES datasets (n = 6 for the Northwest area and n = 2 for the Hinder Banks area), thus enabling the assessment of trawl-marks spatiotemporal degradation and persistence and providing further context to the study.
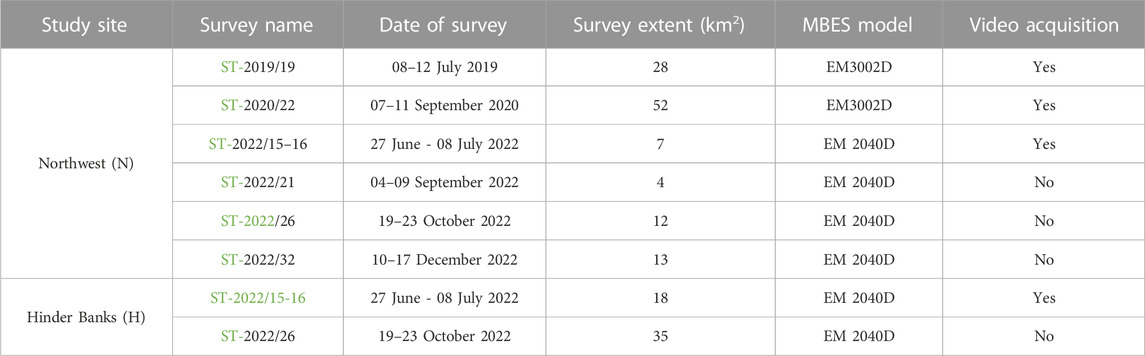
TABLE 1. Overview of the MBES surveys conducted on RV Belgica and used in this investigation. Information is tabulated per study site [Hinder Banks (H), Northwest (N) and refers to the survey name (with a hyperlink to the mission’s report], survey date, spatial extent (in km2), operated MBES model, and underwater video data acquisition. RV Belgica mission reports can be consulted at https://odnature.naturalsciences.be/belgica/en/table/2023.
Data were acquired using a Kongsberg EM3002 Dual system using the former RV Belgica, and an EM2040 Dual using the current RV. All surveys were acquired at a nominal frequency of 300 kHz. Overlap between adjacent survey lines was kept in the range of 20%–30%. To enable data comparability between consecutive backscatter surveys, the acquisition parameters (see Montereale Gavazzi et al., 2019) were unaltered and kept to a rigorous standard (Lamarche and Lurton, 2018; Roche et al., 2018).
Bathymetry and backscatter strength data for each ROI are displayed in Figure 2. Bathymetry data were derived using QPS QIMERA (https://qps.nl/qimera/), gridded to 1 m horizontal resolution. Tidal corrections were implemented using either data from the closest tide gauge (Flemish Hydrography - https://www.agentschapmdk.be/en/hydrometeo) or, where available, Real Time Kinematic (RTK) corrections. From the raw MBES datagrams, backscatter data were processed as compensated backscatter imagery (CBI) using QPS FMGT (https://qps.nl/fledermaus/), and gridded to a 1 m horizontal resolution. Using the vocabulary proposed by Schimel et al. (2018), the processing scheme code for the compensated backscatter imagery (CBI) falls under code “A4 B0 C0 D0 E5 F0”.
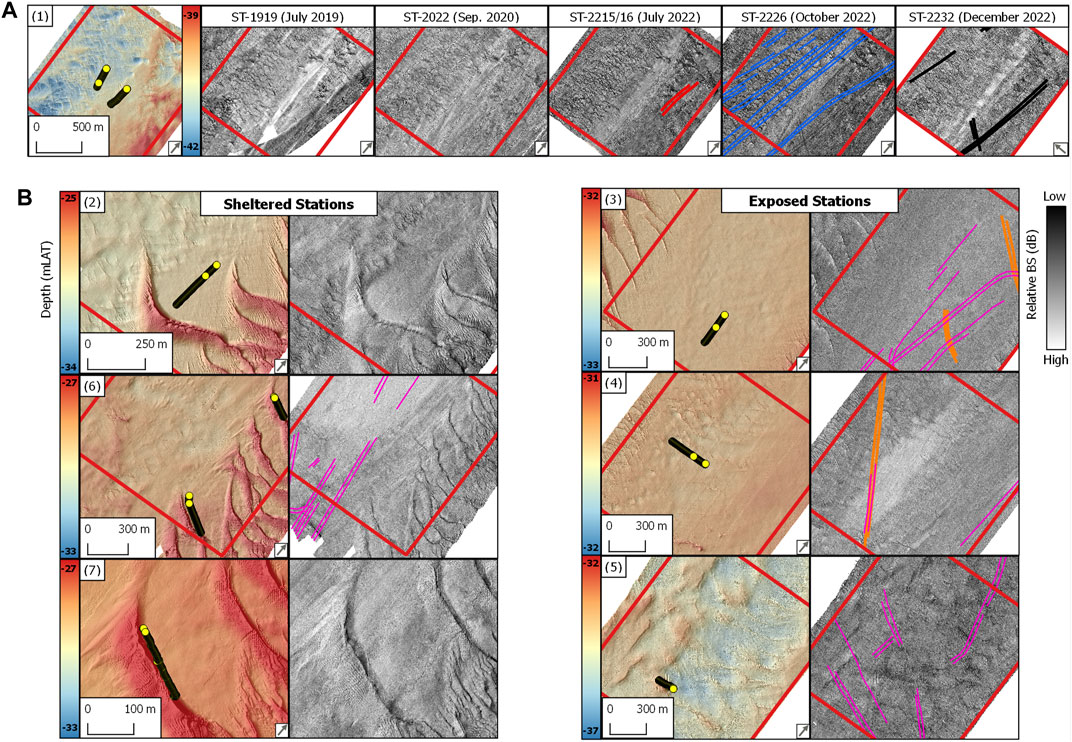
FIGURE 2. (A) Northwest study site. Details of bathymetry and serial backscatter strength surveys in the ROI [Figure 1(1)]. (B) Hinder Banks study site. Details of bathymetry and backscatter surveys grouped by exposed and sheltered SNHS ROIs [Figure 1 (2–7)]. Data displayed in [B] is from survey ST-2022/26 (Table 1). Yellow circular dots: location of the underwater video data used in this study. Digitised fishing trawl marks (polylines) are displayed on the corresponding backscatter image and are colour coded as in Figure 6. Survey names are reported in Table 1. Panel numbers are as in Figure 1. Depth (mLAT) values in each panel refer to the minimum and maximum values measured within the bounding box of the respective ROI. The grey arrow in the panel’s bottom right corner indicates the azimuthal direction of the MBES survey.
The compensated backscatter imagery data was integrated into a geographical information system environment (QGIS; http://qgis.osgeo.org) where visible trawl marks were manually digitised. These were saved as polyline-type ESRI-shape files. For this exercise, CBI was used, having a higher trawl mark discrimination potential than the bathymetry data. The detection of trawl marks is influenced by several factors, including the quality of the CBI e.g., acoustic artefacts, the survey’s extent with respect to the extent of the study area, the degree of degradation of the trawl marks (i.e., their date of origin remains unknown), and the occurrence of the trawl mark over different acoustical facies. Due to this, the mapping captures only a minor number of trawl marks compared to their effective extent (density and overall length, as observable in the satellite data). Nonetheless, this exercise enables the mesoscale detection of the geometry, preferential orientation, and spatial pattern of ground-fishing activities within the study areas at the time of the survey.
To aid the geoacoustic interpretation of the impact of ground-fishing activities on the seafloor’s morpho-sedimentological integrity, image differencing was applied between two serial surveys with comparable CBI values and used to quantify Before-After fishing event changes in the Northwest study area.
The produced shapefiles provided the basis for quantifying the sizes of the trawl marks. This was done by measuring the width of the individual furrows and the width between parallel furrows (Bruns et al., 2020). Calculating the internal distance between furrows enabled us to compute spatial buffers and to quantify the seafloor surface impacted by the trawling gears. The average buffer measured from the CBI was 30 m. Subsequently, the density of trawl marks per study site and serial survey could be estimated. Trawl mark density was calculated as a coverage percentage relative to the survey extent (Table 1).
Mapping of trawl marks and careful scrutinization of the serial MBES datasets enabled to identify areas of trawl mark persistence (their recognizable presence across surveys over time), hence the opportunity to evaluate spatiotemporal patterns of trawl mark degradation.
Underwater videos were acquired using ca. 300 m long video transects. In the Northwest area, three transects of underwater video data were acquired at a fixed monitoring location (i.e., ROI 1) in 2019, 2020 and 2022. In the Hinder Banks, six underwater video transects were acquired in 2022 within the five ROIs, one per ROI and two within ROI 6, within the troughs of two distinct geomorphological units (Figures 1, 2).
Underwater videos were acquired using RV Belgica by means of a video drop-frame system: a robust metal frame (http://www.vliz.be/en/videoframe-en), winch-operated and equipped with a medium-resolution ROS inspector colour camera (https://www.rosys.com/), linked to a MacArtney (www.macartney.com) multimedia controller unit (pan, tilt, zoom), and set up to acquire a 1 m2 field of view. This camera system was used to provide only a video live feed solution during the data acquisition. The underwater imagery herein used is acquired using frame-mounted GoPro cameras (versions 6 and 7; GoPro, Inc., San Mateo, California—https://gopro.com/) installed in a downward-looking position.
During video acquisition the camera’s field of view was set to linear mode, with 60 frames per second, resulting in images with resolutions of 1920 × 1440 and 2,698 × 2024 pixels. Two to four HUGYFOT (https://www.hugyfot.com/) Arius 1500 lumen underwater lights were additionally installed on the frame mounted at the four corners, focusing the light on the camera’s field of view with an inclination of ca. 45° from the seafloor ideal plane. This reduced the backscattering of light by suspended particles as well as shadowing effects such as the darkening of the image corners. Two downward-looking green laser pointers installed on the frame provide the metric reference scale (10 cm apart).
Positions of the underwater video data acquired in 2019 and 2020 were corrected for the DGPS antenna layback and adjusted to the cable breakpoint on the winch’s frame used to deploy the subsea unit. For the 2022 dataset, the subsea unit was equipped with a Kongsberg High-precision hydroacoustic position system (HIPAP). Positional uncertainty of the subsea video unit was minimised by acquiring data exclusively during slack-water tide windows when the current velocity reached <0.5 knots, hence ensuring minimal slack of the cables. During the acquisition of videos, the frame was kept as close as possible to the bottom (i.e., ≤50 cm, achievable by controlling the altitude from the onboard monitor control unit). Navigation was kept at maximally 0.3 kt. To improve the imaging quality, the frame was often lowered onto the ground and left recording for several seconds.
Post-processing of underwater imagery follows the methodology described in Montereale Gavazzi et al. (2021) and involves the following steps: 1) video sequencing into image stills every 10 s, 2) selection of annotatable image stills, 3) editing and enhancing imagery where needed, 4) annotation (identifying and enumerating benthic taxa), 5) georeferencing (where needed) and 6) collation of metadata. For each video transect, frames were extracted every 10 s using VLC media player (https://www.videolan.org/vlc/). From this initial set, the dataset was reduced by removing blurred scenes, double scenes, and scenes that did not relate to the seafloor (deployment and retrieval phases). The resulting still images were scaled against the laser pointers to obtain the sample size (Table 2).
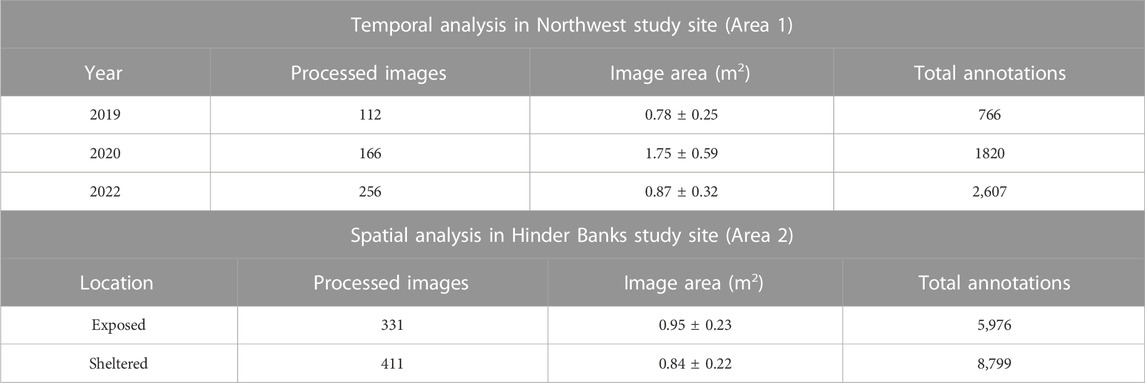
TABLE 2. Overview of processed still images extracted from the underwater videos, the average image area (mean ± SD) and the total number of animals annotated for each year in Northwest area and for both exposed and sheltered locations in the Hinder Bank area.
Annotation of benthic taxa was carried out using PAPARA(ZZ)I software (Marcon and Purser, 2017). Visible species were identified to the lowest possible taxonomic level and the resulting annotations were exported in the form of community matrices (tabulating species counts per analysed image still) and used for further analysis (Supplementary Material S2). Mobile species including teleost fish, elasmobranchs, and cephalopods were annotated as relevant indicators of ecosystem complexity and biodiversity but were excluded from the ecological analysis as they are not pertinent species to reflect SNHS integrity and deterioration from bottom trawling (i.e., focusing on epifauna) and the underwater video acquisition method is deemed as inadequate to capture their distribution. The presence of the tube-building polychaete Sabellaria spinulosa was counted as the number of aggregations (visible “clusters”) as individuals could not be distinguished from the imagery. Similarly, for Spirobranchus triqueter another tube-building polychaete, only the presence or absence of tube structures was annotated.
Species were identified to the lowest taxonomic rank possible, hereafter all referred to as “species.”
Each species identified from the video images was assigned a Resistance and Recovery Potential Index (RRI) category as a measure of vulnerability to ground-fishing activities (Hinz et al., 2021). To this end first each species was assigned a Resistance Index score based on its morphological features and behavioural aspects, and a Recovery Potential Index score based on its reproductive strategies and growth potential (Hinz et al., 2021). Both indices were then averaged in the RRI, which was classified as very low, low, moderate, high, and very high (Supplementary Material S3). Following this classification, total abundances for each RRI category were calculated.
Two separate sets of analyses were done. In the Northwest study site, the temporal variation in SNHS community composition and abundance was analysed as a function of the year (2019, 2020, and 2022) to detect community changes in relation to spatiotemporal trends in fishing activity (as observed from the dataset of fishing activities). In the Hinder Banks study site, the spatial variation in SNHS community composition and abundance was analysed as a function of exposure to bottom trawling (either exposed or sheltered locations), to appraise the role of local geomorphology in protecting fauna from ground fisheries. All statistical analyses were performed in RStudio (V 4.1.1; RStudio Team, 2020).
For the temporal analysis in the Northwest study site, the dissimilarities in species composition and abundances observed among the years 2019, 2020, and 2022 were quantified using the Bray-Curtis dissimilarity statistic. Dissimilarities were visualised by non-metric multidimensional scaling (nMDS) with year as the grouping factor. An Analysis of Similarity (ANOSIM) was applied to the dissimilarity matrix to test for significant differences among years. The presence of indicator species typifying each a priori group (year) was investigated with an Indicator Species Analysis (function multipatt, package indicspecies (De Cáceres and Legendre, 2009). The same ordination and statistical tests were applied to the species composition and abundances observed in the Hinder Banks study site within locations a priori grouped as exposed or sheltered from fishing.
Abundances count data were inspected for outliers, normality and homoscedasticity using QQ plots and F-tests, prior to the modelling exercise. As the data contained an excessive number of zeros, both zero-inflated and zero-altered (hurdle) negative binomial (ZANB) regression models were used to analyse the variability in the total abundances of each RRI category as a function of time (years, for the temporal analysis in the Northwest area) or exposure to fishing (exposed or sheltered locations, for the analysis in the Hinder Banks). For the spatial analysis in the Hinder Banks study site, an additional validation analysis was done by repeating the modelling exercise on a randomly selected subset of 30 images per location (three exposed, three sheltered, n = 180) to evaluate if different samples sizes per video transect/ROI could have influenced the results and if a balanced design would return different results. Models were built with the functions zeroinfl (package pscl (Zeileis et al., 2008; Jackman, 2020) and hurdle (package pscl) following the steps described in Zuur et al. (2009). Model selection for each analysis was performed using the Akaike information criterion (AIC). The selected models were validated by assessing the residuals’ normality, the residuals versus fitted values, and the residuals versus each covariate. An alpha threshold of p = 0.05 was used for all statistical analyses indicating statistical significance. The R code is available in Supplementary Material S2.
In the Northwest study site, the distribution of AFE across months between 2016 and 2022 revealed a seasonal pattern (Figure 3 left panels). AFE was generally higher between October and March, with the highest effort observed in December, January, and March across the years. A general increase in AFE over time was observed, especially in the last 2 years (2021–2022). In 2022, a total of 933 h were spent fishing in an area of 37 km2. The main gear type used was trawlers. However, the use of gear type “other seines,” which includes demersal seines (Danish seine and Scottish seine, the latter also called “fly shoot”), purse seines and pelagic seines, increased 800% on average in the last 2 years, from an average of 40 h to an average of 400 h at sea. Vessels fishing in the area were mainly from the Netherlands, followed by France and Great Britain. AFE from Belgian vessels was limited, but it increased in 2022 from an average of 9 h–72 h at sea. Similarly, AFE from the Netherlands and Great Britain increased in time and peaked in 2022. The total number of vessels operating in the area increased by 32% in the period 2021–2022 compared to 2019–2020 from an average of 15 vessels to an average of 20 vessels.
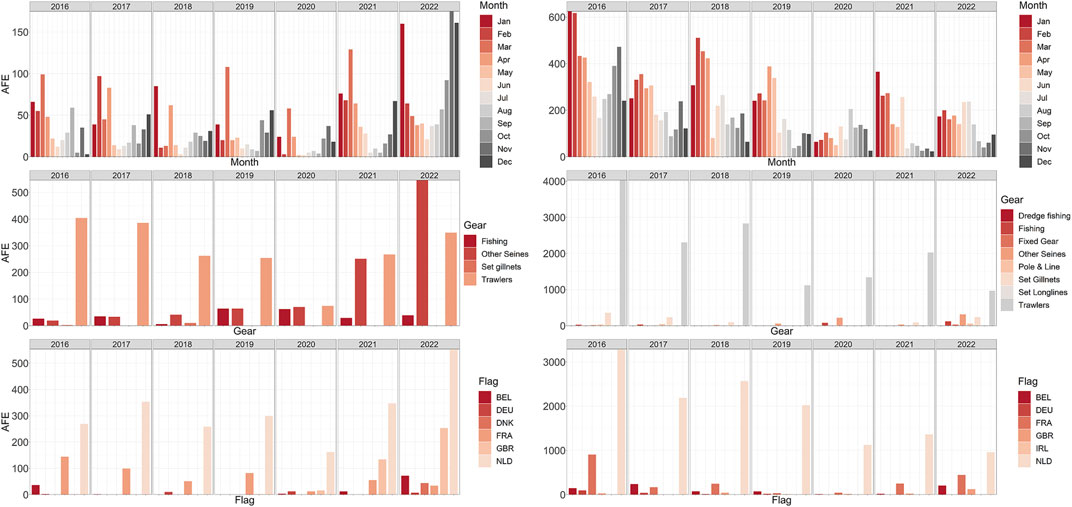
FIGURE 3. Overview of the commercial fishing activities in the two study areas. Left column: Summary of the AFE (hours) in the Northwest for the time range 2016–2022 obtained from Global Fishing Watch (GFW). (Left column) AFE grouped by month. (Right column) AFE grouped by gear type. (top to bottom) AFE grouped by vessel’s flag. Right column: Summary of the AFE in the Hinder Banks for the time range 2016–2022 obtained from GFW. (Left column) AFE grouped by month. (Right column) AFE grouped by gear type. (top to bottom) AFE grouped by vessel’s flag. Country codes: BEL, Belgium, DEU, Germany, FRA, France, GBR, Great Britain, NLD, Netherlands, IRL, Ireland.
In the Hinder Banks study site, monthly and yearly AFE were observed to decrease in time, by 60% in between 2016 and 2022 (Figure 3 right panels). However, 1724 h were spent fishing in this 320 km2 area in 2022. Fishing activities followed a seasonal pattern, with generally higher effort between January and March. The main gear types used were trawling nets. The involved fishing vessels were largely under the Dutch flag. Vessels under the Belgian and French flag were observed to spend more time fishing in the area in the last 2 years (double the average time for Belgium in 2022, 24% higher AFE values for France in 2021–2022).
In Figure 4, the overlap of commercial fishing activities in the MSFD monitoring areas and study sites, Northwest 1) and Hinder Banks 2), with the distribution of SNHS biotope as mapped in Van Lancker et al., 2023 is displayed for each year, and as an average over the period examined. Within the Northwest area, SNHS covers 21.23, and 18.25 km2 have been repeatedly impacted by commercial fishing activities between 2016 and 2022, resulting in an average disturbance between 1 and 22 h of activity over 86% of the SNHS area. Similar figures apply for the Hinder Banks area, with 89% of the SNHS area disturbed between 1 and 30 h (SNHS = 80.61 km2, Fishing extent = 67.13 km2). Both areas experienced a considerable direct anthropogenic disturbance from commercial fishing activities, the majority of which operate bottom trawling gears (Figures 3, 4).
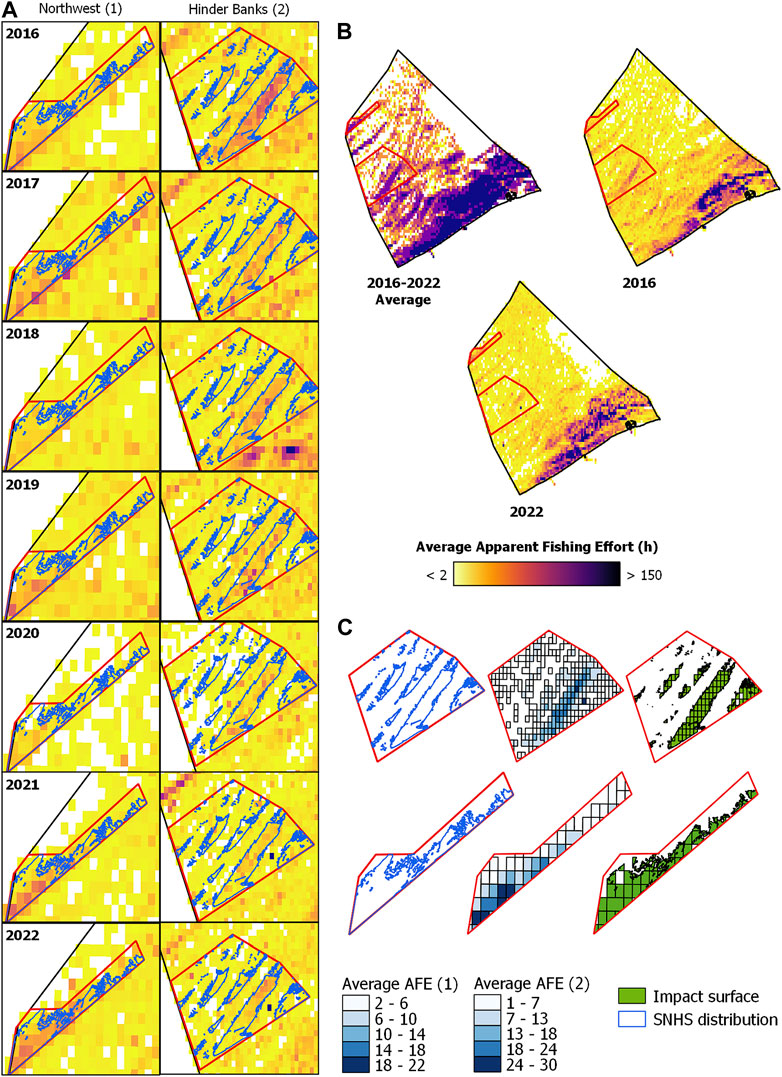
FIGURE 4. Overlap of commercial fishing activities in the Northwest (1) and Hinder Banks (2) study areas with the distribution of SNHS biotope mapped in Van Lancker et al., 2023. For the Hinder Bank area, part of the SNHS distribution is from Montereale Gavazzi et al. (2023). (A) Yearly AFE (hours) in the study sites is displayed with a continuous colour interval. (B) Average AFE between 2016 and 2022 and yearly average AFE in 2016 and 2022 displayed with quantile breaks. (C) Extent of the SNHS distribution layer overlapping with the extent of the average area fished (2016–2022; AFE maps displayed with quantile breaks), i.e., representing the extent of the anthropogenic disturbance in the study sites.
The compensated backscatter imagery reveals the mesoscale impact of the ground-fishing activities within the study sites (Figure 5). Trawl marks appear as sets of parallel furrows with consistent widths of ca. 5 m for the individual striations and an average width of 30 m between parallel lines, or furrows (Figures 5 A, B1). They appeared in relatively high densities in both study sites. The preferential orientation of trawling routes aligns with the tidal ellipse in an SW-NE direction. The mapping exercise revealed variable degrees of trawl mark detectability in the compensated backscatter imagery, ranging from highly visible to hardly distinguishable from the background of the acoustic image. In terms of backscatter values, trawl marks in both study sites present a consistent striated pattern denoted by higher values compared to the surrounding substrate (Figure 5), suggesting changes in acoustical roughness and impedance contrast. Algebraic change detection via image-differencing applied to CBI data in the Northwest area and acquired between July and October 2022 CBI, reveals changes in relative backscatter strength values of up to 8 dB (Figures 5 E–E2). Noticeable is the poor trawl mark detectability within acoustical facies characterised by high reflectivity, where SNHS biotopes are found. Figure 5 exemplifies this phenomenon displaying the transition of a well-defined trawl mark from acoustic facies with a relatively low backscatter strength, indicative of a rather sandy seafloor, to considerably more reflective facies, where the striations abruptly degrade and become hardly detectable, masked by the facies’ high reflectivity.
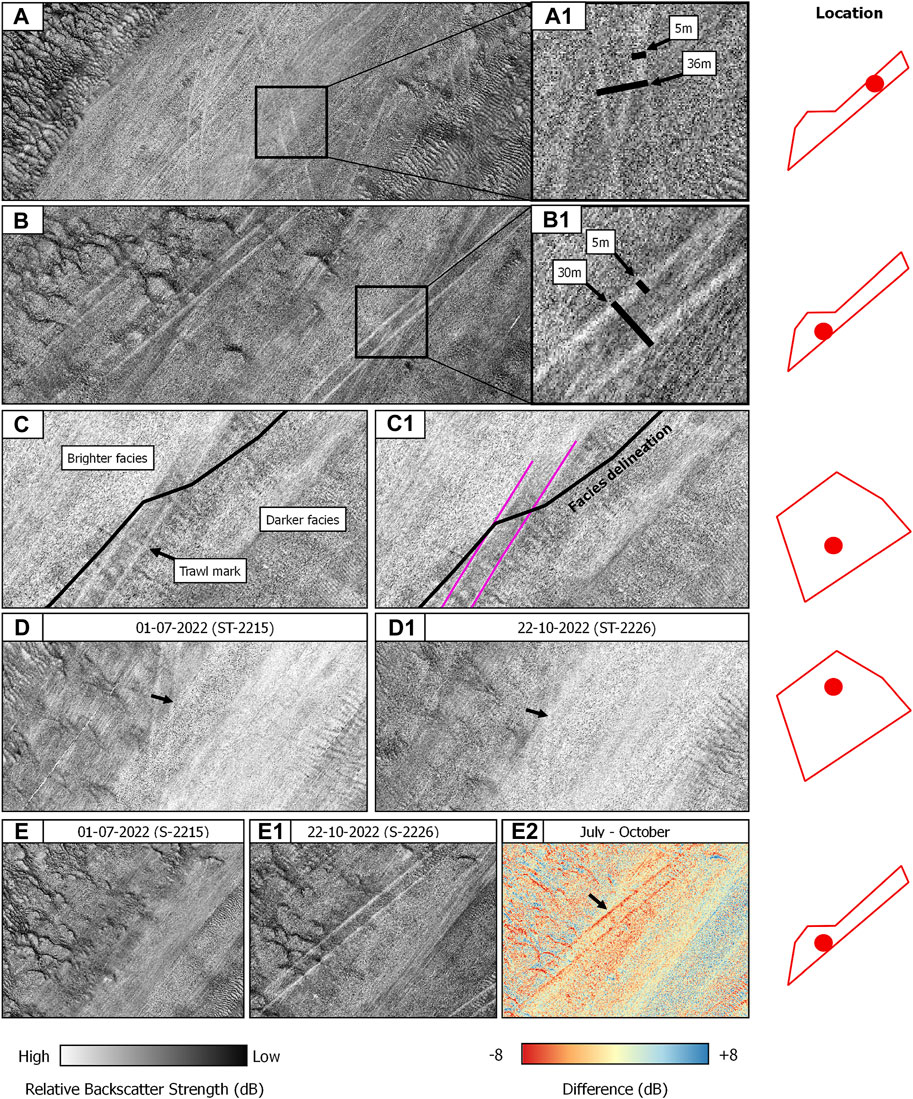
FIGURE 5. Overview of the anthropogenic footprint of bottom trawling on SNHS seafloor areas using MBES backscatter. (A,A1) and (B,B1) are examples of trawl marks with annotated dimensions. (C,C1) Trawl mark signature loss in highly reflecting acoustical facies. (D,D1) Trawl mark persistence between two serial surveys. (E,E1,E2) Algebraic change detection via image differencing between two serial surveys. The locations of the CBI details are displayed on the right by the red dots.
Based on the serial MBES dataset available for the Northwest area, trawl marks make their first appearance in 2022. They were absent from the 2019 (July) and 2020 (September) surveys. Here, in terms of trawl mark density relative to the area extent covered by each survey, the ground-fishing impact appears in June/July surveys (1%), during September (15%), October (9%) and December (1.7%). Trawl marks are hardly visible in July and December 2022 whereas they appear in high numbers and spatially clustered patterns in September and October 2022 (Figures 6A–C). The same applies to the Hinder Banks area with sporadic occurrences of trawl marks during July (0.8%) and considerably higher densities in October (Figures 6D–G; 7%).
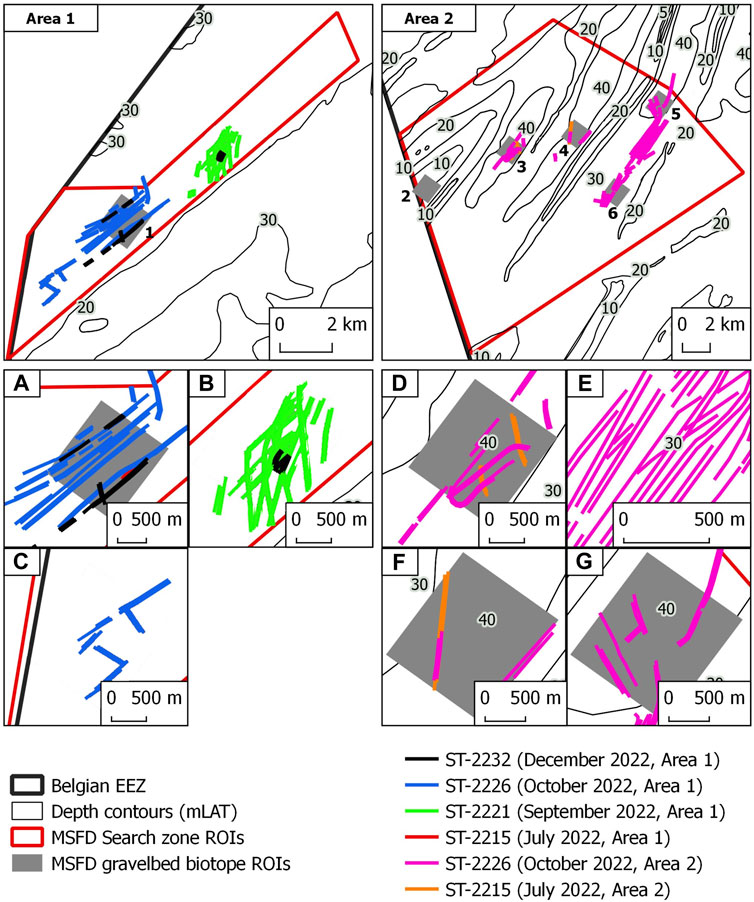
FIGURE 6. Overview of manually digitised trawl marks in the two study sites. The two main top panels display the location of the study sites and the overall extent of digitised trawl marks. Panels (A–G) display details of the spatial patterns of digitised trawl marks. Colour coding according to MBES survey (Dates and Study Area).
In terms of persistence, i.e., the conservation potential of a trawl mark, two serial surveys in the Hinder Banks area were compared (Figures 5 D–D1). Despite the unknown date of origin of the observed trawl marks, these observations document that the impact on the seafloor can persist for at least ca. four months at a water depth of ca. 33 m and a maximum current velocity of 1 m/s (Van Lancker et al., 2007; Van Den Eynde, 2023).
Exemplary images acquired within each sampling station (i.e., ROI) are displayed in Figure 7. In the Northwest study site (ROI 1 Figure 1; Figures 7A, B), the SNHS distribution was mostly clast-supported, characterised by dense coverage of stones and intermittent sand patches. Cobble-sized stones were the most abundant and were frequently bio-encrusted by dense aggregations of tube-building polychaete S. triqueter, with widespread colonies of the soft coral Alcyonium digitatum (up until 2020; Montereale Gavazzi et al., 2022). Here, colonisation by epilithic and SNHS typical taxa begins with stones with a diameter of 2 cm (Montereale Gavazzi et al., 2021). This SNHS biotope was presented in the form of longitudinal tide-swept stone furrows, as observed in the English Channel by Holme and Wilson (1985). The direct impact of bottom trawling on sessile taxa is exemplified by the image in panel B, acquired in 2022 after the peak increase in fishing activities. The overturning of a cobble is clearly visible along with a flipped-over and partially buried specimen of A. digitatum.
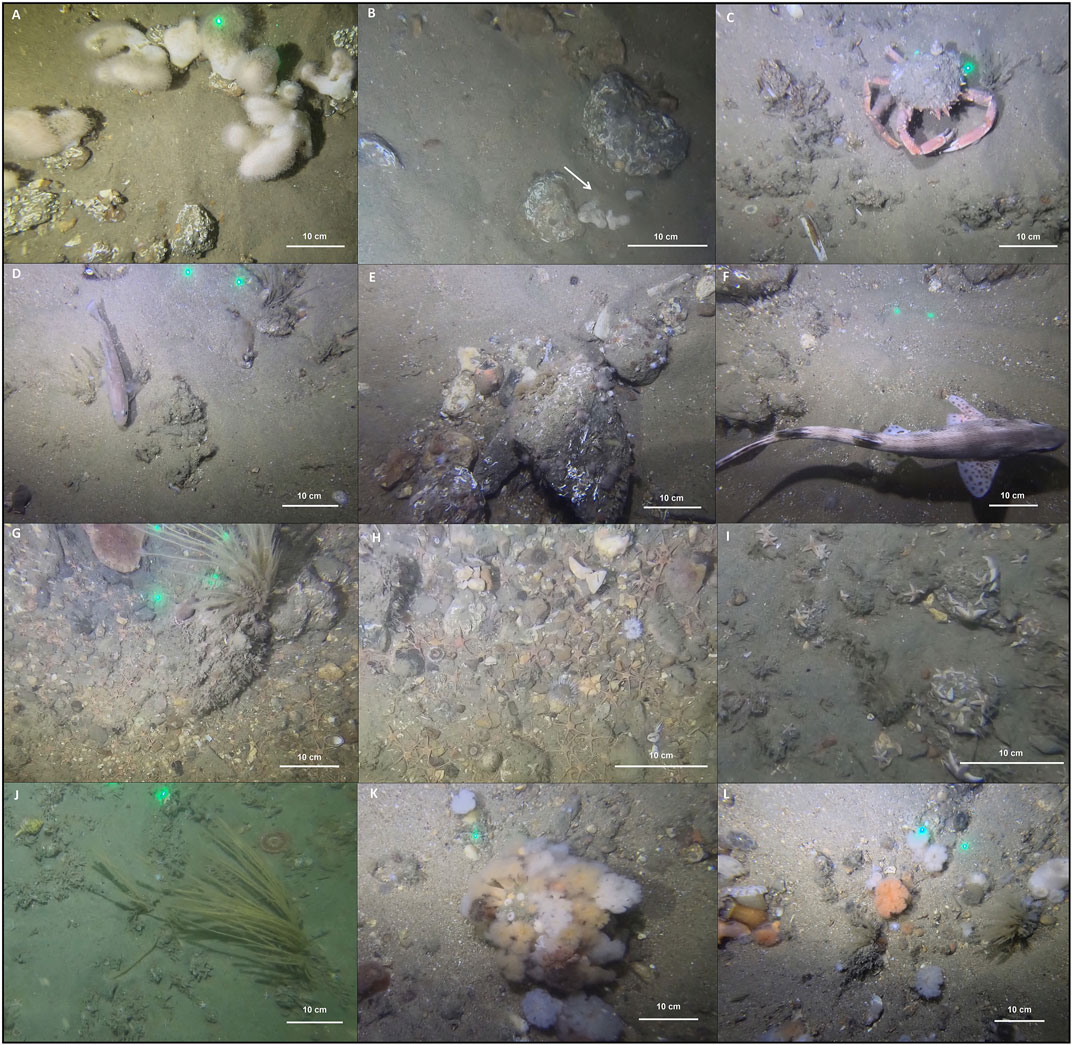
FIGURE 7. Exemplary selection of the underwater imagery acquired within the ROIs in the Northwest study site [Panel (A,B)] and the Hinder Banks study site [Panels (C–F)]. The green laser pointers are 10 cm apart.
In the Hinder Banks study site (ROI 2, Figure 1; Figures 7C, D), the predominant SNHS distribution patterns were related to a matrix-supported gravel bed composed of fine to coarse gravel stones and mixed sediments with variable amounts of bioclastic detritus (shell thanatocoenosis). Conspicuous taxa in this ROI were relatively dense clusters of S. spinulosa, forming reef-like patches along with intermittent sandy patches with a high abundance of actiniarians and sessile arborescent species such as the hydrozoan Nemertesia spp. As ROI 2 is in a sheltered position, the area attracts several mobile and juvenile fish and crustacean species which exploit this geomorphologically protected site as a refuge for feeding, growth, and reproduction. The large common spider crab Maja brachydactyla was frequently observed in proximity to the S. spinulosa patches. Fish species identified were juvenile Trisopterus luscus, Limanda, Pleuronectes platessa, Platichthys flesus, and adult individuals of Chelidonichthys cuculus, Zeus faber, Callionymus spp., and Agonus cataphractus.
In ROI 3 (Figure 1; Figures 7E, F) the predominant stone type was related to coarse stones with abundant cobbles and boulder clasts. Being highly exposed to bottom trawling activity, the SNHS biotope was depauperated of species and stones were only partially covered by juveniles of the plumose anemone Metridium senile and small unidentifiable hydrozoan turfs. The inhibited growth of S. triqueter was evident in this area with imagery displaying pebbles, cobbles and boulders that were frequently overturned. Observed fish species were L. limanda, A. cataphractus, Dicentrarchus labrax, and an adult individual of a small-spotted catshark (Scyliorhinus canicula).
ROI 4 (Figure 1; Figures 7G, H) is equally highly exposed to bottom trawling activity. The SNHS spatial distribution pattern was clast-supported with dense aggregations of the full stone grain size spectrum, ranging from fine to boulder-sized stones. This SNHS area exhibited a high concentration of tertiary clay, which might result from a combination of hydrodynamic erosional processes, as well as the high intensity of trawling practices. Observed taxa were the echinoderms Psammechinus miliaris and the superabundant Ophiura spp. A hydrozoan turf characterised the stone coverage, with sporadic occurrences of N. spp. Noticeably, the edible crab Cancer pagurus was observed within small pit-like depressions.
The unsheltered location of ROI 5 (Figure 1; Figures 7I, J) makes this area also highly exposed to bottom trawling activities. The site was a matrix based SNHS area with a widespread presence of pebbles and cobbles dispersed within a sedimentary siliciclastic matrix. The stones were rarely colonised, and the most abundant species were the hermit-crab Pagurus spp. and a superabundance of the common starfish Asterias rubens.
Finally, ROI 6 (Figure 1; Figures 7K, L) is representative of SNHS biotopes in sheltered locations, protected by several barchan dunes developing at the foot of the sand bank. This area appeared as a matrix-supported gravel bed with sparse pebbles, cobbles, and bioclastic detritus. Stones were densely and consistently colonised by M. senile. Intermittent sand patches were characterised by the frequent presence of fully developed and branching N. spp. along with partially burrowing actiniaria. Fish species identified were A. cataphractus, P. platessa and Gobiidae.
A total of 534 images were processed from the underwater videos, and 5,193 individuals and colonies were annotated (Table 2). Out of the 17 different species identified in this area, 6 were classified as having a low RRI score, while the remainder was classified as moderate (Table 3). The percentage of species with low RRI among total annotated taxa declined from 76% in 2019 to 27% in 2022, while the percentage of species with moderate RRI increased from 23% to 73%. Species richness decreased between 2019 (17), 2020 (16) and 2022 (15).
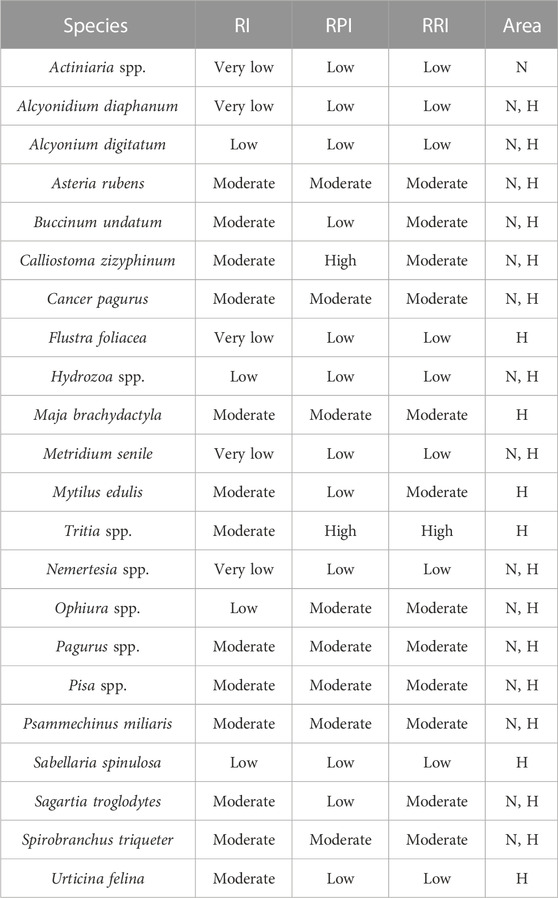
TABLE 3. List of species identified from the processed images of either the Northwest (N), the Hinder Banks area (H) or both and their assignment to Resistance Index, Recovery Potential Index and Resistance and Recovery Potential Index scores following the method of Hinz et al. (2021).
The non-metric multidimensional scaling (nMDS) plot showed that sample species composition and abundances are only limitedly dissimilar and partially overlap, especially in samples from 2019 to 2020 (Figure 8A). However, a dissimilarity trend can be observed in time, where a large portion of samples from 2022 are dissimilar to samples from 2019 and do not graphically overlap. Statistically significant dissimilarities were detected with the ANOSIM among years overall (with an R2 of 0.1424 and a p-value = 0.001) and a posteriori between each pair of years (2019–2020, R2 of 0.0729 and p-value = 0.001; 2020–2022, R2 of 0.1140 and p-value = 0.001; 2019–2022, R2 of 0.2249 and p-value = 0.001). The indicator species analysis revealed that statistically significant indicator species were the presence/absence of S. triqueter in samples from 2019, M. senile in samples from 2020, and Pagurus spp. and P. miliaris in samples from 2022. When looking at indicator species shared between pairs of years, samples from 2019 to 2020 resulted to be significantly represented by Alcyonidium diaphanum and A. digitatum, samples from 2020 to 2022 by O. spp., and samples from 2019 to 2022 by Actiniaria spp.
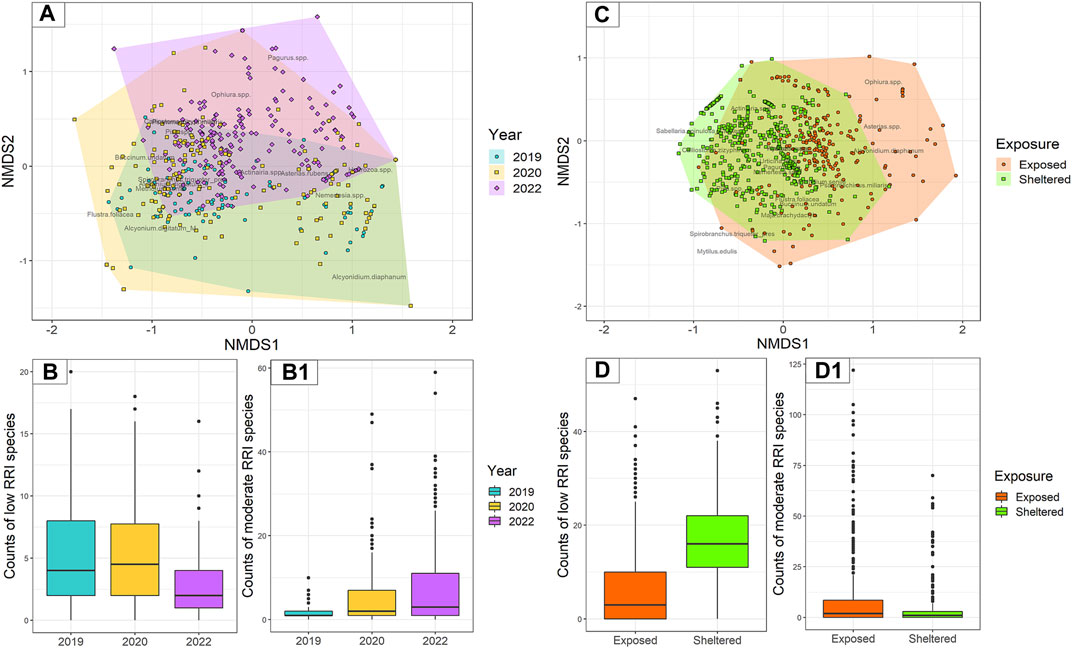
FIGURE 8. Species composition and observed abundances in underwater images were collected in the two study areas of the study. (A) Dissimilarities visualised by non-metric multidimensional scaling (nMDS) of samples coming from the Northwest area (n = 534). (C) Dissimilarities visualised by nMDS of samples coming from the Hinder Banks (n = 742). (B, B1) Boxplots of species abundances classified in low and moderate RRI observed in samples from the Northwest area (n = 534). (D, D1) Boxplots of species abundances classified in low and moderate RRI observed in randomly selected samples from the Hinder Banks (n = 742).
Counts of either species with low RRI scores or species with moderate RRI scores were summed to obtain abundances observed for each image, index, and year (Figure 8B). The number of images void of species with low RRI scores (the number of zeros) increased from 6% to 23% between 2019 and 2022. Similarly, the number of images void of species with moderate RRI scores increased from 15% to 25% between 2019 and 2022. Average abundances of species with low RRI scores significantly decreased in 2022 (p-value <0.0001), compared to 2020 and 2019 which had similar average abundances (p-value = 0.514). The average abundances of species with moderate RRI scores, on the other hand, significantly increased both in 2020 (p-value <0.0001) and in 2022 (p-value <0.0001) (Table 4).
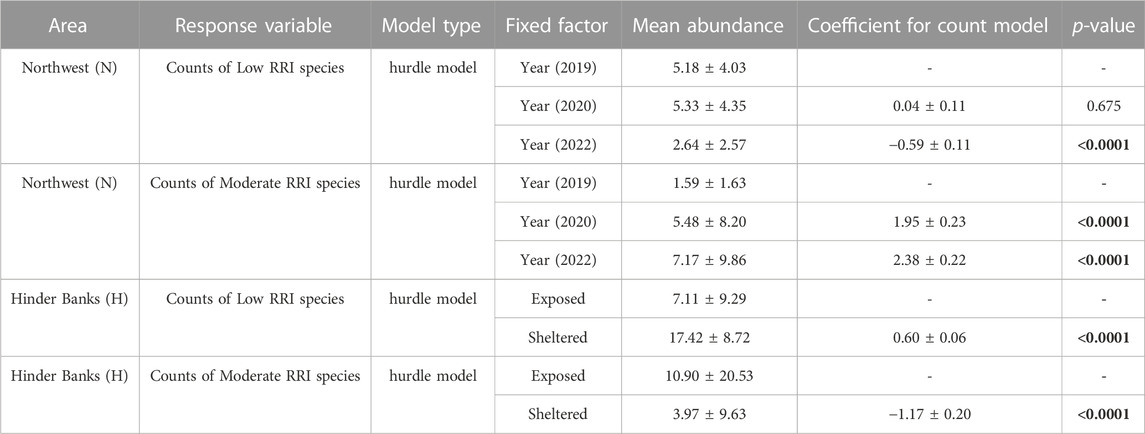
TABLE 4. ZANB regression models were used to describe changes in low RRI score and moderate RRI score species counts as a function of fishing pressure in time in the Northwest (N), and as a function of exposure to fishing due to geomorphology in the Hinder Banks (H). Mean abundances are presented as mean ± SD. Model coefficients for the count model part are presented as mean ± SE. The function hurdle belongs to the package pscl. Numbers in bold indicate values below the alpha threshold of p = 0.05.
A total of 742 images were processed from the underwater videos, from which 14,775 individual specimens were annotated (Table 2). Similar species to the Northwest area were observed in this area and four additional species (Table 3). Out of the 21 different species 7 were classified as having a low RRI score, 13 as moderate, and 1 as high (Table 3). Overall, 60% of the annotated taxa were from exposed locations and had moderate RRI. The remainder 40% were species with low RRI. In turn, the proportions of species in sheltered locations were divided into 18.5% moderate RRI species and 81% low RRI species. Species richness [was marginally lower in exposed locations (19 species) than in sheltered locations (20 species)].
The non-metric multidimensional scaling (nMDS) showed that species composition and abundances are only partially dissimilar and largely overlap (Figure 7C). However, several species communities from the locations exposed to bottom trawling showed higher dissimilarity than the rest of the cluster. In general, samples from exposed locations had a wider range of species composition and abundances. Statistically significant dissimilarities were detected with the ANOSIM between exposed and sheltered locations with an R2 of 0.4601 and a p-value = 0.001). The indicator species analysis revealed that statistically significant indicator species in samples from sheltered locations were Actiniaria spp., S. spinulosa (annotated as clusters), N. spp., presence/absence of S. triqueter, and Calliostoma zizyphinum, while A. rubens, P. miliaris, A. diaphanum and O. spp. were the indicator species in samples from exposed locations.
Counts of either species with low RRI scores or species with moderate RRI scores were summed to obtain abundances observed for each image, index, and exposure location (Figure 8D). The results of the modelling exercise on a subset of 180 samples (30 images per video transect/ROI) did not differ from the results of the full dataset, which was therefore considered and presented here. The number of images void of species with low RRI scores (number of zeros) was higher in exposed locations (27%) compared to sheltered locations (0.7%). Similarly, though less sharply, the number of images void of species with moderate RRI scores was higher in exposed locations (26%) compared to sheltered locations (17%). The average abundance of species with low RRI scores was significantly lower in exposed locations (p-value <0.0001), compared to sheltered locations. Conversely, the average abundance of species with moderate RRI score was higher in exposed locations (p-value <0.0001), compared to sheltered locations (Table 4).
The hierarchically spatially nested nature of the datasets used in our study allowed for an examination of the impact on SNHS biotopes from multiple perspectives, ranging from a bird’s-eye to a diver’s-eye point of view. Publicly available satellite-based fishing effort information proved to be of paramount importance, particularly considering the challenges associated with obtaining relevant information from Member States in a transparent and timely manner and at ecologically relevant spatial scales. Hydroacoustic surveying using MBES emerged as an ideal tool to ground truth satellite-derived information, and to assess the morpho-sedimentological impact of commercial fishing activities spatially explicitly and physically. In line with recent research, underwater photographic imagery is well suited to inspect fragile biotopes with low resilience and resistance to anthropogenic disturbances, providing a non-invasive means to collect relevant information.
The analysis of the satellite data on commercial fishing activities confirmed that both study areas were hotspots for bottom-contacting fishing activities, highlighting a concerning increase in fishing effort from demersal seines over time. This was particularly the case in the Northwest study site where an eightfold increase in the fishing effort was detected for 2022. The broad-scale patterns in the fishing effort were confirmed at the mesoscale by MBES hydroacoustic surveys which exposed an increasingly scarred seafloor (i.e., by ground-fishing trawl marks) smoothened in its geomorphological features. The investigating of trawl marks over time provided insights into the depth and persistence of disturbances on the seafloor. At the micro-scale, underwater imagery revealed altered SNHS benthic communities in locations heavily disturbed by bottom-contacting fishing gears. Overall, the results of our study uncovered a clear connection between the SNHS biotope integrity and its ecological functionality, and the main anthropogenic pressures in the study areas, including natural mechanisms of resilience and resistance. These findings have important implications and provide the necessary background information for discussions regarding the effectiveness of current management strategies for areas and habitats with conservation priorities. They underscore the need for adequate management measures to support the conservation and protection of these valuable marine ecosystems.
Between 2016 and 2022, both study sites experienced considerable commercial fishing pressure (Figure 3). These findings align with previous reports by Pecceu and co-workers (2021) covering the period 2013–2019 The quantification of spatiotemporal trends and patterns in fishing pressure corroborated the identification of the two study sites as hotspot areas with a significant commercial value within the Belgian EEZ (Figure 4).
The distribution and intensity of commercial fishing activities are dependent on a multitude of factors, minimally related to the dispersal range of the target species (Polet and Depstele, 2010), the “skipper’s choice” (Ludman et al., 2021), fishing quotas and Total Allowable Catches (TACs) (Rijnsdorp et al., 2008). Moreover, in the context of MSP, the designation of maritime areas as offshore wind farms and/or other anthropogenic or environmental conservation plans influences the fisheries’ behaviour. For example, in the framework of the current Belgian MSP (2020–2026), the Northwest site was designated as a search zone for biodiversity protection due to its high ecological value (Operational Directorate Natural Environment, 2018; Montereale Gavazzi et al., 2022). However, contradicting this designation, the same area was also designated for prospecting marine aggregate extraction. This conflicting designation might explain why a fishing hotspot exists here, where fisheries may intensify their activities until its planned closure in 2026 as outlined in the current Belgian MSP. Equally, the Hinder Bank region is designated for offshore wind farm development, hence conflicting with free-ranging fishing activities (Stelzenmüller et al., 2022) which will soon be prohibited in this area. The analysis conducted by Pecceu et al. (2021) consistently identified the study sites targeted in our investigation as having amongst the highest fishing intensities in terms of swept area ratio and the number of times trawled by location, (grid cell). The fishing effort was especially localised in the gullies (large-scale troughs) between sandbanks in the Hinder Banks site. This observation is in line with finding in Dutch waters reported by van der Reijden et al. (2018), and, additionally in the Northwesternmost side of the Northwest site. The combined analysis of the known spatial distribution of SNHS (Montereale Gavazzi et al., 2021; Van Lancker et al., 2023) and the fishing effort, demonstrated that approximately the entire SNHS coverage was impacted by commercial fishing activities during the period analysed (Figure 4C).Following a general decline in 2020, likely explained by the COVID-19 pandemic, the years 2021 and 2022 have seen the Northwest study site experiencing a more than two-fold fishing increase in fishing effort, the vast majority of which belongs to seiners (Figure 3). In fly shoot demersal seining, a large area of the seafloor is encircled by ropes that roll over the seafloor resuspending sediment and capturing the fish (Polet and Depestele, 2010; Pecceu et al., 2021). Fly shooters are considered to have one of the highest impacts on the seafloor together with bottom trawling gears as, despite ground gears being lighter, they affect a much larger area during the process (Eigaard et al., 2015; Rijnsdorp et al., 2020).
Since 2012, the Hinder Banks study site is designated as part of the MPA and HD area Vlaamse Banken, purposely designated as a zone for the environmental protection of noteworthy habitats such as geogenic and biogenic reefs (H1170) and sandbanks (H1110). Nevertheless, the area has been under chronic and considerable fishing pressure for several years, making it one of the most productive zones in terms of yield, landing weight and value (Pecceu et al., 2021). Although the total fishing effort has decreased over the past 2 years (2021–2022), due reduced activity from Dutch trawlers, there has been an increased fishing effort from seiners (Figure 3).
Based on recent investigations on the use of MBES data to characterise the seafloor’s footprint of bottom-disturbing commercial fishing gears (Bruns et al., 2020; Ludman et al., 2021; Schonke et al., 2022) as well as human activities in general (Madricardo et al., 2017), it is confirmed that high-frequency MBES data is highly effective for the accurate acknowledgement and spatially explicit characterisation of the physical (morpho sedimentary) impact at a mesoscale level.
The nature and intensity of the gear’s footprint on the physical environment are dependent on the gear type and its catching principle (Polet and Depestele, 2010; Ludman et al., 2021). The use of compensated backscatter imagery revealed distinct signatures in the form of long and parallel linear furrows at both study sites during the periods of peak fishing activity. These furrows are coinciding with patterns and trends identified from the satellite-based observations, confirming the reliability of the MBES as a validation tool for satellite observations.
The individual paired furrows have widths of ca. 5 m and an overall distance between them ranging from 30 to 36 m (Figures 5 A, A1, B, B1). Trawl marks are indicative of ploughed and incised sediment, resulting in scars with bathymetric depths of 2–10 cm, and distinctive high-low backscatter lineations (Ludman et al., 2021). It is important to note that reported trawl mark densities were dependent on the relative survey extent and coverage and should therefore be considered purely indicative. However, a clear increase in density was observed in the serial dataset available for the Northwest study site.
Following the analysis of commercial fishing activities in both the present investigation and the work of Pecceu et al. (2021), the observed trawl marks originate from large demersal seines (especially in the Northwest area) and beam trawls type of gears. The physical impact of these gears results in sediment compaction and lateral and vertical displacement across the entire width of the gear (Depestele et al., 2015). Notably, the overall area swept by demersal seines is considerably larger than that of the observable parallel furrows caused by the boards. To herd fish towards the nets, the weighted ground ropes extend and skim the seafloor for hundreds of metres around the sweeps and wings, causing important morpho sedimentary alterations such as the displacement of surficial sediments, incision of geomorphological features, and smoothening of small-scale bedforms e.g., tidal oscillatory micro-ripples, mega-ripples and/or biogenic structures, and, where present, the overturning of stones (Eigaard et al., 2015; Figure 7B).
Consistent with previous observations by Polet and Depestele (2010), and references therein), this process was visible in the serial MBES surveys conducted in the Northwest study site, where the backscatter imagery displayed distinct unaltered morphologies before the passage of the trawling gear and smoothed morphologies afterwards (Figures 5E, E1).
The alteration of the seafloor’s physical properties comes with characteristic hydroacoustic signatures whose geoacoustic interpretation conveys an understanding of the physical mechanisms of change. Changes in sediment composition are linked to the hydroacoustic characteristics of the water-sediment interface. In terms of MBES backscatter, this is modulated by the seafloor’s roughness, volume, and acoustic impedance contrast (including frequency and angle of incidence; Lurton, 2010). The extent of changes will depend on a combination of intrinsic factors such as the sediment type and thickness, the quantity of embedded bioclastic detritus and/or SNHS constituents, and bioturbation (Lurton, 2010; Ludman et al., 2021). Moreover, extrinsic factors such as gear weight, towing speed, and local hydrodynamic regime play a role in the hydroacoustic properties of the bottom-disturbing fishing impacts.
Regarding the visibility of the fishing gear traces, there exists a clear difference between the strength of the returning backscatter signal and their bathymetric expression. Backscatter has a higher discriminative power compared to bathymetry. Trawl marks result in distinct scattering intensities compared to the background acoustic values. They are clearly detectable within relatively soft mixed sediments and become hardly visible within areas of densely distributed SNHS, implying a lesser discriminative ability for highly reflective seafloor patches (Figures 5 C, C1). Changes in backscatter strength values result from the modification of the seafloor roughness where a portion of seafloor smoothed by the gear contributes to an increase in reflectivity (as observed from the analysis of angular responses [data not shown]; and in reference to the work of Ludman et al., 2021). This increase in reflectivity is particularly detectable in the nadir (or specular) backscatter angular region, resulting from the smoothing effect on the seafloor morphology.
According to the data used in this study, indicated a minimum conservation potential of trawl marks of 4 months (Figures 5 D, D1). It is important to state that the origin of the trawl marks detected in this investigation remains unknown and that the duration of these impacts, including elucidating the mechanisms and degree to which the seafloor physical integrity recovers, requires further investigation.
The surface and subsurface physical alterations described above have the potential to significantly affect the living conditions of the benthic community, particularly within the SNHS biotope where several species have morphologies and life traits that renders them especially vulnerable to habitat loss and disturbance.
By providing a hard substrate in an otherwise sand-dominated environment, stony reefs represent areas suitable for a multitude of species that cannot grow elsewhere in the BPNS (Houziaux et al., 2008a). Rich macrobenthic and epibenthic communities characterise the SNHS biotope, including several epilithic, sessile species that show specific traits: slow and vertically growing, arborescent, and/or long-living. Amongst these, and as detected in the underwater imagery used in our study (Table 3; Figure 7) are key species of conservation importance such as S. spinulosa, S. triqueter, Flustra foliacea, A. digitatum, A. diaphanum, Buccinum undatum, and Nemertesia antennina and ramosa. The habitat complexity and heterogeneity created by the substrate along with the three-dimensional life-forms, provide essential habitat to some egg-laying species (e.g., elasmobranchs, cephalopods) and vulnerable juveniles of species such as lobsters, crabs, herring from higher trophic levels (Wahl, 2009; Wilms, 2021). While they were not included in the ecological analysis, some of these noteworthy species were indeed observed in the underwater imagery (see Chapter 3.3 in the Results section). Therefore, areas with SNHS coverage represent areas of high biological value in the BPNS, as identified by Pecceu et al., 2021, and are of high priority in terms of conservation and restoration. However, the physical features of SNHS environments, as well as the morphological and biological characteristics of the associated fauna, make the biotope as highly sensitive, with low resilience and resistance to bottom disturbance, particularly to trawling (Houziaux et al., 2011). Consequently, de majority of species observed in SNHS were classified as having very low, low, or moderate resistance to fishing pressure, as well as exhibiting low or moderate recovery potential as assessed by a combined RRI index (Table 3).
The functional trait-based methodology adapted from the work of Hinz et al. (2021) allowed to link the community compositional changes to implications on the ecological structure, function, and integrity. This approach enabled the documentation of a significant loss of epilithic, long-living, and habitat-forming taxa that are of major conservation importance. The methodology developed by Hinz and co-authors (2021) produces an index that is especially suited to evaluate species-level vulnerability to trawling based on life traits and morphologies. Global research on benthic communities is increasingly more focused on the study of trait-dependent impacts, as these enable capturing the effects on the ecosystem at a functional level (i.e., its functional integrity), rather than being limited to the structural degree of degradation (e.g., Bolam et al., 2017). By applying this classification to the benthic communities observed in the two study areas, changes in composition and abundances of species with low and moderate RRI could be linked to functional changes in the SNHS ecosystem driven by fishing pressure-induced modifications in ecosystem structure. Our results highlighted the value of trait-based modelling as a tool to focus on functional diversity rather than structural diversity (Zakharova et al., 2019).
Noticeably, marginal differences in species richness between sheltered and exposed locations hid significant differences in species assemblages, covering key functions in terms of ecological integrity.
In both study sites, we observed a significant decrease in low RRI species abundance in response to higher exposure to fishing pressure, which was counterbalanced by a significant increase in moderate RRI species (Figure 7). The Northwest study site was recognised as an SNHS biotope in 2018 reflecting its seemingly undisturbed ecological conditions. This was evident from the widespread (∼200/80 m2) presence of mature colonies of the soft coral Dead man’s finger (A. digitatum) (Montereale Gavazzi et al., 2021). However, in 2022 we found a significant increase in low RRI species, coinciding with the noticeable increase in fishing effort, and the widespread appearance of trawl marks as revealed by our analysis of MBES imagery (Figure 6). Here, as visible from the nMDS and ANOSIM analyses, the benthic community has undergone significant changes over time. The changes can be explained by a significant increase in the abundance of species with moderate RRI scores, particularly opportunistic and/or scavenging species, such as Pagurus spp. and Ophiura spp. This evolution points to a severely disturbed environment.
In the Hinder Banks study site, we could identify surveyed locations as directly exposed to or sheltered from ground-fishing activities based on their geomorphological context (Figure 2). Based on the hydroacoustic imagery, most trawl marks were observed at exposed locations, specifically within the large-scale troughs alternating with the sandbanks. On the other hand, sheltered locations were found in the troughs between sandbanks, at the foot side, and alternating between systems of barchan and barchanoid dunes. The specific geomorphology renders these areas inaccessible for bottom-contacting fishing gears which ‘jump’ them when trawling over the seafloor (Houziaux et al., 2008a; Van der Reijden et al., 2019). This geomorphological setting has been previously recognised to as SNHS biotope “refugia”, underscoring the role of geomorphology as a natural safeguarding mechanism (Houziaux et al., 2008a). Similar observations were made by Van der Reijden and co-workers (2019) in Dutch waters, where S. spinulosa reef formations were observed within trough morphologies at an intensely fished location. This mechanism enables colonisation of the larger stones by the typical benthic fauna (Michaelis et al., 2019a, b), which are otherwise absent in areas exposed to fishing gears.
Sheltered refugia locations play vital ecological roles. They act as source and sink metapopulations of SNHS communities, provide larval supply, and serve as steppingstones for dispersal and connectivity (Papenmeier et al., 2020). Therefore, these areas are crucial for the restoration of SNHS biotopes and provide the unique basis for the replication of the preconditions necessary to achieve a good ecological status. Our ecological statistical analysis clearly indicated that sheltered locations have significantly higher abundances of low RRI tax characterised by the occurrence of adult, sessile, arborescent, epilithic, and reef-forming fauna such as S. spinulosa, S. triqueter, N. spp. and M. senile. In contrast, exposed locations exhibited higher abundances of moderate to high RRI species (Figure 7), mostly in their juvenile form.
While natural causes cannot be completely ruled out, further investigation is necessary to fully understand the natural variability of these highly dynamic environments. The Northwest area, and the offshore BPNS, is particularly influenced by extreme hydrometeorological events with year-round turbulent spells of weather. Striking is the observation that widespread, mature, and full-fledged colonies of long-lived epilithic (>5 years) taxa such as A. digitatum (consistently observed by video during 2019 and 2020) can withstand extreme weather events in this area, such as Atlantic storms Ellen and Francis (19th to 25th August 2020), representative of the most significant events occurring in the Channel over the past 50 years (The Meteorological Office, 2023; https://www.metoffice.gov.uk/weather/learn-about/past-uk-weather-events). Furthermore, a comparative analysis of serial MBES bathymetry and backscatter datasets revealed the high stability of the SNHS patches in this seafloor area. The characteristic backscatter signatures of trawl marks only appeared in 2022, clearly linked with the satellite-based observations. It is thus reasonable to link the sudden disappearance of such a biotope with the significant increase in bottom-disturbing fishing events, which underscores the need for imminent management actions. Accordingly, in the Hinder Banks area, the observed degree of degradation in the areas exposed to fishing pressure is consistent with the negative effects associated with chronic bottom-disturbing fisheries observed elsewhere (e.g., Collie J. S. et al., 2000; Bradshaw et al., 2001; Kaiser et al., 2001; Tillin et al., 2006; Neumann et al., 2016; Hinz et al., 2021).
The surveying methodology and procedural workflows presented in our investigation demonstrate the value of combining minimally invasive remote sensing technologies particularly in rapidly changing marine environments and provide indispensable, comprehensive, and concrete information pertaining to the ecological status of fragile and conservation-priority biotopes.
The results of our investigation strongly indicate that the management and protection of critical ecological biotopes are currently ineffective, leading to severe repercussions for the overall structure and functioning of marine ecosystems, not only locally but potentially elsewhere. This failure hampers the effective achievement of GES mandated by EU environmental policies. Our investigations point to severely degraded SNHS biotopes, that spatially and temporally correlate with observed patterns of free-ranging and unrestricted bottom-disturbing fishing activities. Both study areas experienced a year-round and significant direct anthropogenic disturbance. Under such sustained pressure, these fragile biotopes cannot recover.
The datasets and results of this study provide background information to scientifically guide decision-making processes regarding conservation measures and adequate implementation of environmental policies. The concept of HD as nature reserves is crucial to ensure a healthy marine ecosystem. However, to make environmental protection a concrete reality, legal enforcement is required. The Belgian HD currently stands far from what the legislative framework mandates, with the main responsible agents being a chronic and unmanaged presence of free-ranging bottom-disturbing commercial fishing activities, compounded by plans for the construction of extensive offshore wind farms (Degraer et al., 2023). In the absence of a truly integrative ecosystem-based management approach, legal enforcement, and active restoration, the function of a marine protected area will inevitably fail, compromising crucial ecological functions.
The original contributions presented in the study are included in the article/Supplementary Material, further inquiries can be directed to the corresponding authors.
GM: Conceptualization, Data curation, Formal Analysis, Supervision, Writing–original draft, Investigation, Visualization. SP: Conceptualization, Data curation, Formal Analysis, Writing–original draft, Visualization. PP: Formal Analysis, Writing–review and editing. D-AK: Data curation, Writing–review and editing. FK: Formal Analysis, Writing–review and editing, Supervision.
This work is a contribution to the National Belgian Habitat Directive, Common Fisheries Policy, and Marine Strategy Framework Directive monitoring programs on seafloor integrity (D6), and biodiversity and benthic habitats (D1) for natural hard substrate benthic communities. Ship time RV Belgica was provided by BELSPO and RBINS–OD Nature. The authors are very grateful for the collaboration of the vessel’s crew (Genavir), and the navigation officers (Belgian Navy). Flanders Marine Institute (VLIZ) is acknowledged for the use of the video frame and for the extensive technical support provided by Michael T’Jampens.
The authors declare that the research was conducted in the absence of any commercial or financial relationships that could be construed as a potential conflict of interest.
All claims expressed in this article are solely those of the authors and do not necessarily represent those of their affiliated organizations, or those of the publisher, the editors and the reviewers. Any product that may be evaluated in this article, or claim that may be made by its manufacturer, is not guaranteed or endorsed by the publisher.
The Supplementary Material for this article can be found online at: https://www.frontiersin.org/articles/10.3389/fenvs.2023.1253932/full#supplementary-material
Ashley, G. M. (1990). Classification of large-scale subaqueous bedforms; a new look at an old problem. J. Sediment. Res. 60, 160–172. doi:10.2110/JSR.60.160
Becker, L. R., Bartholomä, A., Singer, A., Bischof, K., Coers, S., and Kröncke, I. (2020). Small-scale distribution modeling of benthic species in a protected natural hard ground area in the German North Sea (Helgoländer Steingrund). Geo-Marine Lett. 40 (2), 167–181. doi:10.1007/s00367-019-00598-8
Bolam, S. G., Coggan, R. C., Eggleton, J., Diesing, M., and Stephens, D. (2014). Sensitivity of macrobenthic secondary production to trawling in the English sector of the Greater North Sea: A biological trait approach. J. Sea Res. 85, 162–177. doi:10.1016/j.seares.2013.05.003
Bolam, S. G., Garcia, C., Eggleton, J., Kenny, A. J., Buhl-Mortensen, L., Gonzalez-Mirelis, G., et al. (2017). Differences in biological traits composition of benthic assemblages between unimpacted habitats. Mar. Environ. Res. 126, 1–13. http://doi:10.1016/j.marenvres.2017.01.004
Bradshaw, C., Veale, L. O., Hill, A. S., and Brand, A. R. (2001). The effect of scallop dredging on Irish sea benthos: Experiments using a closed area. Hydrobiologia 465, 129–138. doi:10.1023/A:1014573731609
Bruns, I., Holler, P., Capperucci, R. M., Papenmeier, S., and Bartholomä, A. (2020). Identifying trawl marks in north sea sediments. Geosciences 10 (11), 422. doi:10.3390/geosciences10110422
Collie, J. S., Escanero, G. A., and Valentine, P. C. (2000b). Photographic evaluation of the impacts of bottom fishing on benthic epifauna. ICES J. Mar. Sci. 57 (4), 987–1001. doi:10.1006/jmsc.2000.0584
Collie, J. S., Hall, S. J., Kaiser, M. J., and Poiner, I. R. (2000a). A quantitative analysis of fishing impacts on shelf-sea benthos. J. Animal Ecol. 69 (5), 785–798. doi:10.1046/j.1365-2656.2000.00434.x
Council Directive, (1992). Eec of 21 may 1992 on the conservation of natural habitats and of wild fauna and flora. consil, 206 oj l. http://data.europa.eu/eli/dir/1992/43/oj/eng.
De Cáceres, M., and Legendre, P. (2009). Associations between species and groups of sites: Indices and statistical inference. Ecology 90, 3566–3574. doi:10.1890/08-1823.1
De Juan, S., Hewitt, J., Thrush, S., and Freeman, D. (2015). Standardising the assessment of Functional Integrity in benthic ecosystems. J. Sea Res. 98, 33–41. http://doi:10.1016/j.seares.2014.06.001
Degraer, S., Brabant, R., and Vanaverbeke, J. (2023). “Eden 2000 – exploring options for a nature-proof development of offshore wind farms inside a Natura 2000 area,” in Memoirs on the marine environment Brussels, Belgium: Royal Belgian Institute of Natural Sciences, OD Natural Environment, Marine Ecology and Management, 440.
Depestele, J., Ivanovic, A., Degrendele, K., Esmaeili, M., Polet, H., Roche, M., et al. (2015). Measuring and assessing the physical impact of beam trawling. ICES J. Mar. Sci. 73, i15–i26. doi:10.1093/icesjms/fsv056
Directive, (2008). EC of the European Parliament and of the Council of 17 June 2008 establishing a framework for community action in the field of marine environmental policy (Marine Strategy Framework Directive) (Text with EEA relevance). EP, CONSIL, 164 OJ L. http://data.europa.eu/eli/dir/2008/56/oj/eng.
Dunn, D. C., Jablonicky, C., Crespo, G. O., McCauley, D. J., Kroodsma, D. A., Boerder, K., et al. (2018). Empowering high seas governance with satellite vessel tracking data. Fish Fish. 19 (4), 729–739. doi:10.1111/faf.12285
Eigaard, O. R., Bastardie, F., Breen, M., Dinesen, G. E., Hintzen, N. T., Laffargue, P., et al. (2016). Estimating seabed pressure from demersal trawls, seines, and dredges based on gear design and dimensions. ICES J. Mar. Sci. 73, i27–i43. doi:10.1093/icesjms/fsv099
Eigaard, O. R., Bastardie, F., Hintzen, N., Buhl-Mortensen, L., Buhl-Mortensen, P., Catarino, R., et al. (2015). Benthic impact of fisheries in european waters: the distribution and intensity of bottom trawling. https://archimer.ifremer.fr/doc/00310/42138/.
European Commission, (2023). Communication from the-commission to the european parliament and the council; the common fisheries policy today and tomorrow: A fisheries pact towards sustainable, science-based, innovative and inclusive fisheries management com, 103. final [Data set]. doi:10.1163/2210-7975_HRD-4679-0058
Fournier, M., Casey Hilliard, R., Rezaee, S., and Pelot, R. (2018). Past, present, and future of the satellite-based automatic identification system: Areas of applications (2004–2016). WMU J. Marit. Aff. 17 (3), 311–345. doi:10.1007/s13437-018-0151-6
Global Fish Watch Gfw, Global Fish Watch (2023. https://globalfishingwatch.org/(accessed on 21/06/2023.
Hiddink, J. G., Jennings, S., Sciberras, M., Szostek, C. L., Hughes, K. M., Ellis, N., et al. (2017). Global analysis of depletion and recovery of seabed biota after bottom trawling disturbance. Proc. Natl. Acad. Sci. 114 (31), 8301–8306. doi:10.1073/pnas.1618858114
Hinz, H., Törnroos, A., and de Juan, S. (2021). Trait-based indices to assess benthic vulnerability to trawling and model loss of ecosystem functions. Ecol. Indic. 126, 107692. doi:10.1016/j.ecolind.2021.107692
Holme, N. A., and Wilson, J. B. (1985). Faunas associated with longitudinal furrows and sand ribbons in a tide-swept area in the English channel. J. Mar. Biol. Assoc. United Kingdom. 65, 1051–1072. doi:10.1017/s0025315400019500
Houziaux, J.-S., Fettweis, M., Francken, F., and Van Lancker, V. (2011). Historic (1900) seafloor composition in the Belgian–Dutch part of the North Sea: A reconstruction based on calibrated visual sediment descriptions. Cont. Shelf Res. 31 (10), 1043–1056. doi:10.1016/j.csr.2011.03.010
Houziaux, J.-S., Fettweis, M., Francken, F., and van Lancker, V. (2011). Historic (1900) seafloor composition in the Belgian–Dutch part of the North Sea: A reconstruction based on calibrated visual sediment descriptions. Cont. Shelf Res. 31, 1043–1056. doi:10.1016/j.csr.2011.03.010
Houziaux, J.-S., Haelters, J., and Kerckhof, F. (2008b). Facts from history - the former ecological value of gravel grounds in Belgian marine waters: Their importance for biodiversity and relationship with fisheries. http://www.vliz.be/imisdocs/publications/135511.pdf.
Houziaux, J.-S., Haelters, J., and Kerckhof, F. (2007). “Facts from history: The former ecological value of gravel grounds in Belgian marine waters: Their importance for biodiversity, the relationship with fisheries,” in ICES marine habitat committee (Copenhagen, Denmark: Report of the Study Group on Biodiversity Science (SGBIODIV), 9-11 May 2007 VLIZ, Belgium; ICES). Volume 8.
Houziaux, J.-S., Kerckhof, F., Degrendele, K., Roche, M., and Norro, A. (2008a). The hinder Banks: Yet an important area for the Belgian marine biodiversity?, Belgian science policy. Brussels, Belgium, 259.
Irving, R. (2009). “Summary report of an inter-agency workshop 26–27 March,” in The identification of the main characteristics of stony reef habitats under the habitats directive (Peterborough, UK: JNCC), 42.
Jackman, S. (2020). pscl: Classes and methods for R developed in the political science computational laboratory. Sydney, New South Wales, Australia: United States Studies Centre, University of Sydney. R package version 1.5.5.1 https://github.com/atahk/pscl/.
Kaiser, M., Clarke, K., Hinz, H., Austen, M., Somerfield, P., and Karakassis, I. (2006). Global analysis of response and recovery of benthic biota to fishing. Mar. Ecol. Prog. Ser. Mar. ECOLOGY-PROGRESS Ser. 311, 1–14. doi:10.3354/meps311001
Kaiser, M. J., Collie, J. S., Hall, S. J., Jennings, S., and Poiner, I. R. (2001). “Impacts of fishing gear on marine benthic habitats,” in Proceedings of the Abstracts of papers presented at the reykjavik conference on responsible fisheries in the marine ecosystem, reykjavik, Iceland, 1-4 october 2001, 19. FAO Fisheries Report No. 658 .
Kaiser, M. J., Collie, J. S., Hall, S. J., Jennings, S., and Poiner, I. R. (2002). Modification of marine habitats by trawling activities: Prognosis and solutions. Fish Fish. 3 (2), 114–136. doi:10.1046/j.1467-2979.2002.00079.x
Kerckhof, F., and Houziaux, J.-S. (2003). Biodiversity of the Belgian marine areas. Brussels, Belgium Royal Belgian Institute of Natural Sciences.
Lacey, L. M., and Nelson, J. K. (2023). Using geovisual analytics to enrich conservation science: a review of interactive visualisation of wildlife and environmental spatial data across ecosystems. International Journal of Cartography 9 (3327), 1–33. doi:10.1080/23729333.2023.2190628
Lamarche, G., and Lurton, X. (2018). Recommendations for improved and coherent acquisition and processing of backscatter data from seafloor-mapping sonars. Mar. Geophys. Res. 39, 5–22. doi:10.1007/s11001-017-9315-6
Ludmann, T., Saitz, Y. M., Metzing, J., and Emeis, K. C. (2021). Acoustic backscatter analysis of ground-fishing activity in the German North Sea sector. Cont. Shelf Res. 212, 104292. doi:10.1016/j.csr.2020.104292
Lurton, X. (2010). Principles and applications. 3rd ed. Berlin Heidelnerg: Springer Verlag Praxis Books and Praxis Publishing.An introduction to underwater acoustics
Madricardo, F., Foglini, F., Kruss, A., Ferrarin, C., Pizzeghello, N. M., Murri, C., et al. (2017). High resolution multibeam and hydrodynamic datasets of tidal channels and inlets of the Venice Lagoon. Sci. Data 4, 170121. doi:10.1038/sdata.2017.121
Marcon, Y., and Purser, A. (2017). Papara (ZZ) I: An open-source software interface for annotating photographs of the deep sea. SoftwareX 6, 69–80. doi:10.1016/j.softx.2017.02.002
Marine Spatial Planning, (2020). Something is moving at sea. Federal public service Health, Food chain safety and environment. Washington, D.C, USA Service Marine Environment.
McArthur, M., Brooke, B., Przeslawski, R., Ryan, D., Lucieer, V., Nichol, S., et al. (2010). On the use of abiotic surrogates to describe marine benthic biodiversity. Estuar. Coast. Shelf Sci. 88, 21–32. doi:10.1016/j.ecss.2010.03.003
McLaverty, C., Eigaard, O. R., Olsen, J., Brooks, M. E., Petersen, J. K., Erichsen, A. C., et al. (2023). European coastal monitoring programmes may fail to identify impacts on benthic macrofauna caused by bottom trawling. J. Environ. Manag. 334, 117510. doi:10.1016/j.jenvman.2023.117510
Mengual, B., Cayocca, F., Le Hir, P., Draye, R., Laffargue, P., Vincent, B., et al. (2016). Influence of bottom trawling on sediment resuspension in the “Grande-Vasière” area (Bay of Biscay, France). Ocean. Dyn. 66 (9), 1181–1207. doi:10.1007/s10236-016-0974-7
Michaelis, R., Hass, H. C., Mielck, F., Papenmeier, S., Sander, L., Ebbe, B., et al. (2019). Hard-substrate habitats in the German Bight (South-Eastern North Sea) observed using drift videos. J. Sea Res. 144, 78–84. doi:10.1016/j.seares.2018.11.009
Montereale Gavazzi, G., Kapasakali, D. A., Kerchof, F., Deleu, S., Degraer, S., and Van Lancker, V. (2021). Subtidal natural hard substrate quantitative habitat mapping: Interlinking underwater acoustics and optical imagery with machine learning. Remote Sens. 13 (22), 4608. Article 22. doi:10.3390/rs13224608
Montereale Gavazzi, G., Kapasakali, D., Kerckhof, F., Van Lancker, F., Pecceu, E., et al. (2022). Geological and biological habitat mapping conference (geohab 2022). Exploring natural hard-substrate habitat in Belgian waters: A case study on a recently discovered hotspot [powerpoint presentation] Italy: Metropolitan City of Venice, 16–20.
Montereale-Gavazzi, G., Degraer, S., and Van Lancker, V. (2023). “Chapter 1. Predictive modelling of seafloor surficial gravel distribution within a new wind farm concession area: Belgian part of the North Sea,” in Eden 2000–exploring options for a nature-proof development of offshore wind farms inside a Natura 2000 area. Memoirs on the Marine Environment. Editors S. Degraer, R. Brabant, and J. Vanaverbeke (Brussels, Belgium: Royal Belgian Institute of Natural Sciences, OD Natural Environment, Marine Ecology and Management), 440.
Montereale-Gavazzi, G. (2019). Marine management. Application of seafloor backscatter by multibeam echosounders. Ph.D. Thesis. Ghent, Belgium: Ghent University.Development of seafloor mapping strategies supporting integrated.
Neumann, H., Diekmann, R., and Kröncke, I. (2016). Functional composition of epifauna in the south-eastern North Sea in relation to habitat characteristics and fishing effort. Coast. Shelf Sci. 169, 182–194. doi:10.1016/j.ecss.2015.12.011
Oberle, F. K., Storlazzi, C. D., and Hanebuth, T. J. (2016). What a drag: Quantifying the global impact of chronic bottom trawling on continental shelf sediment. J. Mar. Syst. 159, 109–119. doi:10.1016/j.jmarsys.2015.12.007
O’Neill, F., and Ivanovic, A. (2015). The physical impact of towed demersal fishing gears on soft sediments. ICES J. Mar. Sci. 73, i5–i14. doi:10.1093/icesjms/fsv125
Operational Directorate Natural Environment, (2018). Belgian science policy. RV Belgica Cruise 2018/17 - Cruise Report https://odnature.naturalsciences.be/downloads/belgica/campaigns/reports/re2018_17.pdf.
Operational Directorate Natural Environment, (2020). Herziening van het monitoringsprogramma voor de Belgische mariene wateren (Art. 11). https://odnature.naturalsciences.be/msfd/nl/monitoring/2020/.
Papenmeier, S., Darr, A., Feldens, P., and Michaelis, R. (2020). Hydroacoustic mapping of geogenic hard substrates: Challenges and review of German approaches. Geosciences 10 (3), 100. doi:10.3390/geosciences10030100
Pecceu, E., Paoletti, S., Van Hoey, G., Vanelslander, B., Verlé, K., Degraer, S., et al. (2021).,.Scientific Background Report In Preparation Of Fisheries Measures To Protect The Bottom Integrity And The Different Habitats Within The Belgian Part Of The North Sea. Geneva, Switzerland .ILVO Meded Flanders Research Institute for Agriculture, Fisheries and Food: Ostend. 277. 195.
Pitcher, C. R., Hiddink, J. G., Jennings, S., Collie, J., Parma, A. M., Amoroso, R., et al. (2022). Trawl impacts on the relative status of biotic communities of seabed sedimentary habitats in 24 regions worldwide. Proc. Natl. Acad. Sci. 119 (2), e2109449119. doi:10.1073/pnas.2109449119
Polet, H., and Depestele, J. (2010). Impact Assessment Of The Effect Of A Selected Range Of Fishing Gears In The North Sea. Geneva, Switzerland ILVO.
Porskamp, P., Schimel, A. C., Young, M., Rattray, A., Ladroit, Y., and Ierodiaconou, D. (2022). Integrating multibeam echosounder water-column data into benthic habitat mapping. Limnol. Oceanogr. 67 (8), 1701–1713. doi:10.1002/lno.12160
Rijnsdorp, A. D., Hiddink, J. G., van Denderen, P. D., Hintzen, N. T., Eigaard, O. R., Valanko, S., et al. (2020). Different bottom trawl fisheries have a differential impact on the status of the North Sea seafloor habitats. ICES J. Mar. Sci. 77, 1772–1786. doi:10.1093/icesjms/fsaa050
Rijnsdorp, A. D., Poos, J. J., Quirijns, F. J., HilleRisLambers, R., De Wilde, J. W., and Den Heijer, W. M. (2008). The arms race between Fishers. J. Sea Res. 60 (1-2), 126–138. doi:10.1016/j.seares.2008.03.003
Roche, M., Degrendele, K., Vrignaud, C., Loyer, S., Le Bas, T., Augustin, J.-M., et al. (2018). Control of the repeatability of high-frequency multibeam echosounder backscatter by using natural reference areas. Mar. Geophys. Res. 39, 89–104. doi:10.1007/s11001-018-9343-x
Romoth, K., Darr, A., Papenmeier, S., Zettler, M. L., and Gogina, M. (2023). Substrate heterogeneity as a trigger for species diversity in marine benthic assemblages. Biology 12 (6), 825. Article 6. doi:10.3390/biology12060825
Rstudio Team, (2020). RStudio. Boston, Massachusetts, USA: Integrated Development for R. RStudio, PBC.
Schimel, A. C. G., Beaudoin, J., Parnum, I. M., Le Bas, T., Schmidt, V., Keith, G., et al. (2018). Multibeam sonar backscatter data processing. Mar. Geophys. Res. 39, 121–137. doi:10.1007/s11001-018-9341-z
Schönke, M., Clemens, D., and Feldens, P. (2022). Quantifying the physical impact of bottom trawling based on high-resolution bathymetric data. Remote Sens. 14 (12), 2782. doi:10.3390/rs14122782
Sciberras, M., Hiddink, J. G., Jennings, S., Szostek, C., Hughes, K. M., Kneafsey, B., et al. (2018). Response of benthic fauna to experimental bottom fishing: A global meta-analysis. Fish Fish. 19 (4), 698–715. doi:10.1111/faf.12283
Seto, K. L., Miller, N. A., Kroodsma, D., Hanich, Q., Miyahara, M., Saito, R., et al. (2023). Fishing through the cracks: The unregulated nature of global squid fisheries. Sci. Adv. 9 (10), eadd8125. doi:10.1126/sciadv.add8125
Sheehan, E., Cousens, S., Nancollas, S., Stauss, C., Royle, J., and Attrill, M. (2013a). Drawing lines at the sand: Evidence for functional vs. visual reef boundaries in temperate Marine Protected Areas. Mar. Pollut. Bull. 76, 194–202. doi:10.1016/j.marpolbul.2013.09.004
Sheehan, E. V., Bridger, D., and Attrill, M. J. (2015). The ecosystem service value of living versus dead biogenic reef. Coast. Shelf Sci. 154, 248–254. doi:10.1016/j.ecss.2014.12.042
Sheehan, E. V., Stevens, T. F., Gall, S. C., Cousens, S. L., and Attrill, M. J. (2013b). Recovery of a temperate reef assemblage in a marine protected area following the exclusion of towed demersal fishing. PLoS ONE 8, e83883. doi:10.1371/journal.pone.0083883
Staat, Belgische (2018). “Actualisatie van de initiële beoordeling voor de Belgische mariene wateren. Kaderrichtlijn Mariene Strategie – art 8 lid 1a & 1b,” in BMM, federale overheidsdienst volksgezondheid (Brussel, Belgium: Veiligheid van de Voedselketen en Leefmilieu), 243.
Stelzenmüller, V., Letschert, J., Gimpel, A., Kraan, C., Probst, W. N., Degraer, S., et al. (2022). From plate to plug: The impact of offshore renewables on European fisheries and the role of marine spatial planning. Renew. Sustain. Energy Rev. 158, 112108. doi:10.1016/j.rser.2022.112108
Tillin, H. M., Hiddink, J. G., Jennings, S., and Kaiser, M. J. (2006). Chronic bottom trawling alters the functional composition of benthic invertebrate communities on a sea-basin scale. Mar. Ecol. Prog. Ser. 318, 31–45. doi:10.3354/meps318031
Van den Eynde, D. (2023). “Chapter 3. Maximum bottom stresses and other hydrodynamic parameters in the Princess Elisabeth offshore wind farm zone (Belgium),” in Eden 2000 – exploring options for a nature-proof development of offshore wind farms inside a Natura 2000 area. Memoirs on the Marine Environment. Editors S. Degraer, R. Brabant, and J. Vanaverbeke (Brussels, Belgium: Royal Belgian Institute of Natural Sciences, OD Natural Environment, Marine Ecology and Management), 440.
van der Reijden, K. J., Koop, L., O’Flynn, S., Garcia, S., Bos, O., van Sluis, C., et al. (2019). Discovery of Sabellaria spinulosa reefs in an intensively fished area of the Dutch continental shelf, North Sea. J. Sea Res. 144, 85–94. doi:10.1016/j.seares.2018.11.008
Van Hoey, G., Depestele, J., and Hostens, K. (2020). Possible Effects On Benthic Ecosystems Of Fishery Exclusion, A Review In The Frame Of Windmill Farms. Geneva, Switzerland Partim sand Habitats. ILVO Meded. 260.
Van Lancker, V., Du Four, I., Verfaillie, E., Deleu, S., Schelfaut, K., Fettweis, M., et al. (2007). Management, Research And Budgetting Of Aggregates In Shelf Seas Related To End-Users (Marebasse). Brussels, Belgium. Sci. Policy. D/2007/1191/49). 139 pp. + DVD GIS@SEA + Habitat Signature Catalogue.
Van Lancker, V., Kint, L., and Montereale Gavazzi, G. (2023). Multi-scale, process-based map of seafloor surface sediments of the Belgian part of the North Sea. Map production and Exploratory note. Brussels, Belgium Royal Belgian Institute of Natural Sciences.
van Loen, H., and Houziaux, J.-S. (2002). The collection Gilson as a reference framework for the Belgian marine fauna: A feasibility study. Final Rep. Belg. Sci. Police. 41 OSTCMN/36/94, 41 p.+app.
Veenstra, H. (1969). Gravels of the Southern North Sea. Mar. Geol. 7, 449–464. doi:10.1016/0025-3227(69)90017-6
Wahl, M. (2009). Marine hard bottom communities: Patterns, dynamics, diversity, and change. Dordrecht, Netherlands; New York, NY, USA: Springer Ecological Studies, 1–420. Volume 206.
Wilms, T. (2021). Restoration and non-invasive monitoring of geogenic reefs in temperate waters. Denmark DTU Aqua.
Zakharova, L., Meyer, K. M., and Seifan, M. (2019). Trait-based modelling in ecology: A review of two decades of research. Ecol. Model. 407, 108703. doi:10.1016/j.ecolmodel.2019.05.008
Zeileis, A., Kleiber, C., and Jackman, S. (2008). Regression models for count data in R. J. Stat. Softw. 27 1-25. (8). doi:10.18637/jss.v027.i08http://www.jstatsoft.org/v27/i08/
Keywords: stony reefs, fishing impact, hydroacoustics, underwater video, ecological status, conservation, environmental policy
Citation: Montereale Gavazzi G, Paoletti S, Podholova P, Kapasakali D-A and Kerckhof F (2023) Protected yet unmanaged: insights into the ecological status of conservation priority stony reefs in Belgian waters based on the integrative use of remote sensing technologies. Front. Environ. Sci. 11:1253932. doi: 10.3389/fenvs.2023.1253932
Received: 06 July 2023; Accepted: 05 September 2023;
Published: 18 September 2023.
Edited by:
Luis Gomez, University of Las Palmas de Gran Canaria, SpainReviewed by:
Susana França, Center for Marine and Environmental Sciences (MARE), PortugalCopyright © 2023 Montereale Gavazzi, Paoletti, Podholova, Kapasakali and Kerckhof. This is an open-access article distributed under the terms of the Creative Commons Attribution License (CC BY). The use, distribution or reproduction in other forums is permitted, provided the original author(s) and the copyright owner(s) are credited and that the original publication in this journal is cited, in accordance with accepted academic practice. No use, distribution or reproduction is permitted which does not comply with these terms.
*Correspondence: Giacomo Montereale Gavazzi, Z29hLm1vbnRlcmVhbGUuZ2F2YXp6aUBnbWFpbC5jb20=; Silvia Paoletti, c3Bhb2xldHRpQG5hdHVyYWxzY2llbmNlcy5iZQ==
Disclaimer: All claims expressed in this article are solely those of the authors and do not necessarily represent those of their affiliated organizations, or those of the publisher, the editors and the reviewers. Any product that may be evaluated in this article or claim that may be made by its manufacturer is not guaranteed or endorsed by the publisher.
Research integrity at Frontiers
Learn more about the work of our research integrity team to safeguard the quality of each article we publish.