 Xing-Yu Ding
 Wen-Jun Hu2,3*
 Xian Yang
94% of researchers rate our articles as excellent or good
Learn more about the work of our research integrity team to safeguard the quality of each article we publish.
Find out more
ORIGINAL RESEARCH article
Front. Environ. Sci., 11 September 2023
Sec. Environmental Informatics and Remote Sensing
Volume 11 - 2023 | https://doi.org/10.3389/fenvs.2023.1252206
This article is part of the Research TopicCoal and Rock Dynamic Disasters: Advances of Physical and Numerical Simulation in Monitoring, Early Warning, and Prevention, volume IIView all 29 articles
The stratum in Yunlong mountain area is unstable, and it is more likely to have extreme damage to the mountain in extreme rainfall weather, and even cause the occurrence of mountain disasters such as debris flow. This paper conducted field geological surveys and used the FLO-2D professional simulation system to scientifically evaluate the risk probability of three debris flow in Yunlong County. The risk prediction before and after engineering control was compared for the county’s urban areas.This paper uses construction drawings and remote sensing images to assist in positioning methods for debris flow simulation. After dividing the debris flow simulation grid, the control project is added to the simulation project in the form of a plug-in, and specific engineering parameters are imported into the simulation project file by modifying its properties. The setting of the control project in numerical simulation is completed, solving the problem of setting engineering measures. By this method, the probability analysis of debris flow under three different rainfall frequencies of 1%, 2% and 5%, namely once in 20 years, once in 50 years and once in 100 years, is simulated, and the flow and sedimentation characteristics of debris flow before and after engineering control are compared. The results show that under 5% rainfall frequency, the simulated results before engineering control were compared with the actual deposition range, and the evaluation accuracy is within a reasonable error range. After debris flow engineering control, the proportion of high risk areas of debris flow in urban areas decreased significantly, especially when the frequency of rainfall was once in 100 years, and the area of non-danger areas increased by 5.92% compared with that before control. In the end, this paper combines the depth of mud, the velocity of mud and the outbreak frequency to get the debris flow risk assessment map before and after engineering treatment, and puts forward suggestions for further prevention and control measures of debris flow disaster. The research results of this paper will provide good guidance for the occurrence and control of debris flow hazards under the influence of extreme rainfall in the mountainous area of northern Yunnan.
The northern Yunnan region of China is located near the extinction boundary of the Eurasian Plate and the Indian Ocean Plate, where faults are developed and the crusts are broken. In addition, this region is one of the most seriously damaged areas in China where debris flow is densely distributed, as well as one of the most typical areas of debris flow activity in the world because of its numerous mountain and canyon landforms, large slope and abundant precipitation (Tang, 1995; Xu, 2018a). According to the field survey, a total of 12 counties and cities in northern Yunnan suffered debris flow disasters with different degrees (Shang, 1993; Yang et al., 2017), bringing a huge threat to the safety of people’s lives and property. The risk evaluation of debris flow disaster not only has reference value for engineering design and construction in debris flow activity area but also has guiding significance for the implementation of debris flow prevention and control measures; besides, it is also an important means to improve the efficiency of debris flow prevention and control.
Debris-2D, FLO-2D and Geoflow are mature numerical simulation software in the world, which can carry out large-scale engineering problem analysis (Peng et al., 2017). Among them, the FLO-2D software establishes the mass conservation and momentum conservation equations in differential form, and uses the explicit central difference method to solve them, which can calculate the change of flow depth, velocity and influence range with time. As a two-dimensional software, FLO-2D can analyze the movement characteristics of debris flow in detail and has been widely used in debris flow disaster research (Brien, 2009a; Liang et al., 2016; Cao et al., 2021). Bertolo et al. (Bertolo and Wicezorek, 2005) used FLO-2D to simulate the sedimentation process of debris flow movement in small watershed. Huang et al. (Xun and Chuang, 2016) used FLO-2D to simulate the influence range of debris flow in the experimental area and found that the simulation results were consistent with the actual range. Jia et al. (Jia et al., 2015) simulated the debris flow accumulation process using FLO-2D, and built a danger zone zoning model based on the momentum of the debris flow to quantify the debris flow accumulation fan. Ling et al. (Wang and Ling, 2011) simulated the debris flow in the Songhe area based on FLO-2D software and conducted risk evaluation in this area based on the flow depth, flow velocity, and sediment accumulation characteristics. Zhang et al. (Zhang et al., 2019) used FLO-2D to simulate the outbreak process of the debris flow in Ruoru village under rainfall frequencies of 5%, 2%, and 1%, and obtain a risk assessment chart based on the mud depth, flow velocity, and outbreak frequency. It can be seen that many scholars have tried to apply FLO-2D to the risk assessment of debris flow, and the assessment results are highly consistent with the on-site investigation.
The prevention and control of debris flow in the mountainous area of northern Yunnan province were first proposed in the mid-1960s; So far, to some extent, various engineering measures for controlling the debris flow gullies that may threaten people’s lives and properties have been implemented, including various interception measures, slope stabilization measures, drainage measures, water control measures, and siltation detention measures (Yan, 2016; Gao et al., 2023). Although these engineering prevention measures have achieved varying degrees of effectiveness, most of the risk assessment of debris flow disasters mainly focused on evaluating their pre-treatment risk, and trarely consider risk assessment of debris flow disasters under the influence of engineering measures (Jakob et al., 2012; Liu and Li, 2023). In this paper, based on detailed field investigation data (Dong and Hu, 2021) and FLO-2D numerical simulation software, this paper assisted positioning by construction drawings and remote sensing images of the treatment project. After the mesh division of debris flow simulation was completed, the treatment project was added to the simulation project in the form of plug-in, and specific engineering parameters were imported into the simulation project file by modifying its attributes. The setting of the management project in the numerical simulation is completed, and the difficult problem of the setting of engineering measures is solved. The risk assessment after the prevention and control of three debris flow gulches in Yunlong County has been studied. The risk assessment of debris flow refers to the evaluation of the possibility of all people or objects suffering debris flow damage within the scope of debris flow basin (Ortiz-Giraldo et al., 2023; Yang et al., 2023). This assessment mainly evaluates the spatial distribution, development environment, development degree, disaster type and other factors of debris flow, so as to determine the probability of its occurrence, and provide a reference for the subsequent prevention and control of debris flow.
Yunlong County, Yunnan Province, is located in the northern part of Yunnan; Its landscape features highly eroded mountains and canyons, with an unusually developed “V"-shaped valley (Figure 1; Figure 2) that exhibits strong cutting and fractured rock layers (Calista et al., 2020). The formation of debris flows in the area is related to special climatic conditions, terrain, and lithology, as well as human engineering activities also play an important role in the occurrence of debris flows. The structural system within Yunlong County is complex, there are various structural systems intersecting and accommodating each other, thus a composite property with multi-stage and long-term activity is possessed. In its composite parts (Huang et al., 2019; Gan and Luo, 2020), fractures crisscross, rocks are broken, rock is severely weathered, and geological disasters such as landslides, collapses, and potentially unstable slopes are easily formed. The gully erosion is extremely developed in the slope zone of the assessment area. The upper and middle reaches of the valley often form high and steep banks due to headward erosion, downstream erosion, and lateral erosion. In addition, human activities such as road excavation have led to a high incidence of landslides and collapse, providing a large amount of material for debris flows.

FIGURE 1. Steep terrain on both sides of the Bijiang River.

FIGURE 2. Bijiang valley.
In this area, the steep slope topography and the continuous action of strong downcutting erosion of gully water lead to the gradual unloading, tipping, collapse and surface landslide of gully bank slope, which provide material sources for the formation of debris flow (Hou et al., 2021). The rock mass exposed in Yunlong County has different resistance to weathering because of different lithology and different degree of joint fissure development. The stratigraphic lithology is shown in Table 1. The feldspar quartz sandstone of Hutousi Formation and the sandstone of the lower part of Jingxin Formation, which have strong wind resistance in the area, are mainly formed by collapsing blocks, gravel, or masonry destroyed along joints and cracks, which provide solid material with coarse particles for debris flow (Liu et al., 2023a; Liu et al., 2023b).
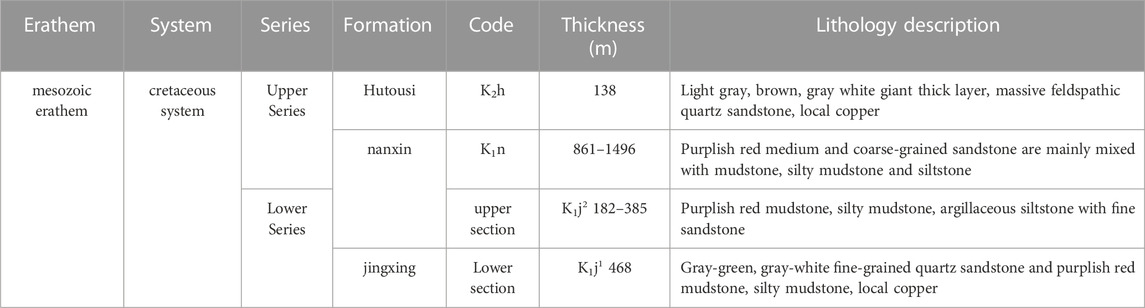
TABLE 1. Regional comprehensive stratigraphic list of Yunlong county.
Through detailed field investigation (Dong and Hu, 2021), the basic situation of the three debris flow gullies in the area and the relevant control engineering measures in the gullies are obtained, as shown in Table 2. The basic characteristics of the three debris flow trenches are as follows:Shiwei River, the lithology of the stratigraphic rocks is third-order mudstone and siltstone, and the slope erosion is severe, resulting in serious soil erosion. In the Shili River basin, landslides, collapses,slope, collapses, potentially unstable slopes, and artificial abandoned soil provide material sources for debris flows. The reserve of loose solid materials is about 2912.93 × 104 m3, and the reserve of loose solid materials for debris flow activity is 291.293 × 10⁴ m3. The accumulation area at the mouth of the gully is fan-shaped, with a length of about 1240 m and a width of about 1000 m. Suolichangqing, the lithology consists of Neogene mudstone and siltstone, and the slope erosion is strong, causing serious soil erosion. The weathered layer thickness in the Zhukelijing debris flow basin is relatively large, and the loose solid material mainly comes from landslides, erosion and abrasion-type material sources, and debris flow channel deposits. The amount of loose solid material source is about 2136.76 × 104 m3, and the movable loose material source is about 106.838 × 10⁴ m3. Nuodeng River, the lithology of the strata is mainly comprised of Neogene mudstone and siltstone, with strong slope erosion and severe soil and water loss. The loose solid material source is mainly from landslides and channel deposits, with the volume of the large landslide body in the loose slope area being about 1160.0 × 104 m3. The source of loose solid materials is about 2027.7 × 104 m3, and the movable loose material source is about 101.38 × 10⁴ m3. The accumulation area at the mouth of the gully is fan-shaped, with a length of about 230 m and a width of about 240 m.
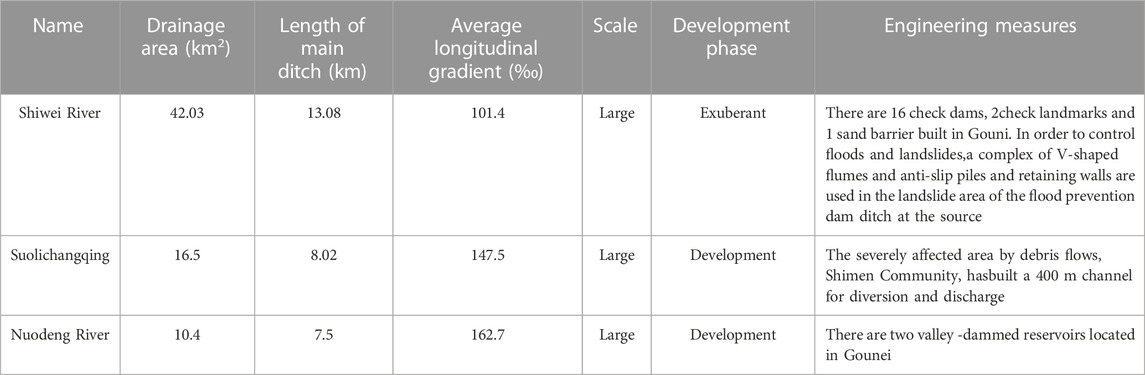
TABLE 2. Characteristics of the three debris flow gullies in Yunlong county.
The FLO-2D software model was proposed by Brien in 1988, in which the digital elevation model (DEM) is divided into the same size and regular topographic grid to solve the control equation of debris flow movement by using non-Newtonian fluid and central finite difference method, while the flow process, accumulation range and dangerous area of debris flows can be simulated by numerical quantitative method. Related literature (Brien, 2009b; Castelli et al., 2017; Cong et al., 2019) had discussed in detail the theoretical model of the numerical simulation software and the assumptions to be met.
In this article, combined with various parameters such as rainfall, flow data, and digital terrain data, FLO-2D numerical simulation software was used to simulate the movement process and status of debris flows, including flow velocity, deposition depth, and deposition range, to restore the movement process of debris flows. After obtaining the numerical simulation parameters of debris flows occurring every 20 years, 50 years, and 100 years, the potential impact and deposition situation of debris flows under rainfall conditions with a recurrence interval of 20, 50, and 100 years in Yunlong County were predicted. By combining the motion parameters with the danger of debris flows, an appropriate debris flow hazard zoning model is selected to classify the debris flows into different levels of danger.
This article collects 1:10000 contour lines and high-precision remote sensing image maps of Yunlong County (Dong and Hu, 2021). The construction process of the numerical model is shown in Figure 3.
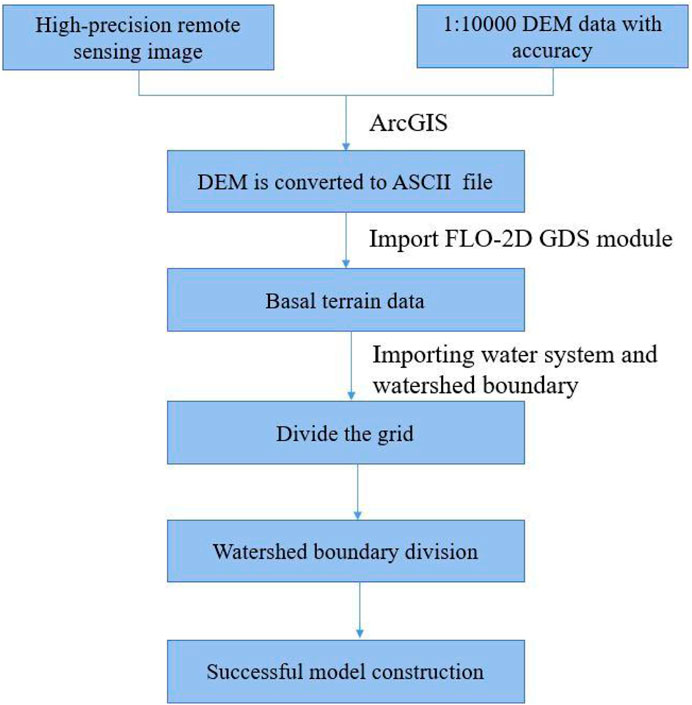
FIGURE 3. Numerical model construction process.
When conducting a numerical simulation of debris flow engineering after treatment, it is necessary to add the treatment engineering to the simulation project in the form of a plugin after the grid division of debris flow simulation is completed, and the position of the treatment engineering in the watershed is very important, which can be assisted using the construction drawings of the treatment engineering and remote sensing images. By creating a series of corresponding grids for the treatment projects and importing the specific project parameters into the simulation project file by modifying their properties, the setting of the treatment engineering in the numerical simulation can be completed.
The main parameters selected for FL0-2D numerical simulation (FLO-2D Software Inc, 2004) include debris flow density, volume concentration, laminar retarding coefficient and rheological parameters.
Based on on-site surveys and collected design reports of debris flow, and combined with the FL0-2D User Manual and relevant literature, various calculation parameters except rainfall intensity were obtained and analyzed, as shown in Table 3.
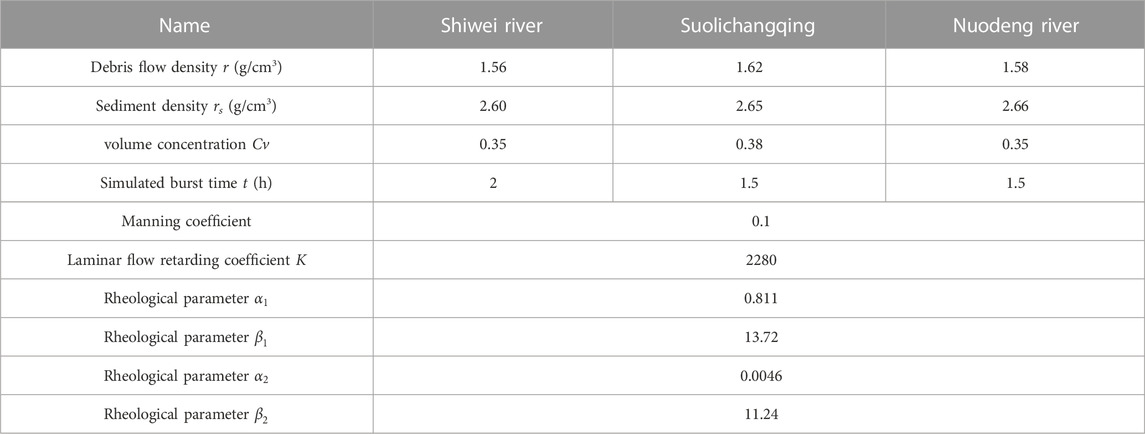
TABLE 3. Values of various parameters for debris flow channels.
The calculation of debris flow volume concentration can refer to the calculation formula in reference (Zhang et al., 2022).
r is the density of debris flow (g/cm3),rs is the density of fluid sediment (g/cm3) and rw is the density of water (g/cm3).
The rheological parameters α1 and β1 are related to the viscosity coefficient η, and the rheological parameters α2 and β2 are related to the yield stress τy, as detailed in the formula in the FL0-2D User Manual.
Numerical simulation of debris flow using FLO-2D software requires the calculation of the flow process line of the debris flow (XU, 2018b; Li et al., 2022; Zhang LB. et al., 2023). After obtaining the peak flow of the rainstorm with the rainfall-hydrological method, the runoff flow at the outlet can be calculated according to relevant specifications (Hu, 1993; China University of Geosciences, 2018; Li et al., 2023) under different rainfall frequencies, and the peak flow of the debris flow at the outlet can be obtained. The calculation parameters for the peak flow of debris flow are shown in Table 4, and the peak flow of the outlet section is shown in Table 5.
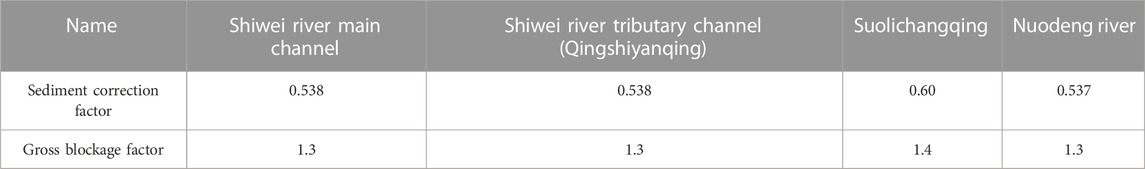
TABLE 4. Calculation parameters of peak flow of debris flow.
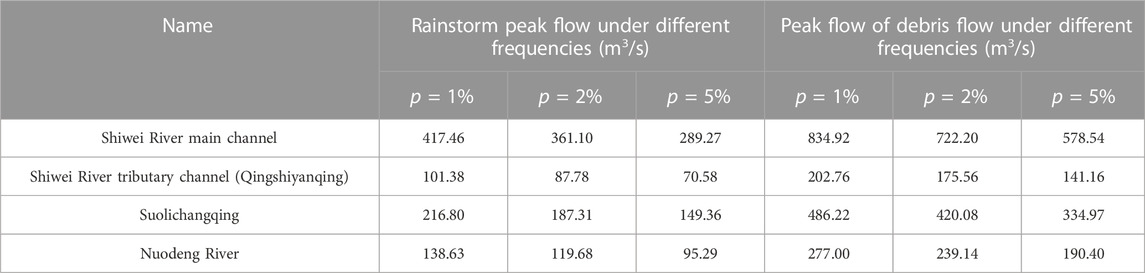
TABLE 5. Peak flow meter of outlet point cross section.
Qc is the peak flow of the debris flow section (m3/s), Q is the peak flow of the flood section (m3/s), ψ is the sediment correction coefficient, and d is the blockage coefficient.
The flow process line of debris flow can be obtained by using the generalized pentagon method (Gong et al., 2017; Wang et al., 2020; Zhang JC. et al., 2023), as shown in Figures 4A–D.
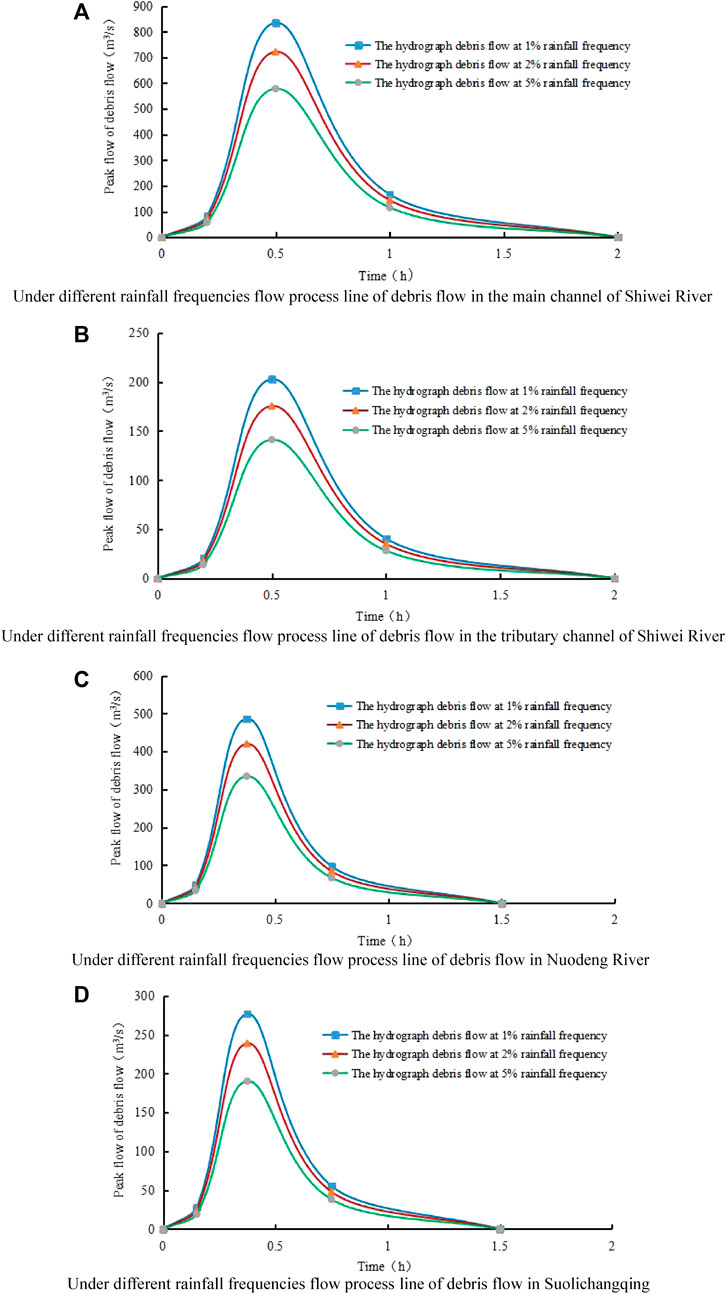
FIGURE 4. Flow process lines of debris flow for each debris flow channel in Yunlong County.
The effectiveness of the simulation is determined by the reasonable selection of catchment points. Through field investigations and comparisons of collected data, loose material accumulation sites where a large amount of debris flow in each debris flow channel forming area existed were selected as the catchment points to serve as the starting points for numerical simulation. The catchment point for the main channel of Shiwei River was located at the convergence of the tributaries in the upstream forming area, while the catchment point for the tributary channel of Shiwei River was located at the foot of the front edge slope of the Guanzhuangdian landslide. The catchment point for Suolichangqing was located at the confluence point of the upstream tributaries, and the catchment point for Nuodeng River was located at the foot of the slope of the large landslide of Songpodigu in the forming area.
The reasonable selection of catchment points determines the effectiveness of the simulation. Based on field investigations and comparisons of collected data, loose material accumulation sites where a large amount of debris flow in each debris flow channel forming area existed were selected as the catchment points to be seen as the starting points for numerical simulation. The catchment point for the main channel of Shiwei River was located at the confluence of the tributaries in the forming area upstream, while the catchment point for the tributary channel of Shiwei River was located at the slope foot of the front edge of the Guanzhuangdian landslide. The catchment point for Suolichangqing was located at the confluence point of the upstream tributaries, and the catchment point for Nuodeng River was located at the foot of the slope of the large landslide of Songpodigu in the forming area.
The early debris flow control engineering for the Suolichangqing and Nuodeng River debris flows in the study area nearly failed, resulting in the post-control movement processes being consistent with natural conditions. This simulation mainly focuses on simulating the blocking engineering of the main channel and tributary channel of Shiwei River at the Qingshiyanqiong blocking site. The statistical data of the blocking engineering can be found in Table 6.
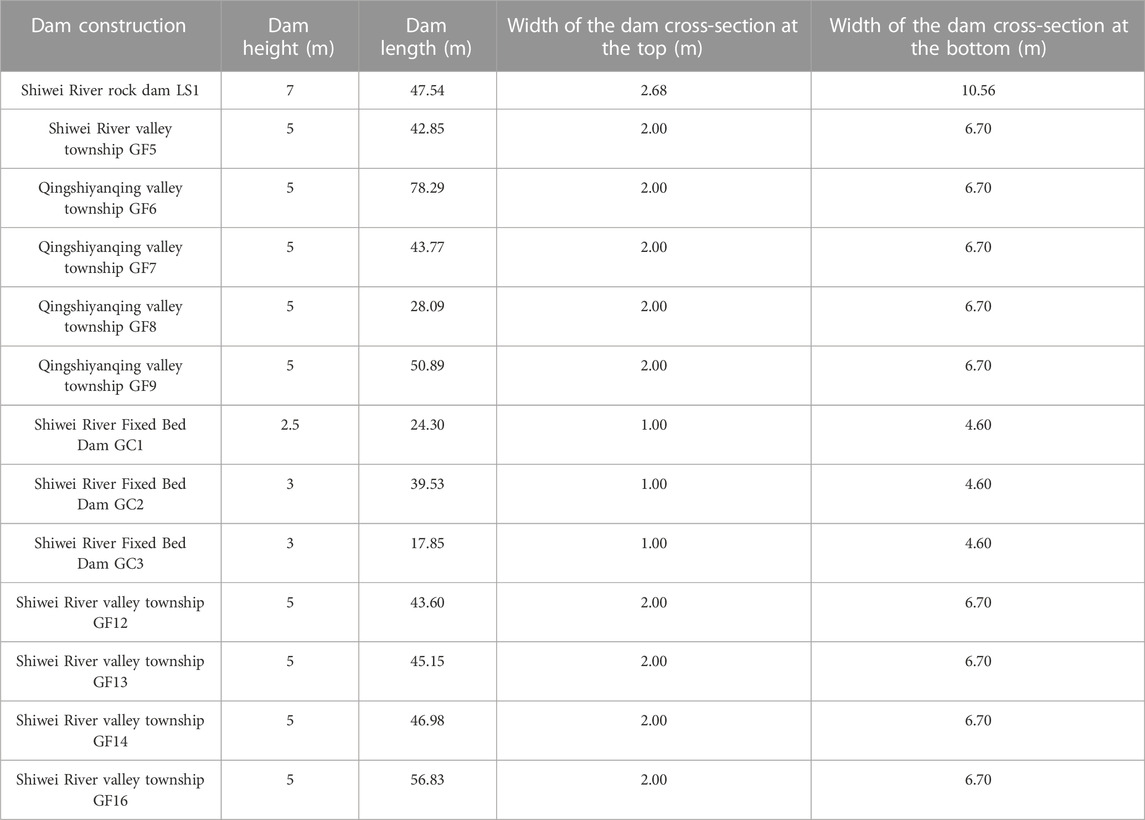
TABLE 6. Simulation data of Shiwei River blocking engineering.
Numerical simulations after the implementation of control measures were conducted, the movement and accumulation of debris flows in three gullies in Yunlong County under three recurrence intervals (p = 5%, p = 2%, p = 1%) were obtained. The simulation results are shown in Figures 5–7.
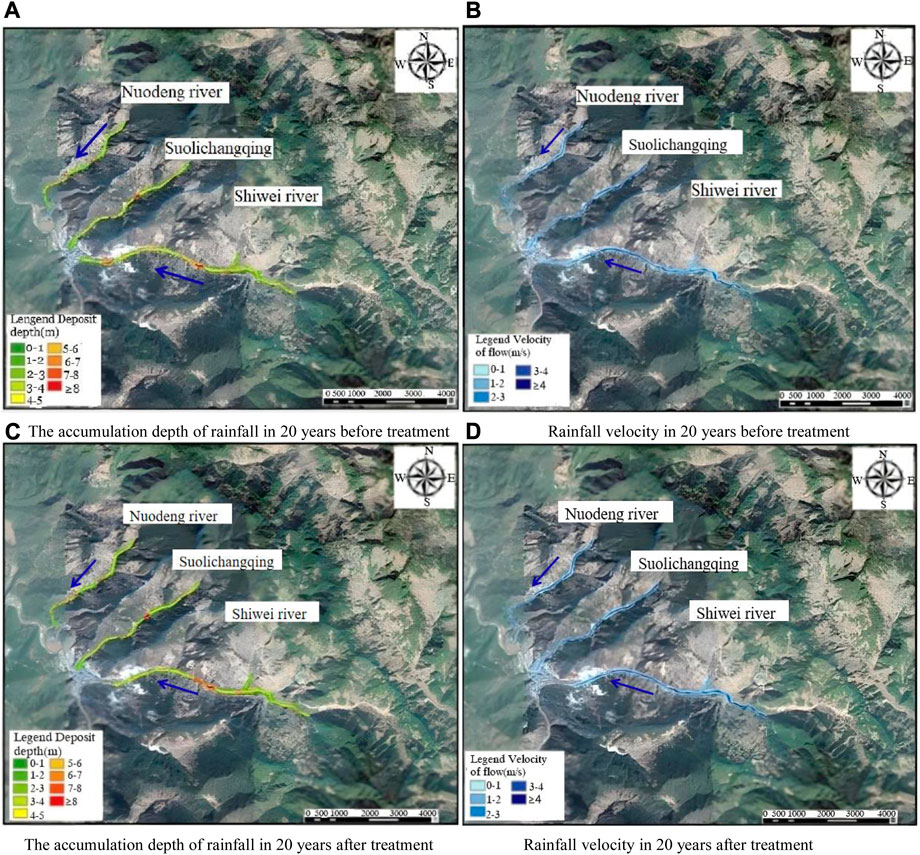
FIGURE 5. Simulation results of 20 years before and after treatment.
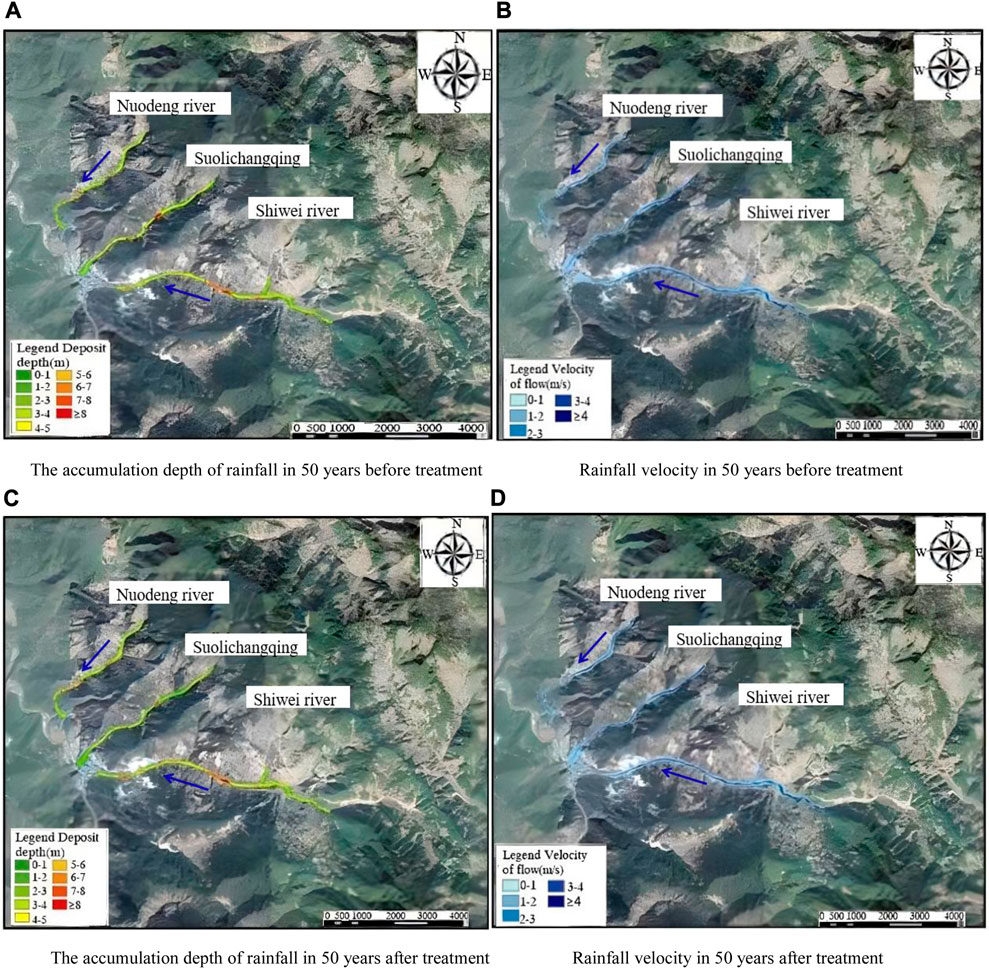
FIGURE 6. Simulation results of 50 years before and after treatment.
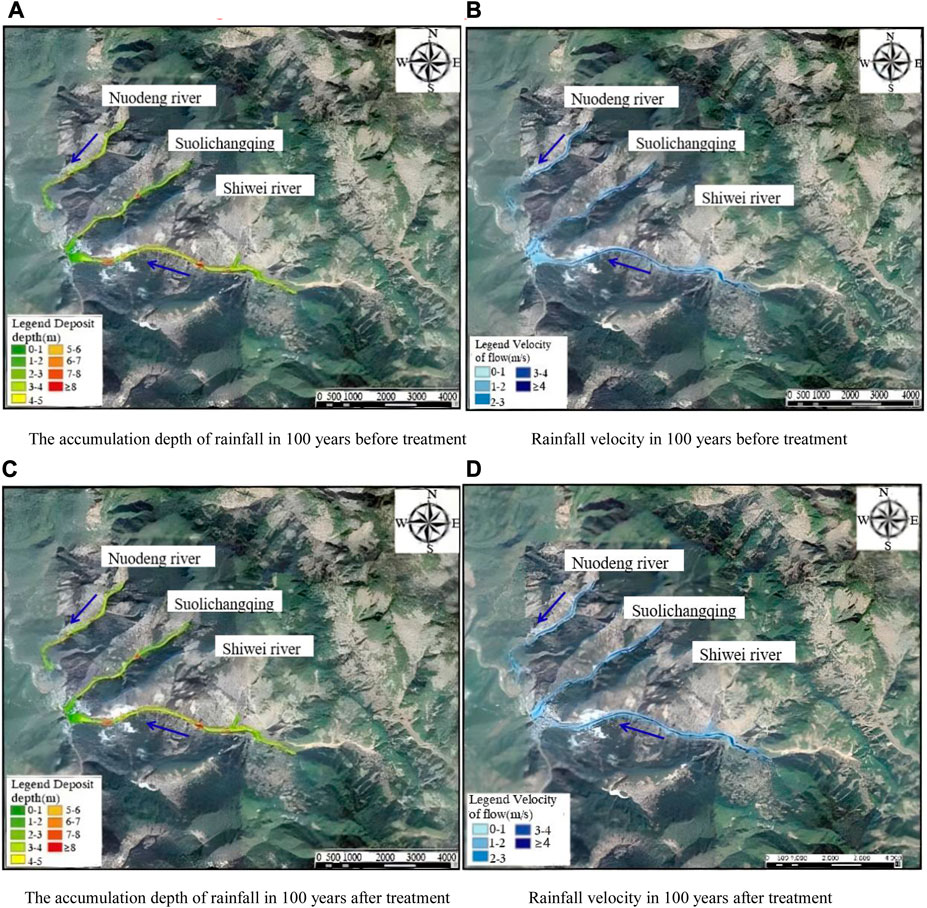
FIGURE 7. Simulation results of 100 years before and after treatment.
In this study, the simulated data of debris flow fan areas occurring once every 20 years in the study area was compared with the actual measured fan area data. According to the simulation results, the accuracy of the 20-year recurrence interval fan area for Lion Rock River in Yunlong County was 79.8%, for Suolichangqing in Yunlong County was 77.7%, and for Nuodeng River in Yunlong County was 79.4%. The numerical simulation results before and after debris flow control in Yunlong County are shown in Table 7.
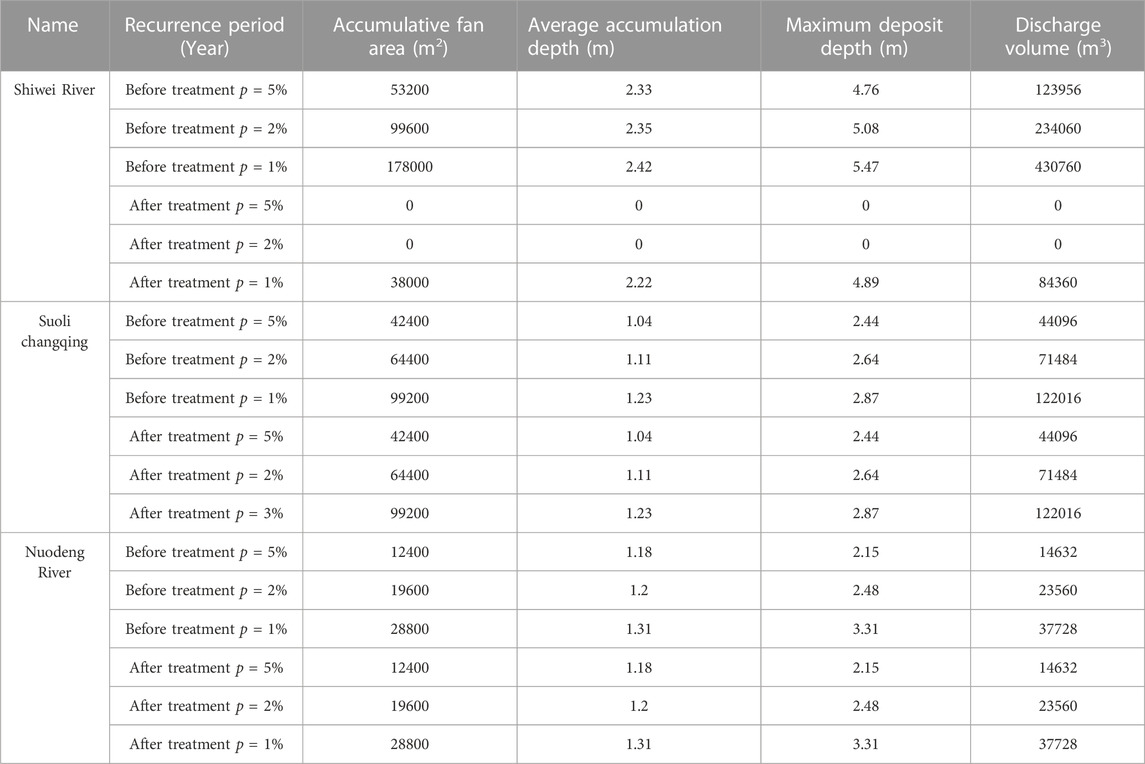
TABLE 7. Numerical simulation results before and after regulation engineering.
Based on the FLO-2D numerical simulation results, it is known that due to the failure of the early debris flow control engineering in Suolichangqing and Nuodeng River, the movement process of debris flow is consistent with the natural situation. However, the trapping function of the control engineering in Shiwei River significantly reduced the area of the accumulation fan, the average accumulation depth, the maximum accumulation depth and the outburst volume. Under the conditions of a 20-year or 50-year rainfall, there is no debris flow reaching the current accumulation fan position, and after being controlled, the area, average depth, maximum depth, and outburst volume of the accumulation fan all tend to be zero, with loose materials accumulating in the channel. Under the conditions of a 100-year rainfall, some debris flows reach the current accumulation fan position, the area of the accumulation fan is 21.3% of the pre-construction value, and the outburst volume is 19.6% of the pre-construction value.
In this paper, the simulation data of debris flow gully accumulative fan range in the study area once every 20 years are compared with the actual data of debris flow gully accumulative fan range in the study area. The specific formula is as follows.
The degree of accuracy in formula A; S1 is the overlap area between the measured and simulated accumulations. S2 is the accumulation area of debris flow measured in field survey. S3 is the accumulation area of numerical simulation debris flow. The result value for precision A is 0–1, and the closer it is to 1, the more accurate the final simulation result will be. The accuracy of each ditch calculated by formula 6 is shown in Table 8, which is consistent with the above simulation results, thus verifying the accuracy of this numerical simulation.
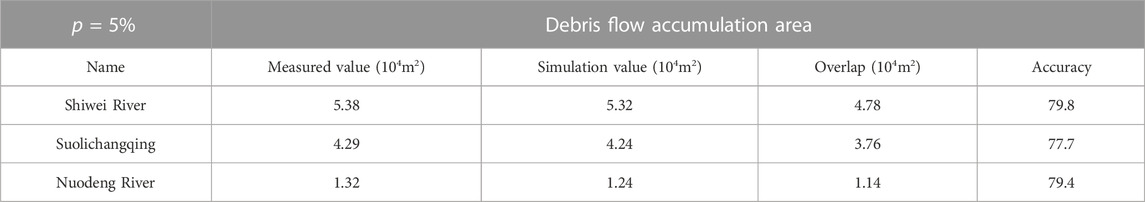
TABLE 8. Accuracy assessment of numerical simulation.
Risk evaluation of the Yulong County urban area with high human activity was conducted based on the depth and velocity of mud and debris flow obtained through numerical simulations. The classification standard for the risk of mud and debris flow refers to the standards used for the Wenchuan debris flow, as shown in Table 9.

TABLE 9. Standard for classifying the danger of debris flow.
According to the current urban area range of Yunlong County and the overall development plan (2013–2030), the urban area of Yunlong County is approximately 2.5075 square kilometres. Based on the qualitative evaluation and FLO-2D numerical simulation results, a risk assessment was conducted for geological hazards in the urban area of Yunlong County before and after geological disaster management. The evaluation results are divided into high-risk areas, medium-risk areas, low-risk areas, and zero-risk areas, as shown in Figure 8.
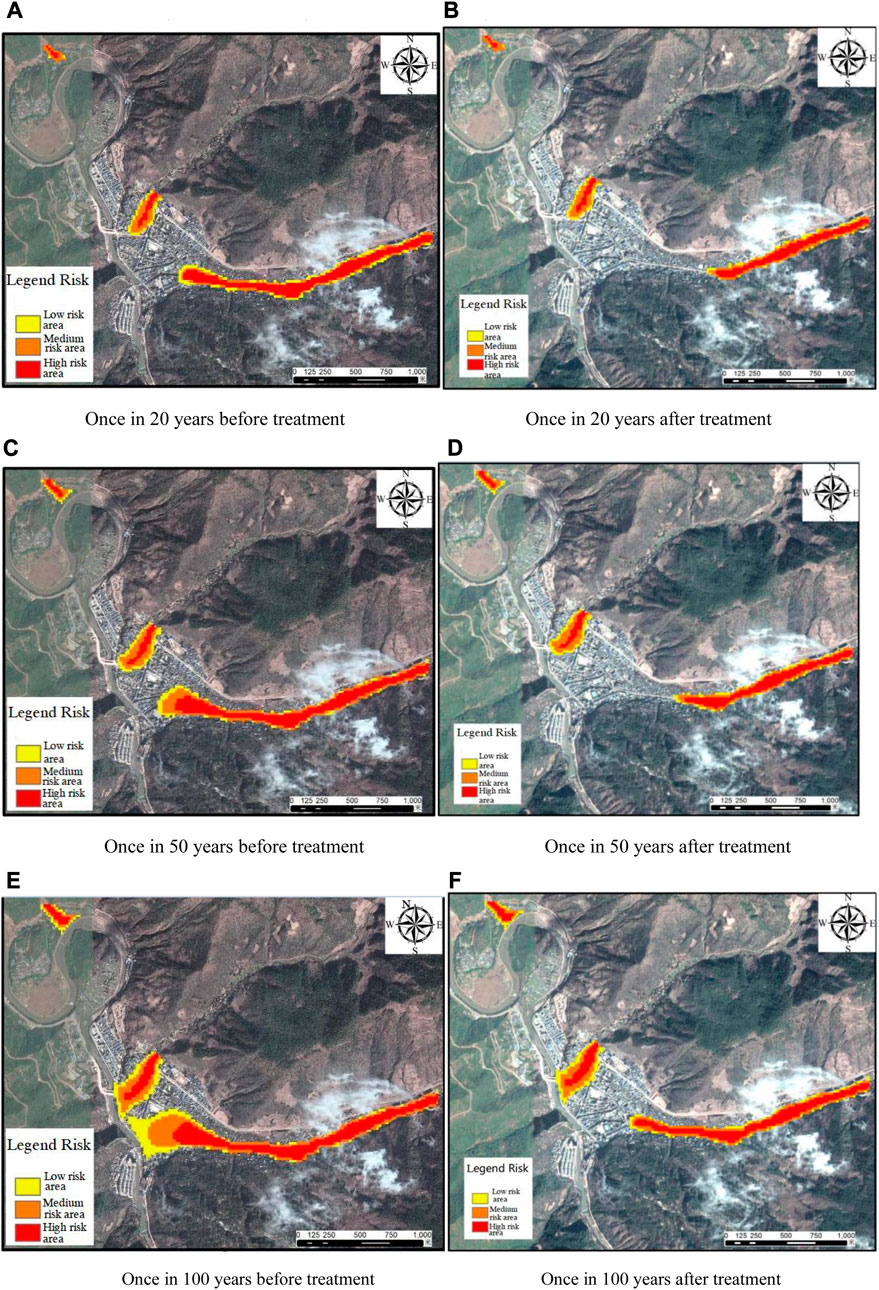
FIGURE 8. The danger zonation map of the urban area of Yunlong County.
“Safe zones” indicate that the area is not at risk of being affected by debris flows; “Low-risk zones” indicate that debris flows may cause slight damage to buildings in the area; “Medium risk zones” indicate that some buildings in the area may be destroyed, and personnel may be injured or killed; “High-risk zones” indicate that debris flows will destroy buildings and cause significant loss of life. As shown in Figure 8, the high-risk zones in the county’s urban area are mainly divided into two regions; The first high-risk zone is located in the whole Shiwei River flowing through the urban area of Yunlong County, which although has been rehabilitated with drainage facilities to timely evacuate small-scale debris flows, there may be risks of slow drainage or blockages in case of rainfalls with a frequency of once every 100 years, and there are risks inside and around the drainage facilities. The second high-risk zone is located at the Suolichang Canyon in the urban area of Yunlong County, which has risks of debris flows with a frequency of once every 20 years.
The results of the geological hazard risk assessment for different rainfall frequencies, including p = 5%, p = 2%, and p = 1%, were used to analyze the statistics of the area of each risk zone before and after engineering treatment, as shown in Table 10.
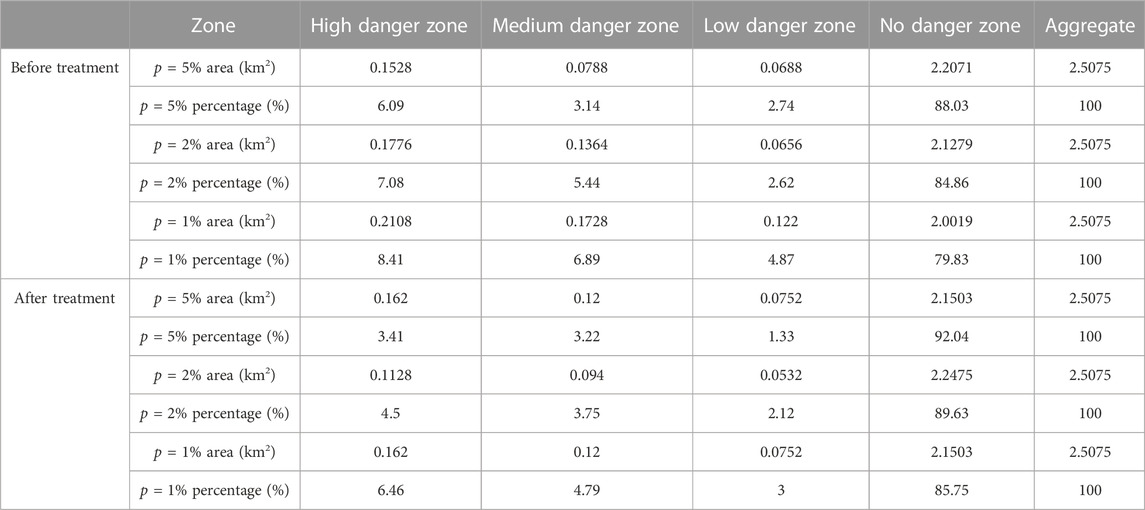
TABLE 10. Statistical of the hazardous zoning area in the urban area of Yunlong County before and after governance.
According to the above analysis, it can be known that after the implementation of engineering measures for debris flow disasters, the proportion of high-risk areas in the urban area of Yunlong County was significantly decreased, especially under the condition of 20-year rainfall. The area of high-risk areas decreased the most. Under rainfall conditions of 50 years and 100 years, the area of medium-risk areas decreased significantly, but under the condition of 20-year rainfall, the area of medium-risk areas increased slightly, this is mainly because some high-risk areas are transformed into medium-risk areas. Under different rainfall frequencies, the proportion of low-risk areas decreased. Overall, after implementing engineering measures for debris flow disasters, the area of no-risk areas increased, especially the area of no-risk areas increased by 5.92% when the rainfall frequency was 100 years, which greatly ensures the safety of densely populated areas.
The setting up of the Shiwei River debris flow interception project plays a great role in reducing the harm caused by debris flows. In the later period, a comprehensive prevention and control project can be considered, which includes a “composite V-shaped drainage chute + fish mouth project + sand-collecting dam + valley-distributed dam + rigid dam + flood control dike” to further improve the prevention and control effect. Suolichangqing and Nuodeng River have lower prevention and control levels and longer construction times. At present, they are in a saturated state and require the addition of appropriate treatment measures to ensure safety.
Based on various parameters of rainfall, flow data, and digital terrain data, this article used the FLO-2D numerical simulation software to simulate the movement process of the three debris flow gullies in Yunlong County before and after treatment. Based on the debris flow movement state, the danger and zoning of the county town area were evaluated, and the following conclusions were drawn:
1) This paper assisted positioning by construction drawings and remote sensing images of the treatment project. After the mesh division of debris flow simulation was completed, the treatment project was added to the simulation project in the form of plug-in, and specific engineering parameters were imported into the simulation project file by modifying its attributes. The setting of the management project in the numerical simulation is completed, and the difficult problem of the setting of engineering measures is solved.
2) Under the rainfall conditions of a return period of 20 years and 50 years, the Shiwei River did not reach the current debris flow deposit fan position, and loose materials were piled up in the gorge. Under the rainfall conditions of a return period of 100 years, some of the debris flow reached the current deposit fan position, and the area of the deposit fan was 21.3% of that before treatment, and the volume of the scouring was 19.6% of that before treatment.
3) After the implementation of engineering treatment for debris flow disasters, the proportion of high-risk areas in the urban area of Yunlong County was substantially decreased, especially under the condition of once-in-twenty-year rainfall, the area of high-risk regions was reduced the most. Especially when the rainfall frequency is once in a hundred years, the area of non-dangerous zones has increased by 5.92% compared to before the treatment.
The original contributions presented in the study are included in the article/supplementary material, further inquiries can be directed to the corresponding authors.
X-YD: Writing—original draft, W-JH: review and editing, XY: Conceptualization, FL: Data curation.
This research was supported by the Hunan Provincial Natural Science Foundation of China (No. 2023JJ50339), and the Natural Science Foundation of Hunan Province, China (No. 2023JJ30212).
The authors declare that the research was conducted in the absence of any commercial or financial relationships that could be construed as a potential conflict of interest.
All claims expressed in this article are solely those of the authors and do not necessarily represent those of their affiliated organizations, or those of the publisher, the editors and the reviewers. Any product that may be evaluated in this article, or claim that may be made by its manufacturer, is not guaranteed or endorsed by the publisher.
Bertolo, P., and Wicezorek, G. F. (2005). Calibration of numerical models for small debris flows in Yosemite Valley,California,USA. Nat. Hazards Earth Syst. Sci. 5 (6), 993–1001. doi:10.5194/nhess-5-993-2005
Calista, M., Menna, V., Mancinelli, V., Nicola, S., and Enrico, M. (2020). Rockfall and debris flow hazard assessment in the SW escarpment of montagna del morrone ridge (Abruzzo, Central Italy). Water 12 (4), 1206–1215. doi:10.3390/w12041206
Cao, P., Hou, S. S., and Chen, L. (2021). Risk assessment of mass debris flow based on numerical simulation: An example from the Malu River basin in Min County. Chin. J. Geol. Hazard Control 32 (2), 100–109. doi:10.16031/j.cnki.issn.1003-8035.2021.02.14
Castelli, F., Freni, G., Lentini, V., and Fichera, A. (2017). Modelling of a debris flow event in the Enna area for hazard assessment. Procedia Eng. 175, 287–292. doi:10.1016/j.proeng.2017.01.026
China University of Geosciences (2018). Code for debris flow disaster prevention and control engineering survey. Beijing: China University of Geosciences.
Cong, K., Li, R. D., and Bi, Y. H. (2019). Benefit evaluation of debris flow control project based on FLO-2D model. Northwest Geol. 52 (3), 209–216.
Dong, Y., and Hu, W. J. (2021). Investigation and risk assessment report of geological disaster prevention and control effect in Yunlong County and planning area of Yunnan Province. Yunnan: Yunnan geological Survey.
FLO-2D Software Inc (2004). FLO-2D,2Dimensional flood routine model manual: Version 10. Arizona: Nutrioso, AZ85932.
Gan, J. L., and Luo, C. T. (2020). Runout and process simulation of gully debris flow in middle and low mountains. J. Nat. Disasters 29 (2), 97–110.
Gao, Y., Yu, Z., Chen, W., Yin, Q., Wu, J., and Wang, W. (2023). Recognition of rock materialsafter high-temperature deterioration based on SEM images via deep learning. J. MaterialsResearch Technol. 25, 273–284. doi:10.1016/j.jmrt.2023.05.271
Gong, K., Yang, T., Xia, C. H., and Yang, Y. (2017). Assessment of landslide hazard based on FLO-2D-a case study in mianxun town, mianxian county, wenchuan province. J. Water Resour. Water Eng. 28 (6), 134–138. doi:10.11705/j.issn.1672-643X.2017.06.23
Hou, S. S., Cao, P., Chen, L., Feng, Z., Wang, C., and Li, A. (2021). Risk assessment of debris flow disaster in eryang River Basin Based on numerical simulation. Hydrogeology& Eng. Geol. 48 (2), 143–151. doi:10.16030/j.cnki.issn.1000-3665.20200305
Hu, G. B. (1993). The analytical calculation of flood regulation based on the pentagonal flood process line. Jiangxi Hydraulic Sci. Technol. 19 (3), 198–201.
Huang, X., Tang, C., Li, Y. L., He, J. Y., Zhang, K. S., Liu, T., et al. (2019). Morphology-tunable WMoO nanowire catalysts for the extremely efficient elimination of tetracycline: Kinetics, mechanisms and intermediates. Adv. Earth Sci. 31 (10), 1047–1057. doi:10.1039/c8nr08162j
Jakob, M., Stein, D., and Ulmi, M. (2012). Vulnerability of buildings todebris flow impact. Nat. Hazards 60 (2), 241–261. doi:10.1007/s11069-011-0007-2
Jia, T., Tang, C., and Wang, N. N. (2015). Method and application of debris flow hazard zoning Based on FLO-2D and impulse model. Water Resourse Power 33 (2), 152–155. doi:10.16030/j.cnki.issn.1000-3665.202003057
Li, B. X., Cai, Q., Song, J., Cheng, L., and Liu, J. K. (2022). Risk assessment of debris flow hazard based on FLO-2D:A case study of debris flow in Maiduo Gully. J. Natuerl Disastres 31 (4), 256–265. doi:10.16031/j.cnki.issn.1003-8035.2021.02.14
Li, X. L., Zhang, X. Y., Shen, W. L., Zeng, Q., Chen, P., Qin, Q., et al. (2023). Research on the mechanism and control technology of coal wall sloughing in the ultra-large mining height working face. Int. J. Environ. Res. Public Health 20 (2), 868. doi:10.3390/ijerph20010868
Liang, H. X., Shang, M., and Xu, X. (2016). Research on the influence factors of flow and deposition of debris flow based on the FLO-2D simulation. J. Eng. Geol. 24 (2), 228–234. doi:10.1007/s12665-014-3865-6
Liu, S. M., and Li, X. L. (2023). Experimental study on the effect of cold soaking with liquid nitrogen on the coal chemical and microstructural characteristics. Environ. Sci. Pollut. Res. 30 (3), 36080–36097. doi:10.1007/s11356-022-24821-9
Liu, S. M., Sun, H. T., Zhang, D. M., Yang, K., Wang, D., Li, X., et al. (2023a). Nuclear magnetic resonance study on the influence of liquid nitrogen cold soaking on the pore structure of different coals. Phys. Fluids 35 (1), 012009. doi:10.1063/5.0135290
Liu, S. M., Sun, H. T., ZhangYang, D. M. K., Li, X., Wang, D., et al. (2023b). Experimental study of effect of liquid nitrogen cold soaking on coal pore structure and fractal characteristics. Energy 275 (7), 127470. doi:10.1016/j.energy.2023.127470
Ortiz-Giraldo, L., Botero, B. A., and Vega, J. (2023). An integral assessment of landslide dams generated by the occurrence of rainfall-induced landslide and debris flow hazard chain. Front. Earth Sci. 11, 1157881. doi:10.3389/feart.2023.1157881
Peng, S. Y., Li, G. J., and Qin, S. W. (2017). Review of research on dynamic processes and erosion of debris flow. Yangtze River 48 (3), 53–56. 101. doi:10.16232/j.cnki.1001-4179.2017.03.011
Shang, W. A. (1993). Landslide and debris flow disasters in Yunnan's towns and their prevention and control. First Natl. Conf. Landslide Debris Flow Prev. Control, 323–328.
Tang, X. C. (1995). Debris flow control and its future in mountain of south west China. Mar. Quat. 15 (3), 105–112.
Wang, J. J., and Ling, H. I. (2011). Developing a risk assessment model for typhoon-triggered debris flows[J]. J. Mt. Sci. 8 (1), 14. doi:10.1007/s11629-011-2065-z
Wang, G. F., Yang, Q., Chen, Z. L., Jia, L., and Mao, J. R. (2020). Risk assessment of debris flow in the ganjia gully of the bailongjiang basin. J. Sediment Res. 45 (4), 66–73. doi:10.16239/j.cnki.0468-155x.2020.04.011
Xu, H. L. (2018a). The run-out scal prediction of the rapid-steep channel debris-flow base on FLO-2D. Chengdu: Chengdu University of Technology.
Xu, Huiliang (2018b). The run-out scal prediction of the rapid-steep channel debris-flow base on FLO-2D. Chengdu: Chengdu University of Technology.
Xun, H., and Chuang, T. (2016). Quantitative risk assessment of catastrophic debris flows through numerical simulation. Adv. Earth Sci. 31 (10), 1047–1055.
Yan, H. M. (2016). Risk assessment of debris flow in main gully based on FLO-2D. Chengdu: Southwest Jiaotong University.
Yang, H. L., Fan, X. Y., and Jiang, Y. J. (2017). Analysis of engineering treatment effect of debris flow based on FLO-2D:Case of Yindongzi gully in Dujiangyan City. Yangtze River 48 (17), 66–71. 95. doi:10.1016/j.csite.2023.103325
Yang, W., Wan, F., Ma, S., Qu, J., Zhang, C., and Tang, H. (2023). Hazard assessment and formation mechanism of debris flow outbursts in a small watershed of the Linxia Basin. Front. Earth Sci. 10, 994593. doi:10.3389/feart.2022.994593
Zhang, F. X., Zhang, L. Q., Zhou, J., and Yang, Z. Y. (2019). Risk assessment of debris flow in Ruoru village,Tibet based on FLO-2D. J. Water Resour. Water Eng. 30 (5), 95–102. doi:10.1007/s11629-020-6448-x
Zhang, H. W., Liu, F. Z., and Wang, J. C. H. (2022). Hazard assessment of debris flows in Kongpo Gyamda,Tibet based on FLO-2D numericalsimulation. J. Geomechanics 28 (2), 306–318. doi:10.3969/j.issn.1006-6616.2008.03.009
Zhang, J. C., Li, X. L., Qin, Q. Z., and Zuo, Z. (2023b). Study on overlying strata movement patterns and mechanisms in super-large mining height stopes. Bull. Eng. Geol. Environ. 82 (3), 142. doi:10.1007/s10064-023-03185-5
Keywords: debris flow, FLO-2D, numerical simulation, rainfall frequency, risk assessment
Citation: Ding X-Y, Hu W-J, Liu F and Yang X (2023) Risk assessment of debris flow disaster in mountainous area of northern Yunnan province based on FLO-2D under the influence of extreme rainfall. Front. Environ. Sci. 11:1252206. doi: 10.3389/fenvs.2023.1252206
Received: 03 July 2023; Accepted: 23 August 2023;
Published: 11 September 2023.
Edited by:
Xuelong Li, Shandong University of Science and Technology, ChinaReviewed by:
Jianwen Shao, Tianjin University, ChinaCopyright © 2023 Ding, Hu, Liu and Yang. This is an open-access article distributed under the terms of the Creative Commons Attribution License (CC BY). The use, distribution or reproduction in other forums is permitted, provided the original author(s) and the copyright owner(s) are credited and that the original publication in this journal is cited, in accordance with accepted academic practice. No use, distribution or reproduction is permitted which does not comply with these terms.
*Correspondence: Xing-Yu Ding, ZGluZ3hpbmd5dUBobmN1LmVkdS5jbg==; Wen-Jun Hu, bGlzdDA3QG1haWxzLmpsdS5lZHUuY24=
Disclaimer: All claims expressed in this article are solely those of the authors and do not necessarily represent those of their affiliated organizations, or those of the publisher, the editors and the reviewers. Any product that may be evaluated in this article or claim that may be made by its manufacturer is not guaranteed or endorsed by the publisher.
Research integrity at Frontiers
Learn more about the work of our research integrity team to safeguard the quality of each article we publish.