- 1Huaiyin Normal University School of Economics and Management, Huaiyin, China
- 2State Key Laboratory of Cotton Biology, Institute of Cotton Research of the Chinese Academy of Agricultural Sciences, Anyang, China
- 3Western Agricultural Research Center, Chinese Academy of Agricultural Sciences, Changji, China
Introduction: Understanding and tracking changes in crop water requirements is crucial for effective irrigation, water planning, and future decisions. Determining the reference evapotranspiration (ETO) and crop evapotranspiration (ETC) of China cotton is essential for water resource management.
Methods: This study analyzed the spatiotemporal changes in ETO and ETC at 248 standard stations in cotton production regions of China from 1960 to 2019, and the ETO and ETC of each station were quantified by using the CropWat 8.0 and non-parametric Mann-Kendall test. The impacts of climate change on ETO and ETC were evaluated by analyzing the contribution rate and sensitivity coefficient of climate change.
Discussion: The results revealed distinct distributions of ETO and ETC across various growth stages and spatial scales in the cotton production regions of China. In the Huanghe Valley, the rate of decline for ETO decreased from 787.23 mm to 769.84 mm, while in the Yangtze Valley cotton region, it decreased from 749.19 mm to 735.01 mm. Similarly, in the Northwest inland cotton regions, the rate of decline for ETO reduced from 991.19 mm to 982.70 mm. As for ETC, the rate of decline decreased from 677.62 mm to 654.33 mm in the Huanghe Valley, from 653.02 mm to 625.50 mm in the Yangtze Valley, and from 916.25 mm to 886.74 mm in the Northwest inland cotton regions. ETO was highly sensitive to maximum air temperature (Tmax), followed by relative humidity (RH), sunshine duration (SD), wind speed at 2 m height (WS), and minimum air temperature (Tmin). WS was the most influential climate variable associated with ETO change, followed by Tmax, SD, RH, and Tmin. Significant declines in WS and SD were indicated in the decrease in ETO in the Huanghe Valley and Yangtze Valley cotton regions. WS showed a significant decrease in ETO in the northwestern inland cotton region. However, decreased RH and increased temperature commonly reversed the trend of ETO from 2000 to 2019, and the northwestern inland cotton region had the most significant upward trend. Amidst high temperatures and drought stress, the irrigation needs of cotton were rising, posing a significant threat to both cotton production and water resources.
1 Introduction
Agriculture stands as the predominant consumer of water resources, comprising roughly 70% of global water usage (Rockstrom, 2004). This vital sector also faces vulnerability to the looming threat of climate change due to GHG emissions (Abbas et al., 2022a; Elahi et al., 2022a; Abbas et al., 2022b; Elahi et al., 2022b). In 2021, the Sixth Assessment Report of the Intergovernmental Panel on Climate Change (IPCC) identified the urgent need to address climate change (Veal, 2021). Climate change has affected global agriculture and food production (Zhang et al., 2019; Ortiz-Bobea et al., 2021). Therefore, it is necessary to study the impact of climate change on crop production and propose coping strategies. Reference evapotranspiration (ETO) and crop evapotranspiration (ETC) are major components of the regional and global hydrological cycle. Between them, ETO is a key parameter for evaluating the degree of climate dryness and wetness and estimating crop water demand and crop production potential (Sananda et al., 2017), and ETC is an important index for managing agriculture and monitoring crop growth (Jin et al., 2017). Climate change affects the physiological characteristics of the crop mainly by influencing ETo and ETc, and ultimately agricultural production (Hoekstra et al., 2011; Irmak et al., 2012). Understanding the spatial and temporal evolution of ETO in the growing season is the initial step in calculating regional crop evapotranspiration and irrigation water planning (Jiang et al., 2019) and has important implications for agricultural irrigation water use and the assessment of crop water stress in agroecosystems (Walter et al., 2000).
Previous studies have shown that the whole change trend of ETO has decreased in recent decades from a global perspective, while an increasing ETO has been reported in some areas since the 1980s (Roderick and Farquhar, 2002; Sananda et al., 2017; Zeng et al., 2021), for example, Iran and some Mediterranean countries (Tabari et al., 2012; Masia et al., 2021). The changes in ETO and ETC have certain regional differences in China, but most regions show a downward trend (HU et al., 2017; Jia et al., 2019; Jiang et al., 2019). The emergence of this phenomenon has attracted a large number of scholars to explore its causes. However, due to the differences in geographical location and climatic conditions, different researchers have different explanations. Jiang et al. (2019) reported that relative humidity (RH) is the most sensitive climate variable to ETO, followed by sunshine duration (SD), maximum air temperature (Tmax), minimum air temperature (Tmin), and wind speed at 2 m height (WS) in Southwest China, which is consistent with the research of Fan et al. (2016) in China’s plain and hilly areas and Zuo et al. (2012) in the Weihe River basin, China. WS and SD were the most important factors affecting ETO and were recognized by most scholars (Dinpashoh et al., 2011; Jiang et al., 2019). Tmax had also been shown to play a crucial role (Tabari et al., 2012; Wang et al., 2017). The above research was helpful to better understand the impact of climate change on ETO and ETC. However, most previous studies focused on the annual or seasonal scale (Li et al., 2017; Wang et al., 2017). Relatively few studies have been performed on crops, especially cotton.
Cotton is an important economic fiber crop, a raw material for the textile industry, and an important strategic commodity (Adhikari et al., 2017). China, a large cotton producer, accounts for 25.4% of global production and has maintained a 34-year unit yield, ranking first among global cotton-producing countries (Mao et al., 2019; Jans et al., 2021). However, climate change challenges cotton growth and irrigation water requirements (Bange et al., 2016; Jans et al., 2021). Studies have shown that global warming increases the evapotranspiration demand of cotton plants, resulting in stronger water pressure (Hall, 2001). In the current research landscape, limited attention has been given to the comprehensive investigation of the spatiotemporal variability of water requirements for cotton cultivation in China. Consequently, this study aims to elucidate the spatiotemporal variation of both ETO and ETC in Chinese cotton. Additionally, the research seeks to identify the climatic factors that act as drivers influencing this variability. The insights gained from this study can provide valuable guidance for cotton production management and the rational allocation of water resources.
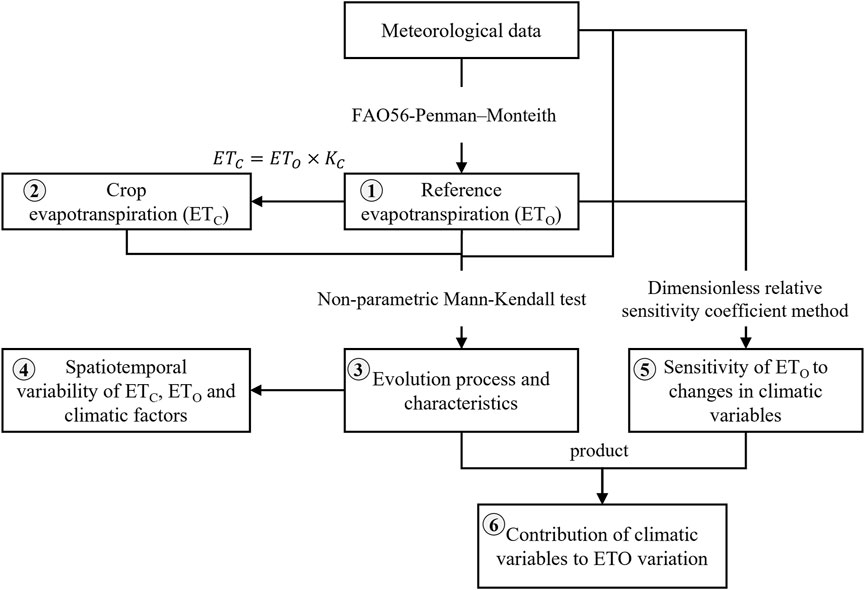
To achieve these objectives, we employ the following methodologies. Firstly, we quantify the spatial variability of ETO and ETC, as well as relevant climatic factors using the FAO56-Penman-Monteith equation through the CropWat 8.0 software. Secondly, we extract the temporal trends of ETO, ETC, and climatic factors using non-parametric Mann-Kendall test methods. Thirdly, we investigate the sensitivity of ETO to changes in various climatic variables at different growth stages, employing the sensitivity coefficient method. Lastly, we explore the contribution of climatic variables to the spatiotemporal variation of ETO using a sensitivity analysis. These well-defined methodologies provide a robust foundation for our study, allowing for comprehensive insights into the water pressure on Chinese cotton cultivation and its correlation with climate variations. Through the rigorous application of these methods, the outcomes of this study are poised to facilitate informed decision-making in cotton production management and promote the judicious allocation of precious water resources in the agricultural sector.
2 Data and methods
2.1 Study area
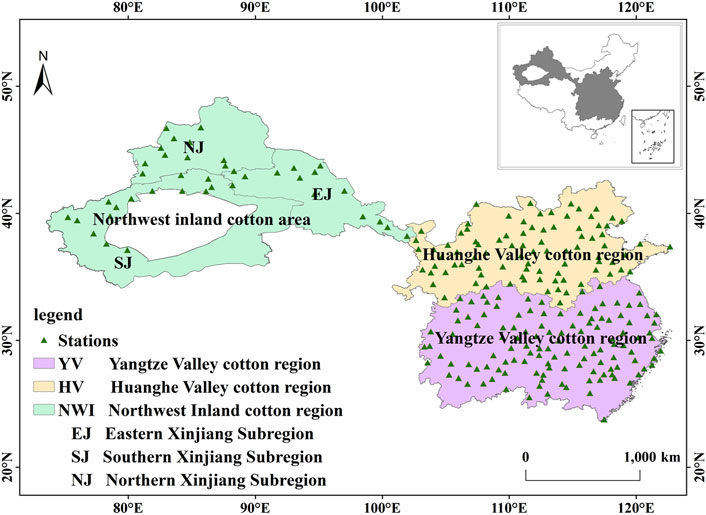
China has a vast cotton region. Cotton is cultivated within 20°–46°N and 76°–124°E. There are three dominant cotton-producing regions in the country, namely, the Yangtze Valley cotton region (a subtropical monsoon climate), the Huanghe Valley cotton region (a temperate monsoon climate predominates), and the northwestern inland cotton region (a temperate continental climate). The Northwestern inland cotton region includes three subregions: the Eastern Xinjiang subregion, the Southern Xinjiang subregion, and the Northern Xinjiang subregion. The spatial distribution of China’s main cotton regions and meteorological stations is shown in Figure 1.
2.2 Data sources
The data were mainly the routinely collected meteorological data from 248 standard meteorological stations in the main cotton regions of China from 1960 to 2019, including the daily minimum air temperature (Tmin, °C), daily maximum air temperature (Tmax, °C), sunshine duration hours (SD, h), wind speed at 2 m height (WS, m/s), and relative humidity (RH, %). The data were mainly obtained from the China Meteorological Science Data Sharing Service Network (http://data.cma.cn/); the time-series daily meteorological data that were used were long and continuous.
2.3 Reference evapotranspiration and crop evapotranspiration
The research framework is shown in Figure 2. ETO was calculated using the CropWat 8.0 model. The model calculates ETo using the Penman–Monteith equation. It was recommended as the sole standard method for ETO estimation by FAO in 1998 (Allen et al., 1998), which formula has been widely used (Fan and Thomas, 2013; Singh et al., 2022).
The equation is as follows:
where ETO is the daily reference evapotranspiration [mm/d], Rn is the net radiation at the crop surface [MJ/(m2 · d)], G is the soil heat flux density [MJ/(m2 · d)], T is the mean daily air temperature at 2 m height [°C], U2 is the wind speed at 2 m height [m/s], es is the saturation vapor pressure [kPa], ea is the actual vapor pressure [kPa], es-ea is the saturation vapor pressure deficit [kPa], Δ is the slope vapor pressure curve [kPa/°C], and γ is the psychrometric constant [kPa/°C].
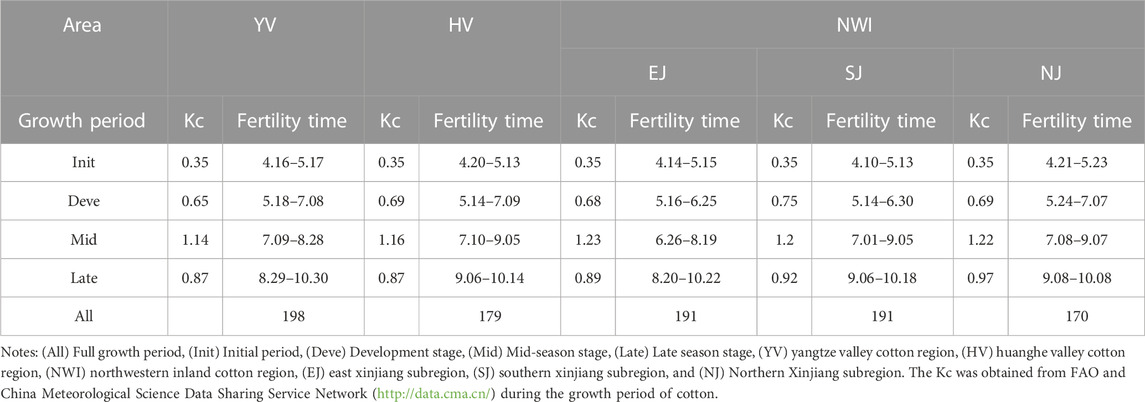
ETC was calculated, and the daily ETO time series was multiplied using crop coefficient (Kc) (Table 1) values (Yang et al., 2021).
The equation is as follows:
where Kc (Table 1) is the crop coefficient that converts ETO into ETc requirements.
2.4 Non-parametric Mann-Kendall test
The Mann-Kendall trend test was used to analyze the evolution process and characteristics of ETo and ETC and their related meteorological elements in the study area (Zhang et al., 2010). In the Mann-Kendall test, it was originally assumed that H0: the time series data (x1,…, xn) were n independent samples with the same distribution of random variables. An alternative hypothesis H1 was a two-sided test: for all k, j≤n and k ≠ j, the distributions of x and xj are not the same, a mutation test: let the climatic sequences x1, x2,…, xn, where Sk represents the ith sample, and Xi > Xj (1 ≤ j ≤ i) is the cumulative number. Sk was defined as follows:
Under the assumption of stochastic independence of the time series, the mean and variance of Sk was as follows:
Sk was standardized as follows:
UFK is a normal distribution of standard given significance and α is a given significance level; if |UFK| >Uα/2 (Uα/2 values can be found in the standard normal distribution chart. When taking a = 5% as the significance level, the corresponding value of Uα/2 is 1.96), it indicates that there is a significant trend change in the series. The time series x is arranged in reverse order and then calculated according to the above equation and at the same time:
2.5 Sensitivity and contribution rate analysis
The sensitivity of ETO to changes in climatic variables was investigated using the dimensionless relative sensitivity coefficient method (hereafter referred to as the sensitivity coefficient) based on the Penman–Monteith formula (McCuen, 1974). If Svi > 0, it means that the ETO has a positive sensitivity to the variation in the meteorological factor; if Svi < 0, it means that the ETO has a negative sensitivity. If | Svi | is larger, it indicates that changes in climate change have a greater impact on ETO (Supplementray Table S1).
The equation is shown below:
where Svi is the sensitivity coefficient of meteorological factor vi, ΔETO is the variation in reference evapotranspiration, vi is the meteorological factor, and Δvi is the variation in the meteorological factor.
The contribution of climatic variables to ETO variation was derived from the product of the multiyear relative rate of change and sensitivity. If Cvi>0, this means that the factor had a positive contribution to the variation in ETO. If Cvi<0, the changes in the factor decreased ETO, and the factor had a negative contribution.
where Cvi is the contribution rate of meteorological factor vi to ETO variation, %; RCvi is the relative change rate of vi, %; n is the number of years, which is 60 in this paper; avi is the mean value of vi; and Trendvi is the annual trend of vi, calculated by the trend analysis method.
2.6 Data analysis tools
The CropWat 8.0 model, Python, and Microsoft Excel 2016 were used for data processing and correlation analysis. The spatial distributions of Evapotranspiration (ETO) and Evapotranspiration Coefficient (ETC) were expressed using the inverse distance weighting method (IDW) interpolation techniques of ArcGIS 10.2, in conjunction with Origin 2018. Simultaneously, the variations of climatic factors were depicted using Kriging interpolation methods.
3 Results
3.1 Spatial and temporal change characteristics of climatic variables
The spatial distribution of climatic variables in the growth period of cotton in the past 60 years was different in China (Supplementary Figure S1). The highest values of Tmin, Tmax, and RH all appeared in the Yangtze Valley cotton region, with values of 27.42°C, 18.99°C, and 78.32%, respectively. Tmin and RH had the lowest values in the northwestern inland cotton region, with values of 11.23°C and 42.92%, respectively, and Tmax had the lowest value in the Huanghe Valley cotton region (24.75°C) (Figures 2A,B,E). The spatial distributions of SD and WS were the opposite of those of Tmin and RH; maximum values were mainly distributed in the northwestern inland cotton region, and the values in the eastern Xinjiang subregion were the highest at 9.16 h and 2.75 m/s, respectively, while the values in the Yangtze Valley cotton region were the lowest at 5.30 h and 1.97 m/s, respectively. In addition, there were differences in the spatial distribution of climatic variables in different growth stages of cotton (Supplementary Figures S1-S6). The Tmin, Tmax, and SD in the mid-season stage of cotton were significantly higher than those in the other growth stages.
The Tmin and Tmax generally showed an upward trend, while WS and RH showed a downward trend in the cotton regions of China in the past 60 years. SD showed a downward trend in the Huanghe Valley and Yangtze Valley cotton regions and had an upward trend in the northwestern inland cotton region (Figure 3). In addition to Tmin in the Yangtze Valley cotton region, the mutation times of Tmin and Tmax in the cotton regions of China were mainly concentrated in approximately 1996 and showed a significant upward trend after mutation. The increasing rates of Tmin were 0.31°C/decade, 0.22°C/decade, 0.52°C/decade, 0.38°C/decade, and 0.42°C/decade in the Huanghe Valley, Yangtze Valley, and northwestern inland cotton regions (East Xinjiang subregion, South Xinjiang subregion, and North Xinjiang subregion), respectively, and the increasing rates of Tmax were 0.19°C/decade, 0.21°C/decade, 0.32°C/decade, 0.19°C/decade, and 0.18°C/decade, respectively (Supplementray Table S2). The SD showed a decreasing trend at rates of −0.16 h/decade and −0.14 h/decade in the Huanghe Valley and Yangtze Valley cotton regions, respectively, and showed an increasing trend of 0.01 h/decade in the northwestern inland cotton region. WS had the largest rate of decline in the Huanghe Valley cotton region, followed by the northwestern inland cotton region and the Yangtze Valley cotton region, which had values of 0.19 m/s/decade >0.11 m/s/decade >0.07 m/s/decade. RH had a downward trend after 2010 in China’s major cotton planting regions, and the average change rates were −0.58%/decade, −0.51%/decade, and −0.32%/decade in the Huanghe Valley, the Yangtze Valley, and the northwestern inland cotton regions, respectively.
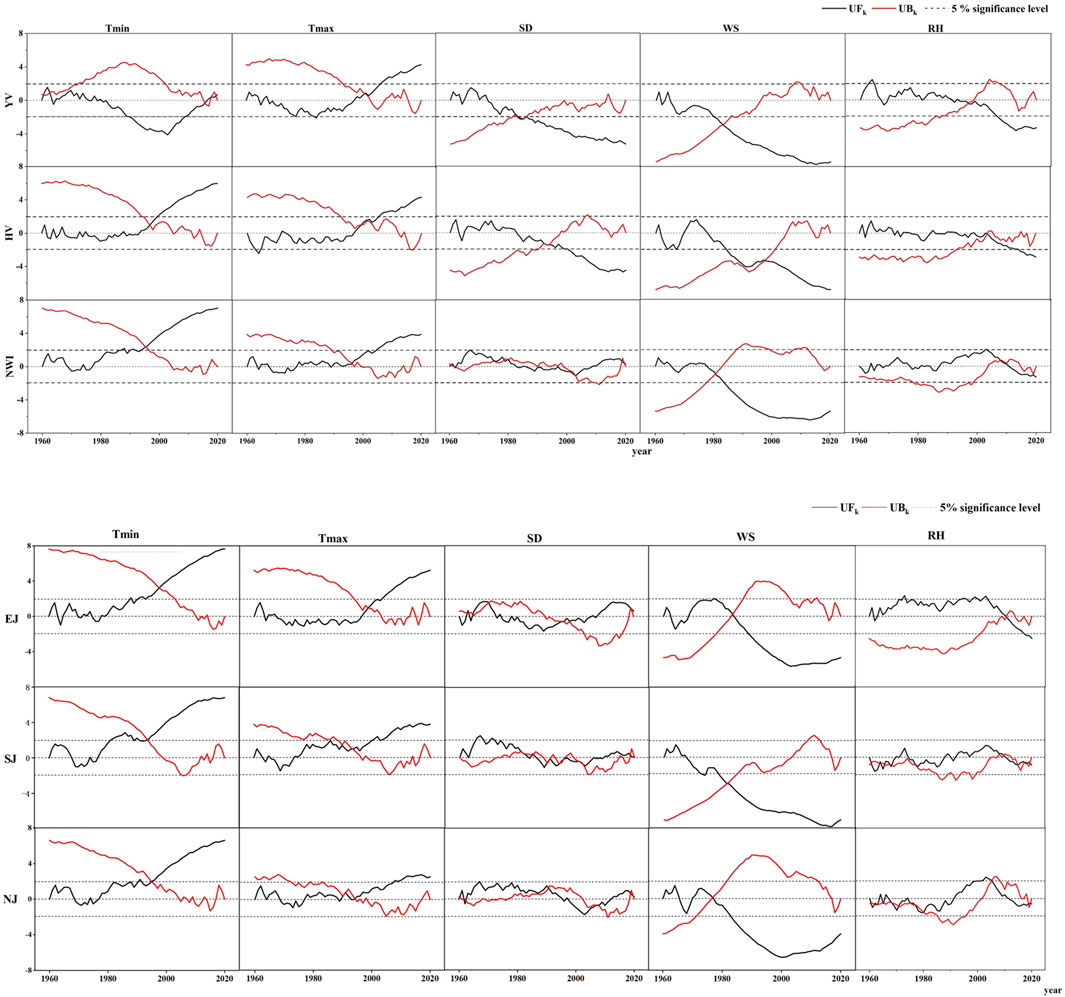
FIGURE 3. Non-parametric Mann-Kendall test of climatic variables in China’s cotton regions from 1960 to 2019. (Tmin) minimum air temperature, (Tmax) maximum air temperature, (SD) sunshine duration hours, (WS) wind speed at 2 m height, and (RH) relative humidity. (YV) Yangtze Valley cotton region, (HV) Huanghe Valley cotton region, (NWI) northwestern inland cotton region, (EJ) eastern Xinjiang subregion, (SJ) southern Xinjiang subregion, and (NJ) northern Xinjiang subregion.
3.2 Spatial and temporal variation characteristics of reference evapotranspiration (ETO) and cotton evapotranspiration (ETC)
The distribution of ETO and ETC in the growing season showed an obvious spatial gradient (Figure 4; Figure 5). The ETO and ETC values decreased from west to east and from north to south. The ETO and ETC values in the northwestern inland cotton region were higher than those in the Huanghe Valley and Yangtze Valley cotton regions. The ETO values were 978 mm, 778 mm, and 739 mm in the northwestern inland cotton region, Huanghe Valley cotton region, and Yangtze Valley cotton region, respectively, and the ETC values were 891 mm, 663 mm, and 628 mm, respectively (Figure 4A; Figure 5A). In particular, the eastern Xinjiang subregion of the northwestern inland cotton region had the highest values of ETO and ETC, with average values of 1,060 mm and 981 mm, respectively, while the ETO and ETC were lowest in the western Yangtze Valley cotton region, with average values of 609 mm and 506 mm, respectively. The whole growth period of cotton was divided into four stages. The ETO and ETC of cotton first increased and then decreased during the growth period, and the maximum values occurred in the mid-season stage (Figures 4B–E; Figures 5B–E). The value of ETO accounted for 33.91%, 32.20%, and 38.36% of the total growth period, respectively, and the value of ETC accounted for 48.45%, 43.26%, and 51.27% of the total growth period, respectively.
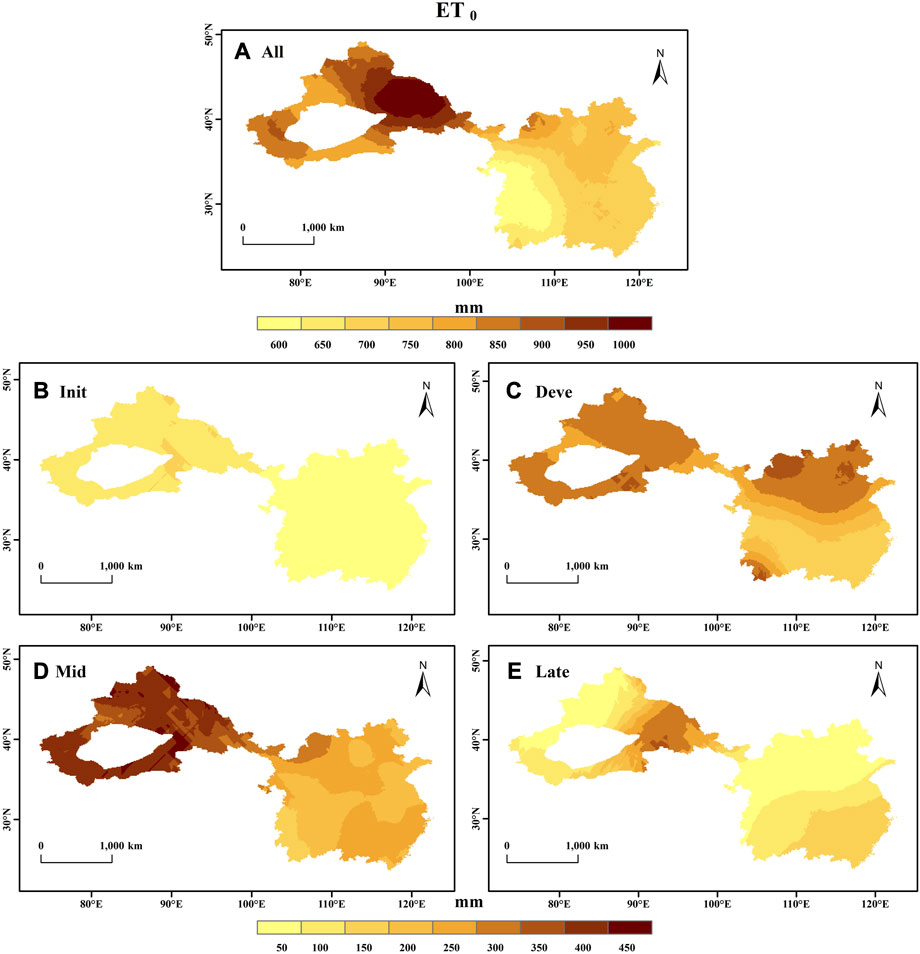
FIGURE 4. The spatial distribution of reference evapotranspiration (ETO) in different growth periods of cotton in the cotton areas of China from 1960 to 2019. (All) full growth period, (Init) initial period, (Deve) development stage, (Mid) mid-season stage, and (late) late season stage.
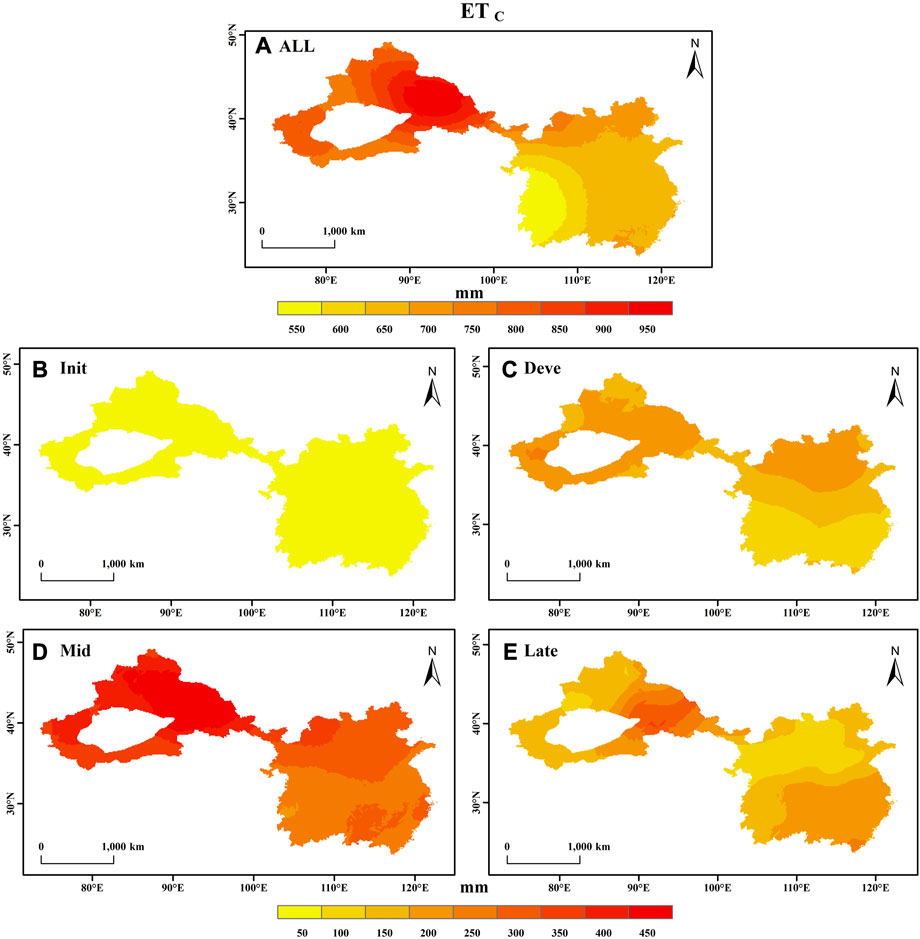
FIGURE 5. The spatial distribution of crop evapotranspiration (ETC) in different growth periods of cotton in the cotton areas of China from 1960 to 2019. (All) full growth period, (Init) initial period, (Deve) development stage, (Mid) mid-season stage, and (late) late season stage.
ETO and ETC showed a decreasing trend in the major cotton regions in China from 1960 to 2019 (Figure 6). However, the decreasing trend was different in each cotton region. The ETO and ETC of the Huanghe Valley cotton region decreased from 787.23 mm and 677.62 mm in 1960–1979 to 769.84 mm and 654.33 mm in 2000–2019, respectively, at a rate of −3.49 mm/decade and −4.83 mm/decade. The ETO and ETC of the Yangtze Valley cotton region decreased from 749.19 mm and 653.02 mm in 1960–1979 to 735.01 mm and 625.50 mm in 2000–2019, respectively, at a rate of −3.98 mm/decade and −6.97 mm/decade, respectively (Supplementray Table S3). The mutation time of ETO and ETC occurred in approximately 1973 in the Huanghe Valley and Yangtze Valley cotton regions and showed a downward trend after the mutation occurred. The northwestern inland cotton region showed a downward trend overall, and the rates of decline of ETO and ETC were −0.14 mm/decade and −0.61 mm/decade, respectively. However, the northwestern inland cotton region showed an upward trend after 2000. Changes between the subregions were different, and the change rates of ETO in the eastern, southern, and northern subregions were 2.49 mm/decade, −2.07 mm/decade, and −6.45 mm/decade, respectively; the change rates of ETC were −1.96 mm/decade, −2.14 mm/decade, and −14.05 mm/decade, respectively. However, the ETO and ETC in cotton regions in China showed an upward trend from 2000 to 2019 except for the northern Xinjiang subregion of the northwestern inland cotton region, with an upward trend in the eastern Xinjiang subregion.
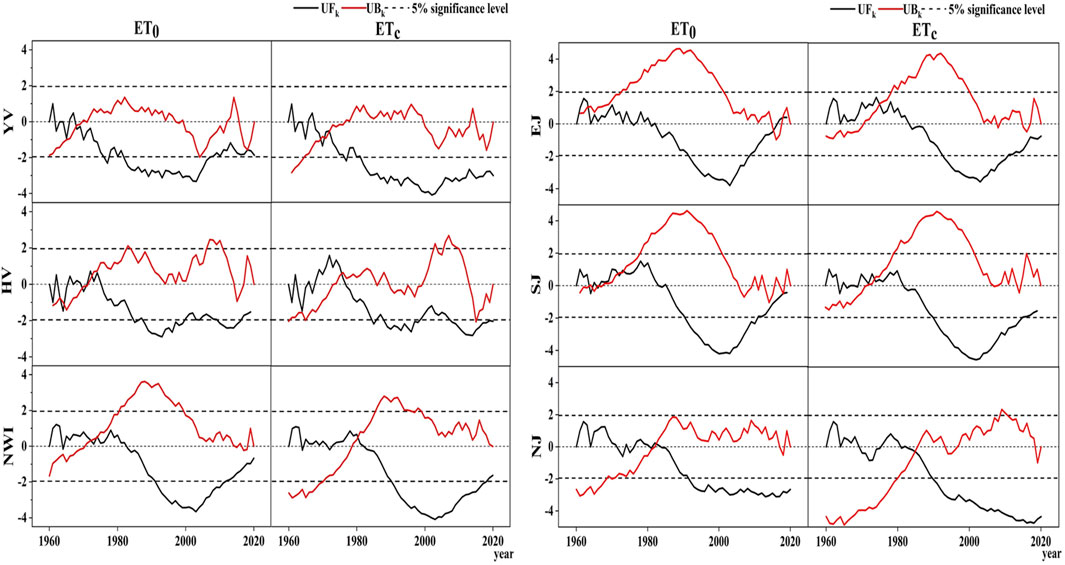
FIGURE 6. Non-parametric Mann-Kendall test of reference evapotranspiration (ETO) and crop evapotranspiration (ETC) in China’s main cotton regions from 1960 to 2019. (YV) Yangtze Valley cotton region, (HV) Huanghe Valley cotton region, (NWI) northwestern inland cotton region, (EJ) eastern Xinjiang subregion, (SJ) southern Xinjiang subregion, and (NJ) northern Xinjiang subregion.
3.3 Sensitivity of reference evapotranspiration (ETO) to climatic variables
Climate change will affect the regional ETO. The sensitivity of ETO to climatic variables was explored by means of sensitivity coefficients to further understand the influence of climatic variables on ETO. ETO was most sensitive to Tmax in the cotton region of China from 1960 to 2019, and its average sensitivity coefficient was 0.49, followed by RH (−0.45), SD (0.27), WS (0.19), and Tmin (0.14) (Figure 7). In addition, the sensitivity coefficients for RH had a negative correlation, the sensitivity coefficients for Tmin, Tmax, and SD had a positive correlation, the sensitivity coefficients for WS were positive in 99% and negative in 1%, and the negative correlation region was mainly concentrated in the south of the Yangtze Valley cotton region. The sensitivity of ETO to climatic variables in cotton regions had certain differences due to the geographical distribution. The most sensitive climatic variable was RH, followed by Tmax, SD, Tmin, and WS in the Huanghe Valley cotton region and Yangtze Valley cotton region from 1960 to 2019. The most sensitive climatic variable was Tmax, followed by RH, WS, SD, and Tmin in the northwestern inland cotton region from 1960 to 2019. ETO was most sensitive to Tmax change in the Yangtze Valley cotton region (0.54), followed by the northwestern inland cotton region (0.50) and the Huanghe Valley cotton region (0.45). The sensitivity of ETO to Tmin, RH, and SD decreased gradually from the Yangtze Valley cotton region to the northwest, showing a step-like decline. The highest sensitivity coefficient values in the cotton region of the Yangtze River basin were 0.27, −0.87, and 0.37. The lowest values were in the northwestern inland cotton region, which were 0.09, −0.28, and 0.24. The spatial distribution of the sensitivity of ETO to WS was the opposite of Tmin, RH, and SD, showing a step-like decline from the northwestern inland cotton region to the southeast. The sensitivity coefficient was the highest in the northwestern inland cotton region (0.25) and the lowest in the Yangtze Valley cotton region (0.09).
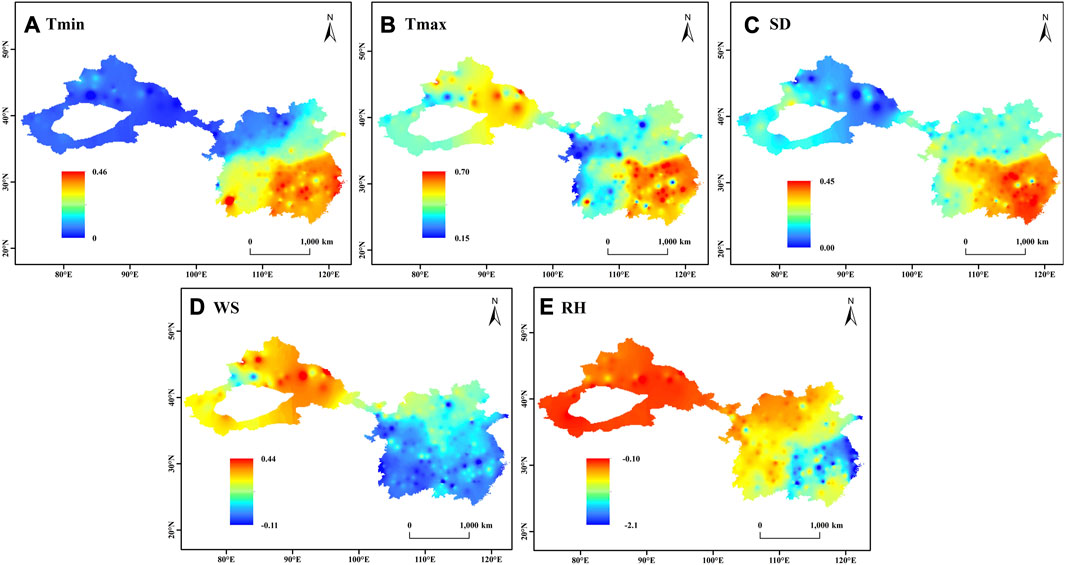
FIGURE 7. The sensitivity coefficients of climatic variables to the changes in ETO in the full growth stages of cotton in China. (A) Minimum air temperature (Tmin), (B) maximum air temperature (Tmax), (C) sunshine duration (SD), (D) wind speed at 2 m height (WS), and (E) relative humidity (RH).
The spatial distribution of ETO sensitivity to climate changes in different growth stages was similar to that in the whole growth period in each cotton region (Figure 8). The sensitivity of ETO to climatic variables first increased and then decreased with the growth of cotton. The sensitivity of Tmin, Tmax, RH, and SD was the highest in the mid-season stage, with values of 0.18, 0.56, −0.47, and 0.33, respectively, and the growth stage with the lowest sensitivity coefficient was the initial period, with sensitivity coefficients of 0.10, 0.48, −0.44, and 0.23, respectively (Figures 8A–C). The highest sensitivity coefficient for ETO to WS was in the development stage, with a sensitivity coefficient of 0.22, and the lowest sensitivity coefficient was in the late season stage, with a sensitivity coefficient of 0.15 (Figure 8D).
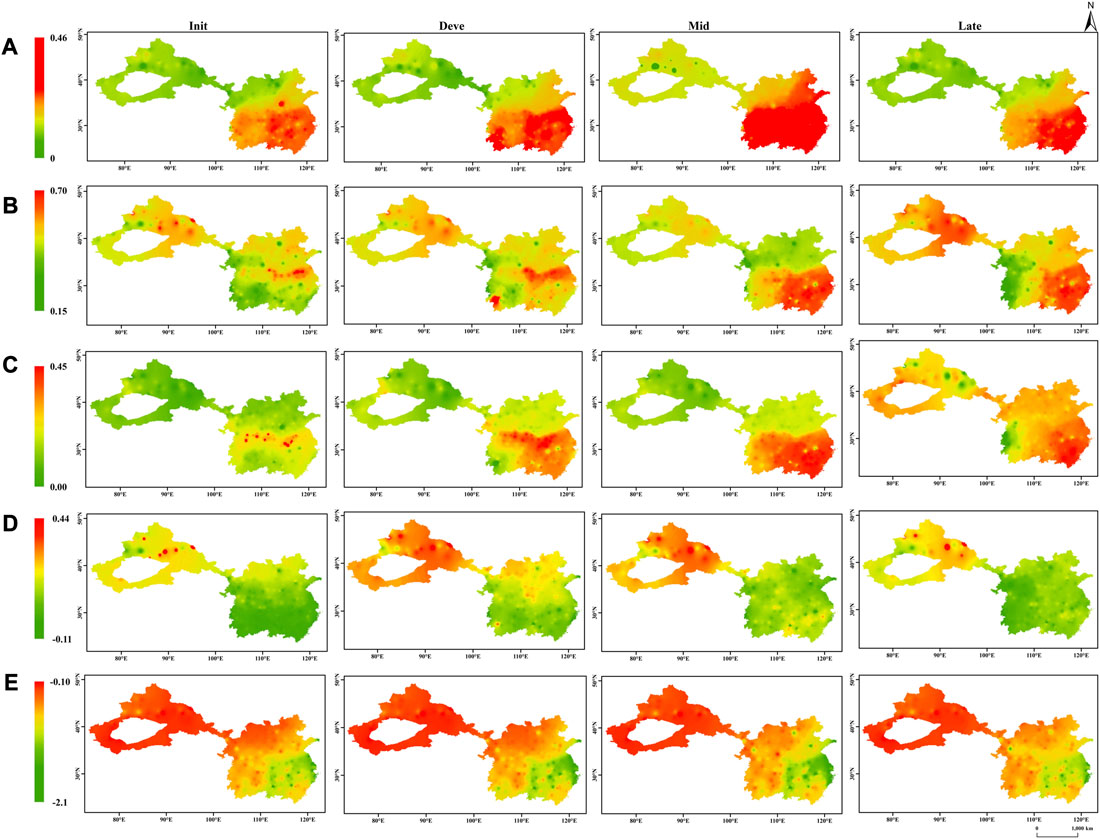
FIGURE 8. The sensitivity coefficients of ETO to changes in climatic variables in different growth stages of cotton. (A) Minimum air temperature (Tmin), (B) maximum air temperature (Tmax), (C) sunshine duration (SD), (D) wind speed at 2 m height (WS), (E) relative humidity (RH), (Init) initial period, (Deve) development stage, (Mid) mid-season stage, and (Late) late-season stage.
3.4 The contribution rate of climatic variables to reference evapotranspiration (ETO)
To identify the main climatic variables affecting ETO changes in cotton in China and its three cotton regions, the relative contribution method was adopted to quantify the contribution of climatic variables to ETO change (Figure 9). WS was an important climatic variable affecting the growing season ETO trends, causing a reduction in ETO by −4.26%, thereby becoming the largest contributor to the decreasing growing season ETO from 1960 to 2019 in the cotton region of China. In addition, SD had a negative impact on ETO, with a contribution rate of −2.22%. Tmax was the crucial contributor to the increase in ETO, with a contribution rate of 2.59%, followed by RH and Tmin, with contribution rates of 2.02% and 1.99%, respectively, in the cotton region of China. However, the same climate variable might have different contribution rates to the change in ETO in the three cotton regions because of different sensitivities and changes in climate change in terms of spatial distribution. Tmax, Tmin, and RH had positive contributions to ETO during the growing season, and WS had negative contributions to ETO. However, SD had a negative contribution to ETO in the Huanghe Valley and the Yangtze Valley cotton regions but had a positive contribution to ETO in the northwestern inland cotton region. SD was the meteorological factor with the largest contribution rate to ETO changes in the Huanghe Valley and the Yangtze Valley cotton regions, with contribution rates of −7.02 and −4.40, respectively. WS was the meteorological factor with the largest contribution rate to ETO changes in the northwestern inland cotton region, and the contribution rates were −4.16, −3.93, and −8.59 in the eastern Xinjiang subregion, southern Xinjiang subregion, and northern Xinjiang subregion, respectively.
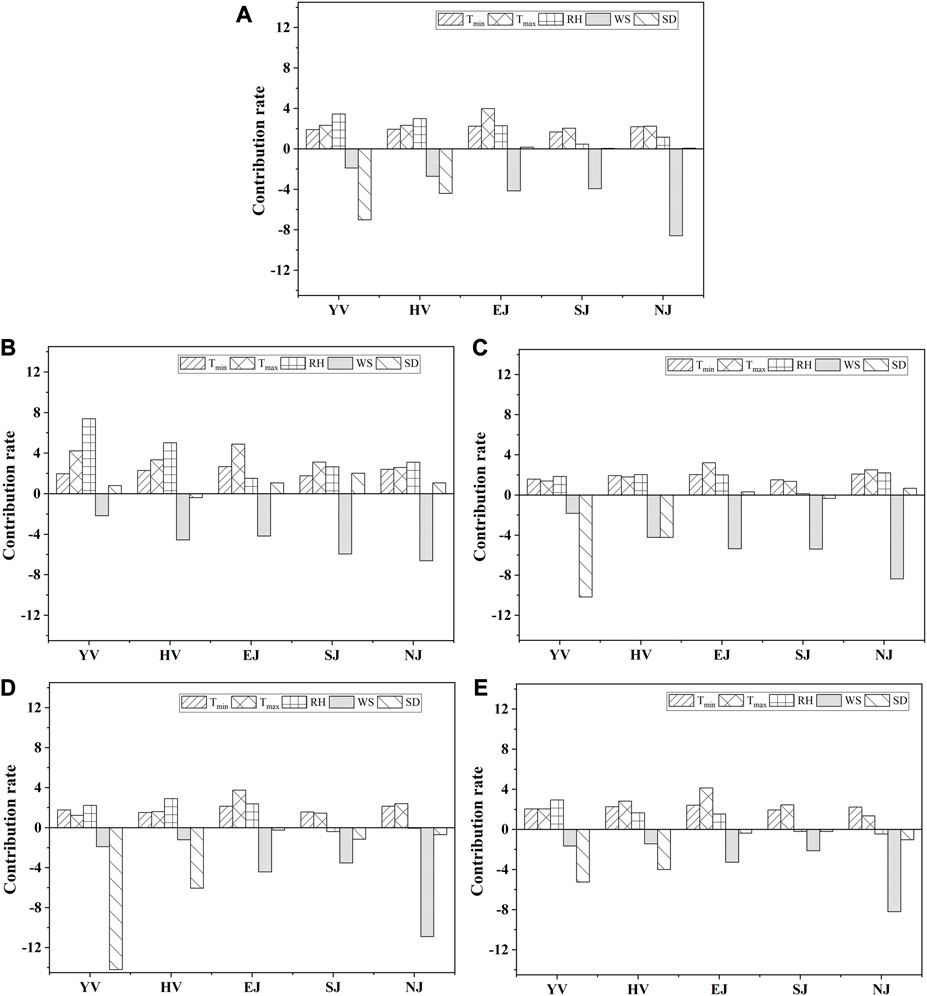
FIGURE 9. The sensitivity coefficients of climatic variables to the changes in ETO in different growth stages of cotton in China. (A) All: Full growth period, (B) (Init) Initial period, (C) Deve: Development stage, (D) Mid: Mid-season stage, and (E) Late: Late season stage. (Tmin) minimum air temperature, (Tmax) maximum air temperature, (SD) sunshine duration hours, (RH) relative humidity, and (WS) wind speed at 2 m height. (YV) Yangtze Valley cotton region, (HV) Huanghe Valley cotton region, (NWI) northwestern inland cotton region, (EJ) eastern Xinjiang subregion, (SJ) southern Xinjiang subregion, and (NJ) northwestern inland cotton region.
The contribution rates of Tmin, Tmax, and RH to ETO trends were highest in the initial period, with values of 2.22%, 3.63%, and 3.94%, respectively. The contribution rates of Tmin and Tmax were the lowest in the development stage, with values of 1.83% and 2.05%, respectively. The contribution rate of RH was the lowest in the mid-season stage (1.41%). The contribution rate of WS was the highest in the development stage (−5.05%) and the lowest in the late season stage (−3.34%). The contribution rate of SD was the highest in the mid-season stage (−4.47) and the lowest values were in the initial period (0.91%) (Figures 9B–E).
4 Discussion
4.1 Spatial and temporal analysis of climatic change
Climate change in China’s cotton regions was a microcosm of overall climate change in China. With the increase in population and the acceleration of industrialization, the emission of pollutants gradually increased, and aggregated aerosols from anthropogenic emissions of pollutants were the main dimming factor (Feng et al., 2017). The increase in aerosols weakens the direct solar radiation, resulting in a reduced SD. The Huanghe Valley and Yangtze Valley cotton regions are located in low-altitude areas, with high population density, concentrated human activities, and developed industry, and pollution is more serious than that in the northwestern inland cotton region, which has a low population density. Therefore, the declining trend of SD in the Huanghe Valley and Yangtze Valley cotton regions is more obvious than that in the northwestern inland cotton region. The changing trend of WS was consistent with the research of Jiang et al. from 1960 to 2000 (Li et al., 2014; Jiang et al., 2019); however, the research results were different after 2000. Contrary to the results of the gradual increase in WS in recent years in the research of scholars such as Sun et al. (2013), the WS of the main cotton areas in China showed a significant downward trend. There were two main reasons for the decline in WS. First, the weakening of the atmospheric circulation and the significant increase in temperature in the cotton regions of China (McVicar et al., 2012) changed the pressure difference that formed the atmospheric circulation and slowed the wind speed. Additionally, an increase in human activities and vegetation coverage and an increase in surface roughness resulted from human activities, such as planting and urbanization (Liu et al., 2013; Shi et al., 2017).
Temperature showed a significant upward trend in China’s major cotton regions. Aerosols and increasing greenhouse gases are the main causes of the global temperature rise (Najafi et al., 2015). The upward trend of Tmin is more obvious than that of Tmax. Aerosols and greenhouse gases absorb most of the solar radiation during the day and release energy into the atmosphere in the form of longwave radiation at night (Jiang et al., 2019). The changing trend of RH between 1960 and 2000 was not obvious, but in recent years, the downward trend has gradually increased. This result was consistent with previous research results (Li et al., 2017; Yang et al., 2021), which were related to the significant increase in temperature in recent years.
4.2 Spatial and temporal analysis of the reference evapotranspiration (ETO) and cotton evapotranspiration (ETC)
ETO and ETc play an important role in agricultural water resource dispatching, irrigation system formulation, and farmland water management (Reddy, 2015; Pandey et al., 2016). Only comprehensively exploring the temporal and spatial evolution of ETO that is influenced by climatic conditions and ETc that is influenced by the physical characteristics of the crop itself can improve well-irrigated and agricultural water management. The study of ETO and ETc of major cotton regions in China showed the highest in the Northwest inland cotton regions and the lowest in the Yangtze Valley cotton regions. The reliability of this study’s conclusion is reinforced as Li et al.’s (2017) results aligned with ours. Liu et al. (2022) found that the range of ETO of the spring wheat planting area was 460.6–809.3 mm in the Huanghe Valley Basin, which is also consistent with the present study. However, Yang et al. (2022) estimated that the ETc of cotton ranged from 551 to 606 mm in the North China Plain, which is lower than the results of this study. Mainly, the North China Plain is a sub-region of the Huanghe Valley cotton regions, and ETc in places such as Shaanxi located in the western part of the Huanghe Valley cotton region is higher than in the region where the North China Plain is located. Yang et al. (2022) indicated that the maximum value of ETc shifted from the south to the west of the North China Plain, which also proved this point.
Studies have shown that the ETO and ETC in China’s major cotton regions showed a downward trend, which was consistent with the “evaporation paradox” of many studies (Roderick and Farquhar, 2002; Li et al., 2012; Jiang et al., 2019). However, ETO and ETC in the Inland Northwest cotton regions showed an upward trend after 2000. Li et al. (2014) pointed out that the annual ETO showed an upward trend from 2000 to 2009. In Southwest China, Li et al. (2014) pointed out that from 1958 to 1993, the ETO level decreased and then increased in Northwest China, which was consistent with the results obtained in this study. The ETO and ETC showed differences in different growth stages of cotton. With the increase in the cotton growth period, the ETO and ETC of cotton first increased and then decreased, and the value was the largest in the mid-season. Cotton was in the reproductive growth stage at this stage, with relatively active physiological and biochemical activities, increased evapotranspiration, and constantly increased water demand, which promoted the ETO and ETC at this stage to be significantly higher than those at other stages in the cotton growing period. The most critical water requirement of cotton was in June at its blossoming and boll-forming stage (Yang et al., 2021). Therefore, irrigation should be increased during the rapid development stage or mid-season stage to ensure normal water demand.
4.3 Sensitivity and contribution rate of reference evapotranspiration (ETO) to the variation in climatic
Trends and fluctuations in climatic factors lead to variations in ETO and ETc (Yang et al., 2021). Exploring the effects of climate change on ETO changes can help predict ETO changes in the context of climate change (Feng et al., 2017). The study showed that the sensitivity of the climatic variables in the cotton areas of China was ranked as follows: Tmax (0.49) > RH (|−0.45|) > SD (0.27) > WS (0.19) > Tmin (0.14). However, the vast span of the cotton region in China necessitates regional studies due to the diversity of regional geographical and climatic conditions. The most sensitive climatic variable was RH in the Huanghe Valley cotton region and Yangtze Valley cotton region, and the most sensitive climatic variable was Tmax in the northwestern inland cotton region. This result was similar to previous studies. Zuo et al. (2012) and Jiang et al. (2019) found that RH was the most sensitive meteorological factor to ETO changes in the Huanghe Valley and southern China. Li et al. (2014) found that Tmax was the most sensitive meteorological factor to ETO changes in the northwestern inland. In addition, the coefficients of Tmin, Tmax, and SD for the mid-season stage were maximized, which is similar to the study by Wang et al. (2014).
The contribution rate of climate change depends not only on the sensitivity of ETO to climate change but also on the magnitude of the trend of climate change (Li et al., 2017). The sensitivity coefficient of Tmax was the highest, but the variation range was limited, so the contribution rate of Tmax to the variation in ETO was not the highest. The largest contribution to ETO was WS (−4.26%), followed by Tmax (2.58%) > SD (−2.23%) > RH (2.07%) > Tmin (2.00%). However, due to the difference in the geographical environment, the contribution to ETO in different cotton areas was different. Wang et al. (2017) pointed out that SD had the greatest impact on ETO in the eastern part of the Huanghe River and southern China, and WS played an important role in the change in ETO in northwestern China, which is consistent with this study. The decrease in SD resulted in a decrease in energy reaching the leaves. The reduction in WS reduces the diffusion of water molecules through turbulent flow, resulting in a further reduction in evaporative demand, and the decline rate of WS and SD is higher than the increase rate of temperature in most cotton regions, so the decline in WS and SD offsets the effect of temperature on ETO and ETC changes (Sun et al., 2013; Wang et al., 2017; Yang et al., 2022). However, the declining trend of ETO and ETC has been gradually broken by the decrease in RH in recent years. The decrease in RH will reduce atmospheric vapor pressure and accelerate the release of water vapor from cotton stomata (Jiang et al., 2019). In addition, under the background of a continuous temperature increase, the ETO and ETC of the cotton regions may increase in the future, especially the northwestern inland cotton region. The characteristics of the stages of growth of cotton ETO and ETC evolution and influencing factors of the study are indispensable in the context of climate change, and the analysis methods of the sensitivity coefficient and contribution rate can be extended to other crops.
4.4 Limitations and prospects
As widely recognized, climate change significantly impacts crop growth by influencing the hydrological cycle (Zeng et al., 2021). Understanding the changes in ETO and ETC is crucial for scientifically managing water resources and promoting sustainable agricultural production. However, some studies have suggested that the effect of climate change on agriculture may be limited (Piao et al., 2010). In this study, we focused solely on the influence of climate factors on ETO and ETC, overlooking the essential roles that different crop varieties and management practices play in shaping ETO and ETC of cotton. Moving forward, we intend to explore the intricate interplay between genes, management measures, environmental factors, and other variables affecting ETO and ETC of cotton. Moreover, cotton, being a water-intensive crop, is susceptible to water stress, making it imperative to investigate strategies to reduce ETO and ETC in cotton production. It is important to note that this study solely presents a sensitivity analysis of local meteorological factors on ETO changes. We did not take into account the far-reaching effects of large-scale climate variability, which originates from the oceans and serves as critical drivers of global and regional climate change. These effects can have significant impacts on the evolutionary pattern of ETO (Fan et al., 2016; Liu et al., 2018). Through ongoing research, we aim to gain a more comprehensive understanding of the multifaceted factors influencing ETO and ETC of cotton, thereby contributing to informed agricultural water management and adaptive strategies in the face of evolving climate conditions.
5 Conclusion
Based on daily data from 248 meteorological stations in the cotton region of China from 1960 to 2019, the spatial and temporal evolutionary trends of ETO and ETC during the cotton growing period were analyzed, as were the sensitivity coefficients and contributions of climatic variables to the changes in ETO. The decline rates of ETO in the Huanghe Valley cotton region, Yangtze Valley cotton region, and the northwestern inland cotton region were −3.49 mm/decade, −3.98 mm/decade, and −1.37 mm/decade, respectively, and the decline rates of ETC were −4.83 mm/decade, −6.97 mm/decade, and −6.05 mm/decade, respectively. The sensitivity coefficient of ETO to the change in climatic variables was Tmax (0.49)> RH (|−0.45|)> SD (0.27)> WS (0.19)> Tmin (0.14). The contribution rate of climatic variables to ETO was WS (|−4.26%|)>Tmax (2.58%)>SD (2.23%)>RH (2.07%)>Tmin (2.00%). Except for the decreases in ETO and ETC with the increase in RH, the changes in temperature (Tmax and Tmin), SD, and WS all had positive effects on ETO and ETC, so the ETO and ETC decreased with the significant decrease in WS and SD in 1960–2000. However, the significant decrease in RH (UFk < −1.96) and the significant increase in temperature (UFk>1.96) prompted the ETO and ETC to increase after 2000, which not only increased the production and irrigation of cotton but also potentially caused extremely high temperature and drought stress. Consequently, according to the characteristics of the cotton region and cotton growth stage in the context of climate change, it is necessary to formulate the most suitable irrigation plan, improve water utilization efficiency, and reduce cotton production costs to cope with more severe climate change in the future. (Mancosu et al., 2016).
Data availability statement
Publicly available datasets were analyzed in this study. This data can be found here: The data were mainly obtained from the China Meteorological Science Data Sharing Service Network (http://data.cma.cn/) the used time-series daily meteorological data were long and continuous.
Author contributions
Conceptualization, YS and ZW; methodology, JL; software, JW; validation, YS and LW; formal analysis, KW; writing—original draft preparation, YS; writing—review and editing, YS and JW; visualization, AL; supervision, LG; project administration, ZW and LG. YS and JW contributed equally to the present work. All authors contributed to the article and approved the submitted version.
Funding
This work was financially supported by the National Key R&D Program of China (2022YFE0125700).
Conflict of interest
The authors declare that the research was conducted in the absence of any commercial or financial relationships that could be construed as a potential conflict of interest.
Publisher’s note
All claims expressed in this article are solely those of the authors and do not necessarily represent those of their affiliated organizations, or those of the publisher, the editors and the reviewers. Any product that may be evaluated in this article, or claim that may be made by its manufacturer, is not guaranteed or endorsed by the publisher.
Supplementary material
The Supplementary Material for this article can be found online at: https://www.frontiersin.org/articles/10.3389/fenvs.2023.1251789/full#supplementary-material
References
Abbas, A., Waseem, M., Ahmad, R., khan, K. A., Zhao, C., and Zhu, J. (2022a). Sensitivity analysis of greenhouse gas emissions at farm level: Case study of grain and cash crops. Environ. Sci. Pollut. R. 29, 82559–82573. doi:10.1007/s11356-022-21560-9
Abbas, A., Zhao, C., Waseem, M., Ahmed khan, K., and Ahmad, R. (2022b). Analysis of energy input–output of farms and assessment of greenhouse gas emissions: A case study of cotton growers. Front. Env. Sci-Switz 9. 826838, doi:10.3389/fenvs.2021.826838
Adhikari, P., Gowda, P., Marek, G., Brauer, D., Kisekka, I., Northup, B., et al. (2017). Calibration and validation of CSM-CROPGRO-Cotton model using lysimeter data in the Texas High Plains. J. Contemp. Wat Res. Ed. 162 (1), 61–78. doi:10.1111/j.1936-704X.2017.03260.x
Allen, R. G., Pereira, L. S., Raes, D., and Smith, M. (1998). “Crop evapotranspiration: Guidelines for computing crop water requirements,” in Food and agriculture organization (Rome, Italy: FAO Irrigation and Drainage Paper). doi:10.1016/j.eja.2010.12.001
Bange, M. P., Baker, J., Bauer, P., Broughton, K., Constable, G., Luo, Q., et al. (2016). Climate change and cotton Production in modern farming systems. Wallingford, UK: CABI. doi:10.1079/9781780648903.0000
Dinpashoh, Y., Jhajharia, D., Fakheri-Fard, A., Singh, V. P., and Kahya, E. (2011). Trends in reference crop evapotranspiration over Iran. J. Hydrol. 399 (3-4), 422–433. doi:10.1016/j.jhydrol.2011.01.021
Elahi, E., Khalid, Z., Tauni, M. Z., Zhang, H., and Lirong, X. (2022). Extreme weather events risk to crop-production and the adaptation of innovative management strategies to mitigate the risk: A retrospective survey of rural Punjab, Pakistan. Technovation 117, 102255. doi:10.1016/j.technovation.2021.102255
Elahi, E., Khalid, Z., and Zhang, Z. (2022). Understanding farmers’ intention and willingness to install renewable energy technology: A solution to reduce the environmental emissions of agriculture. Appl. Energ 309, 118459. doi:10.1016/j.apenergy.2021.118459
Fan, J., Wu, L., Zhang, F., Xiang, Y., and Zheng, J. (2016). Climate change effects on reference crop evapotranspiration across different climatic zones of China during 1956–2015. J. Hydrol. 542, 923–937. doi:10.1016/j.jhydrol.2016.09.060
Fan, Z.-X., and Thomas, A. (2013). Spatiotemporal variability of reference evapotranspiration and its contributing climatic factors in Yunnan Province, SW China, 1961–2004. Clim. Change 116 (2), 309–325. doi:10.1007/s10584-012-0479-4
Feng, Y., Cui, N., Zhao, L., Gong, D., and Zhang, K. (2017). Spatiotemporal variation of reference evapotranspiration during 1954–2013 in Southwest China. Quatern Int. 441, 129–139. doi:10.1016/j.quaint.2017.01.023
Hall, A. E. (2000). Crop responses to environment. 1st ed. Boca Raton, FL, USA: CRC Press. ISBN 9780429126543-CAT#KE81975. doi:10.1201/9781420041088
Hoekstra, A. Y., Chapagain, A. K., Aldaya, M. M., and Mekonnen, M. M. (2011). The water footprint assessment manual: Setting the global standard. London, UK: Earthscan. doi:10.4324/9781849775526
Hu, H., Wang, M., Yin, X., Yulin, J., and Chen, F. (2017). Spatial and temporal changes of soybean water requirement under climate changes in the Northeast Farming Region of China. J. China Agric. Univ. 22. 21-31. (Chinese). doi:10.11841/j.issn.1007-4333.2017.02.03
Irmak, S., Kabenge, I., Skaggs, K. E., and Mutiibwa, D. (2012). Trend and magnitude of changes in climate variables and reference evapotranspiration over 116-yr period in the Platte River Basin, central Nebraska–USA. J. Hydrol. 420, 228–244. doi:10.1016/j.jhydrol.2011.12.006
Jans, Y., Bloh, W. V., Schaphoff, S., and Müller, C. (2021). Global cotton production under climate change–implications for yield and water consumption. Hydrol. Earth Syst. S. C. 25 (4), 2027–2044. doi:10.5194/hess-25-2027-2021
Jia, H., Zhang, T., Yin, X., Shang, M., Chen, F., Lei, Y., et al. (2019). Impact of climate change on the water requirements of oat in Northeast and North China. Water 11 (1), 91. doi:10.3390/w11010091
Jiang, S., Liang, C., Cui, N., Zhao, L., Du, T., Hu, X., et al. (2019). Impacts of climatic variables on reference evapotranspiration during growing season in Southwest China. Agr. Water Manage 216, 365–378. doi:10.1016/j.agwat.2019.02.014
Jin, X., Yang, G., Xue, X., Xu, X., Li, Z., and Feng, H. (2017). Validation of two Huanjing-1A/B satellite-based FAO-56 models for estimating winter wheat crop evapotranspiration during mid-season. Agr. Water Manage 189, 27–38. doi:10.1016/j.agwat.2017.04.017
Kundu, S., Khare, D., and Mondal, A. (2017). Future changes in rainfall,temperature and reference evapotranspiration in the central India by least square support vector machine. Geosci. Front. 8 (3), 583–596. doi:10.1016/j.gsf.2016.06.002
Li, C., Wu, P., Li, X., Zhou, T., Sun, S., Wang, Y., et al. (2017). Spatial and temporal evolution of climatic factors and its impacts on potential evapotranspiration in Loess Plateau of Northern Shaanxi, China. Sci. Total Environ. 589, 165–172. doi:10.1016/j.scitotenv.2017.02.122
Li, Z., Chen, Y., Yang, J., and Wang, Y. (2014). Potential evapotranspiration and its attribution over the past 50years in the arid region of Northwest China. Hydrol. Process 28 (3), 1025–1031. doi:10.1002/hyp.9643
Li, Z. X., Feng, Q., Liu, Wei., Wang, T. T., Gao, Y., Wang, Y. M., et al. (2014). Spatial and temporal trend of potential evapotranspiration and related driving forces in Southwestern China, during 1961–2009. Quatern Int. 336, 127–144. doi:10.1016/j.quaint.2013.12.045
Li, Z., Zheng, F.-L., and Liu, W. Z. (2012). Spatiotemporal characteristics of reference evapotranspiration during 1961–2009 and its projected changes during 2011–2099 on the Loess Plateau of China. Agr. For. Meteorol. 154, 147–155. doi:10.1016/j.agrformet.2011.10.019
Liu, X. M., and Zhang, D. (2013). Trend analysis of reference evapotranspiration in Northwest China: The roles of changing wind speed and surface air temperature. Hydrol. Process 27, 3941–3948. doi:10.1002/hyp.9527
Liu, Y., Lin, Y., Huo, Z., Zhang, C., Wang, C., Xue, J., et al. (2022). Spatio-temporal variation of irrigation water requirements for wheat and maize in the Yellow River Basin, China, 1974–2017. Agr. Water Manag. 262, 107451. doi:10.1016/j.agwat.2021.107451
Mancosu, N., Spano, D., Orang, M., Sarreshteh, S., and Snyder, R. L. (2016). SIMETAW# - a model for agricultural water demand planning. Water Resour. Manag. 30 (2), 541–557. doi:10.1007/s11269-015-1176-7
Mao, S., Li, Y., Wang, Z., Li, P., Yuan, Y., Gong, W., et al. (2019). Review and outlook of China's cotton industry in the past 40 Years of reform and opening up. Agric. Outlook 15 (01), 42–49.
Masia, S., Trabucco, A., Spano, D., Snyder, R. L., Sušnik, J., and Marras, S. (2021). A modelling platform for climate change impact on local and regional crop water requirements. Agr. Water Manag. 255, 107005. doi:10.1016/j.agwat.2021.107005
McCuen, R. H. (1974). A sensitivity and error analysis CF procedures used for estimating evaporation 1. J. Am. Water Resour. Assoc. 10 (3), 486–497. doi:10.1111/j.1752-1688.1974.tb00590.x
McVicar, T. R., Roderick, M. L., Donohue, R. J., Li, L. T., Van Niel, T. G., Thomas, A., et al. (2012). Global review and synthesis of trends in observed terrestrial near-surface wind speeds: Implications for evaporation. J. Hydrol. 416, 182–205. doi:10.1016/j.jhydrol.2011.10.024
Najafi, M. R., Zwiers, F. W., and Gillett, N. P. (2015). Attribution of Arctic temperature change to greenhouse-gas and aerosol influences. Nat. Clim. Change 5 (3), 246–249. doi:10.1038/nclimate2524
Ortiz-Bobea, A., Ault, T. R., Carrillo, C. M., Chambers, R. G., and Lobell, D. B. (2021). Anthropogenic climate change has slowed global agricultural productivity growth. Nat. Clim. Change 11 (4), 306–312. doi:10.1038/s41558-021-01000-1
Pandey, P. K., Dabral, P. P., and Pandey, V. (2016). Evaluation of reference evapotranspiration methods for the northeastern region of India. Int. Soil Water Conse 4 (1), 52–63. doi:10.1016/j.iswcr.2016.02.003
Piao, S., Ciais, P., Huang, Y., Shen, Z., Peng, S., Li, J., et al. (2010). The impacts of climate change on water resources and agriculture in China. Nature 467 (7311), 43–51. doi:10.1038/nature09364
Reddy, K. C. (2015). Development of crop coefficient models of castor and maize crops. Eur. J. Agron. 69, 59–62. doi:10.1016/j.eja.2015.06.003
Rockstrom, J. (2004). Balancing water for humans and nature: The new approach in ecohydrology. 1st ed. Routledge. England, UK, doi:10.4324/9781849770521
Roderick, M. L., and Farquhar, G. D. (2002). The cause of decreased pan evaporation over the past 50 years. Science 298 (5597), 1410–1411. doi:10.1126/science.1075390-a
Shi, Z., Xu, L., Yang, X., Guo, H., Dong, L., Song, A., et al. (2017). Trends in reference evapotranspiration and its attribution over the past 50 years in the loess plateau, China: Implications for ecological projects and agricultural production. Stoch. Env. Res. Risk A 31 (1), 257–273. doi:10.1007/s00477-015-1203-5
Singh, K., Mishra, S. K., Singh, M., Singh, K., and Brar, A. S. (2022). Water footprint assessment of surface and subsurface drip fertigated cotton-wheat cropping system–A case study under semi-arid environments of Indian Punjab. J. Clean. Prod. 365, 132735. doi:10.1016/j.jclepro.2022.132735
Sun, S., Wu, P., Wang, Y., Zhao, X., Liu, J., and Zhang, X. (2013). The impacts of interannual climate variability and agricultural inputs on water footprint of crop production in an irrigation district of China. Sci. Total Environ. 444, 498–507. doi:10.1016/j.scitotenv.2012.12.016
Tabari, H., Aeini, A., Talaee, P. H., and Some’e, B. S. (2012). Spatial distribution and temporal variation of reference evapotranspiration in arid and semi-arid regions of Iran. Hydrol. Process 26 (4), 500–512. doi:10.1002/hyp.8146
Veal, A. J. (2021). Climate change 2021: The physical science basis, 6th report. World Leis. J. 63, 443–444. doi:10.1080/16078055.2021.2008646
Walter, I. A., Allen, R. G., Elliott, R., Jensen, M., Itenfisu, D., Mecham, B., et al. (2000). Watershed management and operations management 2000. Reston, VA, USA: ASCE, 1–11. doi:10.1061/9780784404997
Wang, L., and Chen, W. (2014). A CMIP5 multimodel projection of future temperature, precipitation, and climatological drought in China. Int. J. Climatol. 34 (6), 2059–2078. doi:10.1002/joc.3822
Wang, Z., Xie, P., Lai, C., Chen, X., Wu, X., Zeng, Z., et al. (2017). Spatiotemporal variability of reference evapotranspiration and contributing climatic factors in China during 1961–2013. J. Hydrol. L 544, 97–108. doi:10.1016/j.jhydrol.2016.11.021
Yang, L., Feng, Q., Zhu, M., Wang, L., Alizadeh, M. R., Adamowski, J. F., et al. (2022). Variation in actual evapotranspiration and its ties to climate change and vegetation dynamics in northwest China. J. Hydrol. 607, 127533. doi:10.1016/j.jhydrol.2022.127533
Yang, X., Jin, X., Chu, Q., Pacenka, S., and Steenhuis, T. S. (2021). Impact of climate variation from 1965 to 2016 on cotton water requirements in North China Plain. Agric. Water Manag. 243, 106502. doi:10.1016/j.agwat.2020.106502
Zeng, P., Sun, F., Liu, Y., Feng, H., Zhang, R., and Che, Y. (2021). Changes of potential evapotranspiration and its sensitivity across China under future climate scenarios. Atmos. Res. 261, 105763. doi:10.1016/j.atmosres.2021.105763
Zhang, S. J., Zhang, Y. S., Sui, D., Cai, F., Jin-Wen, W. U., Rui-Peng, J. I., et al. (2010). Changes in reference evapotranspiration and its causes in northeast China. Nat. Resour. Res. 25 (10), 1750–1761. doi:10.3788/HPLPB20102207.1462
Keywords: reference evapotranspiration, crop evapotranspiration, spatiotemporal variability, FAO-56 Penman-Monteith, sensitivity and contribution rate analysis, Chinese cotton
Citation: Su Y, Wang J, Li J, Wang L, Wang K, Li A, Gao L and Wang Z (2023) Spatiotemporal changes and driving factors of reference evapotranspiration and crop evapotranspiration for cotton production in China from 1960 to 2019. Front. Environ. Sci. 11:1251789. doi: 10.3389/fenvs.2023.1251789
Received: 02 July 2023; Accepted: 22 August 2023;
Published: 06 September 2023.
Edited by:
Budi Indra Setiawan, IPB University, IndonesiaReviewed by:
Adnan Abbas, Nanjing University of Information Science and Technology, ChinaRudiyanto Rudiyanto, University of Malaysia Terengganu, Malaysia
Copyright © 2023 Su, Wang, Li, Wang, Wang, Li, Gao and Wang. This is an open-access article distributed under the terms of the Creative Commons Attribution License (CC BY). The use, distribution or reproduction in other forums is permitted, provided the original author(s) and the copyright owner(s) are credited and that the original publication in this journal is cited, in accordance with accepted academic practice. No use, distribution or reproduction is permitted which does not comply with these terms.
*Correspondence: Lei Gao, Z2FvbGVpMDFAY2Fhcy5jbg==; Zhanbiao Wang, d2FuZ196aGFuYmlhb0AxMjYuY29t
†These authors have contributed equally to this work.
 Yuexia Su1†
 Zhanbiao Wang