 Guodong Bian1,2,3,4,5
 Jianyun Zhang1,2,3,4,5*Mingming Song2,3,4,5Xin Qian6Tiesheng Guan2,3,4,5
 Guoqing Wang1,2,3,4,5*
- 1State Key Laboratory of Water Resources and Hydropower Engineering Science, Wuhan University, Wuhan, China
- 2The National Key Laboratory of Water Disaster Prevention, Nanjing Hydraulic Research Institute, Nanjing, China
- 3Research Center for Climate Change, Ministry of Water Resources, Nanjing, China
- 4Yangtze Institute for Conservation and Development, Nanjing, China
- 5Cooperative Innovation Center for Water Safety and Hydro Science, Nanjing, China
- 6Shanghai Academy of Environmental Sciences, Shanghai, China
Introduction: Climate change alters the hydrological cycle to different extents, in particular the intensification of extreme precipitation and floods, which has garnered more attention as a significant scientific issue in the last few decades. The last Coupled Model Inter-comparison Project 6 (CMIP6) was designed with new shared socioeconomic pathways (SSPs) to combine socioeconomic development with greenhouse gas emissions to project future climate.
Method: In this study, we used 22 global climate models (GCMs) from CMIP6 to investigate future variations in extreme precipitation and temperature under SSP2-4.5 and SSP5-8.5 scenarios over the upper-middle Huaihe River Basin (UMHRB). Then, the modified Xinanjiang model integrating the flood control module was driven to obtain projections of the daily streamflow and to evaluate the future variations in flood regimes.
Results: The results show that 1) the characteristics of future extreme precipitation, such as the average intensity and amount of annual precipitation and extreme precipitation, are projected to increase, and the average, maximum, and minimum temperature values also display substantial increasing trends in the future over the UMHRB; 2) warmer climate will lead to a more severe flood magnitude under the SSP5-8.5 scenario in the far future (2071–2100) over the UMHRB. The results of the multi-model ensemble show that the annual maximum flood peaks (15-day flood volumes) of Wangjiaba and Wujiadu stations are projected to increase by 46.4% (43.1%) and 45.4% (51.1%), respectively, in the far future (2071–2100) under the SSP5-8.5 scenario; and 3) variations in the flood frequency tend to resemble variations in flood magnitude, and the return period of the design flood will obviously decrease under future climate scenarios. For instance, in the far future, under SSP5-8.5 scenarios, the return period of the design flood with a 100-year return period will become 38 years and 31 years for Wangjiaba and Wujiadu stations, respectively.
Discussion: The study enhances a more realistic understanding that the occurrence of future extreme precipitation and floods is projected to be more frequent and severe, thereby resulting in an urgent imperative to develop pertinent adaptation strategies to enhance social resilience toward the warming climate.
1 Introduction
Since the end of the 20th century, the global climate and environment have undergone significant changes, owing to increasing greenhouse gas emissions, which mainly results in global warming (IPCC, 2013). The Sixth Assessment Report of the Intergovernmental Panel on Climate Change (IPCC) states that the global average temperature has increased by approximately 1.09°C, compared to preindustrial levels, and global warming is projected to reach or exceed 1.5°C between 2021 and 2040 (IPCC, 2021). As a result, numerous literature reports have already suggested that the quantity of water vapor in the atmosphere has been escalating, and there have been notable modifications in precipitation as well (Schewe et al., 2014; Wang et al., 2017; Zhao, et al., 2019). The inherent regional natural water cycle mechanisms of river basins have been disrupted as a result of climate change, and the warmer climate can exacerbate and trigger certain future extreme weather events, such as increases in the severity and frequency of extreme precipitations and flood disasters, which will cause large losses to the economy and society, and cause huge irreversible damage to natural ecosystems (Nasse and Naresh, 2018; Papalexiou and Montanari, 2019; Oakley and Nina, 2021; Slater et al., 2021; Wang et al., 2021). However, the characteristics of these changes vary regionally, creating the need for the regional assessment and investigation of extreme precipitation and floods under future climate change scenarios to inform regional flood-risk management and facilitate the development of appropriate adaptive strategies.
The Huaihe River Basin (HRB), a vital river basin in China, covers approximately 3.4% of the land area, accommodates approximately 14.5% of China’s population, and contributes over 13.3% of China’s total gross domestic product (GDP) (Song, 2023). However, due to the special geographical and climatic conditions, as well as the complicated river system, in the HRB, flooding is recognized as the most common and detrimental natural disaster, which has caused considerable losses in the HRB, including emergency relocation of millions of people and damage to the economy amounting to billions (Zhang et al., 2014). The worst flood on record occurred in 1954 and was incredibly devastating, causing over 1,930 fatalities and approximately 3.35 million hectares of inundation land (Luo et al., 2006). Additionally, this basin experienced the second most devastating flood event in 2007, which led to approximately 25.6 million people being homeless and economic losses amounting to 16 billion (China’s Flood and Drought Disasters Report, 2007). Considering the substantial losses caused by historical flooding in the HRB, this raises the question of how future climate change will impact the extreme precipitation and floods in the HRB. Currently, GCMs and hydrological models have been widely acknowledged as a versatile and reliable approach for evaluating the hydrological responses to future climate change (Amin et al., 2017; Zhuan, et al., 2018; Mondal et al., 2021). For instance, Mou et al. (2020) used 12 CMIP5 GCMs to project regional responses of extreme precipitation under the RCP-4.5 scenario over the upper-middle HRB. Their findings showed that change characteristics of precipitation displayed an increasing trend for the mean intensity and amount of annual precipitation, and the intensity and amount of extreme precipitation. Jin et al. (2017) analyzed the future changes in water resources and extreme hydrological events over the HRB, combining the variable infiltration capacity (VIC) model and a single CMIP5 model, and suggested that future water resources would slightly increase during 2021–2050 under the RCP-4.5 and RCP-5.8 scenarios, while extreme flood events would be more severe and the flood risk would be further expanded over the HRB.
Although CMIP5 model outputs are commonly applied in the hydrological projection of the HRB, the latest CMIP6 dataset has been developed and represents a significant advancement from the prior version, due to its use of more sophisticated Earth system models, improved spatiotemporal resolution, and an expanded suite of variables (Chen et al., 2020; Cook et al., 2020; Zhu et al., 2020). Hence, CMIP6 models can provide a more comprehensive and detailed understanding of future climate change, contributing to more accurate projections and a better assessment of climate impacts on both global and regional scales. Furthermore, a novel concept titled shared socioeconomic pathways (SSPs) has been devised for scenario simulation, representing an updated version of the representative concentration pathways (RCPs) utilized in CMIP5 (Iqbal et al., 2021). The SSP scenarios can provide a credible and reasonable climate background for future climate simulations by integrating greenhouse gas emissions, along with socioeconomic development. Additionally, by incorporating climate policies such as anthropogenic emissions reductions, the SSP scenarios can meet the needs of various research fields related to climate change impacts, adaptation, and mitigation. However, only a few studies to date have systematically discussed the impacts of future climate change on the hydrological process in the HRB using the CMIP6 output. Jiang et al. (2020) projected a rise in the annual temperature and precipitation from 2021 to 2100 under SSP scenarios, with the basin facing heightened susceptibility to flooding. Regrettably, their findings did not integrate with a hydrological model to provide a more in-depth analysis of the hydrological response of the basin. Bian et al. (2021) conducted a comprehensive investigation of the impacts of future climate change on the hydrological process in the upper HRB combining four CMIP6 GCMs and a hydrological model, and found that runoffs in the high-flow season and design flood will show increasing trends during the 2080s. Yao et al. (2021) applied five CMIP6 GCMs to force the VIC model and subsequently carried out simulations of the hydrological response under future SSP scenarios over the upper and middle HRB.
However, previous studies mostly relied on the projections of fewer CMIP6 GCMs and ignored greater uncertainty in future climate projections. Meanwhile, some previous studies analyzed changes in flood, but few studies consider the impact of flood control measures, such as reservoirs and flood storage areas, on the projection of future floods. In this study, the primary purpose is to project the variations in extreme precipitation and flood across the UMHRB using CMIP6 GCMs under SSP2-4.5 and SSP5-8.5 scenarios. To accomplish this, the simulations of precipitation and temperature from 22 CMIP6 GCMs are downscaled and input to drive the modified Xinanjiang model and obtain the projections of daily streamflow under the two SSP scenarios. The influences of climate change on flood magnitude and frequency are investigated for the near future period (2031–2060) and far future period (2071–2100), relative to the baseline period (1961–2014). In this study, we mainly aim to 1) assess the simulation performance of CMIP6 GCMs for extreme precipitation and temperature; 2) investigate changing characteristics of future extreme precipitation and temperature; and 3) explore the impacts of climate change on flood magnitude and frequency over the UMHRB.
2. Data and methods
2.1 Study area and datasets
The Huaihe River Basin (HRB) is situated between 111°55′E and 121°25′E, and 30°55′N and 36°36′N, lying between the Yangtze River Basin and Yellow River Basin (Figure 1). The main channel stretches out over approximately 1,000 km and spans a total altitude difference of approximately 200 m. The large drop causes extreme precipitation within the mountainous regions of the upper reach and rapidly converges to the plains in the middle reach of HRB. Moreover, the convergence of multiple tributaries may also cause flood disasters in this basin. Therefore, this study chose the UMHRB as the study area, and the catchment area is approximately 12.39 × 10⁴ km2. The UMHRB is in the south–north climate transitional straps, and precipitation increases from north to south, with the annual average precipitation being 910 mm (Jin et al., 2022). Moreover, approximately 55%–80% of annual precipitation occurs during the flood season (June–September). Owing to the conditions of the monsoon and windward mountainous terrain, floods are the most serious natural disaster in the study basin. During the past few decades, severe major floods occurred in 1954, 1963, 1975, 1982, 1991, 2003, 2007, 2013, and 2020. In view of this background, gaining a thorough grasp of future flood projections is imperative for making informed decisions and planning adaptive flood management strategies for the UMHRB.
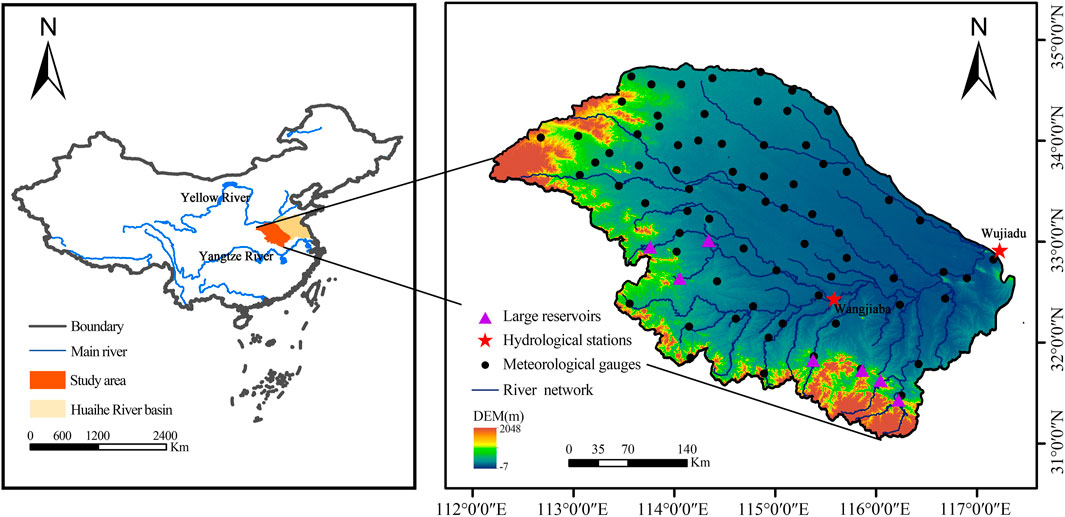
FIGURE 1. Location, topography, and river network of the UMHRB, and the distribution of meteorological gauges, hydrological stations, and large reservoirs.
In this study, daily precipitation and temperature observations from 71 rainfall gauges and 12 meteorological gauges, respectively, covering the period of 1961–2018 were obtained from the website of the National Meteorological Information Center of the China Meteorological Administration (http://cdc.cma.gov.cn/). Daily runoff data on two major hydrological stations (Wangjiaba and Wujiadu stations) were obtained from the Huaihe River Water Resources Commission (HRWRC). The specific location of the rainfall stations, meteorological stations, and hydrological stations is given in Figure 1.
The CMIP6 outputs are applied to drive the hydrological model and project future daily runoff in the UMHRB. In this study, 22 global climate models were selected, and the detailed information on these climate models is given in Table 1. The choice of 22 models was based on data availability at the time of the analysis. Moreover, these climate models are searched using the following constrains: Variable = “pr, tasmean, tasmax, tasmin” | Frequency = “day” | Variant Label = “rlilp1f1” | Experiment ID = “historical, ssp245, ssp585” | Grid Label = “gn” (https://esgf-node.lln l. gov/search/cmip6/).
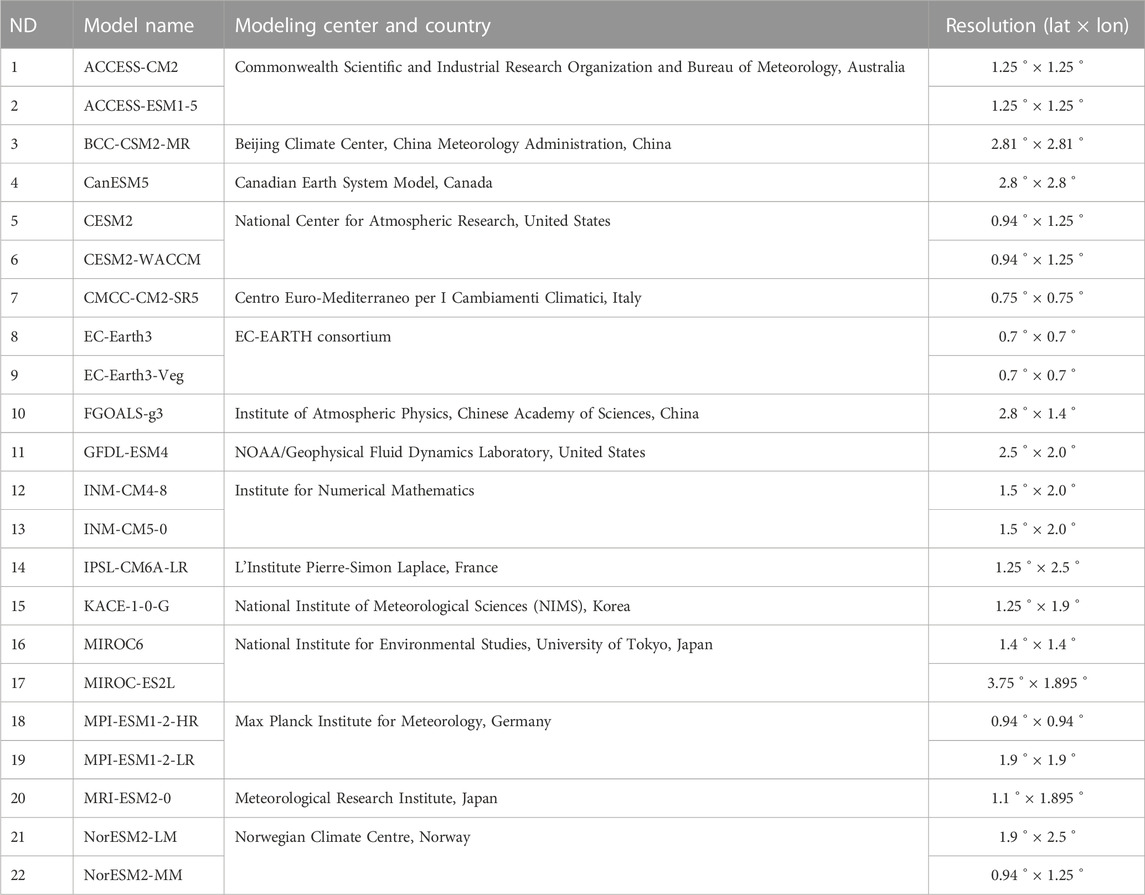
TABLE 1. Detailed information on 22 CMIP6 global climate models.
2.2 Methods
2.2.1 Extreme precipitation indices
Following the Expert Team on Climate Change Detection and Indices (ETCCDI) (http://etccdi.pacificclimate.org/list_27_indices.shtml), five indices (Rx1day, R20mm, R95pTOT, PRCPTOT, and SDII) were chosen to represent the precipitation extremes, as shown in Table 2. These indices are commonly acknowledged to be effective in extracting information regarding climate change and have been extensively applied for identifying and monitoring extreme precipitation in IPCC AR6.
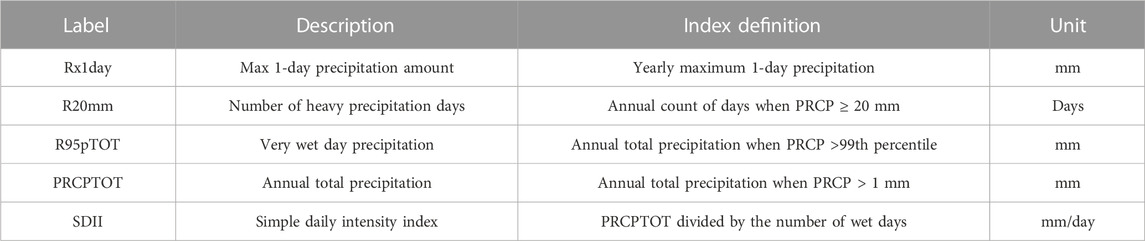
TABLE 2. List of the used extreme precipitation indices (recommended by the ETCCDI).
2.2.2 Daily bias correction approach
For regional studies, spatial downscaling and bias correction are required to correct global climate projections. Therefore, we selected the daily bias correction (DBC) approach to rectify the systematical deviations of raw GCM outputs, which has been widely utilized in several previous studies as an effective empirical statistical downscaling method (Chen et al., 2013). Further procedures of this method involve the following calculations. First, for each GCM, the occurrence of variables is adjusted by using a predetermined threshold, which is defined on a month-by-month basis from the historical period. This meticulous process ensures that the corrected variable maintains the same frequency as in historical observations, ensuring accuracy and reliability. Next, the frequency of the variable in the future period is also adjusted using those thresholds. Additionally, the distribution of daily variables for each month is rectified by multiplying (or adding) the quantile ratios (or differences) between the historical observations and GCM simulations. Lastly, in the future period, these quantile ratios (or differences) are also adopted to rectify the distribution of the daily variable. In this study, the meteorological fields of precipitation and temperatures (tasmean, tasmax, and tasmin) are corrected for all GCM simulations (44 in total: 22 climate models x 2 scenarios). Afterward, the corrected climate variables are input to drive the hydrological model to obtain daily runoff projections for 2015–2100 at two major hydrological stations in the UMHRB.
2.2.3 Modified Xinanjiang hydrological model
The XAJ model was developed by Zhao (1992) based on the physical concept that runoff generation occurs only when the soil water is under saturated conditions. The XAJ model has been widely and effectively utilized in streamflow simulation and flood forecasting in the humid and semi-humid zones over China. In this paper, the three-water source XAJ model is adopted, which consists of four modules, i.e., the evapotranspiration calculation module, runoff production calculation module, three-water source division calculation module, and confluence calculation module. Figure 2 shows the structure of the model. Further details about the XAJ model were described in Zhang et al. (2012).
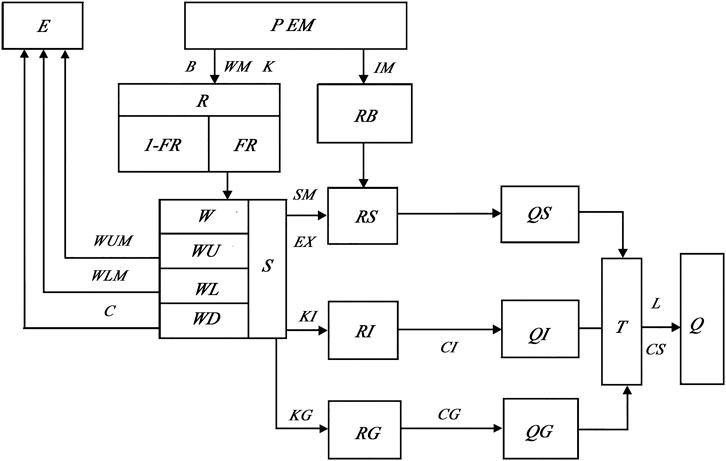
FIGURE 2. Structure of the Xinanjiang hydrological model.
Considering the influence of hydraulic engineering facilities in the UMHRB, such as reservoirs and flood detention areas, the modified XAJ model is proposed by integrating the flood control module. The impact of the flood control operation of seven large reservoirs (including) and one flood detention area (including) is taken into account in this study, and the regulation rules of these hydraulic engineering facilities adopted in the flood control module are derived from the “Large Reservoir Group Joint Operation Scheme of the Huaihe River Basin” and “Flood Prevention Scheme of the Huaihe River Basin,” which were formulated by the HRWRC.
In addition, the shuffled complex evolution optimization algorithm (SCE-UA), proposed by Duan et al. (1992), is chosen to calibrate the parameters of the XAJ hydrological model. In this study, the objective function is designed to maximize the value of the Nash–Sutcliffe efficiency (NSE) coefficient during calibration. The NSE value is computed using the following formula:
where Qobs indicates the observed and simulated streamflow; Qsim indicates the simulated streamflow; and the value of NSE ranges from -∞ to 1, with NSE = 1 indicating a perfect fit between the observed and simulated series.
3 Results
3.1 Performance of CMIP6 GCMs
In order to project the change in extreme precipitation and floods over the UMHRB, it is essential to assess the performances of the selected 22 CMIP6 GCMs. The DBC method is applied to address the systematical errors of raw GCM outputs. The simulation performance of extreme precipitation and temperature during the historical period (1961–2014) before and after the application of the DBC method is shown in Figure 3. It is observed that the 22 raw GCM outputs of precipitation and temperature display significant deviations. The mean absolute deviations of raw GCM outputs from the observed precipitations are 44.4%, 24.1%, 23.2%, 29.7%, and 35.1% for Rx1day, R20mm, R95pTOT, PRCPTOT, and SDII, respectively, whereas the absolute deviations in temperature are 0.9°C, 0.99°C, and 1.43°C for tasmean, tasmax, and tasmin, respectively. However, the large systematic bias between the raw model outputs and observations substantially decreased after implementing the DBC algorithm. Notably, the biases in extreme precipitation across the 22 GCMs have been significantly decreased, with a majority of them decreasing to below 5%, whereas the biases in temperature decreased to below 0.1°C. These results demonstrate that the DBC method significantly enhances the accuracy and credibility of the GCMs in capturing extreme precipitation events and temperature variations, thereby contributing to the improvement of the reliability of the runoff projections obtained from these GCM outputs in the UMHRB.
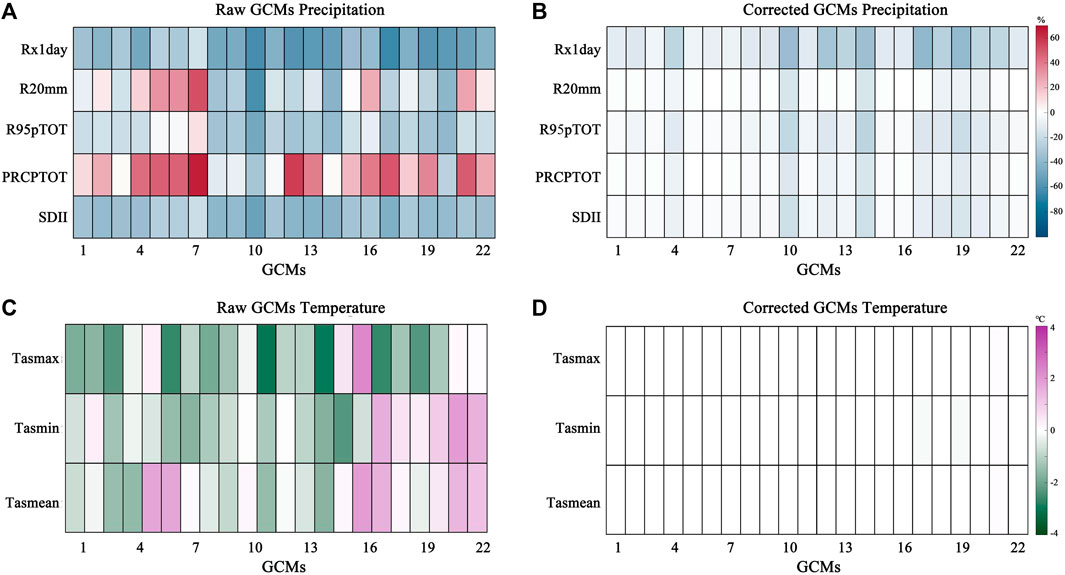
FIGURE 3. Diagram of extreme precipitation indices’ relative deviation (%, (A, B)) and temperature absolute deviation (°C, (C, D)) across 22 GCMs before and after using the DBC method over the UMHRB.
3.2 Extreme precipitation and temperature projections
Based on the multi-model ensemble of the corrected GCM outputs, the long-term alterations in extreme precipitation and temperature are projected during 1961–2100 under SSP2-4.5 and SSP5-8.5 scenarios over the UMHRB, as shown in Figure 4. Compared to the baseline period (1961–2014), there is a general increasing trend for extreme precipitation and temperature under two future SSP scenarios in the future period (2015–2100). In addition, the upward trend under the SSP5-8.5 scenario is projected to be more significant than that under SSP2-4.5 scenarios. More specifically, Table 3 shows the variations in extreme precipitation and temperature in the near future (NF: 2031–2060) and far future (FF: 2071–2100) relative to the baseline period. In the NF period, it is found that extreme precipitation indices (Rx1day, R20mm, R95pTOT, PRCPTOT, and SDII) will increase by 10.7%, 6.1%, 13.1%, 7.3%, and 2.2%, respectively, under the SSP2-4.5 scenarios and increase by 13.6%, 8.5%, 16.2%, 9.6%, and 3.4%, respectively, under the SSP5-8.5 scenarios. In addition, tasmean, tasmax, and tasmin are projected to increase by 2°C (13.7%), 1.96°C (9.8%), and 2.1°C (19.9%), respectively, under the SSP2-4.5 scenarios and increase by 2.5°C (17.1%), 2.47°C (12.4%), and 2.56°C (24.8%), respectively, under the SSP5-8.5 scenarios.
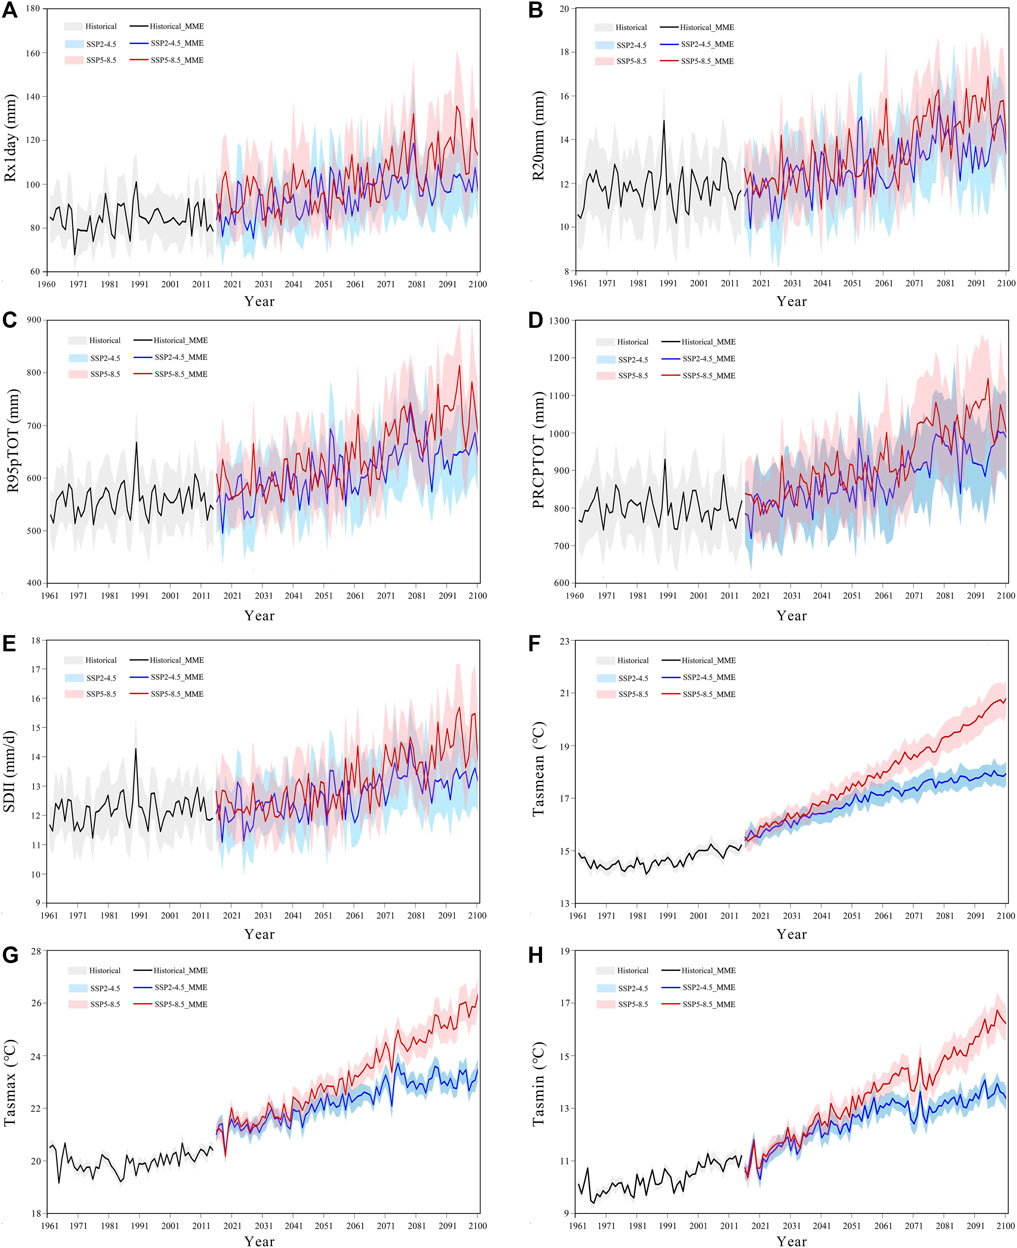
FIGURE 4. Corrected CMIP6 climate models for areal averaged (A–E) Rx1day, R20mm, R95pTOT, PRCPTOT, and SDII; (F–H) average, maximum, and minimum temperatures over the UMHRB. The black solid lines represent the multi-model ensemble results, and the shaded area represents the standard deviations of the 22 GCMs.
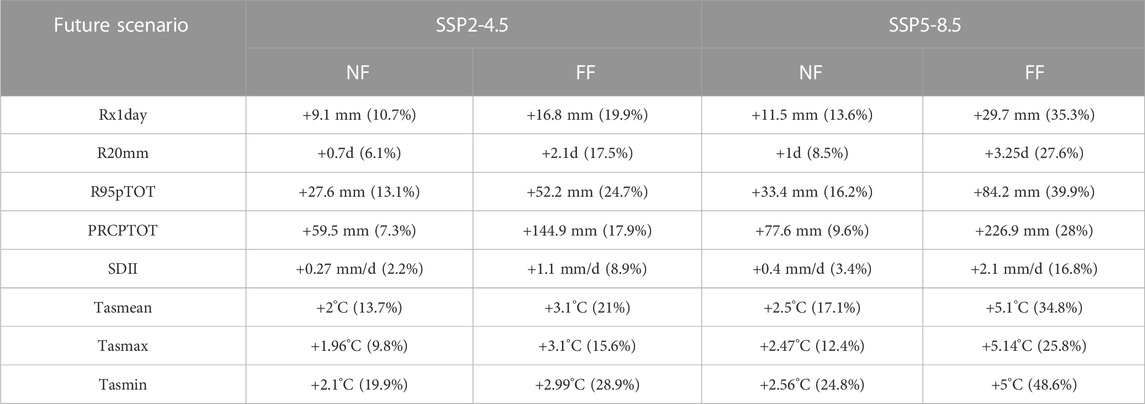
TABLE 3. Average relative changes in Rx1day, R20mm, R95pTOT, PRCPTOT, and SDII, and average, maximum, and minimum temperatures between the baseline period (1961–2014) and future period (NF: 2031–2060 and FF: 2071–2100) over the UMHRB.
Moreover, these relative percentage changes in extreme precipitation and temperature will increase drastically in the FF period under two future SSP scenarios. It is found that extreme precipitation indices are projected to increase by 19.9%, 17.5%, 24.7%, 17.9%, and 8.9%, respectively, under the SSP2-4.5 scenarios and by 35.3%, 27.6%, 39.9%, 28%, and 16.8%, respectively, under the SSP5-8.5 scenarios. In addition, tasmean, tasmax, and tasmin are projected to increase by 3.1°C (21%), 3.1°C (15.6%), and 2.99°C (24.8%), respectively, under the SSP2-4.5 scenarios and increase by 5.1°C (34.8%), 5.14°C (25.8%), and 5°C (48.6%), respectively, under the SSP5-8.5 scenarios. Overall, projected climate scenarios indicate a significant rise in both extreme precipitation and temperature over the UMHRB, which may cause a corresponding surge in floods throughout the study basin. Previous research studies suggested that a wetter and warmer atmosphere can accelerate the water cycle, eventually resulting in more severe flood hazards in the future (Najibi and Devineni, 2018; Yang et al., 2019; Li et al., 2021). Therefore, the growing trends of extreme precipitation detected in the CMIP6 projections provide further justification for exploring future flood hazards in the flood-prone UMHRB.
3.3 Calibration and validation results of the MXAJ model
This study used the MXAJ model to simulate the hydrological process over the UMHRB. First, the data on mean precipitation and temperature during 1961–1966 were used to preheat the model; then, the calibration of the MXAJ model is carried out for the 34-year period during 1966–1999; thereby, the optimum model parameters are determined using the SCE-UA algorithm based on the highest NSE value. Subsequently, the model validation is conducted for the 17-year period during 2000–2018. Moreover, the coefficient of determination (R2), relative bias (PBIAS), and absolute error of flood peak (AEP) are also applied to further evaluate the performance of the MXAJ model relative to the XAJ model. Figure 5 presents the comparisons between the observed daily streamflow and simulations of the XAJ and MXAJ models. The results suggest that both the XAJ and MXAJ models perform well in the study basin, but compared with the overestimation in the high flow of the XAJ model, the MXAJ model has better simulating capability. This is mainly due to the MXAJ model being integrated with the flood control module, which considers the peak clipping effect of reservoirs and flood storage areas on flood. Furthermore, Table 4 presents the results of the calibration and validation periods for the Wangjiaba and Wujiadu stations. It is observed that the R2, NSE, PBIAS, and AEP values of the XAJ and MXAJ models are 0.89, 0.78, 7.6%, and 20.5%, and 0.91, 0.83, −5.1%, and 16.2%, respectively, for the calibration period, and 0.95, 0.84, 4.6%, and 22.3% and 0.95, 0.89, −7.4%, and 17.9%, respectively, for validation periods in the Wangjiaba station. For the Wujiadu station, the R2, NSE, PBIAS, and AEP values of the XAJ and MXAJ models are 0.9, 0.8, 8.7%, and 26.3% and 0.91, 0.82, −2.6%, and 18.7%, respectively, for the calibration period, and 0.86, 0.75, 12.1%, and 23.9% and 0.9, 0.79, 1.7%, and 17.4%, respectively, for validation periods. These findings indicate that the MXAJ model exhibits more favorable simulation performance in simulating the daily streamflow, especially high flow, compared to the XAJ model. As such, it is recommended that the MXAJ model is used to predict hydrological scenarios in future research endeavors.
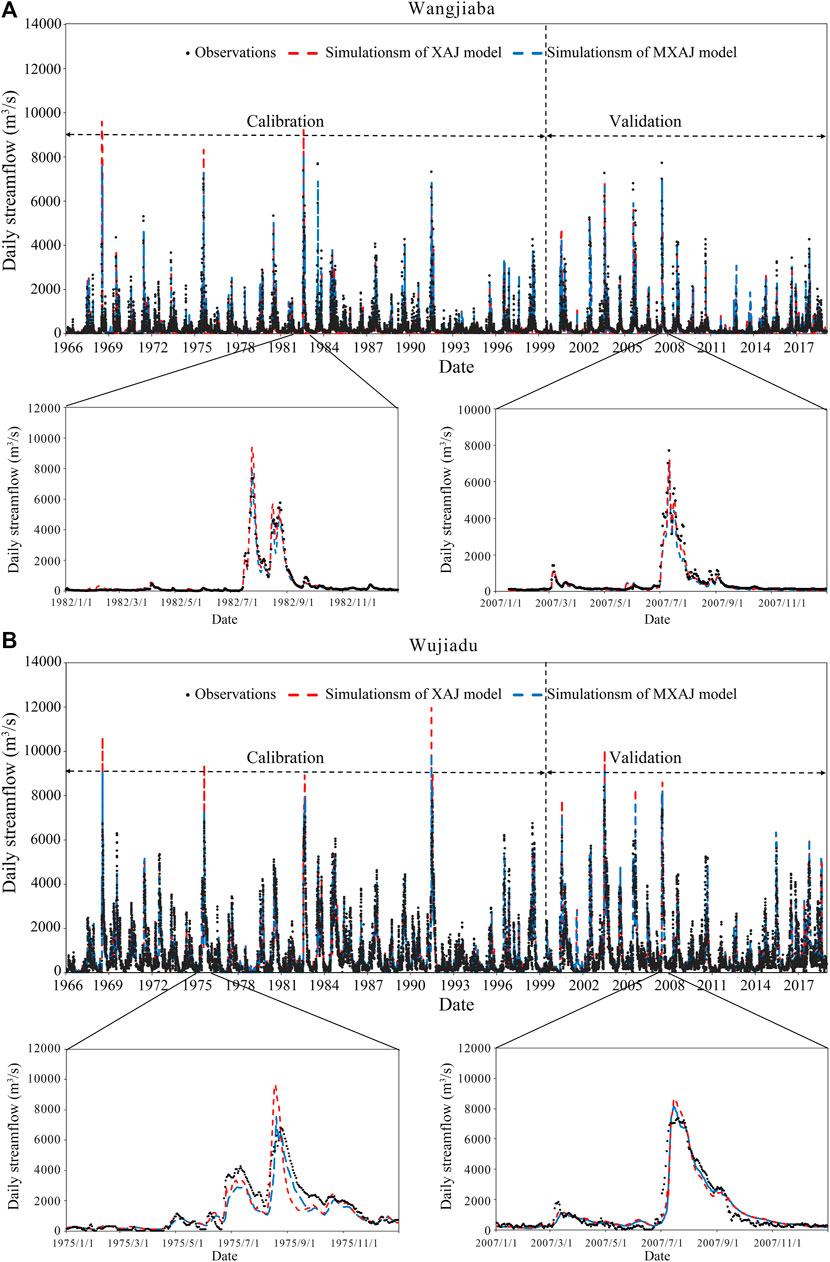
FIGURE 5. Observed and simulated daily streamflow of the XAJ and MXAJ models for the calibration and validation periods in the (A) Wangjiaba and (B) Wujiadu stations.
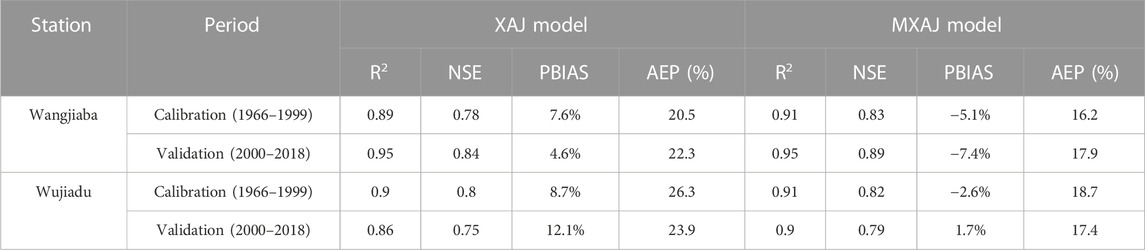
TABLE 4. Evaluation of the XAJ and MAJ model performance at the Wangjiaba and Wujiadu stations.
3.4 Flood regime projections
For the flood regime projections, the corrected CMIP6 GCMs are applied to drive the MXAJ model to generate the daily streamflow projections; then, two flood attributes, magnitude and frequency, are calculated to conduct comprehensive evaluations of future flood regimes in the UMHRB. Specifically, the annual maximum flood peaks and annual maximum 15-day flood volumes are both obtained to characterize the flood magnitude, and flood frequency is calculated using the generalized Pareto (GP) distribution in this study. Therefore, we performed a comprehensive evaluation of the future flood regime using multiple attributes in the UMHRB. The flood magnitude and frequency are computed for the near future (2031–2060) and far future (2071–2100), with a comparison against the baseline period (1961–2014).
3.4.1 Flood magnitude
Figure 6 shows the relative change in the flood magnitude in the NF and FF periods compared to the baseline period. As mentioned previously, SSP2-4.5 and SSP5-8.5 scenarios are used to characterize future floods. There are still large uncertainties in the projections of the flood magnitude change from 22 CMIP6 GCMs. However, the results of the multi-model ensemble show that the annual maximum flood peaks and 15-day flood volumes both have clear positive changes under two SSP scenarios in the NF and FF periods for the Wangjiaba and Wujiadu stations; moreover, these positive changes are more significant during the FF period and SSP5-8.5 scenario. Specifically, for the Wangjiaba station, the average relative changes in the annual maximum flood peak are projected to be 7.6% and 18% in the NF period under SSP2-4.5 and SSP5-8.5 scenarios, respectively, while During the FF period, these percentages are projected to increase to 23.7% and 46.4% under two SSP scenarios, respectively. Similarly, the average relative changes in the annual maximum 15-day flood volume are projected to be 4.4% and 18.5% during the NF period under the SSP2-4.5 and SSP5-8.5 scenarios, respectively, and these percentages will increase to 21.1% and 43.1% under SSP2-4.5 and SSP5-8.5 scenarios in the FF period, respectively. Likewise, at the Wujiadu station, the average relative changes in the annual maximum flood peak are expected to be 9% and 20.7% under SSP2-4.5 and SSP5-8.5 scenarios in the NF period, respectively. These percentages are projected to increase to 28.7% and 45.4% under SSP2-4.5 and SSP5-8.5 scenarios in the FF period, respectively. Additionally, the average relative changes in the annual maximum 15-day flood volume are 7.3% and 23.9% under SSP2-4.5 and SSP5-8.5 scenarios in the NF period, respectively. These percentages will increase to 27.4% and 51.1% during the FF period under SSP2-4.5 and SSP5-8.5 scenarios, respectively.
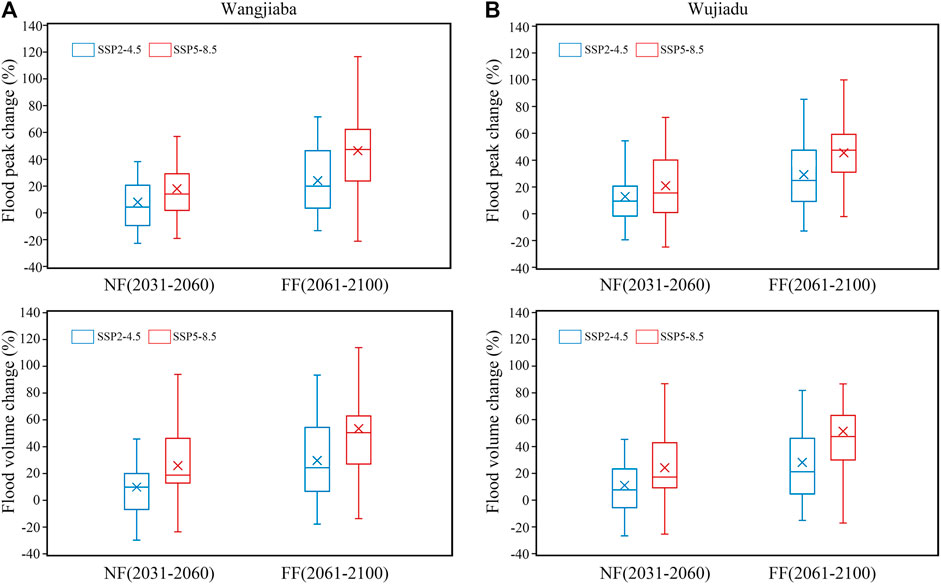
FIGURE 6. Relative changes in the annual maximum peak flood discharge and annual maximum 15-day flood volume at (A) Wangjiaba and (B) Wujiadu stations over the UMHRB during future periods (NF: 2031–2060 and FF: 2071–2100) under SSP2-4.5 and SSP5-8.5 scenarios compared with the baseline period.
In general, future flood magnitude in the UMHRB is projected to be the most drastic during the FF period under the SSP5-8.5 scenario, followed by the NF period under the SSP2-4.5 scenario, NF period under the SSP5-8.5 scenario, and FF period under the SSP2-4.5 scenario. These findings suggest that there is a positive correlation between the warmth of the climate and the severity of flood magnitude in the UMHRB. In other words, the warmer the climate, the higher the flood risk, which has significant implications for the existing flood design standards and flood protection infrastructure over the UMHRB. For instance, a majority of the 5,700 reservoirs in the UMHRB were constructed between 1950 and 1970 and conferred significant flood protection benefits in the last few decades. However, the use of antiquated design standards and the proximity of these reservoirs to the end of their design life give rise to concerns regarding the adaptability of the existing flood control infrastructure in the face of future exacerbation in flood magnitude over the UMHRB.
3.4.2 Flood frequency
Figure 7 presents the flood frequency distribution curves for Wangjiaba and Wujiadu stations during the baseline, NF, and FF periods under SSP2-4.5 and SSP5-8.5 scenarios. It is observed that the future flood frequency curves under the two SSP scenarios are located to the right of those of the historical period, indicating that the frequency of future floods will be higher than the same magnitude flood in the baseline period, significantly for the more severe SSP5-8.5 scenarios and far future. Table 5 shows the return periods of the historical design flood of 100 years, 50 years, 20 years, and 10 years under SSP2-4.5 and SSP5-8.5 scenarios during the future periods. The results suggest that the return period of design flood will obviously decrease under future periods in response to warmer climate, especially for the design flood with 100-year and 50-year return periods. For instance, at the Wangjiaba station, the return period of design flood with a 100-year return period will become 53 years and 34 years in the NF period under SSP2-4.5 and SSP5-8.5 scenarios, respectively, and 38 years and 23 years for the FF period under two SSP scenarios, respectively. Likewise, the return period of design flood with a 50-year return period will become 29 years and 21 years for the NF period under SSP2-4.5 and SSP5-8.5 scenarios, respectively, and 21 years and 14 years for the FF period under two SSP scenarios, respectively. Furthermore, at the Wujiadu station, the return period of design flood with a 100-year return period will become 45 years and 30 years for the NF period under SSP2-4.5 and SSP5-8.5 scenarios, respectively, and 31 year and 17 year for the FF period under two SSP scenarios, respectively. Similarly, the return period of design flood with a 50-year return period will become 26 years and 19 years for the NF period under SSP2-4.5 and SSP5-8.5 scenarios, respectively, and 18 years and 11 years for the FF period under two SSP scenarios, respectively. These results can be attributed to the heavier emission of greenhouse gases under the SSP5-8.5 scenario for the far future period, which causes warmer climate and larger extreme precipitation, and indicate that future floods in the UMHRB are anticipated to be intensified and more severe, which could have serious effects on economic and social development.
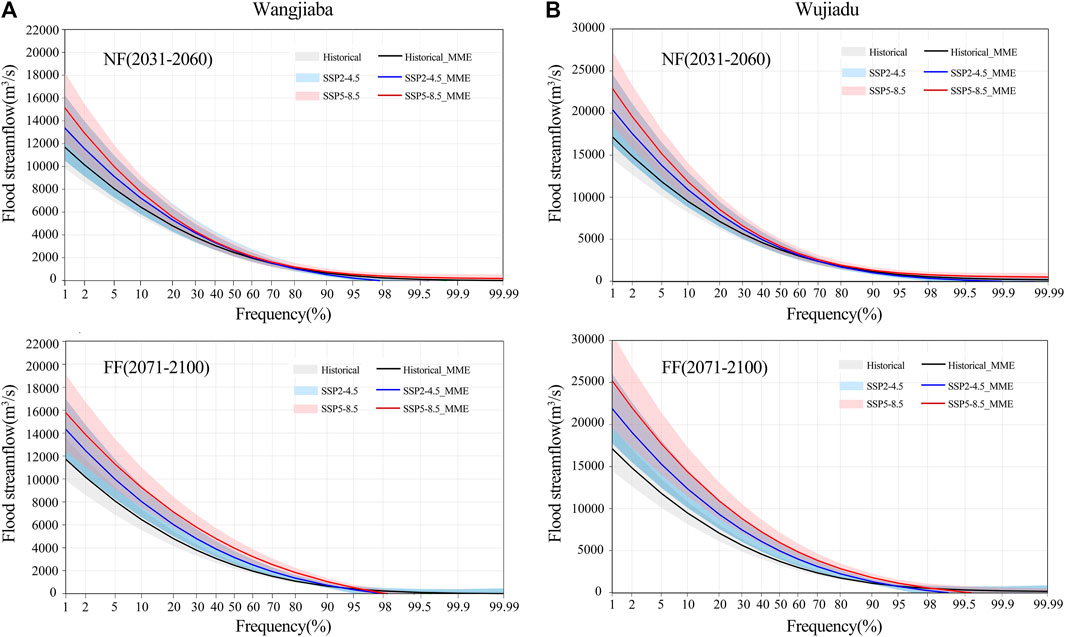
FIGURE 7. Frequency curves of the annual maximum flood peak for (A) Wangjiaba and (B) Wujiadu stations over the UMHRB during the baseline and future periods (NF: 2031–2060 and FF: 2071–2100) under SSP2-4.5 and SSP5-8.5 scenarios.
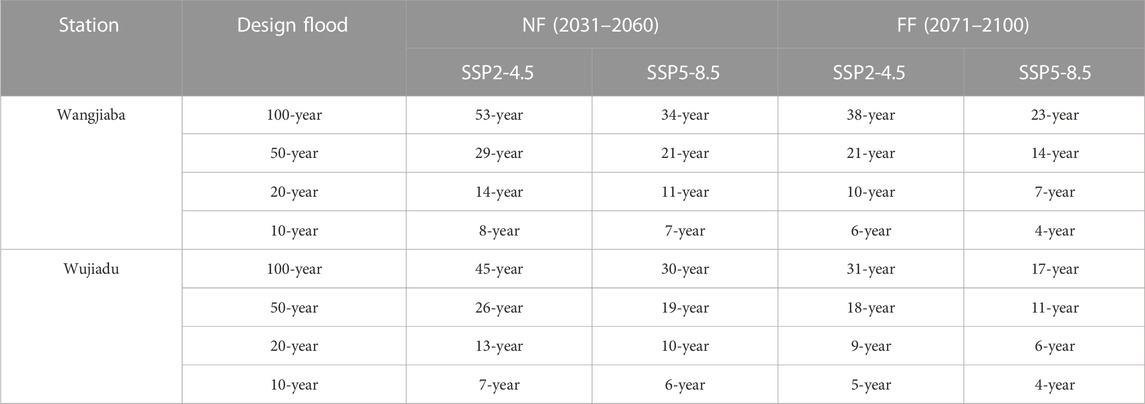
TABLE 5. Return periods of design flood of 100 years, 50 years, 20 years, and 10 years under SSP2-4.5 and SSP5-8.5 scenarios during the future periods (NF: 2031–2060 and FF: 2071–2100).
To delve more deeply into the aforementioned findings, computations are conducted to determine the alterations in future floods for the 100-year, 50-year, 20-year, and 10-year return periods, as shown in Figure 8. It is evident that under SSP2-4.5 and 5-8.5 scenarios, there are great uncertainties in the changes in different design floods in future periods among the 22 CMIP6 GCMs. However, the results of the multi-model ensemble suggest that the design floods will experience an increase under two future SSP scenarios in the UMHRB, especially for the design flood with 100-year and 50-year return periods during the far future period. In other words, for the Wangjiaba station, the design floods with a 100-year return period are projected to increase by 14.3% and 23.6% for SSP2-4.5 and SSP5-8.5 scenarios in the near future, respectively, and by 19.5% (SSP2-4.5) and 26.7% (SSP5-8.5) in the far future, respectively. The design floods with a 50-year return period are projected to increase by 13% (SSP2-4.5) and 21.5% (SSP5-8.5) in the near future, respectively, and by 18.5% (SSP2-4.5) and 27.1% (SSP5-8.5) in the far future, respectively. For the Wujiadu station, the design floods with a 100-year return period are projected to increase by 19.2% and 30.3% for SSP2-4.5 and SSP5-8.5 scenarios in the near future, respectively, and by 28.3% (SSP2-4.5) and 45.2% (SSP5-8.5) in the far future, respectively. The design floods with a 50-year return period are projected to increase by 17.6% (SSP2-4.5) and 27.8% (SSP5-8.5) in the near future, respectively, and by 28.2% (SSP2-4.5) and 45.8% (SSP5-8.5) in the far future, respectively. Our results suggest that impending floods in the UMHRB are likely to be increasingly intense and frequent. This could potentially have far-reaching ramifications for both economic and social growth. As a result, strategic, long-term planning measures must be implemented to skillfully reconcile hydroelectric power and flood management objectives. In future, flood mitigation plans must take into consideration the anticipated escalation in flood frequency and magnitude.
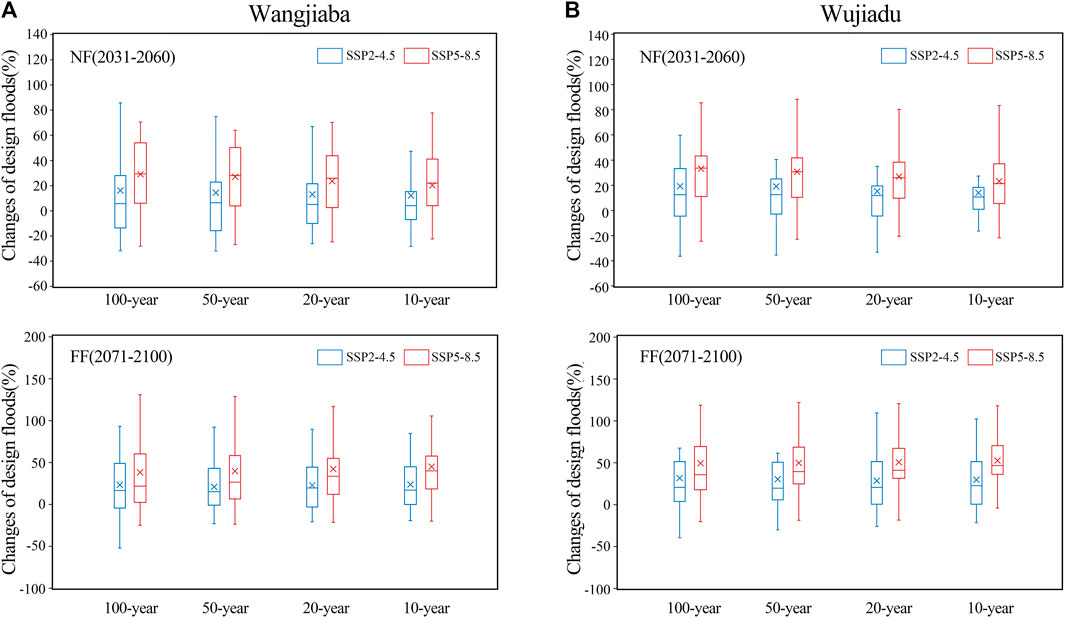
FIGURE 8. Relative changes in design floods at (A) Wangjiaba and (B) Wujiadu stations in the UMHRB during future periods (NF: 2031–2060 and FF: 2071–2100) under SSP2-4.5 and SSP5-8.5 scenarios compared with the baseline period.
4 Discussion
This paper quantitatively evaluates the regional response of future extreme precipitation and flood regimes to climate change combining with CMIP6 models and the modified XAJ hydrological model over the UMHRB. Consistent with the results of previous research studies (Wang et al., 2018; Yang et al., 2020), the findings of this study indicate that the magnitude and frequency of extreme precipitation and floods are projected to increase under SSP2-4.5 and SSP5-8.5 scenarios over the UMHRB. This can be attributed to the Clausius–Clapeyron law, as proposed by Trenberth et al. (2003), which suggests that increasing the temperature by 1 K is likely to result in an increase of approximately 7% in the water vapor-holding capacity. In other words, a warmer atmosphere can hold more water vapor, thereby intensifying the probability of extreme precipitation events. Even though the physical mechanisms of flood production are multifaceted, flood extremes are anticipated to intensify with frequent instances of extreme precipitation in the future, as previously reported (Hirabayashi et al., 2013; Wu et al., 2015). However, some previous studies found that reservoir regulation would offset the effects of climate change and decrease future flood peaks (Lauri et al., 2012). Wang et al. (2017) investigated the impact of climate change and reservoir regulations on flood regimes over the Lancang–Mekong River Basin using a distributed hydrological model coupled with a simple operation model. They found that the intensification of extreme precipitation would increase flood magnitude and frequency, but reservoir regulation could effectively suppress the influences of climate change. Hence, the combined impacts of climate change and flood control measures have to be considered for future flood projection. In addition, the individual influence of climate change and flood control measures on future floods over the UMHRB will be investigated in future research, which is important for the formulation of adaptive strategies in the UMHRB.
In terms of future flood risk, it commonly depends on two elements, i.e., hazard and vulnerability (Kazakis et al., 2015; Hu et al., 2017; Shadmehri Toosi et al., 2019; Paprotny et al., 2020). Climate hazard refers to the potential occurrence of climate-related events that may cause large fatalities and loss of property, such as extreme precipitation and floods. Vulnerability indicates the thing to be easily affected and lack of capacity to cope with, such as the social and economic factors, including population and GDP. In this study, the results suggest that the flood hazard will further aggravate due to the more severe and frequent extreme precipitation and floods under future climate scenarios over the UMHRB. For flood vulnerability, based on the gridded datasets for population and economy under Shared Socioeconomic Pathways published by Jing et al. (2020) in the Science Data Bank, we project the yearly future GDP and population data under SSP2-4.5 and SSP5-8.5 scenarios during 2010–2100 over the UMHRB, as shown in Figure 9. It can be observed that the GDP of the UMHRB will peak around 2060 and remain basically stable under the SSP2-4.5 scenario, while it will continue to increase in the SSP5-8.5 scenario. As for future population projections, the results show that the population of the UMHRB will peak around 2025 and then will continue to decrease under the two SSP scenarios, while the decrease will be greater under the SSP5-8.5 scenario. On account of previous studies, the projected flood risk will obviously increase over the UMHRB, which is the result of the combined effects of future climate change and social development. These views are consistent with the results of Wu et al. (2017), who found that the flood risk in the HRB will increase significantly during 2010–2040 relative to the baseline period (1980–2010), especially with 8% and 0.77% increases in the area of the final risk and high-risk areas. Hence, it is crucial to consider these projected changes in the floods and enhance the effectiveness of flood risk management strategies over the UMHRB.
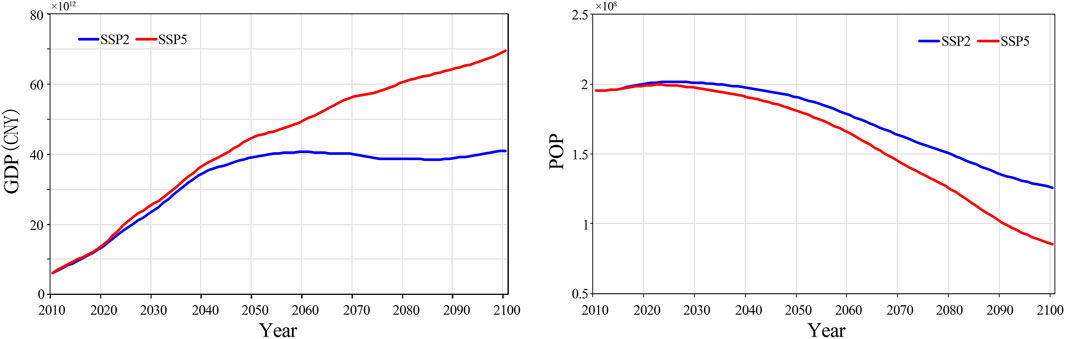
FIGURE 9. Future trends of the GDP and population during 2010–2100 under SSP2-4.5 and SSP5-8.5 scenarios over the UMHRB.
Furthermore, some limitations remain in this study. Although the multi-model ensemble method could be used to reduce the uncertainty of the projected results (Jiang et al., 2016; Samuels et al., 2018; Ge et al., 2020), we failed to consider the potential effects of other important sources of uncertainty, such as downscaling techniques and hydrological model. According to previous research studies (Dobler et al., 2012; Karlsson et al., 2016; Das et al., 2018), downscaling techniques and hydrological models generate much less uncertainty compared to GCMs. This does not justify neglecting the impact of these sources of uncertainty. Therefore, the next stage of our study will involve a comprehensive analysis of the potential effects of uncertainties originated from various sources in order to accurately evaluate the impacts of climate change on future hydrological processes. Moreover, human activities, such as land-use change, water resource development, and government policies, can significantly affect flood occurrence and flood risk in the HRB. Therefore, it is essential to investigate the spatiotemporal responses of floods and flood risk to human activities and climate change in future studies to ensure accurate predictions.
5 Conclusion
This study projects the impacts of climate change on extreme precipitation and floods across the UMHRB. To this end, the outputs of precipitation and temperature from 22 CMIP6 GCMs, under two future SSP scenarios (SSP2-4.5 and SSP5-8.5), are spatially downscaled and bias-corrected using the DBC method and used to investigate changes in the characteristics of future extreme precipitation and temperature. The projected daily runoff output from the modified XAJ hydrologic model is utilized to define flood series for flood magnitude and frequency. In order to comprehend the future impacts of climate change on the flood regime over the UMHRB, flood magnitude and frequency are analyzed under SSP2-4.5 and SSP5-8.5 scenarios and compared between a baseline period (1961–2014) and future periods (2031–2060 and 2071–2100). The main conclusions are as follows:
(1) Relative to observations in 1961–2014 for the HRB, the biases between observations and simulated precipitation and temperature variables are largely reduced after correction using the DBC method. Based on the corrected CMIP6 outputs, future extreme precipitation and temperature are all projected to increase substantially. It is found that five extreme precipitation indices (Rx1day, R20mm, R95pTOT, PRCPTOT, and SDII) are projected to increase by 35.3%, 27.6%, 39.9%, 28%, and 16.8% under the SSP5-8.5 scenarios during the far future period, respectively. Moreover, the temperature variables (tasmean, tasmax, and tasmin) are projected to increase by 5.1°C (34.8%), 5.14°C (25.8%), and 5°C (48.6%) under the SSP5-8.5 scenarios during the far future period, respectively. The upward trend in extreme precipitation and temperature could result in higher flood hazard and risk in the future, highlighting the crucial need for dependable projections of flood hazard under future climate scenarios across the UMHRB.
(2) Compared to the original XAJ model, the MXAJ model performs well in simulating daily runoffs, as demonstrated by validation results. Taking the Wangjiaba station as an example, it can be observed that the R2, NSE, and PBIAS values of the XAJ and MXAJ models are 0.89, 0.78, and 7.6% and 0.91, 0.83, −and 5.1%, respectively, for the calibration period, and 0.95, 0.84, and 4.6% and 0.95, 0.89, and −7.4% for validation periods. The MXAJ model exhibits more favorable simulation performance in simulating high flow by integrating the flood control module, which considers the peak clipping effect of reservoirs and flood storage areas on flood. As such, the MXAJ model can be used to predict hydrological scenarios in future research endeavors.
(3) According to the results of the multi-model ensemble, future flood magnitude shows clear positive changes under two SSP scenarios in the future periods, and it is expected to be the most severe in the far future under the SSP5-8.5 scenario. For the Wangjiaba station, the relative changes in the annual maximum flood peak and annual maximum 15-day flood volume are projected to be 46.4% and 43.1% under SSP5-8.5 scenarios during the far future period, respectively. Furthermore, the relative changes in the annual maximum flood peak and annual maximum 15-day flood volume are projected to be 45.4% and 51.1% under SSP5-8.5 scenarios during the far future period, respectively, in the Wujiadu station. Changes in flood frequency tend to resemble those in flood magnitude, and the return period of design flood will obviously decrease under future climate scenarios. In the far future period, under SSP5-8.5 scenarios, the return period of a design flood with a 100-year return period will become 38 years and 31 years for Wangjiaba and Wujiadu stations, respectively.
Data availability statement
The original contributions presented in the study are included in the article/Supplementary Material; further inquiries can be directed to the corresponding authors.
Author contributions
GB: methodology, formal analysis, and writing. JZ: conceptualization, methodology, and writing—review and editing. MS: data curation, and writing—review and editing. XQ: data curation and visualization. TG: writing—review and editing, and funding acquisition. GW: conceptualization, methodology, writing—review and editing, and funding acquisition. All authors contributed to the article and approved the submitted version.
Funding
This study was financially supported by the National Natural Science Foundation of China (grants: 52121006, 41830863, and 41961124007) and the National Key Research and Development Programs of China (grant: 2021YFC3200201).
Acknowledgments
The authors thank the reviewers and editors.
Conflict of interest
The authors declare that the research was conducted in the absence of any commercial or financial relationships that could be construed as a potential conflict of interest.
Publisher’s note
All claims expressed in this article are solely those of the authors and do not necessarily represent those of their affiliated organizations, or those of the publisher, the editors, and the reviewers. Any product that may be evaluated in this article, or claim that may be made by its manufacturer, is not guaranteed or endorsed by the publisher.
References
Amin, M. Z. M., Shaaban, A. J., Ercan, A., Ishida, K., Kavvas, M., Chen, Z., et al. (2017). Future climate change impact assessment of watershed scale hydrologic processes in Peninsular Malaysia by a regional climate model coupled with a physically-based hydrology modelo. Sci. Total Environ. 575, 12–22. doi:10.1016/j.scitotenv.2016.10.009
Bian, G. D., Zhang, J. Y., Chen, J., Song, M., Liu, C., Liu, Y., et al. (2021). Projecting hydrological responses to climate change using CMIP6 climate scenarios for the upper huai River Basin, China. Front. Env. Sci. 9. doi:10.3389/fenvs.2021.759547
Chen, H. P., Sun, J. Q., Lin, W. Q., and Xu, H. (2020). Comparison of CMIP6 and CMIP5 models in simulating climate extremes. Sci. Bull. (Beijing) 65 (17), 1415–1418. doi:10.1016/j.scib.2020.05.015
Chen, J., Brissette, F. P., Chaumont, D., and Braun, M. (2013). Finding appropriate bias correction methods in downscaling precipitation for hydrologic impact studies over north America. Water Resour. Res. 49 (7), 4187–4205. doi:10.1002/wrcr.20331
China Flood Control and Drought Relief Headquarters (2007), China’s flood and Drought disasters report. Beijing: China Water Resources and Hydropower Press.
Cook, B. I., Mankin, J. S., Marvel, K., Williams, A. P., Smerdon, J. E., and Anchukaitis, K. J. (2020). Twenty-first century Drought projections in the CMIP6 forcing scenarios. Earth's Future 8 (6). doi:10.1029/2019ef001461
Das, J., Treesa, A., and Umamahesh, N. V. (2018). Modelling impacts of climate change on a river basin: Analysis of uncertainty using REA and possibilistic approach. Water Resour. Manag. 32, 4833–4852. doi:10.1007/s11269-018-2046-x
Dobler, C., Hagemann, S., Wilby, R. L., and Stötter, J. (2012). Quantifying different sources of uncertainty in hydrological projections in an Alpine watershed. Hydrol. Earth Syst. Sci. 16, 4343–4360. doi:10.5194/hess-16-4343-2012
Duan, Q., Sorooshian, S., and Gupta, V. (1992). Effective and efficient global optimization for conceptual rainfall-runoff models. Water Resour. Res. 28 (4), 1015–1031. doi:10.1029/91wr02985
Ge, F., Zhu, S. P., Luo, H. L., Zhi, X. F., and Wang, H. (2021). Future changes in precipitation extremes over southeast asia: Insights from CMIP6 multi-model ensemble. Environ. Res. Lett. 16 (2), 024013. doi:10.1088/1748-9326/abd7ad
Hirabayashi, Y., Mahendran, R., Koirala, S., Konoshima, L., Yamazaki, D., Watanabe, S., et al. (2013). Global flood risk under climate change. Nat. Clim. Change 3, 816–821. doi:10.1038/nclimate1911
Hu, S., Cheng, X., Zhou, D., and Zhang, H. (2017). GIS-based flood risk assessment in suburban areas: A case study of the fangshan district, beijing. Nat. Hazards 87 (3), 1525–1543. doi:10.1007/s11069-017-2828-0
IPCC (2013). “Summary for policymakers,” in Climate change 2013: The physical science basis. Contribution of working Group I to the fifth assessment report of the intergovernmental Panel on climate change. T. F. Stocker, and D. Qin (Cambridge, UK and New York, NY: Cambridge University Press).
IPCC (2021). “Summary for policymakers,” in Climate change 2021: The physical science basis. Contribution of working Group I to the sixth assessment report of the intergovernmental Panel on climate change. V. Masson-Delmotte, and P. M. Zhai (Cambridge, UK and New York, NY: Cambridge University Press).
Iqbal, Z., Shahid, S., Ahmed, K., Ismail, T., Ziarh, G. F., Chung, E. S., et al. (2021). Evaluation of CMIP6 GCM rainfall in mainland southeast asia. Atmos. Res. 254, 105525. doi:10.1016/j.atmosres.2021.105525
Jiang, M. K., Felzer, B. S., and Sahagian, D. (2016). Predictability of precipitation over the conterminous U.S. Based on the CMIP5 multi-model ensemble. Sci. Rep. 6 (1), 29962. doi:10.1038/srep29962
Jiang, T., Lu, Y., Huang, J., Wang, Y., Su, B., and Tao, H. (2020). New scenarios of CMIP6 model (SSP-RCP) and its application in the Huaihe River Basin. Adv. Meteorol. Sci. Technol. 10, 104–111. doi:10.3969/j.issn.2095-1973.2020.05.016
Jin, H. Y., Chen, X. H., Zhong, R. D., and Duan, K. (2022). Frequency analysis of extreme precipitation in different regions of the Huaihe River Basin. Int. J. Climatol. 42 (6), 3517–3536. doi:10.1002/joc.7430
Jin, J., He, J., He, R., Liu, C., Zhang, J., Wang, G., et al. (2017). Impacts of climate change to water resources and extreme hydrological event in the Huaihe River Basin. Sci. Geogr. Sin. 37 (8), 1226–1233. doi:10.13249/j.cnki.sgs.2017.08.013
Jing, C., Tao, H., Jiang, T., Wang, Y., Zhai, J., Cao, L., et al. (2020). Population, urbanization and economic scenarios over the Belt and Road region under the shared socioeconomic pathways. J. Geogrl Sci. 29 (12). doi:10.1007/s11442-020-1715-x
Karlsson, I. B., Sonnenborg, T. O., Refsgaard, J. C., Trolle, D., Børgesen, C. D., Olesen, J. E., et al. (2016). Combined effects of climate models, hydrological model structures and land use scenarios on hydrological impacts of climate change. J. Hydrol. 535, 301–317. doi:10.1016/j.jhydrol.2016.01.069
Kazakis, N., Kougias, I., and Patsialis, T. (2015). Assessment of flood hazard areas at a regional scale using an index-based approach and Analytical Hierarchy Process: Application in Rhodope–Evros region, Greece. Sci. Total Environ. 538, 555–563. doi:10.1016/j.scitotenv.2015.08.055
Lauri, H., Moel, H., Ward, P. J., Räsänen, T. A., Keskinen, M., and Kummu, M. (2012). Future changes in Mekong river hydrology: Impact of climate change and reservoir operation on discharge. Hydro Earth Syst. Sci. 16, 4603–4619. doi:10.5194/hess-16-4603-2012
Luo, C., Hu, M., Zhang, J., Chen, K., Chen, S., Zhou, Y., et al. (2006). Investigation and research on historical flood in China. Jiangsu Province: Nanjing Institute of Water Resources.
Mondal, S. K., Tao, H., Huang, J., Wang, Y., Su, B., Zhai, J., et al. (2021). Projected changes in temperature, precipitation and potential evapotranspiration across indus river basin at 1.5–3.0°C warming levels using CMIP6-GCMs. Sci. Total Environ. 789, 147867. doi:10.1016/j.scitotenv.2021.147867
Mou, S. Y., Shi, P., Qu, S. M., Feng, Y., Chen, C., and Dong, F. (2020). Projected regional responses of precipitation extremes and their Joint probabilistic behaviors to climate change in the upper and middle reaches of Huaihe River Basin, China. Atmos. Res. 240, 104942. doi:10.1016/j.atmosres.2020.104942
Nasser, N., and Naresh, D. (2018). Recent trends in the frequency and duration of global floods. Earth Syst. Dynam Discuss. 9 (2), 757–783. doi:10.5194/esd-9-757-2018
Oakley, N. S. (2021). A warming climate adds complexity to post-fire hydrologic hazard planning. Earth's Future 9 (7). doi:10.1029/2021ef002149
Papalexiou, S. M., and Montanari, A. (2019). Global and regional increase of precipitation extremes under global warming. Water Resour. Res. 55, 4901–4914. doi:10.1029/2018wr024067
Paprotny, D., Heidi, K., Oswaldo, M. N., Castellarin, A., Carisi, F., and Schröter, K. (2020). Exposure and vulnerability estimation for modelling flood losses to commercial assets in europe. Sci. Total Environ. 737, 140011. doi:10.1016/j.scitotenv.2020.140011
Samuels, R., Hochman, A., Baharad, A., Givati, A., Levi, Y., Yosef, Y., et al. (2018). Evaluation and projection of extreme precipitation indices in the eastern mediterranean based on CMIP5 multi-model ensemble. Int. J. Climatol. 38 (5), 2280–2297. doi:10.1002/joc.5334
Schewe, J., Heinke, J., Gerten, D., Haddeland, I., Arnell, N. W., Clark, D. B., et al. (2014). Multimodel assessment of water scarcity under climate change. Proc. Natl. Acad. Sci. U. S. A. 111, 3245–3250. doi:10.1073/pnas.1222460110
Shadmehri, T. A., Giancarlo, H. C., Nouri, H., and Alaghmand, S. (2019). River basin-scale flood hazard assessment using a modified multi-criteria decision analysis approach: A case study. J. Hydrol. 574, 660–671. doi:10.1016/j.jhydrol.2019.04.072
Slater, L., Villarini, G., Archfield, S., Faulkner, D., Lamb, R., Khouakhi, A., et al. (2021). Global changes in 20-year, 50-year, and 100-year river floods. Geophys Res. Lett. 48, e2020GL091824. doi:10.1029/2020gl091824
Song, J. J. (2023). Comparison and prospect of economic and population development in seven major river basins. Natural resource economics of China, 1–9.
Trenberth, K. E., Dai, A., Rasmussen, R. M., and Parsons, D. B. (2003). The changing character of precipitation. B Am. Meteorol. Soc. 84 (9), 1205–1218. doi:10.1175/bams-84-9-1205
Wang, G., Zhang, J., He, R., Liu, C., Ma, T., Bao, Z., et al. (2017a). Runoff sensitivity to climate change for hydro-climatically different catchments in China. Stoch. Environ. Res. Risk Assess. 31, 1011–1021. doi:10.1007/s00477-016-1218-6
Wang, L., Chen, S., Zhu, W., Ren, H., Zhang, L., and Zhu, L. (2021). Spatiotemporal variations of extreme precipitation and its potential driving factors in China's North-South Transition Zone during 1960–2017. Atmos. Res. 252 (4), 105429. doi:10.1016/j.atmosres.2020.105429
Wang, S., Xu, H., Liu, L., Wang, Y., and Song, A. (2018). Projection of the impacts of global warming of 1.5°C and 2.0°C on runoff in the upper-middle reaches of Huaihe River Basin. J. Nat. Resour. 33 (11), 1966–1978. doi:10.31497/zrzyxb.20171050
Wang, W., Lu, H., Leung, L. R., Li, H. Y., Zhao, J., Tian, F., et al. (2017b). Dam Construction in Lancang-Mekong River Basin could mitigate future flood risk from warming-induced intensified rainfall. Geophys Res. Lett. 44, 10378–10386. doi:10.1002/2017gl075037
Wu, C., and Huang, G. (2015). Changes in heavy precipitation and floods in the upstream of the Beijiang River basin, South China. Int. J. Climatol. 35 (10), 2978–2992. doi:10.1002/joc.4187
Wu, Y. N., Zhong, P. A., Xu, B., Zhu, F., and Ma, B. (2017). Changing of flood risk due to climate and development in Huaihe River Basin, China. Stoch. Environ. Res. Risk Assess. 31 (4), 935–948. doi:10.1007/s00477-016-1262-2
Yang, Q., Gao, C., Zha, Q., and Zhang, P. (2020). Changes of Climate and Runoff under the Representative Concentration Pathways Scenarios in the Upper Reaches of the Huaihe River. J. Anhui Agric. Sci. 48 (3), 209–221. doi:10.3969/j.issn.0517-6611.2020.03.061
Yao, Y., Qu, W., Lu, J. X., Cheng, H., Pang, Z., Lei, T., et al. (2021). Responses of hydrological processes under different shared socioeconomic pathway scenarios in the Huaihe River Basin, China. Water 13 (8), 1053. doi:10.3390/w13081053
Zhang, D., Zhang, L., Guan, Y., Chen, X., and Chen, X. (2012). Sensitivity analysis of Xinanjiang rainfall–runoff model parameters: A case study in lianghui, zhejiang province, China. Hydrol. Res. 43, 123–134. doi:10.2166/nh.2011.131
Zhang, Y. L., and You, W. J. (2014). Social vulnerability to floods: A case study of Huaihe River Basin. Nat. Hazards 71 (3), 2113–2125. doi:10.1007/s11069-013-0996-0
Zhao, Q., Ding, Y., Wang, J., Gao, H., Zhang, S., Zhao, C., et al. (2019). Projecting climate change impacts on hydrological processes on the Tibetan Plateau with model calibration against the glacier inventory data and observed streamflow. J. Hydrol. 573, 60–81. doi:10.1016/j.jhydrol.2019.03.043
Zhao, R. J. (1992). The Xinanjiang model applied in China. J. Hydrol. 135 (1–4), 371–381. doi:10.1016/0022-1694(92)90096-e
Zhu, H. H., Jiang, Z. H., Li, J., Li, W., Sun, C., and Li, L. (2020). Does CMIP6 inspire more confidence in simulating climate extremes over China? Adv. Atmos. Sci. 37 (10), 1119–1132. doi:10.1007/s00376-020-9289-1
Keywords: climate change, CMIP6, extreme precipitation, flood projections, Huaihe River Basin
Citation: Bian G, Zhang J, Song M, Qian X, Guan T and Wang G (2023) Projections of flood regime changes over the upper-middle Huaihe River Basin in China based on CMIP6 models. Front. Environ. Sci. 11:1247753. doi: 10.3389/fenvs.2023.1247753
Received: 26 June 2023; Accepted: 24 July 2023;
Published: 04 August 2023.
Edited by:
Xing Yuan, Nanjing University of Information Science and Technology, ChinaReviewed by:
Zhiyong Liu, Sun Yat-sen University, ChinaZhongwei Huang, Nanjing University of Information Science and Technology, China
Copyright © 2023 Bian, Zhang, Song, Qian, Guan and Wang. This is an open-access article distributed under the terms of the Creative Commons Attribution License (CC BY). The use, distribution or reproduction in other forums is permitted, provided the original author(s) and the copyright owner(s) are credited and that the original publication in this journal is cited, in accordance with accepted academic practice. No use, distribution or reproduction is permitted which does not comply with these terms.
*Correspondence: Guoqing Wang, Z3F3YW5nQG5ocmkuY24=; Jianyun Zhang, anl6aGFuZ0BuaHJpLmNu