 Fei Meng
 Shuling Yan1
95% of researchers rate our articles as excellent or good
Learn more about the work of our research integrity team to safeguard the quality of each article we publish.
Find out more
ORIGINAL RESEARCH article
Front. Environ. Sci. , 25 August 2023
Sec. Environmental Informatics and Remote Sensing
Volume 11 - 2023 | https://doi.org/10.3389/fenvs.2023.1247046
This article is part of the Research Topic Territorial Spatial Evolution Process and its Ecological Resilience View all 15 articles
The deterioration of the urban surface thermal environment has seriously affected regional environments and human health, becoming a critical ecological problem faced by cities worldwide. This study focused on surface urban heat island effect in metropolitan area and selected the emerging metropolitan area of Zhengzhou, China, as a case study. Based on the MODIS land surface temperature data obtained from the Google Earth Engine the surface urban heat island intensity (SUHII) was calculated and its temporal and spatial dynamics were analyzed from 2003 to 2022. The main findings indicated that Zhengzhou, the core city of the metropolitan area, had the strongest urban heat island effect with day surface urban heat island intensity of 1.10°C and night SUHII of 1.39°C). Generally, the average annual SUHII was higher during the day than at night, and the maximum value was detected in summer (2.43°C). SUHII showed an increasing trend at night, especially in summer during the study period. It decreased obviously in urban centers during the day, while it increased obviously in the outer urban areas at night. The results of this study contributed to the understanding of the spatiotemporal dynamics of the urban heat island effect in the Zhengzhou metropolitan area.
The urban heat island effect is defined as the phenomenon by which temperatures in urban areas are higher than those in surrounding rural areas. This effect can have an impact on the microclimate, atmospheric environment, and the wellbeing and health of urban residents (Manoli et al., 2019; Yang D. et al., 2022; Vinayak et al., 2022; Ma and Dong, 2023). Within the context of global climate change, urban heat islands exacerbate the risk of heat-related deaths (Wang J. et al., 2021; Tong et al., 2021). With the acceleration of urbanization, the urban heat island effect has become an important environmental issue. The phenomenon is caused by the gradual replacement of natural land surfaces (vegetation and water bodies) with impermeable surfaces and by the increase in heat emissions derived from urban human activities. As China’s massive urbanization continues to progress, the expansion of urban land use and population growth will continue to have a significant impact on the urban heat island effect (Chen et al., 2018; Vinayak et al., 2022). Studying urban heat islands can provide a theoretical basis for urban planning and sustainable development, which is urgently needed and have significant practical implications for improving the living environment of urban residents.
Extensive research has already been conducted on the urban heat island effect. In terms of measurement methods, it is common to calculate the air temperature or land surface temperature differences between urban and suburban areas based on data obtained on-site or using remote sensing technology (Khan and Chatterjee, 2016; Levermore et al., 2018; Zhang X. et al., 2022). In recent years, the urban heat island effect has been increasingly and primarily quantified by calculating the surface urban heat island intensity (SUHII) using land surface temperature data derived from remote sensing (Deilami et al., 2018; Kumar and Mishra, 2019; Yao et al., 2019). The temporal and spatial characteristics of SUHII and its influencing factors are the main focus of current research. Typically, Meng et al. (2018) conducted a temporal analysis of the urban heat island effect in Beijing and found a higher average daytime SUHII, which was associated with higher density of impervious surfaces (Meng et al., 2018). Wang et al. (2021) investigated urban heat island and the influences of air pollutants in cities in the Yangtze River Delta during 2015–2019 and also documented that annual average daytime SUHII was higher than nighttime SUHII, and O3 concentration presented a significant positive correlation with daytime SUHII (Wang Y. et al., 2021). Zhang et al. (2022) documented a decrease in SUHII in the Yangtze River Delta, Beijing-Tianjin-Hebei region, and the middle reaches of the Yangtze River from 2003 to 2019, as well as an increase in SUHII in the Chengdu-Chongqing and Pearl River Delta urban agglomerations, with significant impacts of land cover changes on the urban heat island effect in the Beijing-Tianjin-Hebei, Yangtze River Delta, and Chengdu-Chongqing urban agglomerations (Zhang H. et al., 2022). Additionally, Siddiqui et al. (2021) investigated the temporal variations of SUHII in three cities in India from 2001 to 2019, revealing a significant increasing trend in annual average SUHII in Kolkata and Pune, with particularly high warming rates during summer, especially at night. (Siddiqui et al., 2021). Generally, previous studies have mainly shown that the urban heat island effect is obvious in summer and at night. Aspects of the underlying surface, including land use/cover, urban morphology, landscape pattern, as well as anthropogenic heat and atmospheric pollution, are considered to be major factors influencing the urban heat island effect (Wang et al., 2018; Li et al., 2020; Wang J. et al., 2021; Yang F. et al., 2022; Sun et al., 2022). Regional climate conditions also have an important impact on the urban heat island effect. For example, Wu et al. (2019) explored the heat islands of 44 cities in South America based on the Köppen-Geiger climate zones and found that the average SUHII in all climate zones (except for arid zones) was higher during the day than at night (Wu et al., 2019).
In China, research is concerned with this issue in multiple cities or at the national scale (Peng et al., 2012; Debbage and Shepherd, 2015; Zhao et al., 2016; Yang et al., 2019; Liu Y. et al., 2020; Ke et al., 2021; Marando et al., 2022), especially where major megacities are located, such as the Yangtze River Delta region and the Beijing-Tianjin-Hebei region (Zhao et al., 2016; Liu X. et al., 2020; Zhang X. et al., 2022). These studies have greatly contributed to understanding this harmful phenomenon and the mechanisms that influence it. While, urban heat island effects may have different temporal and spatial characteristics in different regions and at different stages of urban expansion. Particularly, with the development of urban agglomerations, the urban heat island effect may extend beyond individual cities and spread throughout the entire urban agglomeration. While there have been numerous studies on the urban heat island effect in single cities or megacities, research specifically focusing on urban agglomerations remains relatively limited. Previous studies have mainly examined the temporal variations of the overall urban heat island effect in single cities and the differences among different cities (Meng et al., 2018; Yang et al., 2019). Some scholars have also investigated the spatial differences of the urban heat island effect within urban areas, such as the differences among different urban functional zones (Zhao et al., 2016; Ke et al., 2021). However, less attention has been given the temporal trends of the urban heat island effect within urban areas and its spatial differences. Therefore, further investigation is warranted to explore these aspects.
Therefore, to bridge this knowledge gap, long-term MODIS land surface temperature data obtained from the Google Earth Engine (GEE) cloud platform and related auxiliary data were here used to measure the SUHII of each city in the Zhengzhou metropolitan area from 2003 to 2022. Then, the annual variation and seasonal differences in SUHII during the day and at night were analyzed. Finally, the temporal trends of this parameter and its spatial differences within the cities in the area were further explored. The aim was to describe the spatiotemporal dynamics of the urban heat island effect and provide support for the formulation of policies to mitigate this harmful phenomenon in the Zhengzhou metropolitan area.
The Zhengzhou metropolitan area is located in the central and lower reaches of the Yellow River in China, a favorable geographical location at the center of China (Figure 1). Its total area is about 15.90 thousand square kilometers. It consists of five cities, i.e., Zhengzhou, Kaifeng, Xuchang, Xinxiang, and Jiaozuo, among which Zhengzhou is one of the nine national central cities of China. The Zhengzhou metropolitan area is characterized by a mainly flat terrain and mild climate. It is a key development area in Henan Province, and its economic hinterland is vast and has a great potential for future expansion. In 2021, the permanent population in the Zhengzhou metropolitan area was 31.60 million people, accounting for 32% of the total population in Henan Province; the regional gross domestic product was 2.43 trillion RMB, accounting for 41% of that of Henan Province (Henan Province Bureau of Statistics, 2022). It is one of the most developed and fastest-growing regions in central and western China. However, the rapid expansion of cities has damaged the urban ecological environment, leading to changes in the thermal environment and to the consequent urban heat island effect in this region.

FIGURE 1. Map of the Zhengzhou metropolitan area and its urban and suburban areas.
In previous studies, surface temperature has been used as a common indicator to quantify the urban heat island effect (Schwarz et al., 2011; Halder et al., 2021; Sekertekin and Zadbagher, 2021). In this study, the MODIS surface temperature product dataset, MYD11A2 V6.1, was obtained from the NASA’s Land Processes Distributed Active Archive Center (LP DAAC, https://lpdaac.usgs.gov) through the GEE platform. This dataset has a spatial resolution of 1 km and provides daytime and nighttime surface temperatures over an average period of 8 days. The images in the form of average values were synthesized to obtain the 20-year, annual, and seasonal land surface temperatures for the Zhengzhou metropolitan area on the GEE. Seasons were defined based on the traditional Chinese classification: spring (from March to May), summer (from June to August), autumn (from September to November), and winter (from December to February of the following year). The MYD11A2 dataset is available from 4 July 2002, therefore data from 1 March 2003, to 28 February 2023, were used in the present investigation.
Land use data were obtained from the China National Land Use/Cover Change dataset at the Resource and Environment Science and Data Center (https://www.resdc.cn/). This dataset is a national-scale thematic database of variations in land use/cover in China that was compiled through manual visual interpretation of Landsat-derived remote sensing images. The dataset, which has been updated to 2020, adopts a two-level classification system, with Level 1 consisting of six categories: cultivated land, forest land, grassland, water area, construction land, and unused land; the spatial resolution is 30 m.
A core issue in the remote sensing-based monitoring of urban heat islands is how to subdivide urban and suburban areas. In this study, an area buffer method was developed to determine the boundary between urban and suburban areas based on relevant previous investigations (Clinton and Gong, 2013; Zhou et al., 2014; Tan and Li, 2015; Liu X. et al., 2020). This method consisted of four steps. Firstly, land use data were processed using a binary system; construction land was defined as 1 and other land cover types were defined as 0. Secondly, the largest urban patches were identified and selected, and a 3 × 3 convolution filter was applied to extract urban boundaries. Thirdly, the “holes” formed by non-urban land cover within the urban boundary were filled to obtain a complete urban boundary. The resolution was very high: some patches north and east of Zhengzhou are separated from urban Zhengzhou by the Jialu River, Lian-Huo highway, and their green belt. In reality, these patches are also part of Zhengzhou’s urban area (they are main areas of Huiji District and Zhengdong New District). Thus, mask processing was applied to gap areas north and east of Zhengzhou. Finally, equal-area buffers were established outside the urban boundary to determine the suburban area (Liao et al., 2021). The derived urban and suburban boundaries are shown in Figure 1. The method ensures that urban built-up areas are concentrated contiguous areas, and the urban area is similar to the outer area, which is conducive to the comparison of surface temperature in the two regions.
SUHII is commonly measured by calculating the differences in surface temperature between urban area or sites and suburban area or sites. Based on the above-mentioned preprocessing of daytime and nighttime surface temperature data at the interannual and seasonal scales, we calculated the difference in the average surface temperature of all pixels between the urban and suburban areas of each city and considered it as the surface heat island intensity of each city. The following equation was applied:
where SUHII is the surface urban heat island intensity, n and m represent the total number of pixels in urban and suburban areas, respectively. Tu is the surface temperature in pixel u in urban areas, and Ts is the surface temperature in pixel s in suburban areas.
Sen’s slope, also known as Theil-Sen median, is a robust nonparametric statistical method used to calculate trends. As it has a high computational efficiency and is insensitive to measurement errors and outliers, this method is commonly used in trend analyses of long time series data. It is described by the following equation:
where,
The Sen’s slope method is usually applied in combination with the Mann–Kendall test.
The Mann-Kendall test is a nonparametric statistical method. Its null hypothesis assumes the absence of a trend, while the alternative hypothesis assumes the existence of some trend. Through this test, the difference between each data point and all subsequent data points in a given time series was calculated, and the trend of the time series was then determined based on the sign of the differences obtained. Finally, by applying the rank-sum test it was established whether the trend was significant or not. A significant test result indicated the presence of a trend in the time series; otherwise, it was concluded that there was no trend.
The test was described as follows:
The standardized test statistic Z for time series
where,
If
Based on the daytime and nighttime land surface temperature data from 2003 to 2022, the multi-year average land surface temperatures of urban and suburban areas and the annual average SUHIIs of each city during the day and at night were calculated and are shown in Figure 2. Among the cities in the Zhengzhou metropolitan area, Zhengzhou showed the strongest SUHII during the day (1.10°C) and at night (1.39°C). The annual average SUHIIs during the day in the other cities were all less than 1°C. However, at night, Xinxiang and Xuchang exhibited SUHII higher than 1°C, reaching 1.23°C and 1.18°C, respectively. The lowest annual average SUHII during the day was 0.34°C, detected in Kaifeng, while the lowest value at night was 0.76°C, detected in Jiaozuo. Overall, the multi-year average land surface temperatures of urban and suburban areas in the Zhengzhou metropolitan area during the day were 26.38°C and 25.66°C, respectively, while at night they were 10.34°C, and 9.24°C, respectively. The SUHII in the Zhengzhou metropolitan area was higher at night (1.10°C) than during the day (0.72°C).
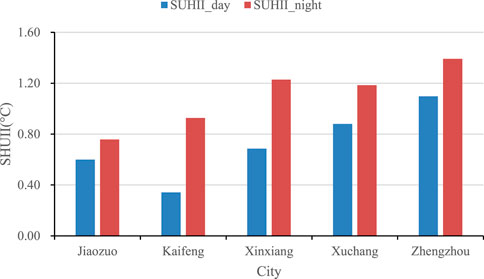
FIGURE 2. Average daytime and nighttime surface heat island intensity in each city of the Zhengzhou metropolitan area.
Subsequently, the average daytime and nighttime SUHIIs in each city in different seasons were calculated, and the results are shown in Table 1. The highest daytime SUHII was detected in Xuchang in spring (2.11°C), followed by that in Xinxiang (2.05°C), while that in Kaifeng was the lowest (0.67°C). In summer, the highest SUHII was detected in Zhengzhou, where it reached 2.43°C, while the values in other cities were all below 2.00°C. In autumn, the SUHII in Zhengzhou was still the highest, reaching 0.78°C, while that in Xinxiang was the lowest, at only 0.06°C. In winter, the SUHIIs in all cities were negative due to the cold island effect. The strongest and weakest effects were detected in Xinxiang (−0.72°C) and Zhengzhou (−0.28°C), respectively.
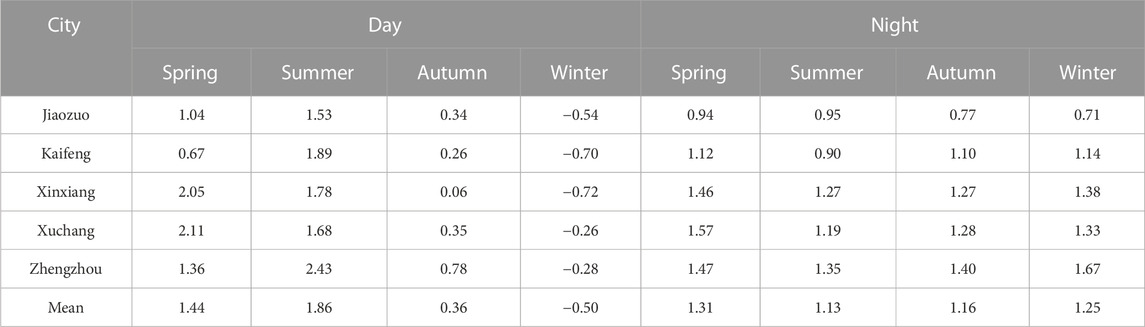
TABLE 1. Surface heat island intensity in each city of the Zhengzhou metropolitan area across seasons.
At night, the highest SUHII was recorded in Xuchang in spring (1.57°C), followed by the values in Zhengzhou (1.47°C) and Xinxiang (1.46°C). The lowest SUHII in spring was detected in Kaifeng (0.94°C). In summer, Zhengzhou exhibited the highest SUHII (1.35°C), followed by Xinxiang (1.27°C) and Xuchang (1.19°C), while the lowest value was detected in Kaifeng (0.90°C). In autumn, the highest SUHII was still recorded in Zhengzhou (1.40°C), followed by Xuchang (1.28°C) and Xinxiang (1.27°C). In winter, Zhengzhou again recorded the highest SUHII (1.67°C), followed by Xinxiang (1.38°C) and Xuchang (1.33°C), while the lowest intensity was recorded in Jiaozuo (0.71°C).
Among the four seasons, spring and summer recorded higher SUHIIs in each city during the day. Among the examined cities, similarly to the results reported in Figure 1, Zhengzhou, Xuchang, and Xinxiang exhibited relatively high SUHIIs, while the values in Kaifeng and Jiaozuo were low.
The annual average daytime and nighttime SUHIIs in each city from 2003 to 2022 were plotted to determine temporal variations, and the results are shown in Figure 3. During the day, the SUHII in Kaifeng and Jiaozuo showed a fluctuating downward trend from 2003 to 2018, while that in Zhengzhou, Xuchang, and Xinxiang showed an increasing trend from 2003 to 2008 and a fluctuating downward trend from 2008 to 2018 (Figure 3A). After 2018, the overall trend in all cities except for Jiaozuo showed a significant increase. The daytime SUHII in Zhengzhou was positive in all years examined, while in the other cities it was positive in most years and negative in some years. Specifically, in Kaifeng, SUHII was negative in 2016, 2019, and 2022, with values of −0.04°C, −0.14°C, and −0.10°C, respectively. In Jiaozuo and Xinxiang, this parameter was negative in 2018, with values of −0.02°C and −0.38°C, respectively. In Xuchang, it was negative in 2013, with a value of −0.18°C.
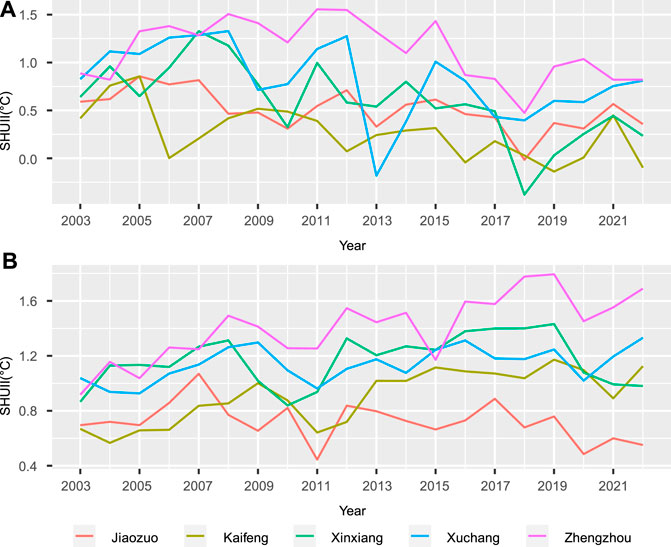
FIGURE 3. Temporal variation of surface heat island intensity in each city of the Zhengzhou metropolitan area between 2003 and 2022: (A) day, (B) night.
In all cities except for Jiaozuo, SUHII showed a fluctuating upward trend at night. In 2003, the nighttime SUHIIs in Kaifeng, Xinxiang, Xuchang, and Zhengzhou were 0.67°C, 0.87°C, 1.04°C, and 0.92°C, respectively. By 2022, these values had increased to 1.12°C, 0.98°C, 1.33°C, and 1.69°C, respectively.
The daytime and nighttime SUHIIs in the study area in summer and winter from 2003 to 2022 were plotted to analyze temporal variations in different seasons. The temporal changes in SUHII during summer days reported in Figure 4 indicate no significant increasing or decreasing trends in the cities examined. Among these, Zhengzhou exhibited a relatively large fluctuation in SUHII values during summer days. However, during summer nights, the intensities generally increased in all cities, and the increase was significant especially between 2003 and 2010 (Figure 4B). During winter days, SUHII showed a decreasing trend in all cities before 2009 and displayed interannual non-significant fluctuations after 2009, which basically indicated the presence of the cold island effect (Figure 4C). During winter nights, SUHII did not very significantly in Jiaozuo, but in the other cities it generally showed an increasing trend (Figure 4D).
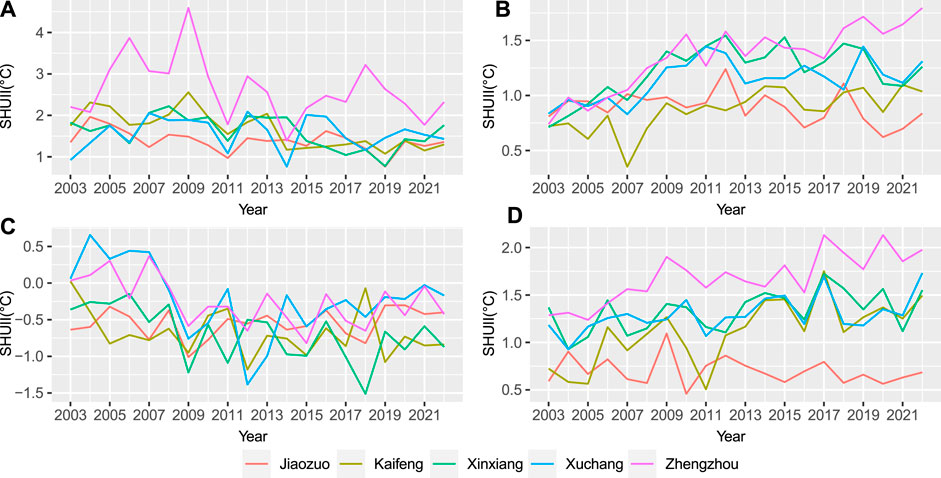
FIGURE 4. Temporal variation of SUHII in each city of the Zhengzhou metropolitan area during summer and winter from 2003 to 2022: (A) summer daytime, (B) summer nighttime, (C) winter daytime, (D) winter nighttime.
SUHII was expected to vary at different locations within each city. The pixel-scale SUHII was here calculated based on the daytime and nighttime surface temperatures of urban and suburban areas in each city from 2003 to 2022. Then, based on the values obtained for each year, the Sen’s slope was calculated at the pixel scale and the Mann–Kendall trend test was conducted. Using a confidence level of 95% (α = 0.05, Z = 1.96), the SUHII trends of all cities were categorized into four types: significant increase, non-significant increase, significant decrease, and non-significant decrease.
Figure 5 shows the spatial distribution of daytime SUHII trends in the five cities examined. This parameter significantly decreased during the day in the old city areas and increased primarily in the peripheral urban areas, namely, in the northern parts of Xuchang (Figure 5A) and Kaifeng (Figure 5B), the eastern and western parts of Jiaozuo (Figure 5C), the western and southern parts of Xinxiang (Figure 5D), and the northeastern and southeastern parts of Zhengzhou (Figure 5E). The proportion of areas showing a significant decrease in SUHII during the daytime was relatively large in each city (Table 2). Specifically, the proportion in the urban area of Xinxiang was the largest, at 55.11%, while that in the urban area of Zhengzhou was the smallest, but still up to 39.67%. The areas in each city showing a significant increase in SUHII during the daytime were relatively small. The largest proportion (18.02%) was detected in the urban area of Zhengzhou, followed by Xuchang (12.04%) and Kaifeng (10.44%). In both the urban areas of Xinxiang and Jiaozuo, the proportion was lower than 7.00%.
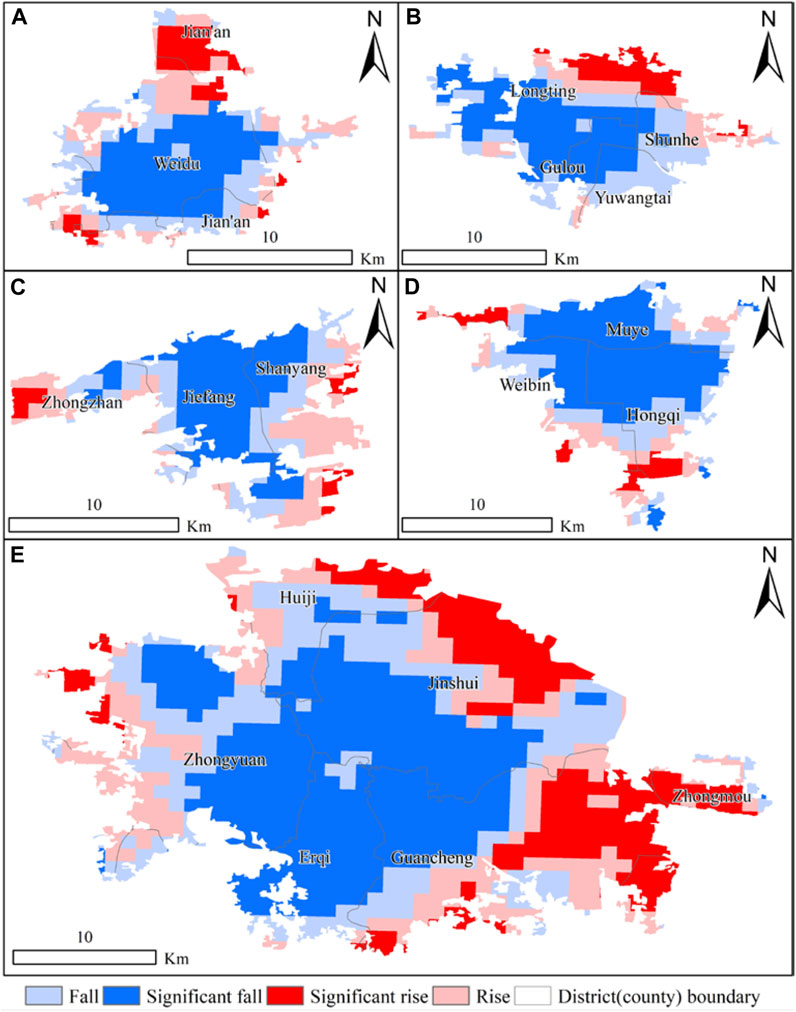
FIGURE 5. Spatial distribution of daytime SUHII trends in different cities within the Zhengzhou metropolitan area: (A) Xuchang, (B) Kaifeng, (C) Jiaozuo, (D) Xinxiang, (E) Zhengzhou.
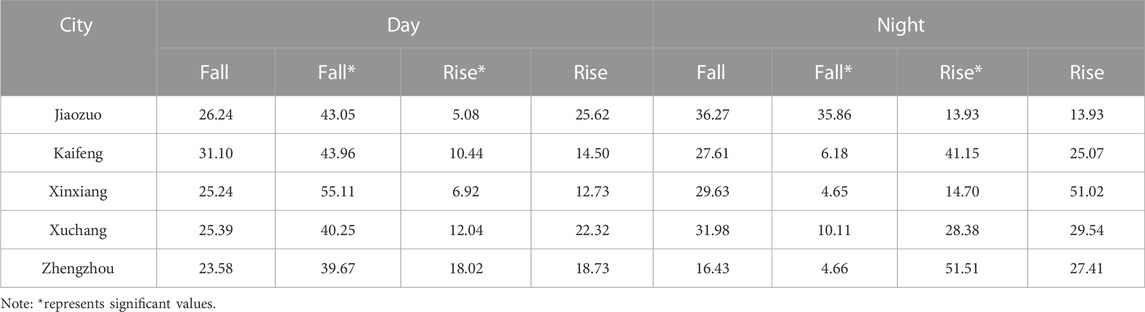
TABLE 2. Proportion of areas (%) showing increasing (Rise) or decreasing (Fall) trends in SUHII during the day and at night in different cities within the Zhengzhou metropolitan area.
Figure 6 shows the spatial distribution of nighttime SUHII trends for the five cities examined. A significant decrease in nighttime SUHII was detected southwest of Xuchang (Figure 6A), while a significant increase was observed northeast of this city. In other areas, the upward or downward trends were not significant. In Kaifeng, most areas northwest of Longting District showed a significant increase in SUHII at night, while other areas mainly exhibited non-significant upward or downward trends (Figure 6B). In the southern part of Jiaozuo, the nighttime SUHII increased significantly, while in some central, northeastern, and northwestern areas of the city, this parameter showed a significant decrease (Figure 6C). Significant increases in nighttime SUHII were observed in some eastern, southeastern, and northern areas of Xinxiang (Figure 6D), while some small areas northwest and southwest of this city showed significant decreases in this parameter. In most other areas, the upward or downward trends were not significant. Significant increases in nighttime SUHII were observed in most southeastern, northwestern, and southwestern areas of Zhengzhou (Figure 6E), while individual areas northeast and southwest of this city showed a significant decrease in this parameter. The values in the old city area and its surroundings exhibited a downward and upward trend, respectively, but these were not significant.
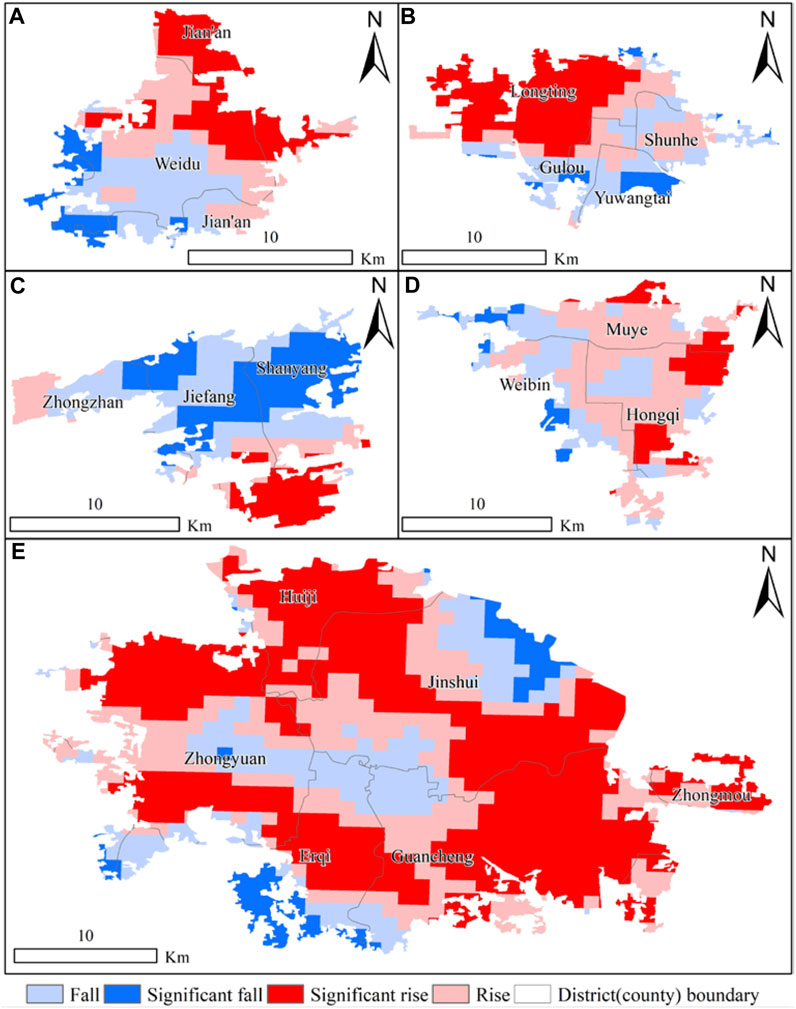
FIGURE 6. Spatial distribution of nighttime SUHII trends in different cities within the Zhengzhou metropolitan area: (A) Xuchang, (B) Kaifeng, (C) Jiaozuo, (D) Xinxiang, (E) Zhengzhou.
Based on the data reported in Table 2, large areas of Kaifeng (51.51%) and Zhengzhou (41.14%) exhibited a significant increase in nighttime SUHII, while this trend was observed in relatively small areas in Jiaozuo (13.93%) and Xinxiang (14.70%). The largest area showing a significant decrease in nighttime SUHII was detected in Jiaozuo, reaching 35.86%, followed by Xuchang at 10.11%. In all the other cities, the proportions were smaller than 6.50%.
Several studies have been conducted to investigate urban heat island in the study area. However, previous research has primarily focused on Zhengzhou. Notably, Min et al. (2018) and Yang et al. (2022) examined the temporal and spatial variations of urban heat island using radiation brightness temperature data for the periods of 1996–2014 and 2006–2020, respectively (Min et al., 2018; Yang Y. et al., 2022). These studies analyzed the spatial patterns of urban heat island and documented the area of urban heat island generally increased during over the study periods. Additionally, Min et al. (2018) reported an overall rise in average land surface temperature during 1996–2014. Furthermore, Zhou et al. (2022) investigated the temporal and spatial variations of land surface temperature across the entire city of Zhengzhou, encompassing both urban and rural areas (Zhou et al., 2022). The study utilized the MODIS land surface temperature data from 2005 to 2020 and found that the average land surface temperature exhibited an upward trend, with the urban heat island predominantly concentrated in the main city. It is important to note that these aforementioned studies differ significantly from the present study, as they used land surface temperature as a metric to characterize urban heat island and focused on analyzing the spatial distribution and temporal changes of land surface temperature. Nevertheless, there were some similar findings indicating a general increasing trend in surface temperature within Zhengzhou (see Fig. A1 and Fig. A2).
In this study, the SUHII in the cities of the Zhengzhou metropolitan area was calculated and its temporal variation, seasonal differences, and spatial differences during the day and at night were analyzed. The core city of the metropolitan area, Zhengzhou, exhibited the strongest SUHII and, in all cities examined, this parameter was higher during the day than at night. Significant seasonal differences in SUHII were detected in each city, with generally stronger daytime intensities in summer and cold island effects in winter. From 2003 to 2022, the annual average SUHII at night and the average SUHII in summer and winter nights showed overall increasing trends in all cities except for Jiaozuo. Values varied significantly in different areas within each city during the day, with significant downward trends detected in the central areas (referred to as “old city”) and significant upward trends in some peripheral areas. Significant regional differences in the increase or decrease of nighttime SUHII in each city were also observed.
The urban heat island effect is a widespread phenomenon, especially in large cities (Yang et al., 2019), and the present study confirmed that the city of Zhengzhou had the strongest SUHII in the metropolitan area. In comparison, the values detected in Kaifeng and Jiaozuo were relatively low, and this difference is closely related to the geographical environment of these two cities. Kaifeng, known as the “water city” of northern China, has many water bodies in its urban area, which result in a weak heat island effect. Due to the exposure of Jiaozuo to the Taihang Mountain in the north and its winds, the nighttime surface temperature in this city was lower than 1°C, and SUHII was also consequently low. As reported in previous studies of the seasonal patterns of SUHII in Chinese cities (Zhou et al., 2014; Wang et al., 2015), the present study found that the daytime heat island effect in the Zhengzhou metropolitan area was the strongest in summer, followed by that in spring, autumn, and winter, while the nighttime heat island effect was stronger in spring and winter and weaker in summer and autumn. The Zhengzhou metropolitan area is located in the temperate monsoon climate zone of the northern hemisphere and is characterized by long sunshine hours and a high solar elevation angle in summer. The continuous heat storage by artificial surfaces in urban areas causes higher daytime surface temperatures that result in stronger daytime SUHIIs in summer. In contrast, in suburban areas, where there are more agricultural activities or forest vegetation, the evapotranspiration effect of plants reduces surface temperatures (Yao et al., 2019; Meng et al., 2023). In this study, the lowest SUHIIs were detected in winter, indicating the presence of the cold island effect, which is associated with weak solar radiation and differences in the thermal properties of urban and suburban areas. This effect has been shown to vary in different regions. At night, suburban vegetation activity and reduced surface reflectivity as well as human-induced heat emissions cause higher surface temperatures in urban areas than in suburban areas in all seasons (Yang et al., 2019).
In terms of the interannual variation of daytime and nighttime SUHIIs, we found no significant trends during the day in any of the cities examined, except for Jiaozuo. However, the SUHII at night showed an increasing trend in all cities except for Jiaozuo. In terms of seasonal variation, no clear trend in daytime SUHII was detected either in winter or summer. However, the nighttime SUHII in summer showed a clear increasing trend in all cities, while that in winter showed a clear increasing trend for all cities except for Jiaozuo. Similar findings have also been reported in other studies (Zhou et al., 2016; Meng et al., 2018). The present study also revealed the spatial differences in SUHII within urban areas. During the day, this parameter exhibited a significant decreasing trend in the “old city” areas and a non-significant decreasing trend in the surrounding areas. On the other hand, some areas on the outskirts of the cities examined showed a significant increasing trend. This indicated that the urban heat islands effect shifts from central cities to the suburbs, and we believe that this phenomenon is related to the processes of urbanization and spatial expansion of cities. The earliest increases in surface temperature and SUHII were recorded in the central areas of cities, which were developed first. With the expansion of cities, the surface temperature in the peripheral areas increased rapidly, leading to an increase in surface temperature in the suburbs. At the same time, the surface temperature in the old cities increased relatively slowly due to the higher initial surface temperature. Consequently, the difference in the increase of surface temperature between the central and peripheral areas (see Figure A1) resulted in a weaker increase in SUHII in the central area, and even in a decreasing trend. At night, obvious differences among cities were detected in the areas where SUHII significantly increased or decreased. This was due to the main direction of urban expansion and to the population and industrial concentrations in each city. Over the past 20 years, Xuchang has mainly expanded to the northeast, Kaifeng has expanded on a large scale in Longting District, and Jiaozuo and Xuchang have expanded toward their southeastern/eastern areas. In contrast, in Zhengzhou, the areas of urban and population expansion have been the eastern Zhengdong New District, southeastern Economic Development Zone, northwestern High-Tech Zone, and Huiji District, and they have been rapidly developed moving from the city center toward the periphery.
The above findings can contribute to the understanding of the spatiotemporal dynamics of the urban heat island effect in the study area. Especially, the spatial differences in SUHII within urban areas, which previous studies have focused less on, were also revealed. The specific mechanisms that determine the urban heat island effect in each city and its influencing factors are different and complex and need to be further investigated. However, urbanization and urban expansion undoubtedly resulted in spatial differences in the increase of surface temperature (Figure A2) and SUHII within each city. In addition, the large area of the water body (in Kaifeng) effectively mitigates the urban heat island effect from the comparison of heat island effects in the five cities. Thus, these findings have important practical policy implications for the ongoing urban renewal projects and urbanization development planning in China. It is recommended to add more green vegetation around buildings, city roads, and large squares, and to include new water urban bodies, and increase the existing urban water bodies according to the area of urban function zones. The plan for ventilation corridors and green belts between urban function zones should be given full attention in future urbanization and urban agglomeration development.
There were two main aspects of limitation that needed clarification in this study. The first was the coarse resolution of the surface temperature data. A resolution of 1 km is sufficient to reveal spatial differences in surface temperatures at a regional or national scale, but it fails to capture the spatial variability in temperature within urban areas effectively. Fortunately, significant progress has been made in producing finer resolution surface temperature data products, such as 100 m and 30 m, based on the Landsat data (Wang et al., 2020; Cheng et al., 2021). Therefore, finer-resolution surface temperature product data should be applied in future studies. The second limitation stems from the division of urban areas and suburban areas. Urban areas are dynamic and rapidly expand into rural regions. In urban agglomerations, some cities are even adjacent to each other through critical infrastructure and functional zones, blurring the boundaries between urban and suburban areas. Consequently, some urban areas may be excluded in this study. More scientific and effective quantization methods for defining urban and suburban areas should be explored, particularly in urban agglomerations.
In this study, the SUHIIs of cities in the Zhengzhou metropolitan area were calculated based on the difference in surface temperature between urban and suburban areas. Then, the differences in this parameter during the day and at night, as well as its seasonal variation, temporal trends, and spatial differences among different cities were analyzed. Overall, it was shown that Zhengzhou, the core city of the metropolitan area, had the strongest urban heat island effect. The nighttime SUHII of each city examined exhibited a clear increasing trend; however, the daytime SUHIIs outside the urban areas showed a significant decreasing trend, while the nighttime values in the main regions of urban expansion in each city showed a clear increasing trend. The results obtained provided a knowledge base to understand the spatiotemporal variation of the urban heat island effect in the Zhengzhou metropolitan area.
The original contributions presented in the study are included in the article/Supplementary Material, further inquiries can be directed to the corresponding author.
GT conceived and designed the study. FM initiated the study and undertook statistical analysis and manuscript writing. FM undertook data curation and revised the manuscript. YW designed the methodology. SY provided useful suggestions. All authors contributed to the article and approved the submitted version.
This study was sponsored by the Key Scientific and Technological Project of Henan Province, China (Grant No. 222400410101).
The authors declare that the research was conducted in the absence of any commercial or financial relationships that could be construed as a potential conflict of interest.
All claims expressed in this article are solely those of the authors and do not necessarily represent those of their affiliated organizations, or those of the publisher, the editors and the reviewers. Any product that may be evaluated in this article, or claim that may be made by its manufacturer, is not guaranteed or endorsed by the publisher.
Chen, M., Liu, W., Lu, D., Chen, H., and Ye, C. Progress of China’s new-type urbanization construction since 2014: A preliminary assessment. Cities 2018, 78, 180–193. doi:10.1016/j.cities.2018.02.012
Cheng, Jie., Meng, X., Dong, S., and Liang, S. Generating the 30-m land surface temperature product over continental China and USA from landsat 5/7/8 data. Sci. Remote Sens. 2021, 4: 100032. doi:10.1016/j.srs.2021.100032
Clinton, N., and Gong, P. MODIS detected surface urban heat islands and sinks: Global locations and controls. Remote Sens. Environ. 2013, 134, 294–304. doi:10.1016/j.rse.2013.03.008
Debbage, N., and Shepherd, J. M. The urban heat island effect and city contiguity. Comput. Environ. Urban Syst. 2015, 54, 181–194. doi:10.1016/j.compenvurbsys.2015.08.002
Deilami, K., Kamruzzaman, M., and Liu, Y. Urban heat island effect: A systematic review of spatio-temporal factors, data, methods, and mitigation measures. Int. J. Appl. Earth Obs. Geoinf. 2018, 67, 30–42. doi:10.1016/j.jag.2017.12.009
Halder, B., Bandyopadhyay, J., and Banik, P. Evaluation of the climate change impact on urban heat island based on land surface temperature and geospatial indicators. Int. J. Environ. Res. 2021, 15, 819–835. doi:10.1007/s41742-021-00356-8
Henan Province Bureau of Statistics, . 2022 Henan statistical yearbook. Beijing, China: China Statistics Press.
Ke, X., Men, H., Zhou, T., Li, Z., and Zhu, F. Variance of the impact of urban green space on the urban heat island effect among different urban functional zones: A case study in wuhan. Urban For. Urban Green. 2021, 62, 127159, doi:10.1016/j.ufug.2021.127159
Khan, A., and Chatterjee, S. Numerical simulation of urban heat island intensity under urban–suburban surface and reference site in Kolkata, India. Earth Syst. Environ. 2016, 2, 71, doi:10.1007/s40808-016-0119-5
Kumar, R., and Mishra, V. Decline in surface urban heat island intensity in India during heatwaves. Environ. Res. Commun. 2019, 1, 031001, doi:10.1088/2515-7620/ab121d
Levermore, G., Parkinson, J., Lee, K., Laycock, P., and Lindley, S. The increasing trend of the urban heat island intensity. Urban Clim. 2018, 24, 360–368. doi:10.1016/j.uclim.2017.02.004
Li, Y., Schubert, S., Kropp, J. P., and Rybski, D. On the influence of density and morphology on the urban heat island intensity. Nat. Commun. 2020, 11, 2647, doi:10.1038/s41467-020-16461-9
Liao, W., Cai, Z., Feng, Ye., Gan, D., and Li, X. A simple and easy method to quantify the cool island intensity of urban greenspace. Urban For. Urban Green. 2021,62: 127173, doi:10.1016/j.ufug.2021.127173
Liu, X., Zhou, Y., Yue, W., Li, X., Liu, Y., and Lu, D. Spatiotemporal patterns of summer urban heat island in Beijing, China using an improved land surface temperature. J. Clean. Prod. 2020b, 257, 120529, doi:10.1016/j.jclepro.2020.120529
Liu, Y., Li, Q., Yang, L., Mu, K., Zhang, M., and Liu, J. Urban heat island effects of various urban morphologies under regional climate conditions. Sci. Total Environ. 2020a, 743, 140589, doi:10.1016/j.scitotenv.2020.140589
Ma, J., Dong, G., Yao, B., Giannousis, P., Thoolen, M., Ye, Q., et al. Periodicity and variability in daily activity satisfaction: Toward a space-time modeling of subjective well-being. Ann. Am. Assoc. Geogr. 2023, 1, 1–19. doi:10.1080/00498254.2023.2245459
Manoli, G., Fatichi, S., Schläpfer, M., Yu, K., Crowther, T. W., Meili, N., et al. Magnitude of urban heat islands largely explained by climate and population. Nature 2019, 573, 55–60. doi:10.1038/s41586-019-1512-9
Marando, F., Heris, M. P., Zulian, G., Udías, A., Mentaschi, L., Chrysoulakis, N., et al. Urban heat island mitigation by green infrastructure in European functional urban areas. Sustain. Cities Soc. 2022, 77, 103564, doi:10.1016/j.scs.2021.103564
Meng, Q., Zhang, L., Sun, Z., Meng, F., Wang, L., and Sun, Y. Characterizing spatial and temporal trends of surface urban heat island effect in an urban main built-up area: A 12-year case study in Beijing, China. Remote Sens. Environ. 2018, 204, 826–837. doi:10.1016/j.rse.2017.09.019
Meng, X., Pi, H., Gao, X., He, P., and Lei, J. A high-accuracy vegetation restoration potential mapping model integrating similar habitat and machine learning. L. Degrad. Dev. 2023, 34, 1208–1224. doi:10.1002/ldr.4527
Min, M., Zhao, H., and Miao, C. Spatio-temporal evolution analysis of the urban heat island: A case study of Zhengzhou city, China. Sustainability 2018, 10, 1992; doi:10.3390/su10061992
Peng, S., Piao, S., Ciais, P., Friedlingstein, P., Ottle, C., Bréon, F.-M., et al. Surface urban heat island across 419 global big cities. Environ. Sci. Technol. 2012, 46, 696–703. doi:10.1021/es2030438
Schwarz, N., Lautenbach, S., and Seppelt, R. Exploring indicators for quantifying surface urban heat islands of European cities with MODIS land surface temperatures. Remote Sens. Environ. 2011, 115, 3175–3186. doi:10.1016/j.rse.2011.07.003
Sekertekin, A., and Zadbagher, E. Simulation of future land surface temperature distribution and evaluating surface urban heat island based on impervious surface area. Ecol. Indic. 2021, 122, 107230, doi:10.1016/j.ecolind.2020.107230
Siddiqui, A., Kushwaha, G., Nikam, B., Srivastav, S. K., Shelar, A., and Kumar, P. Analysing the day/night seasonal and annual changes and trends in land surface temperature and surface urban heat island intensity (SUHII) for Indian cities. Sustain. Cities Soc. 2021, 75:103374, doi:10.1016/j.scs.2021.103374
Sun, Z., Li, Z., and Zhong, J. Analysis of the impact of landscape patterns on urban heat islands: A case study of Chengdu, China. Int. J. Environ. Res. Public Health 2022, 19, 13297, doi:10.3390/ijerph192013297
Tan, M., and Li, X. Quantifying the effects of settlement size on urban heat islands in fairly uniform geographic areas. Habitat Int. 2015, 49, 100–106. doi:10.1016/j.habitatint.2015.05.013
Tong, S., Prior, J., McGregor, G., Shi, X., and Kinney, P. Urban heat: An increasing threat to global health. BMJ 2021, 375, n2467, doi:10.1136/bmj.n2467
Vinayak, B., Lee, H. S., Gedam, S., and Latha, R. Impacts of future urbanization on urban microclimate and thermal comfort over the Mumbai metropolitan region, India. Sustain. Cities Soc. 2022, 79, 103703, doi:10.1016/j.scs.2022.103703
Wang, J., Chen, Y., Liao, W., He, G., Tett, S. F. B., Yan, Z., et al. Anthropogenic emissions and urbanization increase risk of compound hot extremes in cities. Nat. Clim. Chang. 2021a, 11, 1084–1089. doi:10.1038/s41558-021-01196-2
Wang, J., Huang, B., Fu, D., and Atkinson, P. M. Spatiotemporal variation in surface urban heat island intensity and associated determinants across major Chinese cities. Remote Sens. 2015, 7, 3670–3689. doi:10.3390/rs70403670
Wang, M., Zhang, Z., Hu, T., Wang, G., He, G., Zhang, Z., et al. An efficient framework for producing landsat-based land surface temperature data using Google Earth engine. IEEE J. Sel. Top. Appl. Earth Observations Remote Sens. 2020, 13: 4689–4701. doi:10.1109/JSTARS.2020.3014586
Wang, X., Tian, G., Yang, D., Zhang, W., Lu, D., and Liu, Z. Responses of PM2.5 pollution to urbanization in China. Energy Policy 2018, 123, 602–610. doi:10.1016/j.enpol.2018.09.001
Wang, Y., Guo, Z., and Han, J. The relationship between urban heat island and air pollutants and them with influencing factors in the Yangtze River Delta, China. Ecol. Indic. 2021b,129: 107976, doi:10.1016/j.ecolind.2021.107976
Wu, X., Wang, G., Yao, R., Wang, L., Yu, D., and Gui, X. Investigating surface urban heat islands in South America based on MODIS data from 2003–2016. Remote Sens. 2019, 11, 1212, doi:10.3390/rs11101212
Yang, D., Meng, F., Liu, Y., Dong, G., and Lu, D. Scale effects and regional disparities of land use in influencing pm 2.5 concentrations: A case study in the Zhengzhou metropolitan area, China. Land 2022a, 11, 1538, doi:10.3390/land11091538
Yang, F., Li, S., Gao, Y., Li, M., and Wu, P. Inconsistent carbon budget estimation using dynamic/static carbon density under land use and land cover change: A case study in henan Province, China. Land 2022b, 11, 2232, doi:10.3390/land11122232
Yang, Q., Huang, X., and Tang, Q. The footprint of urban heat island effect in 302 Chinese cities: Temporal trends and associated factors. Sci. Total Environ. 2019, 655, 652–662. doi:10.1016/j.scitotenv.2018.11.171
Yang, Y., Song, F., Ma, J., Wei, Z., Song, L., and Cao, W. Spatial and temporal variation of heat islands in the main urban area of Zhengzhou under the two-way influence of urbanization and urban forestry. PLoS ONE 2022c, 17(8): e0272626. doi:10.1371/journal.pone.0272626
Yao, R., Wang, L., Huang, X., Gong, W., and Xia, X. Greening in rural areas increases the surface urban heat island intensity. Geophys. Res. Lett. 2019, 46, 2204–2212. doi:10.1029/2018GL081816
Zhang, H., Yin, Y., An, H., Lei, J., Li, M., Song, J., et al. Surface urban heat island and its relationship with land cover change in five urban agglomerations in China based on GEE. Environ. Sci. Pollut. Res. 2022b, 29: 82271–82285. doi:10.1007/s11356-022-21452-y
Zhang, X., Chen, L., Jiang, W., and Jin, X. Urban heat island of Yangtze River Delta urban agglomeration in China: Multi-time scale characteristics and influencing factors. Urban Clim. 2022a, 43, 101180, doi:10.1016/j.uclim.2022.101180
Zhao, M., Cai, H., Qiao, Z., and Xu, X. Influence of urban expansion on the urban heat island effect in shanghai. Int. J. Geogr. Inf. Sci. 2016, 30, 2421–2441. doi:10.1080/13658816.2016.1178389
Zhou, D., Zhang, L., Hao, L., Sun, G., Liu, Y., and Zhu, C. Spatiotemporal trends of urban heat island effect along the urban development intensity gradient in China. Sci. Total Environ. 2016, 544, 617–626. doi:10.1016/j.scitotenv.2015.11.168
Zhou, D., Zhao, S., Liu, S., Zhang, L., and Zhu, C. Surface urban heat island in China’s 32 major cities: Spatial patterns and drivers. Remote Sens. Environ. 2014, 152, 51–61. doi:10.1016/j.rse.2014.05.017
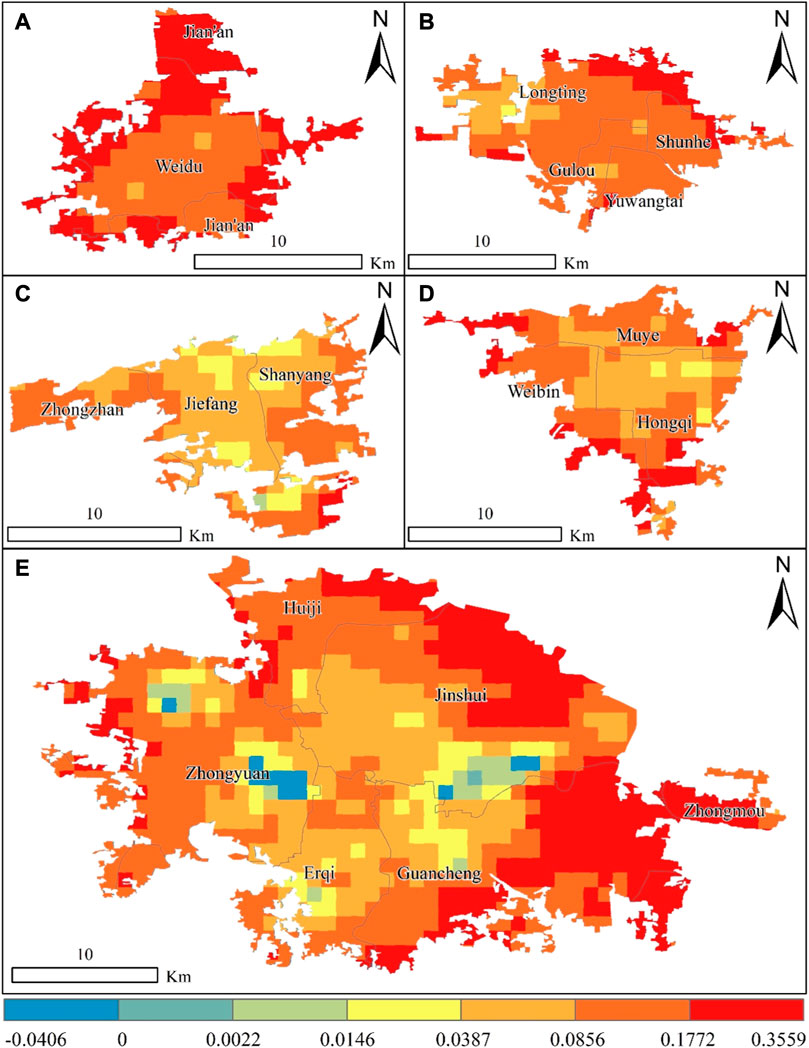
FIGURE A1. Spatial distribution of daytime surface temperature trends in different cities within the Zhengzhou metropolitan area.
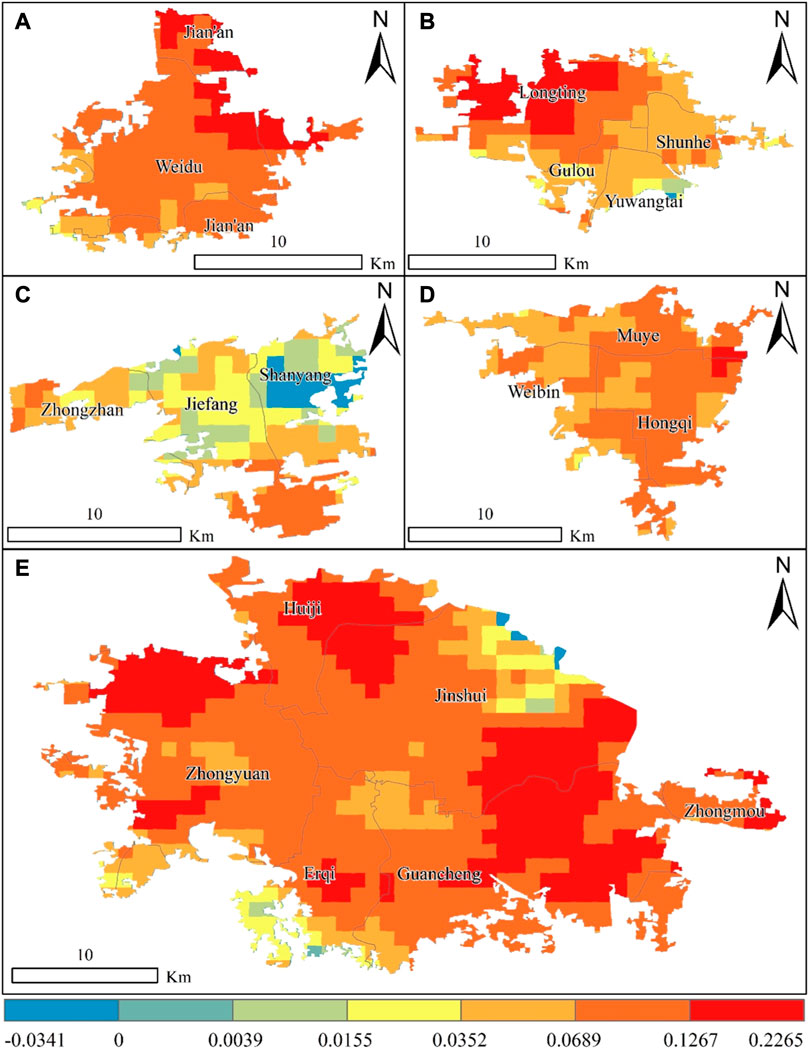
FIGURE A2. Spatial distribution of nighttime surface temperature trends in different cities within the Zhengzhou metropolitan area.
Keywords: urban heat island effect, surface heat island intensity, trend analysis, spatial disparities, GEE
Citation: Meng F, Yan S, Tian G and Wang Y (2023) Surface urban heat island effect and its spatiotemporal dynamics in metropolitan area: a case study in the Zhengzhou metropolitan area, China. Front. Environ. Sci. 11:1247046. doi: 10.3389/fenvs.2023.1247046
Received: 25 June 2023; Accepted: 14 August 2023;
Published: 25 August 2023.
Edited by:
Xiao Ouyang, Hunan University of Finance and Economics, ChinaReviewed by:
Wei Liao, Hunan University of Finance and Economics, ChinaCopyright © 2023 Meng, Yan, Tian and Wang. This is an open-access article distributed under the terms of the Creative Commons Attribution License (CC BY). The use, distribution or reproduction in other forums is permitted, provided the original author(s) and the copyright owner(s) are credited and that the original publication in this journal is cited, in accordance with accepted academic practice. No use, distribution or reproduction is permitted which does not comply with these terms.
*Correspondence: Guanghui Tian, dGlhbmd1YW5naHVpQHhjdS5lZHUuY24=
Disclaimer: All claims expressed in this article are solely those of the authors and do not necessarily represent those of their affiliated organizations, or those of the publisher, the editors and the reviewers. Any product that may be evaluated in this article or claim that may be made by its manufacturer is not guaranteed or endorsed by the publisher.
Research integrity at Frontiers
Learn more about the work of our research integrity team to safeguard the quality of each article we publish.