 Lin Wang
 Feng Pan2
94% of researchers rate our articles as excellent or good
Learn more about the work of our research integrity team to safeguard the quality of each article we publish.
Find out more
ORIGINAL RESEARCH article
Front. Environ. Sci. , 13 November 2023
Sec. Environmental Policy and Governance
Volume 11 - 2023 | https://doi.org/10.3389/fenvs.2023.1242971
This article is part of the Research Topic Carbon Emission Governance in the Evolution Process of Urban-Rural Interaction View all 5 articles
This study analyzes the changes and allocation characteristics of environmental governance attention in the Beijing–Tianjin–Hebei region based on the government work report from 2002 to 2020 and explores the compliance relationship between environmental governance attention and environmental quality. The results show that the allocation of local government environmental governance attention shows high consistency with that of the central government, and the overall environmental governance attention shows a fluctuating upward trend. There is a long-term stable co-integrated relationship between environmental governance attention and environmental quality in the Beijing–Tianjin–Hebei region, as well as a two-way Granger causality relationship in the short term. The non-linear influence of environmental governance attention on the environmental quality in the Beijing–Hebei–Tianjin region can be described using the LSTR2 model. During 2004–2016, environmental governance attention often had non-linear effects on the environmental quality. Since 2016, there has been a stable linear relationship between environmental governance attention and environmental quality. Finally, some policy suggestions on improving the local performance evaluation system and establishing a collaborative environment system for the Beijing–Tianjin–Hebei region have been put forward for the government.
The Beijing–Tianjin–Hebei region, located in the heart of the Bohai Rim in Northeast Asia, is the most dynamic and developed transportation network region in northern China. With the rapid economic and social development in the region, there has been an increasing number of industries, and environmental problems become increasingly prominent. Aside from the paucity of water resources caused by the geographical problem, the Beijing–Tianjin–Hebei region frequently experiences the hardest hit by smog. Zhang Gaoli, Vice-Premier of The State Council, has pointed out that combatting air pollution and repairing the ecological environment should be regarded as a breakthrough in the coordinated development of the Beijing–Tianjin–Hebei region. In 2003, the State Council issued implementation rules of the Action Plan for the Implementation of Air Pollution Prevention and Control in the Beijing–Tianjin–Hebei Region and its surrounding areas. At the same time, the Beijing–Tianjin–Hebei region government also adopted a series of environmental governance measures, including energy consumption reform and regional joint prevention and control of air pollution, which reflects the Beijing–Tianjin–Hebei region on environmental governance issues of high concern.
The environmental governance attention determines the direction of environmental governance, and the government work report is an important carrier of environmental governance attention. What is the level of environmental governance attention in the Beijing–Tianjin–Hebei region? What changes and allocation rules are presented? What is the compliance relationship between environmental governance attention and the environmental quality? The research and solution of these questions can provide a solid scientific basis for improving the environmental quality and promoting high-quality economic development in the Beijing–Tianjin–Hebei region.
Attention theory originated from psychology and has been gradually applied to management and organizational behavior. Attention is defined as “the process by which management agents selectively value some data over others” (Simon, 1997). Ocasio (1997) pointed out the scarcity of attention resources and emphasized that the nature of government decision-making behavior was different attention allocation, and the scientific basis of decision-making depended on the rational allocation of attention due to the limited rationality of decision-makers. Based on the attention theory of science and organizational behavior, Jones (2023) constructed the “attention-driven policy choice model,” and pointed out that the policy choice will change with attention, the key to choose lies in the judgment of important and unimportant information, and the content and key topics of the policy text can reflect the importance of the government to certain public affairs. At the same time, Bevan and Greene (2014) explored the data on the British Parliament in the past 65 years and discovered that the organization of political parties and the reflection of economic conditions influenced the government attention to the public policy agenda. In the area of attention allocation, Matejka and Mckay (2015) found that the allocation of decision-makers' attention determined the amount of information accessed. Wai and Kwan (2015) pointed out that the distribution of the government is light, and the degree of decentralization of government decision-making power will further affect the direction of action of the government. Flavin and Franko (2017) analyzed the allocation trend of government attention to citizen political rights using the bill documents of American state legislatures. Based on central government work reports from 1954 to 2013 and a classification of the strategic goals of fundamental public services for each time period, Wen (2014) used central government work reports from 1954 to 2013 as research data and measured the government attention to the area of basic public services while rationalizing the goals of each stage of central government public services.
The application of attention theory is extensive, including science and technology (Wang et al., 2018), sport and culture (Zheng and Ji, 2021), social security (Liu et al., 2021), environmental governance, and many other aspects. In the field of environmental governance attention research, Wang and Li (2017) analyzed the allocation of environmental governance attention after the reform and opening up using the government work reports of 30 provinces in China, and concluded that the improvement of environmental governance attention will increase the number of environmental policies. Based on the central government work reports since the reform and opening up, Wang and Tian (2021) discussed the internal change law of environmental governance attention in China and pointed out that the level of environmental governance attention has been increasing after the reform and opening up, which has also played a positive role in the improvement of environmental quality. Shen et al. (2020) studied the relationship between environmental governance attention and environmental governance performance based on panel data on the Beijing–Tianjin–Hebei region, and concluded that the enhancement of environmental governance attention is conducive to improving regional environmental governance performance, and the government subjective consciousness plays the greatest role in promoting environmental governance performance. Zhang investigated the relationship between local government environmental governance attention and environmental policy implementation, and pointed out that it is inverted U-shaped. Local government environmental governance attention improved the government understanding of ecological and environmental governance; however, under the pressure type system, if the environmental governance attention exceeded the government actual bearing capacity, the local government would face evasion of responsibility (Zhang, 2021). It is studied whether the government environmental governance attention has an effect on pollution that the improvement of the government environmental governance attention can restrain environmental pollution by empirical analysis (Huang et al., 2022).
Public environmental policy has received wide attention. OECD countries lead the way in terms of climate change awareness, with 91% of Europeans identifying climate change as an existential risk and 44% supporting stricter environmental regulations for industries, especially the energy sector (Sadik-Zada and Ferrari, 2020). Although the awareness of climate change risks and the importance of environmental regulations are also steadily increasing in the developing countries (Faure and Partain, 2019), there is still a large gap between developing countries and developed countries in terms of the Environmental Performance Index (EPI), financial capacity, and institutional capacity (Conrad and Cassar, 2018). In general, environmental regulations in developing countries remain relatively lax. As a developing country, if China does not formulate and implement more strict environmental policies, it may lead to the transfer of pollution-intensive industries, thus becoming a “pollution paradise” (PHH). Different types of environmental policies, such as emission standards, emission trading, and emission taxes, will produce different environmental benefits under different enterprise emission reduction costs (Xu and Tan, 2023), but the environmental policy plays an important role in income distribution, the clean technology transition, and carbon emission control (Sun et al., 2023). In the process of achieving carbon peak and carbon neutrality in China, energy-biased technological progress will play an important role, and the exogenous environmental policy impact is a key in affecting energy-biased technological progress (Dai and Zhang, 2023). The formulation and release of environmental policies reflect the changes and allocation of the government’s environmental governance attention, which will have an important impact on environmental quality.
By reviewing the existing research results, it can be found that the number of studies on environmental governance attention has increased year by year, involving the central government environmental governance, provincial environmental governance (Qin, 2020), marine environmental governance (Wang et al., 2019), and environmental information quality (Xu and Zhou, 2020). These studies are of great value in revealing the law of government environmental behavior and improving the effect of environmental governance. However, there are some drawbacks: first, previous studies mainly focus on the central government, while local government-level studies are relatively scarce. Second, previous studies focused on the measurement and trend analysis of the government environmental governance attention but lacked further effect evaluation. Finally, the only studies on the impact of environmental quality are mainly based on linear assumptions and lack of exploration of non-linear impacts. The contribution of this article is described as follows: first, the text analysis method is used to estimate the environmental governance attention in the Beijing–Tianjin–Hebei region, and objectively present its changes and allocation rules; second, the impact of environmental governance attention on environmental quality is analyzed and its actual effects are accurately assessed; and third, based on the linear model, the non-linear effects are further investigated, so as to put forward more operational policy recommendations.
On the premise of data continuity and completeness, 57 provincial and municipal government work reports were collected in the Beijing–Tianjin–Hebei region from 2002 to 2020, all of which were from the official websites of Beijing, Tianjin, and Hebei governments. The high-frequency word cloud map of government work reports in the Beijing–Tianjin–Hebei region clearly shows the allocation of government attention in various fields. Among them, “development” is the largest font and is mentioned most times, indicating that the Beijing–Tianjin–Hebei region government puts “development” in the first place in the government work. “Construction” is in the second place, followed by “economy,” “city,” “enterprise,” “culture,” and “industrial,” reflecting “construction” as an important topic. The government of the Beijing-Tianjin-Hebei region is working closely on the overall plan to promote coordinated and orderly social development on economic, political, cultural, social and ecological construction.
ROST CM6 software was used to count the top 10 environmental governance keywords, namely, environment, environmental protection, energy efficiency, sustainability, ecology, waste, green, pollution, energy, and consumption reduction. The keywords of environmental governance were coded according to the format of “node,” and the number and relative indicators of the keywords were counted. The same number of keywords in different lengths of text should show different levels of attention, while frequency statistics only focus on the number and ignore the text proportion. To this end, the keywords of each year were standardized, and the ratio of keywords to the total number of words in the full text was used to measure the environmental governance attention in the Beijing–Tianjin–Hebei region.
As shown in Figure 1, from 2002 to 2020, the level of environmental governance attention in the Beijing–Tianjin–Hebei region has fluctuated and increased, which reflected that decision makers gradually realized the importance of environmental issues and paid more attention to environmental governance year by year. In some specific periods, environmental governance attention has shown a small range of large changes. Media attention, central government strategy, and official attitude all influence local government attention, but abrupt changes were usually triggered by special events.
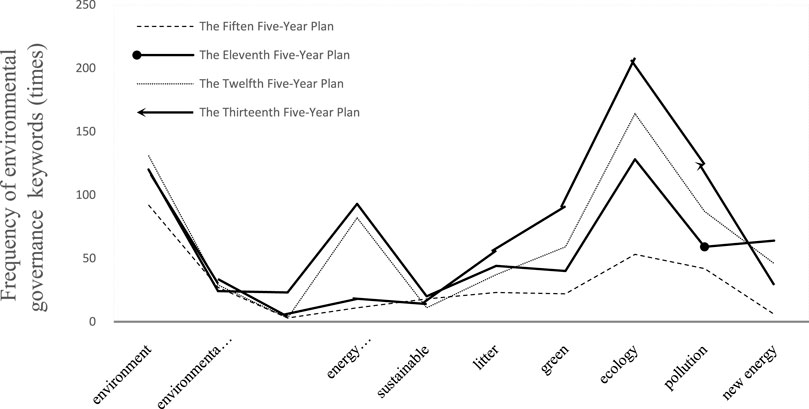
FIGURE 1. Frequency of environmental governance attention keywords in the Beijing–Tianjin–Hebei region during different periods of the Five-Year Plan.
In order to ensure good environmental quality during the 2008 Beijing Olympic Games, the Ministry of Environmental Protection implemented comprehensive ecological and environmental management in Beijing, Tianjin, Hebei, Shaanxi, Inner Mongolia, and Shandong provinces, and the Beijing–Tianjin–Hebei region government increased its environmental governance attention. After the Olympic Games, the Beijing–Tianjin–Hebei region government gradually paid less attention to environmental governance. In addition, affected by the US financial crisis, China economic growth slowed down, and the central and local governments quickly adjusted their attention to economic construction. Therefore, the Beijing–Tianjin–Hebei region government paid less attention to environmental governance in 2009. In 2014, the Beijing–Tianjin–Hebei coordinated development strategy was elevated to the national strategy; at the same time, the state issued the “Ten Atmospheric Measures,” which proposed the establishment of a regional air pollution joint prevention and control mechanism, and the Beijing–Tianjin–Hebei region government took different counter measures. The Beijing Municipal Government focused on air pollution from coal burning, industry, motor vehicles, and dust, and implemented measures to convert coal into electricity and gas, and strictly inspect vehicles with excessive emissions to improve air quality. The Hebei Provincial Government further adjusted the energy structure, optimized the industrial layout, and focused on preventing and controlling the emission of sulfur dioxide, nitrogen oxide, and other pollutants to control the spread of air pollution. In the 12th Five-Year Plan for air pollution prevention and control, the Tianjin Municipal Government proposed strict control of coal burning pollution, intensified efforts to control dust pollution, and promoted clean energy utilization. Accordingly, the Beijing–Tianjin–Hebei region environmental governance attention has increased significantly. In 2016, as the first year of the 13th Five-Year Plan, the central government advocated the development concept of “innovative, coordinated, green, open, and shared,” the Beijing–Tianjin–Hebei region government issued “Intensive Measures for Air Pollution (2016–2017)” to solve the hot and difficult problems of air pollution in Beijing and its surrounding areas, and the level of environmental governance attention in the Beijing–Tianjin–Hebei region has increased significantly again.
(1) The overall number of environmental governance attention keywords in the Beijing–Tianjin–Hebei region from 2002 to 2020 shows the increasing trend (Figure 2). During the Tenth Five-Year Plan period, although the central government put forward the basic national policy of environmental protection, the government of the Beijing-Tianjin-Hebei region also focuses on the environmental field in a relatively simple way under the influence of the development strategy centered on economic construction. During the 11th Five-Year Plan period, the central government proposed to build a “resource-saving and environment-friendly” society, and resource conservation and environmental friendliness is reflected in the government work report of the Beijing-Tianjin-Hebei region. Although more attention has been paid to energy conservation and new energy, it can be found that the Beijing–Tianjin–Hebei regional government work reports show that the depth of attention is insufficient and only stays at the theoretical level. During the 12th Five-Year Plan period, the Beijing–Tianjin–Hebei region government took into account local conditions to tackle air and water pollution, and green ecology. The keywords of environmental governance in the government work reports have changed significantly, among which air pollution control, rural water resource management, emission reduction, consumption reduction, and forest green space construction have become the keywords with increasing frequency, and ecological environment governance has gradually transformed from concept to concrete measures and actions. During the 13th Five-Year Plan, the central government put forward the concept of “innovative, coordinated, green, open, and shared” development, and the Beijing–Tianjin–Hebei region government thoroughly implemented the guiding principles of Xi Jinping’s series of important speeches, made all-out efforts to build a new pattern of green development, carried out the “Blue Sky” campaign, and pushed the battle against pollution and waste classification.
(2) The allocation of environmental governance attention in the Beijing–Tianjin–Hebei region is consistent with that of the central government. The central government formulated and issued policy directives, which are implemented by local governments at all levels, and the central government programmatic policy documents served as the baton for local government attention. In 2006, the central government proposed to build a “resource-saving and environment-friendly” society, followed by water and electricity conservation, and other related discussions in the Beijing–Tianjin–Hebei region government work report. In addition, there was another case for consistency of attention. The Beijing–Tianjin–Hebei region government work reports were generally released before the central government work report during the local “two sessions,” attention following turns to attention leading or the central government and local government resonated on the same issue. For example, in 2008, the central government and the Beijing and Tianjin regional governments jointly paid attention to the “source of sandstorms,” and in 2013, the Tianjin Municipal Government and the central government jointly paid attention to the “Marine environmental governance” issue. There was commonality in finding and solving environmental problems between the central and local areas, but the order of mutual reference was not strict.
(3) Compared with the economic development attention, as shown in Figure 3, the allocation of environmental governance attention in the Beijing––Tianjin–Hebei region is increasing. Under the new normal situation of economic development, the local government often bears the double pressure of economic growth and environmental protection. In total, 10 keywords of economic development were selected: economy, finance, gross product, income, investment, finance, trade, import and export, financing, and capital; through comparative analysis, the distribution characteristics and allocation rules of environmental governance attention in the Beijing–Tianjin–Hebei region were presented more comprehensively. The word frequency of environmental governance keywords in the Beijing–Tianjin–Hebei region government work report increased from 68 in 2002 to 131 in 2020, and the word frequency of economic development keywords decreased from 269 in 2002 to 170 in 2020. Although the total number of words for economic development was significantly greater than that for environmental governance, the relative trend showed that the proportion of environmental governance in the Beijing–Tianjin–Hebei region was increasing year by year, and the construction of ecological civilization and environmental protection was becoming increasingly important in public decision-making and political behavior of government officials.
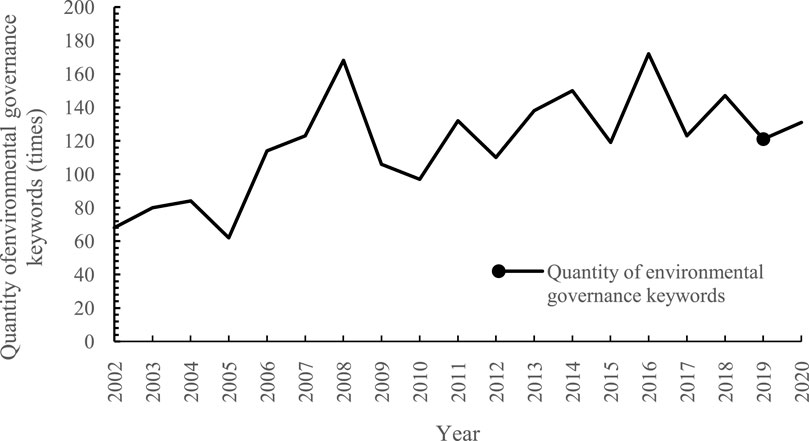
FIGURE 2. Diagram of the total frequency trend of environmental governance keywords in the Beijing–Tianjin–Hebei region from 2002 to 2020.
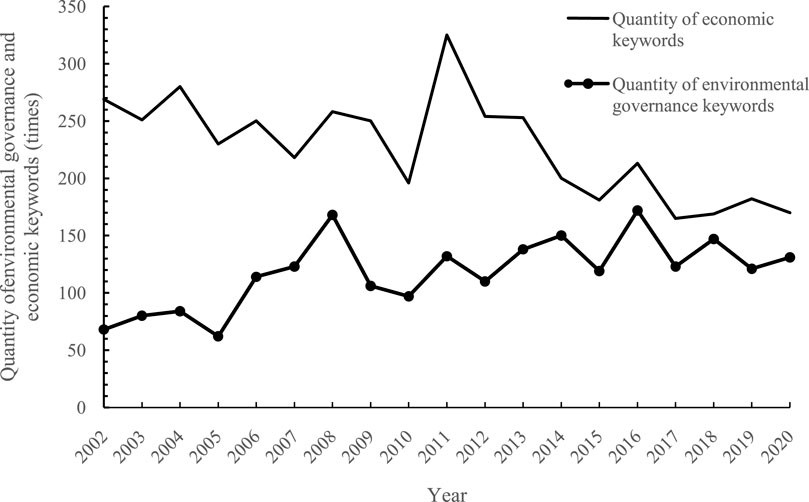
FIGURE 3. Quantity comparison of economic and environmental governance keywords in the Beijing–Tianjin–Hebei region.
In order to investigate the actual effect of environmental governance attention in the Beijing–Tianjin–Hebei region, the STR model is constructed to analyze the compliance relationship between environmental governance attention and the environmental quality.
(1) In the Beijing–Tianjin–Hebei region, environmental governance attention is selected as the independent variable. Using the Beijing–Tianjin–Hebei region government work reports from 2002 to 2020 as the text, NVivo12 software is used to encode statistics to obtain the time series of environmental governance attention
(2) Environmental quality is selected as the dependent variable.
The proxy variable is
In the subsequent phase, Eq. 2 is used to calculate the ratio of indicator values for year i on the jth evaluation indicator
In the third step, the entropy value of the jth indicator is calculated according to Eq. 3
In the fourth step, the coefficient of variability for indicator j is calculated according to Eq. 4
In the fifth step, the weight of each indicator is calculated according to Eq. 5
Finally, the linear weighting method was used to calculate the comprehensive index of emissions in the Beijing–Tianjin–Hebei region for the period 2002–2020.
(3) Research assumptions and limitations.
If the government of the Beijing–Tianjin–Hebei region pays more attention to environmental governance, it will pay more attention to the polluters and enhance the binding force on the polluters within its jurisdiction in order to implement the government’s policy intentions through various policy means such as supervision and punishment. Under the constraints of environmental control, enterprises will change their production methods, increase environmental protection investment, strengthen pollution control efforts, and ultimately reduce pollution emissions. Therefore, it can be hypothesized that the environmental governance attention of the government in the Beijing–Tianjin–Hebei region can affect the environmental quality in the area under its jurisdiction.
In addition, considering the continuity and instability of environmental protection policies, the government’s attention to environmental governance in the Beijing–Tianjin–Hebei region will also show fluctuations. Under the limitation of policy transmission resources and objective environment, the improvement effect of the environmental quality may not be completely synchronized with the change in the government’s attention to environmental governance, thus presenting a more complex impact. Therefore, it can be hypothesized that the environmental governance attention of the government in the Beijing–Tianjin–Hebei region has non-linear characteristics on the environmental quality within its jurisdiction.
The Beijing–Tianjin–Hebei region is experiencing rapid economic and social development with a large number of industrial clusters and a highly concentrated population. As a result, environmental protection policies and environmental quality in this region are highly representative due to geographical factors. Therefore, the results of this study can provide theoretical and policy reference for the limited areas that are also polluted by the rapid industrialization process around the world.
The autoregressive distributed lag (ARDL) model is a widely used statistical model for environmental, meteorological, and economic fields. By introducing the lag term into the autoregressive equation, the dynamic relationship between the dependent variable and the lag term is fitted. ARDL is able to explore the effect of time on the dependent variable and the change effects of the independent variable on the dependent variable over time. ARDL can also flexibly fit non-linear relationships, seasonal variations, and dynamic trends. In addition, technically, non-linear ARDL does not require variables of the same order to be integral, allowing it to test long-term relationships between variables of relatively short time series. Considering the impact of environmental governance attention on the environmental quality, there is an objective lag to explore the possible long-term relationship between the government’s environmental governance attention and environmental quality in the Beijing–Tianjin–Hebei region. The purpose of this paper is to analyze the impact of the passage of time on the environmental quality and the change of environmental governance attention on the environmental quality over time. Therefore, it is finally decided to choose the ARDL method to carry out the research based on the aforementioned considerations.
In order to avoid the influence of heteroscedasticity, natural logarithms are processed for sequences
When using non-stationary series for regression, it will cause false regression, and the STR model requires the sequence to be stationary, so the stationarity of time series is tested. As shown in Table 1, the null hypothesis that unit roots exist in
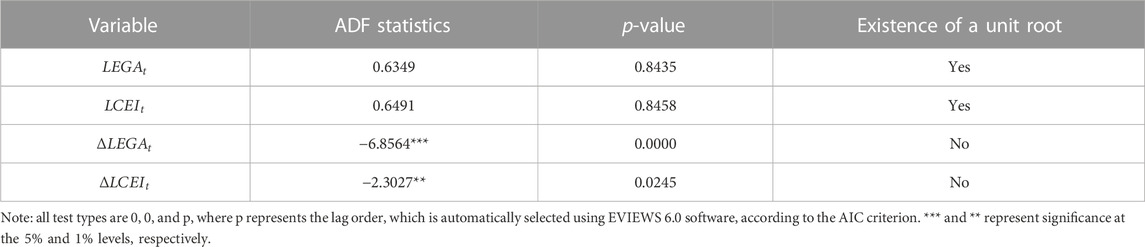
TABLE 1. ADF test results.
The Johansen co-integration test is used to test the co-integration of
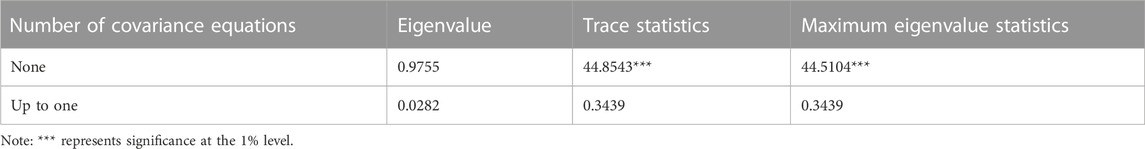
TABLE 2. Co-integration test results.
The variables have Granger causality in at least one direction if there is a cointegration relationship between them. As seen in Table 3, the test rejects both the hypothesis that
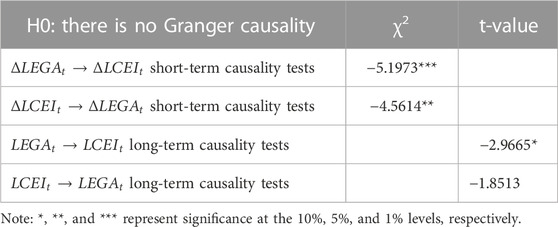
TABLE 3. Granger causality test results.
The STR model has the following general form:
where
According to the form of the conversion function
Then, the aforementioned model is called the STR model. In such models, the transition function
In the LSTR model, a different non-monotonic class conversion function is expressed as follows:
The numerical value of this conversion function
If the conversion function
then this kind of STR model is known as an ESTR model. The ESTR model is the same as the LSTR1 model, where both models take point
where
(1) The model lag order must be established. Teräsvirta proposed that the specific structure of the linear part in STR model can be determined according to the VAR framework. Firstly, the lag order of
(2) Model selection and non-linearity test. The transformation function
where
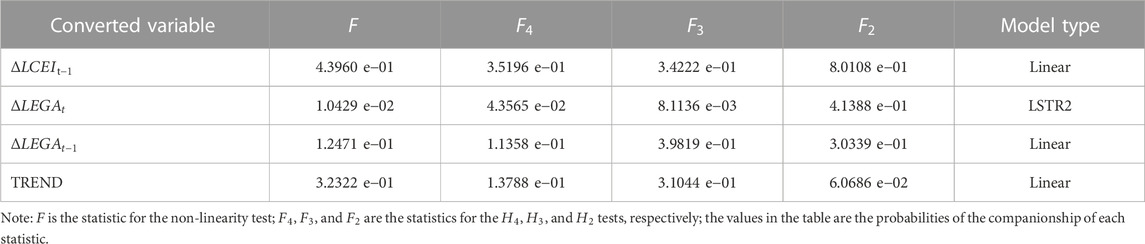
TABLE 4. Results of the non-linearity test and selection of the transformation function.
The results in Table 4 show that the linearity hypothesis is only rejected at the 5% significance level, when
(3) The initial values of the smoothing and location parameters are determined. After determining the form of the transformation variables and the transformation function, the initial values of the smoothing and location parameters in the transformation function need to be determined using the two-dimensional grid point search method. This is performed by selecting different
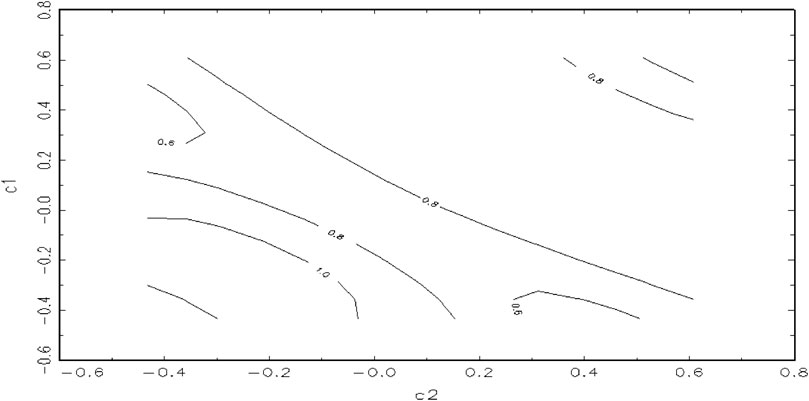
FIGURE 4. Contour map for the grid point search.
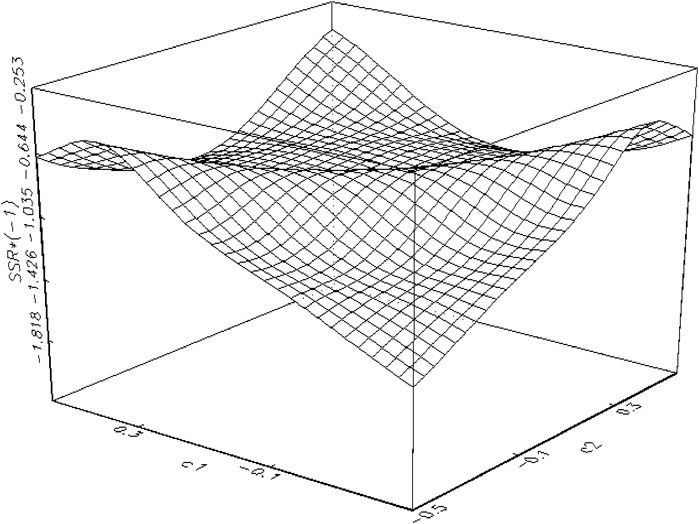
FIGURE 5. Plan view for the grid point search.
(4) Modeling parameter estimation. After obtaining the initial values of
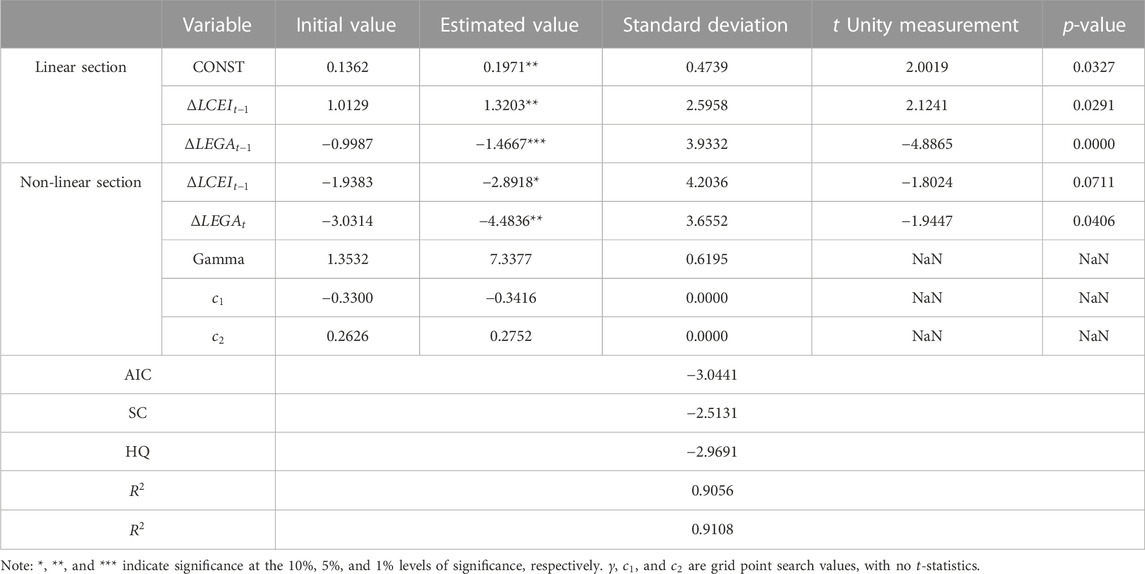
TABLE 5. LSTR2 model estimation results.
Based on the parameter estimation results, the specific form of the LSTR2 model is obtained as follows:
The main diagnostic statistics corresponding to the model are as follows: ARCH-LM = 1.0144 (
In the linear part of the LSTR2 model,
The non-linear part of the LSTR2 model contained two parts: the conversion function and the regression term. The critical value in the conversion functions
As shown in Figure 6, the impact of the environmental governance attention on the environmental quality in the Beijing–Tianjin–Hebei region alternated between linear and non-linear during 2004–2020. During 2004–2016, the transformation variable
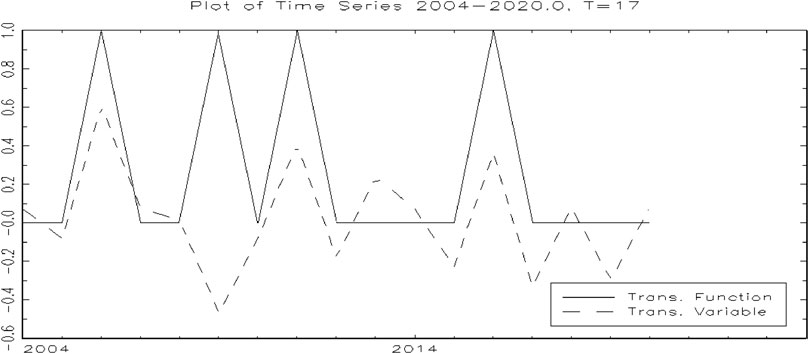
FIGURE 6. Conversion function graph.
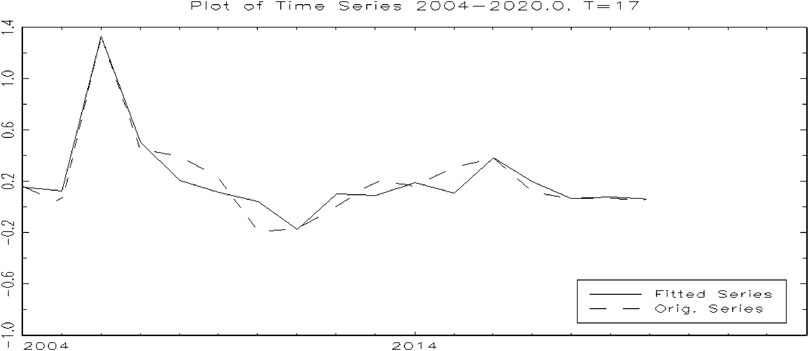
FIGURE 7.
The economic development and environmental protection in the Beijing–Tianjin–Hebei region of China is very typical; however, there is lack of research studies on the government’s attention on environmental governance in these regions. This study measured the levels of environmental governance attention of the governments in the Beijing–Tianjin–Hebei region, and objectively presented the changes and allocations of environmental governance attention. On this basis, the linear and non-linear effects of environmental governance attention on environmental quality were investigated, thus filling the gap of the lack of impact assessment analysis in the study of environmental governance attention.
Based on the Beijing–Tianjin–Hebei region government work report from 2002 to 2020, the environmental governance attention of the Beijing–Tianjin–Hebei region is measured, its changes and allocation rules are analyzed, and the compliance relationship between environmental governance attention and environmental quality is explored.
(1) According to the study, the level of environmental governance attention in the Beijing–Tianjin–Hebei region shows an overall trend of fluctuation and rise, while in some specific periods, there has been a small range of large changes.
(2) The scope of environmental governance in the Beijing–Tianjin–Hebei region is expanding; the allocation of attention is consistent with that of the central government; compared with economic development attention, the allocation of environmental governance attention is increasing.
(3) Under the linear assumption, there is a long-term stable co-integration relationship between environmental governance attention and environmental quality in the Beijing-Tianjin-Hebei region. In the short term, there is a two-way Granger causality relationship between environmental governance attention and environmental quality in the Beijing–Tianjin–Hebei region. In the long term, there is only a one-way Granger causality relationship between environmental governance attention and environmental quality in the Beijing–Tianjin–Hebei region. Under the non-linear assumption, the impact of environmental governance attention on environmental quality in the Beijing–Tianjin–Hebei region presents a more complex non-linear transformation dynamic. From 2004 to 2016, the conversion variables exceeded the threshold for many times, and the environmental governance attention in the Beijing–Tianjin–Hebei region frequently showed a non-linear effect on environmental quality and reflected the “immediate effect,” “unsustainable,” and “bottoming out” characteristics of pollution control. From 2016 to now, the Beijing–Tianjin–Hebei region has maintained a stable linear relationship between environmental governance attention and environmental quality. The environmental governance attention in the previous period will affect the environmental quality, while the environmental governance attention in the current period will not affect the environmental quality.
Based on the findings, possible policy recommendations include the following:
(1) There are differences on economic, social, and cultural conditions in different regions of the Beijing–Tianjin–Hebei region. If the governments of the Beijing–Tianjin–Hebei region are completely consistent with the central government in the allocation of attention, the unified environmental policy may not be able to adapt to the differences in different regions, resulting in a poor environmental governance effect. Therefore, the allocation of environmental governance attention of the government in the Beijing–Tianjin–Hebei region should be flexible to meet the actual needs of different regions.
(2) There is a long-term and stable co-integration relationship between environmental governance attention and environmental quality in the Beijing–Tianjin–Hebei region. Therefore, we should continue to improve the level of environmental governance attention of the government in the Beijing–Tianjin–Hebei region in the long run to ensure the overall level of environmental quality in the Beijing–Tianjin–Hebei region.
(3) If the environmental governance attention level of the governments in the Beijing–Tianjin–Hebei region is not stable, it will cause large fluctuations in the environmental quality level. This reflects that the fluctuation of the environmental policy will make it difficult for the policy object to adapt, which will have a negative impact on the policy effect. Therefore, stability should be maintained in the formulation and implementation of environmental policies so as to steadily improve the effect of environmental governance.
(4) The environmental governance attention of the governments in the Beijing–Tianjin–Hebei region has a lag effect on the environmental quality. Therefore, a long-term mechanism of the environmental policy system should be established, improving the local performance assessment system and the ranking of environmental governance in various public affairs of the government, establishing a coordinated environmental system for the Beijing–Tianjin–Hebei region, and establishing a multi-body participation mechanism for environmental governance.
The original contributions presented in the study are included in the article/Supplementary Material, further inquiries can be directed to the corresponding author.
LW and FP contributed to the conception and design of the study. XL organized the database and wrote the first draft of the manuscript. LW and FP wrote sections of the manuscript and revised the manuscript. All authors contributed to the article and approved the submitted version.
The authors are grateful to the financial support provided by the Humanities and Social Science Project of Ministry of Education of China (22YJC630138).
The authors declare that the research was conducted in the absence of any commercial or financial relationships that could be construed as a potential conflict of interest.
All claims expressed in this article are solely those of the authors and do not necessarily represent those of their affiliated organizations, or those of the publisher, the editors, and the reviewers. Any product that may be evaluated in this article, or claim that may be made by its manufacturer, is not guaranteed or endorsed by the publisher.
Bevan, S., and Greene, Z. (2014). Looking for the party? The effects of partisan change on issue attention in UK Acts of Parliament. Eur. Political Sci. Rev. 8 (1), 49–72. doi:10.1017/s175577391400040x
Conrad, E., and Cassar, L. F. (2018). The environmental performance index. Routledge handbook of sustainability indicators. Abingdon, UK: Routledge, 294–307.
Dai, Y. A., and Zhang, X. (2023). Spatial spillover of environmental policy and urban energy-directed technological change. J. World Econ. 46 (5), 119–151. doi:10.19985/j.cnki.cassjwe.2023.05.005
Faure, M. G., and Partain, R. A. (2019). The role of environmental law in developing countries. Cambridge, UK: Cambridge University Press, 292–314.
Flavin, P., and Franko, W. W. (2017). Government's unequal attentiveness to citizens' political priorities. Policy Stud. J. 45 (4), 659–687. doi:10.1111/psj.12184
Huang, S., Ding, Y., and Filler, P. (2022). Does the government's environmental attention affect ambient pollution? Empirical research on Chinese cities. Sustainability 14 (6), 3242. doi:10.3390/su14063242
Jones, B. (2023). Rethinking Decision-making in democracy: attention, choice, and public policy. Beijing: Beijing University Press. translated by DY Li.
Liu, Y. N., Tan, X. T., and Li, Y. L. (2021). The Chinese government's program, evolution and strategic reflection in promoting the construction of the aging career and pension system-a study based on attention allocation. J. Party Sch. Fujian Prov. Comm. Communist Party China (Fujian Adm. Coll. (2), 99–109. doi:10.15993/j.cnki.cn35-1198/c.2021.02.010
Matejka, F., and Mckay, A. (2015). Rational inattention to discrete choices: a new foundation for the multinomial logit model. Am. Econ. Rev. 105 (1), 272–298. doi:10.1257/aer.20130047
Ocasio, W. (1997). Towards an attention based view of the firm. Strategic Manag. J. 18 (S1), 187–206. doi:10.1002/(sici)1097-0266(199707)18:1+<187::aid-smj936>3.3.co;2-b
Qin, H. (2020). Attention allocation in local government environmental governance - an Nvivo analysis based on 20 provincial ecological and environmental protection policies. Environ. Prot. Circular Econ. 40 (8), 77–84.
Sadik-Zada, R. E., and Ferrari, M. (2020). Environmental policy stringency, technical progress and pollution haven hypothesis. Sustainability 12 (9), 3880. doi:10.3390/su12093880
Shen, W. N., Chai, Z. Y., and Zhang, H. M. (2020). Heterogeneous ecological attention and environmental governance performance-based on Beijing-Tianjin-Hebei "Government Work Report Perspective. Soft Sci. 34 (9), 65–71. doi:10.13956/j.ss.1001-8409.2020.09.10
Simon, H. A. (1997). Administrative behavior: a study of decision making processes in administrative organization. New York: Free Press, 124.
Sun, W., Xia, H. L., Zha, X., Sun, G., and Wang, Y. (2023). Triple microenvironment modulation of zeolite imidazolate framework (ZIF) nanocages for boosting dopamine electrocatalysis. J. Quantitative Technol. Econ. 654, 1–12. doi:10.1016/j.jcis.2023.10.022
Wai, F. L., and Kwan, N. C. (2015). How authoritarianism intensifies punctuated equilibrium: the dynamics of policy attention in Hong Kong. Governance 28 (4), 549–570. doi:10.1111/gove.12127
Wang, C. J., Xu, Z., and Chen, C. Y. (2018). Allocation of government attention to basic research in the process of science and technology system reform-a discourse analysis based on the central government work report (1985-2018). Sci. Technol. Manag. 39 (12), 54–66.
Wang, G., Mao, Y., Yan, S., and Xu, B. (2019). Changing attention to marine environmental governance: an analysis based on policy content and social networks. J. Ocean Univ. China (Social Sci. Ed. 10 (01), 29–37. doi:10.3389/fpls.2019.00029
Wang, Q., and Tian, Y. Y. (2021). The changing attention to environmental governance of the Chinese government - a textual analysis based on the State Council's Report on the Work of the Government (1978-2021). J. Fujian Normal Univ. (Philosophy Soc. Sci. Ed. (04), 74–171.
Wang, Y. H., and Li, M. Z. (2017). A study of local governments' attention to ecological and environmental governance-an analysis of the text based on the work reports of 30 provincial and municipal governments (2006-2015). China Population-Resources Environ. 27 (02), 28–35.
Wen, H. (2014). Measuring the attention of the Chinese government in promoting basic public services-a textual analysis based on the central government work reports (1954-2013). J. Soc. Sci. Jilin Univ. 54 (2), 20–26 +171. doi:10.15939/j.jujsse.2014.02.012
Xu, H., and Tan, D. Q. (2023). Analysis of government and enterprise pollution control and optimal environmental policy based on differential game. Operations Res. Manag. Sci. 32 (7), 107–112.
Xu, Y. Q., and Zhou, Z. R. (2020). A study on attention to the quality of environmental information of China's government -based on policy text analysis. Inn. Mong. Soc. Sci. 41 (04), 33–39. doi:10.14137/j.cnki.issn1003-5281.2020.04.005
Zhang, K. X. (2021). A study on the inverted U-shaped relationship between local government attention and environmental policy implementation. Public Manag. Rev. Thesis 3 (4), 132–161.
Keywords: environmental governance attention, environmental quality, compliance relationship, public environmental policy, allocation patterns
Citation: Wang L, Pan F and Li X (2023) Compliance relationship analysis between environmental governance attention and environmental quality in the Beijing–Tianjin–Hebei region. Front. Environ. Sci. 11:1242971. doi: 10.3389/fenvs.2023.1242971
Received: 20 June 2023; Accepted: 16 October 2023;
Published: 13 November 2023.
Edited by:
Dong Zhao, Michigan State University, United StatesReviewed by:
Maham Furqan, Oregon State University, United StatesCopyright © 2023 Wang, Pan and Li. This is an open-access article distributed under the terms of the Creative Commons Attribution License (CC BY). The use, distribution or reproduction in other forums is permitted, provided the original author(s) and the copyright owner(s) are credited and that the original publication in this journal is cited, in accordance with accepted academic practice. No use, distribution or reproduction is permitted which does not comply with these terms.
*Correspondence: Lin Wang, d2FuZ2xpbjJAZGx1LmVkdS5jbg==
Disclaimer: All claims expressed in this article are solely those of the authors and do not necessarily represent those of their affiliated organizations, or those of the publisher, the editors and the reviewers. Any product that may be evaluated in this article or claim that may be made by its manufacturer is not guaranteed or endorsed by the publisher.
Research integrity at Frontiers
Learn more about the work of our research integrity team to safeguard the quality of each article we publish.