
95% of researchers rate our articles as excellent or good
Learn more about the work of our research integrity team to safeguard the quality of each article we publish.
Find out more
ORIGINAL RESEARCH article
Front. Environ. Sci. , 23 October 2023
Sec. Land Use Dynamics
Volume 11 - 2023 | https://doi.org/10.3389/fenvs.2023.1241781
This article is part of the Research Topic Realization of Ecological Product Value, Land Use Change and Environment View all 11 articles
 Shuo Yang
 Xiaozheng Zheng*
Changes in land use restructuring significantly impact carbon emissions and the provision of ecosystem service value (ESV). This study focuses on the Guanzhong Plain Urban Agglomeration, and accounts for carbon emissions and ecosystem service values caused by land use in the years 2000, 2005, 2010, 2015, and 2020. Carbon sources, carbon sinks, net carbon emission intensity, and ESV intensity were introduced as research variables and the spatial and temporal divergence and correlation patterns between them were examined. The results show that: 1) The carbon emission intensity of land use in the Guanzhong Plain Urban Agglomeration has increased significantly over the study period, showing a distribution pattern of high intensity in the centra regions and low intensity in the surrounding regions. Construction land was identified as the largest carbon source. 2) The overall ESV follows an increasing trend, with the total value increasing from 215,263.7 million to 216,776.2 million. The distribution of ESV intensity is low in the central regions and high in the surrounding regions, and significant changes were observed in the ESV loss and gain intensity of farmland and water body. 3) Carbon emissions and ESV show a significant negative spatial correlation, and both are dominated by low-high and high-low aggregation patterns. A spatial spillover effect of carbon emissions on ESV was observed. Through the correlation analysis of carbon emissions and ESV, theoretical support is provided for promoting regional low-carbon green development and eco-economic synergistic development.
Ecosystems provide nearly all the elements of human wellbeing in the natural resource domain as well as ecological goods and services through a variety of ecological processes, which are typically distinguished by the ecosystem service value (ESV); therefore, humans have come to rely on ecosystems as the service providers that enable a high quality of life (Leemans and De Groot, 2003). In addition to accelerated urbanization and economic construction achievements, China’s energy consumption, water use, land use, and other demands have also increased. This has displaced agricultural land and other ecological land, has increased the scarcity of resources, and has splintered the overall continuous natural ecological landscape. Resulting ecological issues are the heat island effect and greenhouse effect, which in turn affect the carbon cycle and carbon emissions, which impede the beneficial effects of ecosystems and ultimately reduce China’s ability to maintain a healthy environment. China’s sustainable development is threatened by low ecological carrying capacity, which seriously challenges the development of regional ecological security.
The use of land resources, which carry different ecosystems, changes the ability of ecosystems to deliver services. Land use change is one of the most direct drivers of the carbon cycle in terrestrial ecosystems and a significant contributor to changes in ecosystem services. Urban agglomerations are a major source of power and growth centers in China’s urbanization process. At the same time, construction land is the most important place for fossil fuel use, thus identifying the combustion of fossil fuels and carbon emissions in urban agglomerations as the two main sources of carbon emissions that exert an immediate impact on the function of the regional ecosystem services. China’s carbon emissions are far higher than those of other countries due to the constraints imposed by such factors as the extensive economic growth mode, irrational energy utilization structure, low energy development technology, low level of energy equipment management, and pressure from population growth. These pressures intensify because of the gradually increasing intensity of land development and utilization in local areas. China has produced the greatest global total carbon emissions in recent years, and its emissions are still increasing. In September 2020, at the United Nations General Assembly, President Xi Jinping stated that “China will increase its autonomous national contribution, adopt stronger policies and measures, strive to peak CO2 emissions by 2030, and work towards achieving carbon neutrality by 2060” (Xi, 2020). To promote the integrated high-quality development and synergistic management of both regional economies and ecological environments in urban aggregations, it is important to examine the spatial relationship between ESV and land carbon emissions under land use change.
On the one hand, since the 1990s, Chinese as well as international research on carbon emissions has been growing. Total emissions have been measured at various geographic scales, including national, provincial, municipal, and regional scales; moreover, multiple perspectives have been discussed, including carbon intensity, risk, efficiency, the regional carbon cycle, the relationship between energy consumption and carbon emissions, the decoupling effect of carbon emissions and economic growth, influences, and the regional carbon cycle (Larsen et al., 2011; Forman, 2015; Zhao et al., 2018; Li et al., 2019; Yang et al., 2022a). On the other hand, research on ESV has been gradually deepened by Xie et al. and Wang et al. in response to research of academics like Constanza et al. and the United Nations Millennium Ecological Assessment Program on the assessment of ecosystems and ecological wellbeing (Costanza et al., 1997; Xie et al., 2003; Li et al., 2013; Leemans and De Groot, 2003; Scholte et al., 2015; Wang et al., 2014). For national, provincial, municipal, district (county), watershed, and numerous ecological types, the accounting of ESV is conducted from the perspectives of service supply-demand balance relationship, the relationship between ecological environment and economy and society, and ecological spatial distribution (Davidson et al., 2019; Xue et al., 2022; Liu et al., 2023a; Liu et al., 2023b). The development of urban agglomerations, in particular, has altered natural ecosystems into ecosystems that are human-dominated and human-nature coupled. This has become the main factor that drives changes in ecosystem services in urban agglomeration destinations. The mechanisms of interaction between ecological compensation policies, standards, and wellbeing can be uncovered by studying the functions and values of ecosystems as well as the ecological footprint and ecological carrying capacity (Chen et al., 2017; Cai et al., 2021; Ouyang et al., 2021; Zhang et al., 2022a; Yang and Su, 2022; Pan et al., 2023). Reducing carbon emissions is an indispensable condition for realizing the goal of “carbon peaking and carbon neutrality”, and is one of the most important ways to consolidate and enhance the protection of ecosystems. Terrestrial ecosystems also play an important role in the process of carbon neutralization. Taken together, there are two aspects of existing research that could be improved. The first is reflected in the lack of analysis of theoretical issues. Most studies discuss methods and processes for accounting for carbon emissions and ESV. Based on the changes in urban socio-economic activities carried by the land, the land-use structure is adjusted and redistributed, affecting the total amount of carbon emissions, which in turn changes the functions and values affecting the ecosystem provision. There is a relative lack of analysis and organization of this theoretical issue. The second shortcoming is mainly in the specific research process. Few quantitative examinations of the intensity of carbon emissions have been based on geographic information system method and land use data, and most research has employed yearbook data to evaluate carbon emissions. Studies on urban agglomerations in less developed areas of western China, especially those that include ecologically complex and fragile areas, are rare compared to studies on developed regions or traditional administrative boundaries. Most studies have merely considered carbon emissions or ESV alone, with fewer studies linking the two and analyzing their spatial aggregation. Using this information as a foundation, this paper analyzes the theoretical issue of carbon emissions affecting ESV. In this paper, based on land use, carbon emissions and ESV are assessed at two scales (administrative division and grid method under geographic information system data), and the relationship between their spatial aggregation is also examined. The spatial differentiation and problems of the carbon emissions and ESV are discussed and estimated to provide the support and references needed to optimize the ecological security pattern, alleviate the contradiction between regional economic development and ecological protection, and promote regional synergistic development.
The Guanzhong Plain Urban Agglomeration (GPUA) is the only urban agglomeration in the national plan that is clearly strategically positioned as an inland ecological civilization construction pioneer area. This area is of great significance for urban integration, economic and social development, as well as for the construction of an ecological security barrier in northwest China. It also has significant academic value. The GPUA is located in the inland area of northwest China, an area with a fragile ecological background. As a consequence of the ongoing expansion of urban construction land, the GPUA will predictably expand from the Guanzhong Plain to numerous complex natural ecosystem source areas such as the Qinba Mountains, loess hills, and gullies. As a result, the intensity of land use, carbon emissions, and the deterioration of the ecological environment will increase. The scientific question to be addressed in this study is how carbon emissions and ESV can contribute to the realization of ecologically and economically synergistic sustainable development in ecologically fragile areas under the background of “carbon peak and carbon neutrality”. Specific questions include: 1) What are the spatial differentiation characteristics and change trends of land use restructuring and carbon emission and ESV respectively? 2) What is the spatial and temporal clustering relationship between carbon emission intensity and ESV intensity?
The Guanzhong Plain Urban Agglomeration (104°34′–112°34′E, 33°34′–36°56′N), centered around Xi’an, is located in the inland area of northwest China and is the second largest urban agglomeration in western China. This urban agglomeration covers an area of 107,000 km2 and belongs to the warm temperate continental monsoon climate zone, bordered by the Qinling Mountains in the south and the Yellow River in the east, situated between the Qinba Mountains and the Loess Plateau. In 2020, the GPUA had a resident population of 38.87 million and a regional GDP of CNY 2.2 trillion.
The Guanzhong Plain Urban Agglomeration Development Plan officially delineated the planning area of the GPUA. This area includes Xi’an, Baoji, Xianyang, Tongchuan, Weinan, and Shangluo City (Shangzhou District, Luonan County, Danfeng County, and Zhashui County) in Shaanxi Province; Yuncheng City (except Pinglu County and Quanqu County) and Linfen City (Yaodu District, Houma City, Xianfen County, Huozhou City, Quwo County, Yicheng County, Hongdong County, and Fushan County) in Shanxi Province; as well as Tianshui City and Pingliang City (Kongdong District, Huating County, Jingchuan County, Chongxin County, and Lingtai County) and downtown Qingyang (Xifeng District) in Gansu Province. Because of data availability, this study uses the municipal area as the boundary, including the city-wide areas of Shangluo, Yuncheng, Linfen, Pingliang, and Qingyang. The study area is shown in Figure 1.
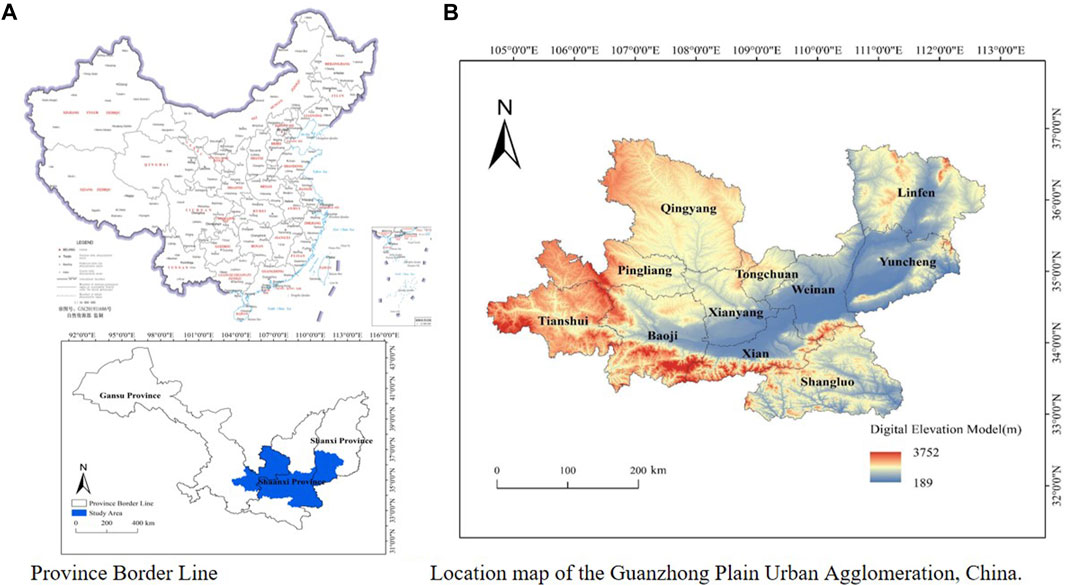
FIGURE 1. Location map of the GPUA, China. (A) Province Border Line. (B) Location map of the Guanzhong Plain Urban Agglomeration, China.
1) Vector boundaries of the study area were obtained from the 1:1 million National Basic Geographic Database of the National Geographic Information Resource Catalog Service System (https://www.webmap.cn/); (2)Land use data at a spatial resolution of 30 m were obtained from the Resource Environment and Science Data Center of the Chinese Academy of Sciences. These data are based on the Landsat series of satellite images and were generated through human-computer interaction and manual visual interpretation (https://www.resdc.cn/). According to the land use classification standard of the Chinese Academy of Sciences, the study area is divided into six primary types, namely, farmland, woodland, grassland, water body, construction land, and unused land. Social and economic data as well as energy consumption data ranging from 2001 to 2021 were obtained from the “Gansu Province Statistical Yearbook” (2001–2021), “Shaanxi Province Statistical Yearbook” (2001–2021), “Shanxi Province Statistical Yearbook” (2001–2021), “China City Statistical Yearbook” (2001–2021), and statistical bulletins of cities and towns from 2000 to 2020. Food price data were obtained from the “National Compilation of Information on Costs and Benefits of Agricultural Products” (2001–2021).
The land use transfer matrix reflects the quantitative transfer status of each land use type in the form of a two-dimensional matrix over a 20-year period. This matrix is used to visualize the quantity and direction of changes between time periods and land use types.
where,
The dynamism model is expressed by calculating the average annual rate of change in the quantity of a particular land use type in the region at the end of the study period and at the beginning of the study period. The degree of single land use dynamic is mainly used to reflect changes in specific land use types in the study area, indicating the rate of change and the magnitude of change in different land use types over time. The calculation formula is:
where, K > 0 means that the land scale of the type is expanding, K < 0 means that the land scale is shrinking,
Comprehensive land use dynamics responds to the rate of change in the overall type of land use in the study area over a given period of time, responding to comprehensive regional land use changes. The calculation formula is:
Where,
The carbon emissions in the study area were calculated by multiplying the area and carbon emission factors of each land type and then summing the results. The main land types that can be directly measured for carbon emissions are types of carbon sink land, including woodland, grassland, water body, and unused land; these are measured based on the carbon emission factors obtained by previous studies. The direct carbon emission calculation formula is:
where,
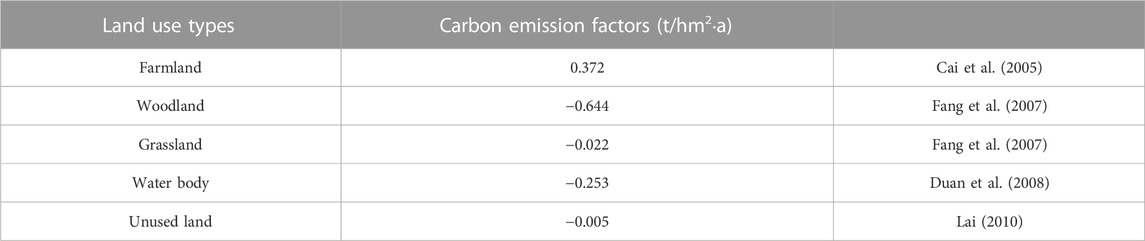
TABLE 1. Carbon emission factors by land use type.
Carbon emissions from construction land originate from fossil energy consumed in the production process. Because energy consumption varies greatly among different regions, indirect measurement is used to calculate it. The total carbon emissions from construction land are estimated indirectly by accounting for energy consumption of oil, coal, natural gas, and electricity, combined with data obtained from the China Energy Statistics Yearbook and the 2006 IPCC Guidelines for National Greenhouse Gas Emissions Inventories. The formula for calculating carbon emissions from construction land is as follows:
where,

TABLE 2. Energy conversion standard coal factor and carbon emission factor by type of energy.
The carbon emission intensity is determined by the area of each land use type and the carbon emission factor, where a larger carbon emission intensity means a larger carbon emission from each grid. The calculation formula is:
where,
In reference to the results of Xie et al. (2015), in this study, the ESV equivalent factor of one standard unit of ESV was defined as one-seventh of the economic value of natural food production per unit area of farmland per year nationwide. ESV correction and accounting were performed. Xie et al. (2015) corrected the ESV equivalent factor table adapted to the actual situation in China, which is more suitable for the actual application in China, as shown in Table 3. Based on Table 3, this study utilizes the following methods to make corrections to match the actual social development and regional characteristics of the GPUA.

TABLE 3. Equivalent factors of ESV.
The calculation formula is as follows:
where, D is the ESV for a standard equivalent factor;
The ESV coefficient is calculated by the formula:
where,
The spatial clustering and dispersion between carbon emission intensity and ESV intensity was examined using the bivariate Moran’s index. The calculation formula is as follows:
where,
Figure 2 shows the land use types of the GPUA from 2000 to 2020. According to the land use classification standard, the GPUA is dominated by farmland, grassland, and woodland, which together account for about 94.7% of the total land area in 2020. In terms of the 2020 land use structure, for example, farmland accounts for about 39.9% of the total land area of the region, grassland accounts for about 33% of the total land area of the region, and woodland accounts for about 21.8% of the total land area of the region. The GPUA has a beneficial geographical location. The northern part of the urban agglomeration is a loess hilly and ravine area with relatively high vegetation coverage and rich grassland and forest resources. The central part consists of the Guanzhong Plain and the Fenwei Plain and is adjacent to the Weihe River water system, which is suitable for agricultural development. The southern part depends on the Qinling Mountains, which have good ecological diversity. During the period of 2000–2020, farmland decreased by 3,872.546 km2 in total, which is the main category of land transferal. Construction land is the land type that increased the most, with an increase of 2002.442 km2, whereas grassland increased by 892.98 km2, woodland increased by 890.77 km2, and water body and unused land increased by 67.351 km2 and 19.003 km2, respectively. To more intuitively understand the structural characteristics of land use change in the GPUA during this period, a land use transfer matrix was used to calculate land use dynamics. The land use transfer matrix was constructed and the land use dynamic attitude was calculated. The specific results are shown in Tables 4, 5. Overall, unused land has the highest land use motivation, followed by water body and construction land. Unused land and water body are smaller because of their land use area, while construction land increased more because of areas that were transferred in. Although the overall situation from 2000 to 2020 showed an increase in the areas of all land types (except for the largest area of transferred out farmland), the transfer-in attitude of woodland showed a slight decrease after 2005. The change in the transfer attitude of grassland was clearly slower than that of construction land. From 2000 to 2020, the largest amount of land that was transferred out was farmland, and the main transfer directions were grassland, construction land, and woodland. With the continuous promotion of the project of returning farmland to forest and grass and the project of soil erosion control in the northern loess hills and ravines, the degree of vegetation cover increased year by year. Moreover, wasteland and bare land were gradually transformed into grasslands and forests. According to the China Forestry and Grassland Statistical Yearbook, during the period of 2000–2020, the forest coverage rate of Shanxi Province increased from 13.3% to 20.5%; the forest coverage rate of Shaanxi Province increased from 32.6% to 43.1%; the forest coverage rate of Gansu Province increased from 6.7% to 11.3%. The prevention of soil erosion and the return of cultivated land to forest and grassland made great achievements. During this period, the GPUA expanded rapidly: construction land increased, population increased, urbanization expanded rapidly, regional arable land was annexed, and the intensity of land development and utilization also increased. The expansion met the demand for rapid economic expansion and development of this region.
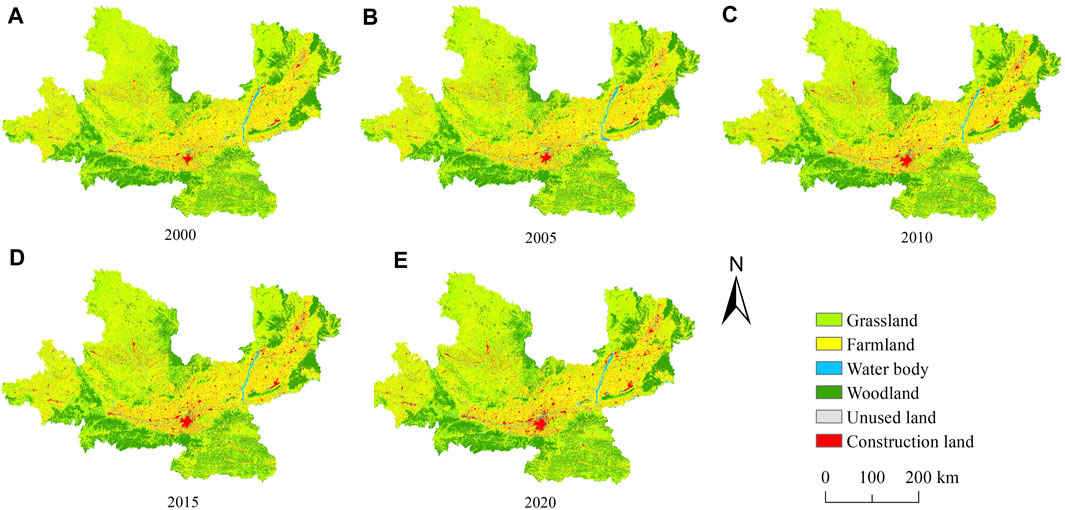
FIGURE 2. Land use changes in the GPUA over the study period. (A) 2000, (B) 2005, (C) 2010, (D) 2015, (E) 2020.
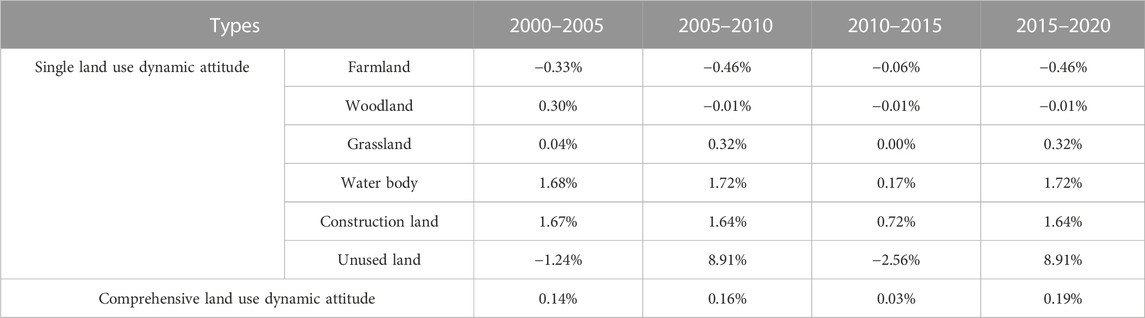
TABLE 4. Land use dynamics in the GPUA.
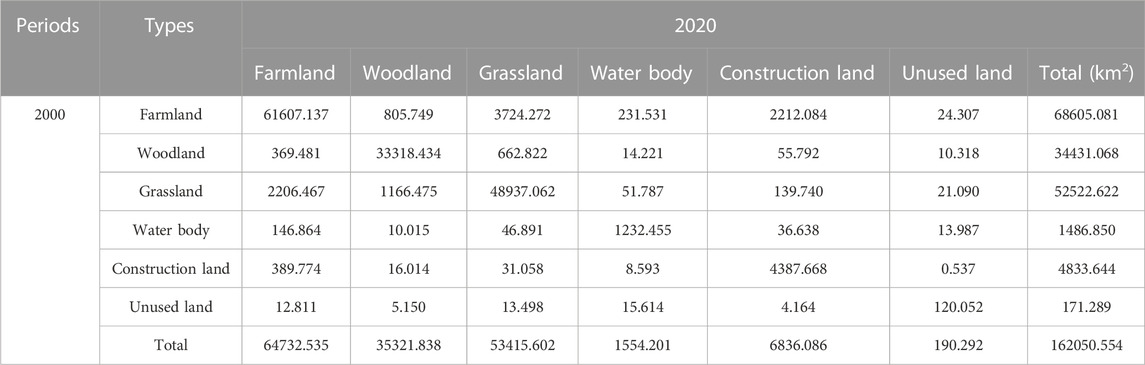
TABLE 5. Land use transfer matrix for the GPUA.
In this study, the carbon emissions of urban land use in the GPUA are measured via carbon emissions, carbon sources/sinks, and net carbon emissions of each category. The dynamic change characteristics of each indicator in 2000–2020 are analyzed, and the results are shown in Table 6; Figure 3. As shown in Table 6, the overall net carbon emissions from land use in the GPUA followed a significant growth trend from 40,815.272 × 104 t in 2000 to 352,655.178 × 104 t in 2020. The growth trend of carbon emissions from construction land is basically consistent with the growth trend of net carbon emissions from land use, and carbon emissions from construction land have become the main source of the growth of net carbon emissions. The farmland area gradually decreased over the study period, and accordingly, the carbon emissions from cultivated land followed a decreasing trend from 289.77 × 10⁴ t in 2000 to 273.407 × 10⁴ t in 2020. Carbon sinks followed a first decreasing and then increasing trend during the study period. Woodland was the main source of carbon sequestration, and the carbon sequestration capacities of grassland and water body were relatively low. The carbon sequestration capacity of woodland showed a small increase over 2000–2010 and was more stable from 2010 to 2020. The carbon sequestration effect of grassland and water body remained basically unchanged during the study period. Unused land showed a decreasing trend from 2000 to 2015 and a significant increase from 2015 to 2020, which matches the trend of carbon sink changes.
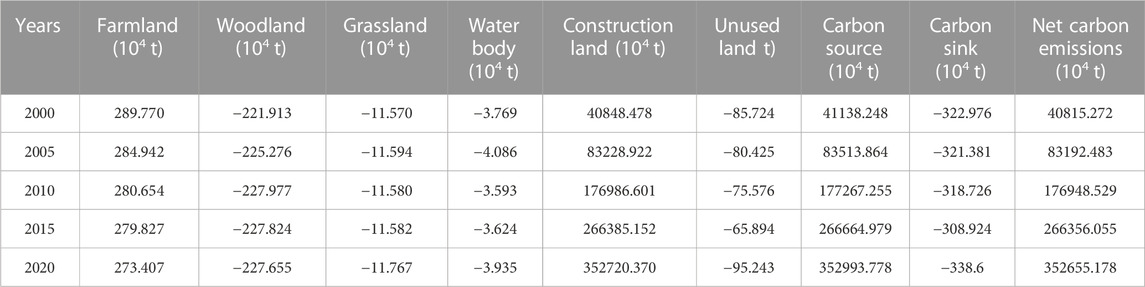
TABLE 6. Accounting results of carbon emissions from land use in the GPUA.
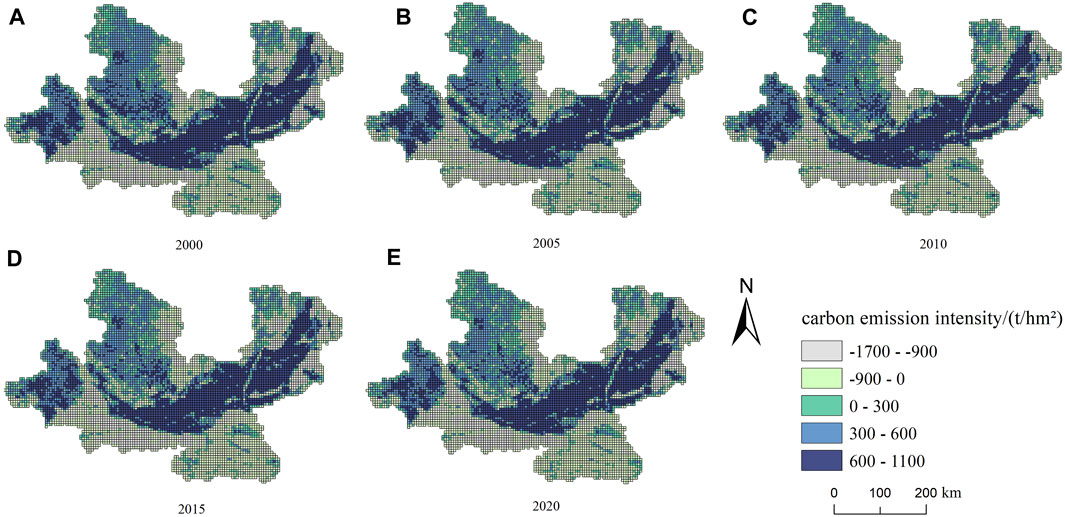
FIGURE 3. Carbon emission intensity in the GPUA. (A) 2000, (B) 2005, (C) 2010, (D) 2015, (E) 2020.
Analyzing the data in terms of carbon source/sink composition showed that carbon emissions from construction land were the most important carbon source, accounting for 99.30%–99.92% of the total carbon source and increasing significantly year by year. As one of these carbon sources, the contribution rate of carbon emissions from farmland was significantly smaller than that of construction land, but the area share was high. Carbon emissions per hectare of construction land represent the carbon intensity and energy consumption structure of construction land as a land use category in each study year. The average carbon emission intensity of construction land in the study area in 2000, 2005, 2010, 2015, and 2020 were 843.725 t/hm2, 1586.923 t/hm2, 2898.595 t/hm2, 4211.434 t/hm2, and 5153.703 t/hm2. The carbon emissions of construction land in 2020 were about six times of those in 2000. This result highlights the great potential for carbon emission reduction on construction land. Regarding the carbon emissions composition of carbon sinks, woodland and grassland are the main carbon sinks, together accounting for about 98.5% of the total carbon sinks. However, woodland and grassland, which cover 54.8% of the land area of the study area, have an extremely important carbon sequestration capacity, while water body and unused land have lower carbon sequestration capacities. Because of the great gap between the amount of carbon sources and carbon sinks, under the integrated regional eco-economic development strategy, the GPUA has begun to focus on controlling carbon sources and increasing carbon sinks to maintain ecosystem services and functions.
Because of differences in the class structure and development level in this urban agglomeration, to analyze the change of carbon emissions more intuitively and enhance comparability, the carbon emission intensity index was analyzed in depth. This index was divided into five intervals of −1700 to −900, −900 to 0, 0 to 300, 300 to 600, and 600 to 1100, and the results are shown in Figure 3. The maximum value of carbon emission intensity in the GPUA decreased from 1053.24 (2000) to 1048.66 (2020). This indicates that ecological and environmental quality issues have attracted attention during the development of urban agglomerations and the uncontrolled brutal development pattern of relying on energy and expanding land has been restrained. High values of carbon emission intensity were mostly distributed in the central, western, and northwestern parts of the urban agglomeration. In addition, the trend of spatial differentiation shows a distribution pattern of high intensity in the central region and low intensity in the surrounding regions, which is roughly similar to the distribution of land use structure of farmland and grassland. High altitude and slope areas are rich in ecological resources, and these areas also feature low land development, well-protected ecosystems, and low carbon emission intensity. High intensity carbon emission areas are mainly located on the banks of the Weihe and Yellow River as well as in the Guanzhong Plain. These areas are mainly influenced by the expansion of urban and rural settlements and changes in the scale of agricultural production land. The development of agriculture and the expansion of the scope of urban settlements have led to a high degree of land development. The high intensity of human activities has directly led to the problem of high carbon emissions from land use, which is difficult to circumvent.
To apply coefficient correction to the actual production capacity of the Guanzhong Plain Urban Agglomeration, the grain yield correction method was used. According to the yield of major grain crops, sown area, and grain purchase price in the study area from 2000 to 2020, the coefficient of ESV of the GPUA was obtained by combining the land use type and the corresponding ecosystem. The results are shown in Table 7.
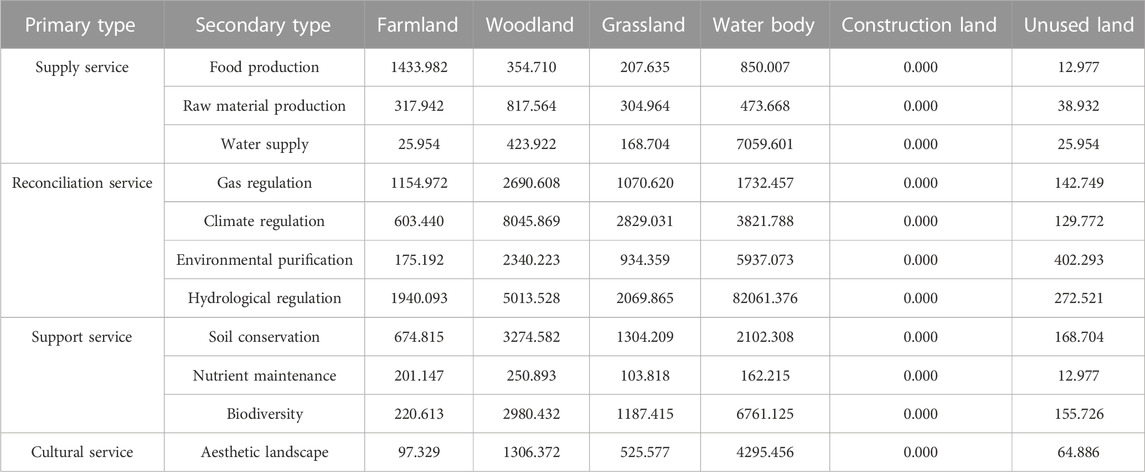
TABLE 7. Ecosystem service value coefficients of the GPUA (CNY/hm2·a).
The total ESV of the GPUA from 2000 to 2020 showed fluctuating changes and an overall increasing trend. The total value increased from 215,263.7 million yuan to 216,776.2 million yuan, which represents an increase of 0.700% (Table 8). Judging from the ESV of each land type, woodland, grassland, and farmland are the main contributors to the total ESV, accounting for 44.674%, 26.160%, and 21.144%, respectively. Among them, ESV contributed by farmland decreased year by year, from 21.836% to 20.459%. The remaining land types showed an overall increasing trend. The functional structure of land use indicates that during the period of 2000–2020, farmland decreased by a total of 3872.546 km2, while construction land was the main category of increase, increasing by 2002.442 km2. At 67.351 km2, the increase in the water area was less. However, the increase in ESV added during the study period reached 4.403%, indicating that water bodies have high ESV intensity and are also the main contributors to the total ESV. Water bodies are also the main contributing land type and hold a very important ecological status. The interconversion among land classes is also an important reason for the fluctuation of total ESV during the study period.
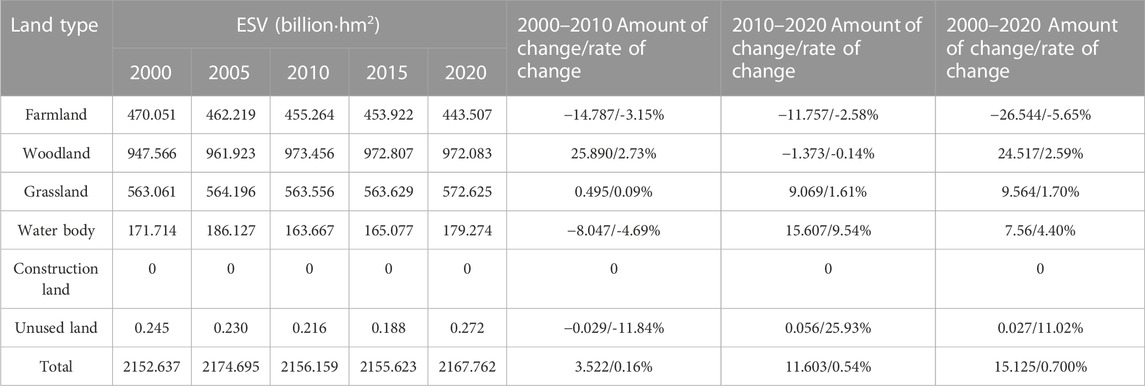
TABLE 8. Ecosystem service values and changes in the GPUA over the study period.
To visually analyze the spatial distribution characteristics of ESV in the study area, while avoiding the influence of the edge area of the study area, a 5 km × 5 km grid was created for an equally spaced sampling of the study area based on 30 m resolution land use data. The study area was divided into 6934 units, and the ESV intensity results of each study unit were identified. The results are shown in Figure 4. In this study, the calculated ESV intensity was divided into four zones, I, II, III, and IV, and the range of values defined for the four zones corresponded to: 0–20, 20–35, 35–55, and >50. The ESV intensity of the GPUA showed a distribution trend of low in the central regions and high in the surrounding regions. The grid in the low ESV intensity range is mainly caused by the relatively uniform spatial distribution and high proportion of farmland and construction land, accounting for about 22.45% of the total grid area. The Guanzhong Plain area is suitable for agricultural development, the scope of urban settlements expands, the ecological and environmental effects are low, and negative effects are difficult to avoid. Areas at high altitude, slopes, and Yellow River and Weihe River basin areas are rich in ecological resources, their ecosystems are more complete, and the positive ecological environment effect is significant; moreover, the value of services available is high, accounting for about 44.71% and 23.61% in zones II and III, respectively, and for about 9.22% in the high ESV intensity zone. Overall, the distribution range of low-intensity areas has been gradually shrinking and transforming into II intervals, and the overall ESV intensity of the GPUA has increased.
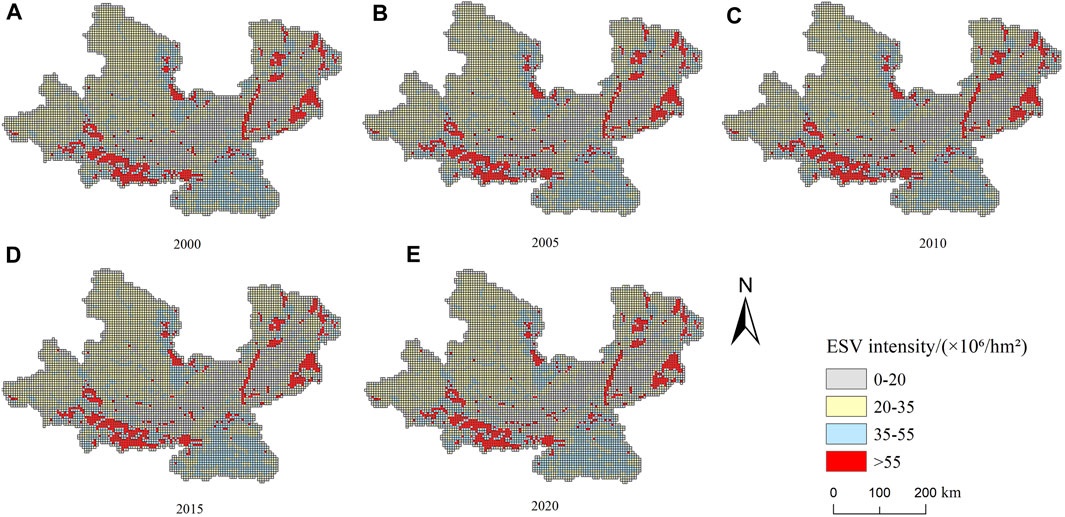
FIGURE 4. Ecosystem service value intensity of the GPUA. (A) 2000, (B) 2005, (C) 2010, (D) 2015, (E) 2020.
To examine the interaction between carbon emission intensity and ESV intensity, the spatial correlation pattern was identified by bivariate spatial autocorrelation. The Moran’s I index was negative in all years with a p-value of less than 0.001 (shown in Table 9). This result indicates the existence of a negative spatial correlation between land-use carbon emission intensity and ESV intensity in the study area, i.e., the ESV intensity followed a decreasing trend with increasing land-use carbon emission intensity.
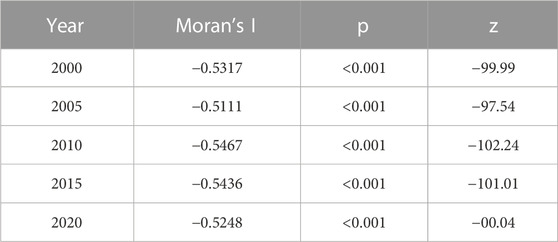
TABLE 9. Bivariate global Moran’s I for the GPUA in 2000–2020.
The bivariate local autocorrelation LISA agglomeration map shows that between 2000 and 2020, the high and high agglomerations are concentrated in the Yellow River and Weihe River basins; low and high agglomerations are mainly concentrated in the surrounding areas with higher slopes and topography, such as the Qinling Mountains in the south and the Loess Plateau area in the west. These areas have low land opening intensities, low carbon emission intensities, better ecological backgrounds, and higher values of ecosystem services available. These factors are consistent with the regional distribution pattern of low carbon emission intensity and high ESV intensity, and present roughly the same spatial distribution trend as woodland and grassland. Figure 5 shows that over the study period, the number of high and high aggregation areas in the Guanzhong Plain increased and the area expanded, while the area of high and low aggregation areas in the northwestern part of the study area decreased. This is probably the result of the increasing intensity of ecosystem service provisioning caused by the structural adjustment of land use functions and the gradual implementation of the policy of returning farmland to forests and grassland in loess hills and gullies. The construction land covers a small area, has a high carbon emission coefficient, and is a carbon source, resulting in high carbon emission intensity in local areas. The coefficient is much higher than that of the surrounding farmland, and thus, the grid area with a high proportion of cultivated land area together with the construction land forms a high–low agglomeration area. In the marginal areas of urban agglomeration zoning, low–low agglomeration areas show a scattered distribution.
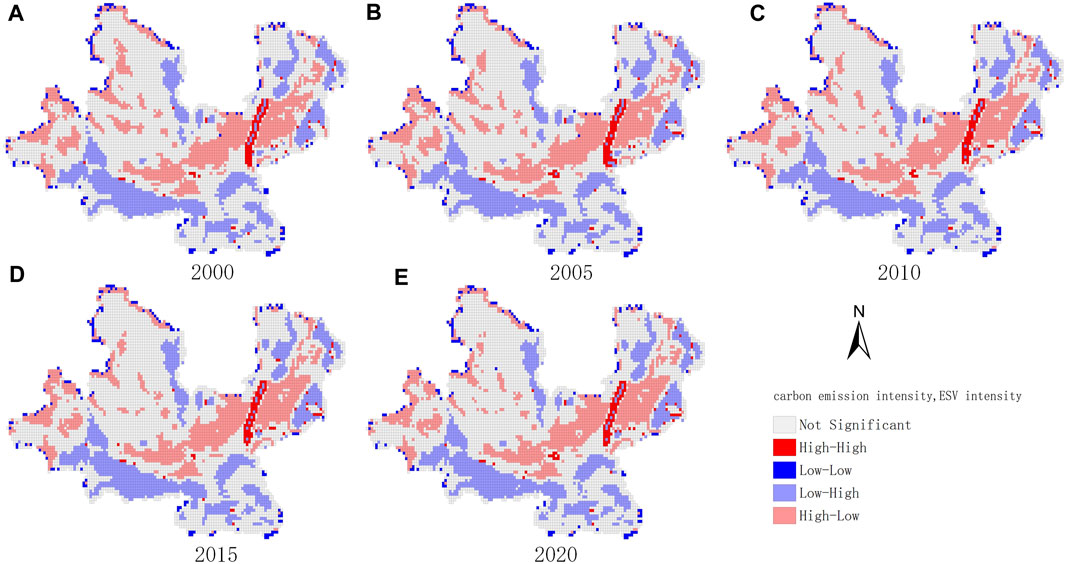
FIGURE 5. Bivariate spatial agglomeration diagram. (A) 2000, (B) 2005, (C) 2010, (D) 2015, (E) 2020.
Land use is the most direct expression of the interaction between human activities and natural ecosystems. The structure of land use is not only an important part of basic land use units, quantitative characteristics, and spatial layout, but also the core basis of regional ecosystem macro control. Land use change affects the carbon cycle process of terrestrial ecosystems by changing the original land cover type and the socio-economic activities it carries. With the acceleration of the urbanization rate of the GPUA, the development and utilization of land are gradually enhanced, and construction land is the most important application site for fossil fuels. The significant expansion of the areas of construction land causes a shrinkage of the carbon sink area and an expansion of the carbon source area, which directly or indirectly causes changes in carbon emissions and carbon sequestration and affects the supply capacity of ecosystem services. The total carbon emissions from land use in the study area increased significantly from 2000 to 2020, and the carbon emissions from construction land exceeded net carbon emissions. The main reason for this phenomenon is that the development of rapid urbanization has led to significant changes in land use structure. The GPUA, with Xi’an at the core, is rapidly promoting urban construction and social development, thus facilitating the process of industrial construction and service construction. The output value of secondary and tertiary industries accounts for about 90% of the regional GDP. The carbon sequestration capacities of woodland and grassland play an important role in ecological improvement and protection, and these land use types account for a large proportion of the land use area. The maximum carbon emission intensity within the study area decreased from 2000 to 2020, which is generally consistent with the findings of previous related studies (Cao et al., 2021; Zhang et al., 2022b; Wu et al., 2022; Zhao et al., 2023).
From 2000 to 2020, the total value of ESV shows a fluctuating growth trend of “rapid increase–rapid decrease–slow decrease–rapid increase”, including two significant change periods from 2000 to 2010 and from 2015 to 2020. This differs from the results of previous research related to the Guanzhong Plain Urban Agglomeration (Yang et al., 2022b). The higher ESV values were distributed in the southern and western and northwestern edges of the study area, in the Qinba Mountains and along the Yellow River, enabled by the positive effect of forest cover and water conservation on ESV intensity. The rapid increase in the total ESV value in 2005 may have been due to the transfer of forest land area as the largest increase during the study period. The implementation of the project of returning farmland to forest and grassland and the erosion control project provide a good start for the restoration of ecosystem service functions. In 2018 China promulgated The Guanzhong Plain Urban Agglomeration Development Plan, which specifies ecological environmental protection as a task and prerequisite for the construction of city clusters. This provides policy support for the rapid growth of ecosystem service values and the implementation of ecological protection and restoration projects from 2015 to 2020 (Guo et al., 2022; Wang et al., 2022).
The spatial agglomeration of carbon emission intensity and ESV intensity shows a significant negative correlation effect. On production land and living land such as arable land and construction land, the central region of the GPUA generates a large amount of greenhouse gas pollution and emissions due to carrying a large number of human production and living behaviors, and clustering the development and utilization of resources in agriculture, industry and services. Human behavior is also a consumption of ecosystem functions, so it makes the value provided by terrestrial ecosystems impaired, showing a spatial agglomeration distribution pattern of high carbon emission intensity–low ESV intensity. In the southwestern part of the GPUA, the southern hinterland, and part of the northeastern part of the GPUA, i.e., the area with a large distribution of ecological land such as forests and grasslands, a low carbon emission intensity-high ESV intensity distribution pattern is shown. This is in line with the functions of natural ecology such as woodland and grassland in performing soil and water conservation, climate regulation, or other functions. At the same time, a series of man-made ecological projects, such as the government’s establishment of the Qinling Protected Area and the introduction of the Outline of the Plan for the Ecological Protection and High-Quality Development of the Yellow River Basin, have made an important contribution to the ecological environment of the region. How to reduce the total amount of carbon emissions from land use and carbon sources and improve the level of urban ESV is the breakthrough direction for the future green development of the city and the realization of long-term synergistic development of ecology and economy.
The above changes in land use structure and function yield corresponding changes in total carbon emissions and ESV, leading to ecosystem instability. However, it is worth noting that farmland has a weak ecological carrying capacity, and when making changes to utilization strategies, it is important to pay attention to regional food security and farmland red line restrictions, to not develop and transfer out uncontrollably. The GPUA should prioritize the ecological security pattern in the development process, and the governments of Gansu, Shaanxi, and Shanxi provinces should do a good job of coordinating the division of labor based on the consideration of ecological value coordinated with social and economic value. The three provinces should work together to protect the ecological barrier areas, ensure the smooth flow of ecological corridors, and consolidate the green foundation for the high-quality development of the urban agglomeration (Chen et al., 2022; Yang et al., 2022c). This study complements the relevant research results on carbon emissions and ESV under land use change, and using the GPUA as a case study, proposes strategies to promote integrated regional ecological-economic development, which helps to improve the practicality and completeness of the research results.
(1) During the period of 2000–2020, the following land use types accounted for the largest proportion of the GPUA: farmland accounted for about 39.9% of the total land use area; grassland accounted for about 33% of the total land use area; and woodland accounted for about 21.8% of the total land use area. Farmland was the main and largest transfer-out category; grassland and woodland were the main transfer-in categories; and construction land and water body had the largest annual average rate of change.
(2) From 2000 to 2020, the total ESV in the GPUA increased overall and showed corresponding fluctuations with the transformation of each category. The ESV intensity at the grid scale showed a distribution pattern of low in the central regions and high in the surrounding regions. The ESV intensity was significantly lower than in the surrounding areas with high altitude, slope, and abundant ecological and water resources.
(3) The net carbon emissions from land use showed growing carbon emissions year by year. The amount of carbon sources far exceeded the amount of carbon sinks, and the average carbon emission from construction land increased from 843.725 t/hm2 in 2000 to 5153.703 t/hm2 in 2020, which is an increase of about six times. Construction land is the largest carbon emission source, and there is great potential for carbon emission reduction from construction land. The overall carbon emission intensity distribution is high in the centra regions and low in the surrounding regions, and the trend is basically opposite to the ESV intensity distribution.
(4) Quantitative and spatial statistical analyses of carbon emission intensity and ESV intensity of land use in the GPUA showed a significant negative spatial agglomeration effect and a spatial spillover effect of carbon emission intensity on ESV intensity.
Compared with most previous studies, this study innovatively analyzed the total amount and temporal and spatial evolution of carbon emissions and ESV based on the functional transformation of land use structure. And the study also analyzed the spatial agglomeration effect of carbon emission intensity and ESV intensity from the perspective of carbon emission intensity and ESV intensity, and explored whether carbon emission intensity affects the distribution of ESV intensity. In this study, administrative regions are crossed and a specific urban agglomeration is selected. This urban agglomeration features clear strategic positioning as an inland ecological civilization construction pioneer zone in the national plan. By using two calculation scales and methods, this study measures the carbon emissions, carbon emission intensity, and total ESV values and intensity in the study area more comprehensively. This study helps to enrich the existing research results on ecological and environmental quality in the GPUA, thus complementing the framework and perspectives of ESV and carbon emissions related studies. The purposes of this study were to examine the relationship between carbon emission intensity and ESV intensity and their spatial aggregation in the study area from 2000 to 2020, to provide a theoretical basis for the coordinated development of regional ecology and the economy, and to optimize the spatial layout of the national land. As with any research, this study is subject to limitations, which provide avenues for future research. Currently, only carbon emissions from construction land are considered when calculating land carbon emissions, while industrial production processes and waste carbon emissions are not considered. When determining carbon emission factors for different land types, a certain amount of error emerges when drawing on previous studies to obtain carbon emission factors for each examined category. ESV is measured using the unit area value equivalent factor method and grain prices and yields are applied for factor corrections. This approach can affect the accuracy of the ESV assessments because of different correction methods and the reliance of this method on the equivalent factor. Moreover, in the ESV calculation process, the value equivalent of construction land is set to 0, but with the increasing proportion of artificial green spaces and ecological landscape layout of construction land, whether this coefficient remains at 0 is worthy of further discussion and debate. Therefore, future research should explore the impact of these issues on ecosystems in a more focused manner to provide more detailed and scientific guidance for the governance of local ecological security.
The original contributions presented in the study are included in the article/supplementary material, further inquiries can be directed to the corresponding author.
XZ: conceptualization, conceptualization, methodology, formal analysis, investigation, data curation, writing–original draft. SY: methodology, validation, supervision, writing–review and editing, funding acquisition. All authors contributed to the article and approved the submitted version.
This research was supported by the National Social Science Foundation of China’s Western Region Project: Research on Accounting for the Value of Different Types of Ecological Products in Northwest China and Paths to Realization (23XTJ006).
The authors declare that the research was conducted in the absence of any commercial or financial relationships that could be construed as a potential conflict of interest.
All claims expressed in this article are solely those of the authors and do not necessarily represent those of their affiliated organizations, or those of the publisher, the editors and the reviewers. Any product that may be evaluated in this article, or claim that may be made by its manufacturer, is not guaranteed or endorsed by the publisher.
Cai, W., Jiang, W., Du, H., Chen, R., and Cai, Y. (2021). Assessing ecosystem services supply-demand (Mis)Matches for differential city management in the yangtze river delta urban agglomeration. Int. J. Environ. Res. Public Health 18, 8130. doi:10.3390/ijerph18158130
Cai, Z. C., Kang, G. D., Tsuruta, H., and Mosier, A. (2005). Estimate of CH4 emissions from year-round flooded rice fields during rice growing season in China. Pedosphere 15, 66–71. doi:10.1007/s10705-004-5083-1
Cao, Y., Kong, L., Zhang, L., and Ouyang, Z. (2021). The balance between economic development and ecosystem service value in the process of land urbanization: a case study of China’s land urbanization from 2000 to 2015. Land Use Policy 108, 105536. doi:10.1016/j.landusepol.2021.105536
Chen, J., Wang, S. S., and Zou, Y. T. (2022). Construction of an ecological security pattern based on ecosystem sensitivity and the importance of ecological services: a case study of the Guanzhong Plain urban agglomeration, China. Ecol. Indic. 136, 108688. doi:10.1016/j.ecolind.2022.108688
Chen, X., Chen, Y., Shimizu, T., Niu, J., Nakagami, K. I., Qian, X., et al. (2017). Water resources management in the urban agglomeration of the Lake Biwa region, Japan: an ecosystem services-based sustainability assessment. Sci. Total Environ. 586, 174–187. doi:10.1016/j.scitotenv.2017.01.197
Costanza, R., D'Arge, R., De Groot, R., Farber, S., Grasso, M., Hannon, B., et al. (1997). The value of the world's ecosystem services and natural capital. Nature 387, 253–260. doi:10.1038/387253a0
Davidson, N. C., Van Dam, A. A., Finlayson, C. M., and Mcinnes, R. J. (2019). Worth of wetlands: revised global monetary values of coastal and inland wetland ecosystem services. Mar. Freshw. Res. 70, 1189–1194. doi:10.1071/mf18391
Duan, X., Wang, X., Lu, F., and Ouyang, Z. (2008). Current status and potential of carbon sequestration in wetland ecosystems in China. J. Ecol. 02, 463–469. doi:10.3321/j.issn:1000-0933.2008.02.002
Fang, J., Guo, Z., Pu, S., and Chen, A. (2007). Estimation of carbon sinks of terrestrial vegetation in China from 1981 to 2000. China Sci. Ser. D Earth Sci. 06, 804–812. doi:10.1360/zd2007-37-6-804
Forman, R. T. (2015). “Launching landscape ecology in America and learning from Europe,” in History of landscape ecology in the United States (New York, NY: Springer).
Guo, X. M., Fang, C. L., Mu, X. F., and Chen, D. (2022). Coupling and coordination analysis of urbanization and ecosystem service value in Beijing-Tianjin-Hebei urban agglomeration. Ecol. Indic. 137, 108782. doi:10.1016/j.ecolind.2022.108782
Larsen, F. W., LondoñO-Murcia, M. C., and Turner, W. R. (2011). Global priorities for conservation of threatened species, carbon storage, and freshwater services: scope for synergy? Conserv. Lett. 4, 355–363. doi:10.1111/j.1755-263x.2011.00183.x
Leemans, R., and De Groot, R. (2003). Millennium Ecosystem Assessment: ecosystems and human well-being: a framework for assessment. Washington: World Resources Institute.
Li, Y.-N., Cai, M., Wu, K., and Wei, J. (2019). Decoupling analysis of carbon emission from construction land in Shanghai. J. Clean. Prod. 210, 25–34. doi:10.1016/j.jclepro.2018.10.249
Li, Y., Luo, Y., Liu, G., Ouyang, Z., Zheng, H., Dai, F., et al. (2013). Impacts of land use change on ecosystem service functions: an example from Miyun Reservoir watershed. J. Ecol. 33 (03), 726–735. doi:10.1016/j.taap.2013.07.029
Liu, F., Qin, T., Liu, S., Wang, H., and Nie, H. (2023a). Spatial response of urban land use change and ecosystem service value in the lower reaches of the Yangtze River: a case study of Tongling, China. Front. Environ. Sci. 11, 535. doi:10.3389/fenvs.2023.1137442
Liu, L., Zheng, L., Wang, Y., Liu, C., Zhang, B., and Bi, Y. (2023b). Land use and ecosystem services evolution in danjiangkou reservoir area, China: implications for sustainable management of national projects. Land 12, 788. doi:10.3390/land12040788
Ouyang, X., Tang, L., Wei, X., and Li, Y. (2021). Spatial interaction between urbanization and ecosystem services in Chinese urban agglomerations. Land Use Policy 109, 105587. doi:10.1016/j.landusepol.2021.105587
Pan, Y., Dong, F., and Du, C. (2023). Is China approaching the inflection point of the ecological Kuznets curve? Analysis based on ecosystem service value at the county level. J. Environ. Manag. 326, 116629. doi:10.1016/j.jenvman.2022.116629
Scholte, S. S. K., Van Teeffelen, A. J. A., and Verburg, P. H. (2015). Integrating socio-cultural perspectives into ecosystem service valuation: a review of concepts and methods. Ecol. Econ. 114, 67–78. doi:10.1016/j.ecolecon.2015.03.007
Wang, D., Li, Y., Zheng, H., and Ouyang, Z. (2014). Surfactants present complex joint effects on the toxicities of metal oxide nanoparticles. J. Ecol. 34, 70–75. doi:10.1016/j.chemosphere.2014.03.010
Wang, K., Ouyang, X., He, Q. Y., and Zhu, X. (2022). Impact of urban land expansion efficiency on ecosystem services: a case study of the three major urban agglomerations along the yangtze river economic belt. Land 11, 1591. doi:10.3390/land11091591
Wu, H., Qiu, Y., Yin, L., Liu, S., Zhao, D., and Zhang, M. (2022). Effects of China’s land-intensive use on carbon emission reduction: a new perspective of industrial structure upgrading. Front. Environ. Sci. 10, 2386. doi:10.3389/fenvs.2022.1073565
Xi, J. (2020). The general debate of the 75th session of the united Nations general assembly. Bull. State Counc. People's Repub. China 28, 5–7.
Xie, G., Lu, C., Leng, Y., Zheng, D., and Li, S. (2003). Valuation of ecological assets on the qinghai-tibet plateau. J. Nat. Resour. 02, 189–196. doi:10.11849/zrzyxb.2003.02.010
Xie, G., Zhang, C., Zhang, C., Xiao, Y., and Lu, C. (2015). The value of ecosystem services in China. Resour. Sci. 37 (09), 1740–1746.
Xue, X., Chen, Z. J., Wang, S. F., Feng, Z. Y., Duan, Y. C., and Zhou, Z. B. (2022). Value entropy: a systematic evaluation model of service ecosystem evolution. Ieee Trans. Serv. Comput. 15, 1760–1773. doi:10.1109/tsc.2020.3016660
Yang, J. X., Ma, X., Zhao, X. Y., and Li, W. Q. (2022a). Spatiotemporal of the coupling relationship between ecosystem services and human well-being in Guanzhong Plain Urban agglomeration. Int. J. Environ. Res. Public Health 19, 12535. doi:10.3390/ijerph191912535
Yang, J., Zhang, M., Duo, L., Xiao, S., and Zhao, Y. (2022c). Spatial pattern of land use carbon emissions and carbon balance zoning in Jiangxi Province. Environ. Sci. Res. 35, 2312–2321. doi:10.13198/j.issn.1001-6929.2022.05.04
Yang, S., and Su, H. (2022). Multi-scenario simulation of ecosystem service values in the Guanzhong Plain Urban agglomeration, China. Sustainability 14, 8812. doi:10.3390/su14148812
Yang, Y., Zhang, Y. Y., Yang, H., and Yang, F. Y. (2022b). Horizontal ecological compensation as a tool for sustainable development of urban agglomerations: exploration of the realization mechanism of Guanzhong Plain urban agglomeration in China. Environ. Sci. Policy 137, 301–313. doi:10.1016/j.envsci.2022.09.004
Ye, H., Song, Y. Y., and Xue, D. Q. (2022). Multi-scenario simulation of land use and habitat quality in the Guanzhong Plain Urban agglomeration, China. Int. J. Environ. Res. Public Health 19, 8703. doi:10.3390/ijerph19148703
Zhang, C. Y., Zhao, L., Zhang, H. T., Chen, M. N., Fang, R. Y., Yao, Y., et al. (2022b). Spatial-temporal characteristics of carbon emissions from land use change in Yellow River Delta region, China. Ecol. Indic. 136, 108623. doi:10.1016/j.ecolind.2022.108623
Zhang, L., Fang, C., Zhu, C., and Gao, Q. (2022a). Ecosystem service trade-offs and identification of eco-optimal regions in urban agglomerations in arid regions of China. J. Clean. Prod. 373, 133823. doi:10.1016/j.jclepro.2022.133823
Zhao, C., Liu, Y., and Yan, Z. (2023). Effects of land-use change on carbon emission and its driving factors in Shaanxi Province from 2000 to 2020. Environ. Sci. Pollut. Res. 30, 68313–68326. doi:10.1007/s11356-023-27110-1
Keywords: land use change, carbon emissions, ecosystem service value, spatial autocorrelation, Guanzhong Plain Urban Agglomeration
Citation: Yang S and Zheng X (2023) Spatio-temporal relationship between carbon emission and ecosystem service value under land use change: a case study of the Guanzhong Plain Urban Agglomeration, China. Front. Environ. Sci. 11:1241781. doi: 10.3389/fenvs.2023.1241781
Received: 17 June 2023; Accepted: 12 October 2023;
Published: 23 October 2023.
Edited by:
Hualin Xie, Jiangxi University of Finance and Economics, ChinaReviewed by:
Haibin Chen, Northwest A&F University, ChinaCopyright © 2023 Yang and Zheng. This is an open-access article distributed under the terms of the Creative Commons Attribution License (CC BY). The use, distribution or reproduction in other forums is permitted, provided the original author(s) and the copyright owner(s) are credited and that the original publication in this journal is cited, in accordance with accepted academic practice. No use, distribution or reproduction is permitted which does not comply with these terms.
*Correspondence: Xiaozheng Zheng, emhlbmd4ekB4YXVhdC5lZHUuY24=
Disclaimer: All claims expressed in this article are solely those of the authors and do not necessarily represent those of their affiliated organizations, or those of the publisher, the editors and the reviewers. Any product that may be evaluated in this article or claim that may be made by its manufacturer is not guaranteed or endorsed by the publisher.
Research integrity at Frontiers
Learn more about the work of our research integrity team to safeguard the quality of each article we publish.