 Anne-Gaelle Elsa Ausseil
 Pamela Booth
 Suzie Greenhalgh
 Oshadhi Samarasinghe3
- 1Manaaki Whenua Landcare Research, Wellington, New Zealand
- 2Ministry for the Environment, Wellington, New Zealand
- 3Manaaki Whenua Landcare Research, Auckland, New Zealand
Recognizing the value of nature for people’s wellbeing is key to ensuring protection of the environment for current and future generations. However, data to demonstrate the connection between nature and wellbeing, are needed for environmental reporting, to inform policy development and evaluate progress toward outcomes. While many indicators exist, they are mostly derived from available data collected for other purposes and there is limited, if any, description of how these indicators were designed. Based on a conceptualization of nature–well-being connections, we propose a participatory process to identify fit-for-purpose indicators linking nature to human wellbeing. The process uses a series of targeted questions to explore how different aspects of wellbeing rely on nature, enabling more fitting indicators to be identified by the participatory group. The process was refined and tested in workshops with stakeholders in a New Zealand context.
1 Introduction
With current challenges such as the biodiversity crisis and climate change facing humanity, it is increasingly important to recognise the value of nature for people’s wellbeing. As described in the Millennium Ecosystem Assessment (MEA) (Millennium Ecosystem Assessment, 2005), nature provides many benefits for a variety of wellbeing outcomes. Conceptualizing the nature–well-being relationship is challenging as it depends on the different worldviews and value systems that people may refer to. One conceptualization is around the anthropocentric value of nature, or “ecosystem services” (ES), as popularised by the MEA. Since then, many frameworks have emerged to conceptualize the links between ecosystem services and human wellbeing (Cruz-Garcia et al., 2017). More recently, the Intergovernmental Platform on Biodiversity and Ecosystem Services (IPBES) has introduced the concept of Nature’s Contributions to People (NCP), to complement the ES concept and broaden it to other worldviews of human–nature relationships (Díaz et al., 2018). While much research has been done on the different framing and classification of ES/NCP, the relationships between ES/NCP and human wellbeing are usually assumed. There is a lack of specified and well-defined connectivity between changes in the environment and their effects on changes in human wellbeing to enable environmental policy and decision making.
Fit-for-purpose indicators and monitoring frameworks are needed to report on the connections between nature and wellbeing. In our case, we define fit-for-purpose in the context of informing policy development and evaluating progress toward outcomes for a lay person. We are therefore targeting policymakers from government agencies and the public. These indicators must adequately represent their intent, be relevant, easy to understand yet communicate information on a large phenomenon of interest. Many indicators have been developed to support reporting and monitoring frameworks. At the international level, representatives from 188 countries adopted the Kunming-Montreal Global Biodiversity Framework in December 2022 during the UN Biodiversity Conference (COP15), with goals and targets related to reducing threats to biodiversity and meeting people’s needs. Headline indicators were recommended to monitor progress1, but most are still under development. The Sustainable Development Goals (SDG) have also been developed to ensure that people enjoy peace and prosperity while protecting the planet, with nature’s role being implicitly incorporated into their indicators (Hole et al., 2022).
The relationship between humans and nature has been conceptualized through the ES cascade (Haines-Young and Potschin, 2010) as a framing for using ES in decision making in the European Union (EU) (Potschin-Young et al., 2017). The ES cascade proposes a causal chain from process, to function, then service, and finally benefit and value levels. It provides a structured and logical way of describing the relationships between human society and the environment. It can be used as the foundation for building different assessment approaches including for reviewing and developing indicator frameworks for ecosystem services (Mononen et al., 2016; Potschin-Young et al., 2017; Haines-Young et al., 2018). The EU’s Biodiversity Strategy uses this ES cascade as a framework to identify indicators for monitoring ecosystem services using the Common International Classification on Ecosystem Services (CICES) (Maes et al., 2018; Maes et al., 2016; Heink et al., 2016; McKenna et al., 2019).
Several recent studies have reviewed indicators using the ES cascade (Boerema et al., 2017; Czúcz et al., 2018). Another review of national ecosystem assessments showed which ES were considered for monitoring progress towards SDG (Geijzendorffer et al., 2017), which can be considered as compound indicators of wellbeing. That synthesis also revealed gaps and inconsistencies in how these assessments considered indicators of the different facets of the ES cascade from ecosystem supply capacity to use, demand and interest. Czúcz et al. (2020) found that most of the regulating ES were generally measured at the functional end of the cascade, while all cultural and some provisioning ES were more frequently measured as actual flows or benefits, such as cultivated crops (Czúcz et al., 2018). They also recommend that a clear spatial anchor should be specified, as almost all mapped indicators were linked to the source ecosystems, with rare spatial indicators assigned to beneficiaries. Similarly, Mandle et al. (2020) revealed that only 13% of assessments included all components of the ES chain translating ecological conditions into ES values. Relational values and NCP associated with some dimensions of good quality of life can be assessed and mapped using proxy indicators, enabling reporting at large scales such as for Europe (Schröter et al., 2020). Brauman et al. (2020) developed proxy indicators to underpin the IPBES Global assessment (IPBES, 2019). They used concepts of potential contributions, realized contributions, environmental conditions, and impact on quality of life to describe NCP and wellbeing state and trends in wellbeing resulting from changes in the condition of nature.
While there are many reviews of indicators (as described above) these reviews typically do not outline or discuss how these indicators were chosen or developed. Layke et al. (2012) noted how inadequate some of the indicators for national to subnational ecosystem assessment are, as they do not convey useful information, can be of poor quality, or have significant data limitations. Credibility, saliency, and legitimacy are key criteria that tend to be applied a posteriori to check if the selected indicators are properly interpreted and fit-for-purpose (Heink et al., 2015; van Oudenhoven et al., 2018). In many instances, the indicators were based on existing data that is routinely collected for other purposes, rather than appropriate for the context. This often means the selected indicators are not necessarily fit-for-purpose, as they do not adequately reflect the relationship that is important for a decision or important to track for a given context.
In this paper, we first review the literature on processes or guidelines developed to identify fit-for-purpose indicators linking nature to human wellbeing. We then propose a process to design these indicators which is the main purpose of the paper before applying the process to the natural hazard regulation and housing domain relationship, as an example, in a New Zealand context. Finally, we discuss lessons learned, limitations, improvement opportunities and application for policy.
2 Materials and methods
2.1 Insights from a literature review
We conducted a literature review based on publications found through Google Scholar. Google scholar was used so we could also capture the grey literature. The keyword search terms, used in different combinations, were “process”, “development”, “ecosystem services” or “Nature’s contributions to people”, and “wellbeing”. To help focus the search we stipulated that “indicator” was part of the title of the publication: “intitle: indicators OR intitle:indicator”.
The search returned about 3,990 articles (as of January 2023). We focused the review on the top 100 articles. The abstracts of these articles were scanned, and a paper was retained if the scope discussed how indicators were designed and identified. We then removed any publication looking at processes to select existing indicators or design composite indicators from existing data.
Based on our selection criteria, we found 16 of the top 100 papers were related to describing a process to define indicators (Table 1). The other publications tended to either be a data-driven selection of existing indicators or an analytical study using ES/NCP indicators.

TABLE 1. List of papers selected for the literature review.
For all selected publications, the indicator design processes had similar points of consideration. The first point commonly noted is identifying the target audience (Brown et al., 2014) and key purpose for the indicators (Brown et al., 2014; Berghöfer and Schneider, 2015), especially where indicators were context specific. Most processes described setting principles to help guide the conversation through a set of questions related to linkages between environmental and social outcomes.
The second point is the choice of a conceptual framework (Boyd et al., 2015). A conceptual framework can help identify beneficiaries affected by changes in ecosystems and direct vs. indirect linkages to human welfare. Conceptual frameworks mainly use ecosystem classifications such as the MEA or the TEEB (Hattam et al., 2015; Dale et al., 2018; Alba-Patiño et al., 2021), the cascade model (Ringold et al., 2013; Brown et al., 2014; Atkins et al., 2015; Berghöfer and Schneider, 2015; Boyd et al., 2015; Bryce et al., 2016; Müller et al., 2016; Yu et al., 2017; Olander et al., 2018; Krellenberg et al., 2021), or participatory approaches driven by stakeholders (Ringold et al., 2009; Loomis and Paterson, 2014; Drobnik et al., 2018; Luján Soto et al., 2020).
The third point is that processes tended to separate the supply of ES/NCPs from the demand of ES/NCPs. Five out of the 16 papers also started identifying indicators from a human wellbeing perspective using stated-preference or survey techniques.
These three commonly noted points from the literature review were embedded in the indicator design process we developed and are proposing as an approach to define indicators that track the relationships between nature and wellbeing.
2.2 Designing fit-for-purpose indicators
2.2.1 Participatory process
The indicator design process we propose is a participatory approach, intending to involve a range of stakeholders and decision-makers. While there is a range of decision-makers, for this exercise, we targeted the main national policy agency in New Zealand (Ministry for the Environment) but acknowledge that the design process could be adapted to other types of decision-makers (Table 2). This participatory and co-produced process was aimed at enabling stakeholders to be an integral part of the indicator design process and ensuring the indicators would meet stakeholder needs. The three-stage indicator design process involves: Stage 1) framing the conceptual basis of the relationship between wellbeing and nature using ES/NCP; Stage 2) assessing the impact of each ES/NCP on each wellbeing domain to prioritize efforts; Stage 3) designing fit-for-purpose indicators for use in decision making. In the framing step, systematic, easy to communicate and/or commonly used ES/NCP and wellbeing frameworks are chosen to ensure terminology is well understood and all aspects of both wellbeing and ES/NCP are well represented. The prioritization step aims to identify the most relevant ES/NCP for each wellbeing domain for consideration in designing fit-for-purpose indicators. Ausseil et al. (2022) described the application of stages 1 and 2 in more detail. This paper focuses on the last stage, stage 3, to design fit-for-purpose indicators to support decision making processes.
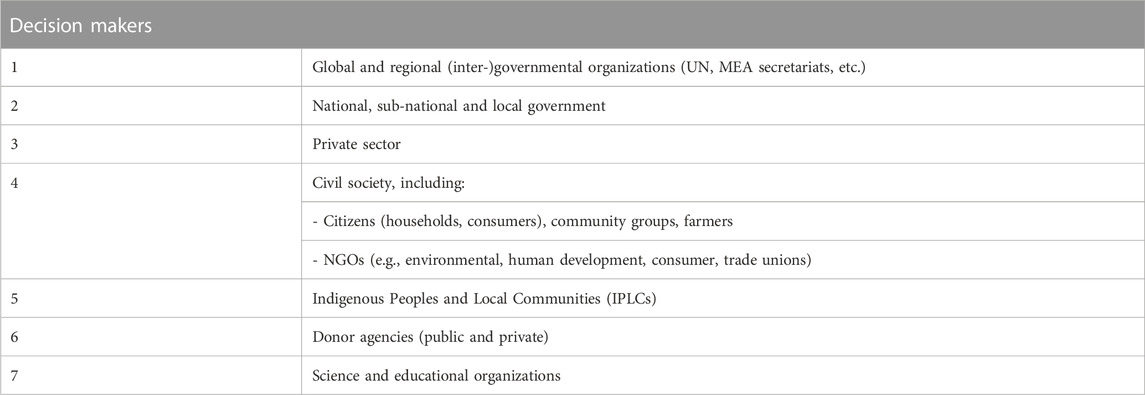
TABLE 2. List of decision-makers (Razzaque et al., 2019).
The process to identify fit-for-purpose indicators for stage 3 was formulated, tested, and refined in two workshops in May and June 2021 with nine scientists and policy advisors from New Zealand’s Ministry for the Environment.2 All participants had backgrounds in environmental management, with expertise in policy, environmental sciences, conservation, agriculture, or economics. We did not have any representatives from an indigenous knowledge perspective, which is a gap that should be filled through future research. The number and skillset of participants reflects the restricted availability of staff, but also our focus on a small audience of practitioners for in-depth testing. The process could also be undertaken in workshop settings with a wider group of stakeholders, and this would be recommended especially where decisions are likely to be contentious with stakeholders having different viewpoints. The research process was given Manaaki Whenua–Landcare Research social ethics approval (Number 2122/8), which is based on the New Zealand Association of Social Science Research code of ethics.
An initial draft indicator design process was developed based on the authors’ past experiences, as well as past interactions with stakeholders and insights from the literature (Section 2.1). The process included targeted questions to help participants discuss and deliberate the ES/NCP–well-being domain relationship. The first workshop aimed at undertaking a preliminary testing of this draft process flow and comprehensibility as a group. Participants were asked to comment on the flow and if there were any missing questions or refinements to the wording, as well as any ambiguities in the process. The indicator design process was then revised before the second workshop based on this feedback.
The second workshop aimed to test the refined indicator design process. The emphasis was on the applicability and robustness of the process to different ES/NCP–well-being domain relationships, in a range of contexts and types of relationships between nature and wellbeing. We regularly checked in with the participants to reflect on the flow of the process and the questions to see if they were generating the types of conversations and deliberation needed to identify fit-for-purpose indicators with causal links between ES/NCP and wellbeing.
2.2.2 Indicator design process
As noted in Section 2.1, a conceptual framework can help determine the relationship between an indicator and its purpose. While the cascade between state of the environment and benefit to people can be sequenced into several categories (supply–Benefit–Value), we simplified the indicator categories into supply and benefit, similarly to Mandle et al. (2020). These correspond to the ‘Impact’ category from the Driver-Pressure-State-Impact-Response framework and align well with the notion of ES/NCP to describe nature–well-being connections (Figure 1). We defined supply of an ES/NCP as representing the ability of nature to contribute to wellbeing through well-functioning ecosystems. Aspects such as accessibility (e.g., road access to a recreational area) and anthropogenic assets (e.g., infrastructure and machinery to harvest crops) may affect the potential supply of an ES/NCP. The benefit reflects an explicit beneficial or detrimental change in human wellbeing and in what people value in relation to a change in each ES/NCP. The benefit may be affected by anthropogenic and natural substitutes available and the vulnerability of different groups (e.g., socio-economic sectors or communities) to a change in an ES/NCP. To help with the design of supply and benefit indicator(s), it is also important to reflect on the state of the natural system (i.e., air, land, marine or freshwater) that is either a provider or source for the ES/NCP, or a receiving environment. For instance, air regulation is provided by vegetation through cleaning processes, but it is the state of the air that will change because of the provision of that service.
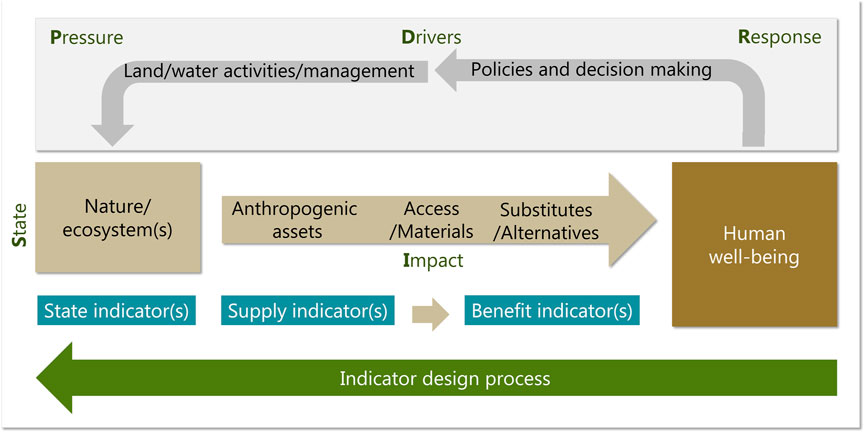
FIGURE 1. Pressure-state-impact-response diagram and indicator design process. Drivers are the phenomena that provide context for changing pressures (e.g., economics, population growth), pressures are the direct natural or human influences that can explain changes in the state, state is the physical, chemical and biological characteristics of the environment and how these change over time, impacts are the consequences of changes in the state of the environment and responses are the actions taken by institutions, government, and communities.
The indicator design process was framed around the desired outcomes (i.e., benefits) from improving the relationship between wellbeing and nature (Figure 2). The process takes an anthropocentric approach that starts from a decision makers perspective on wellbeing, where wellbeing is divided into different wellbeing domains to reflect the multiple aspects of human wellbeing. There are different ways to describe human wellbeing. In New Zealand, the Treasury (2019) divided wellbeing into twelve domains: health, time use, safety and security, income and consumption, jobs and earnings, environmental quality, housing, knowledge and skills, social connection, subjective wellbeing, cultural identity and civic engagement and governance.
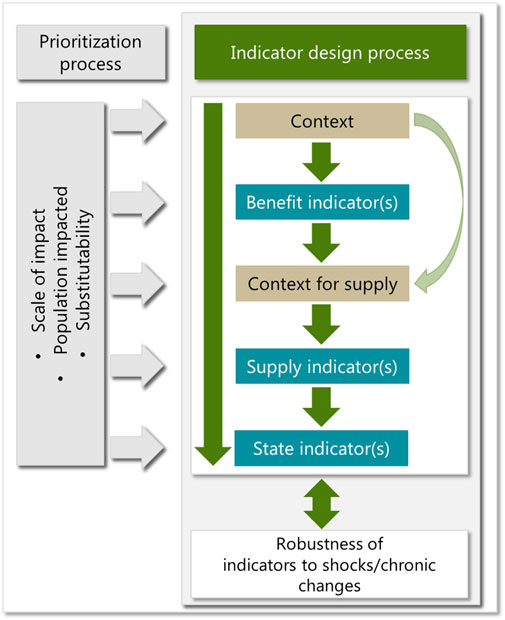
FIGURE 2. Outline of the indicator design process. The prioritization process is detailed in Ausseil et al. (2022).
We developed six steps for the design process and applied them in a New Zealand context, with a series of questions to guide each step (Table 3). A prioritization process outlined in Ausseil et al. (2022) was used to identify those ES/NCPs that affect each wellbeing domain. This is to reduce the resources required to identify a set of fit-for-purpose indicators that reflect nature’s relationship with human wellbeing.
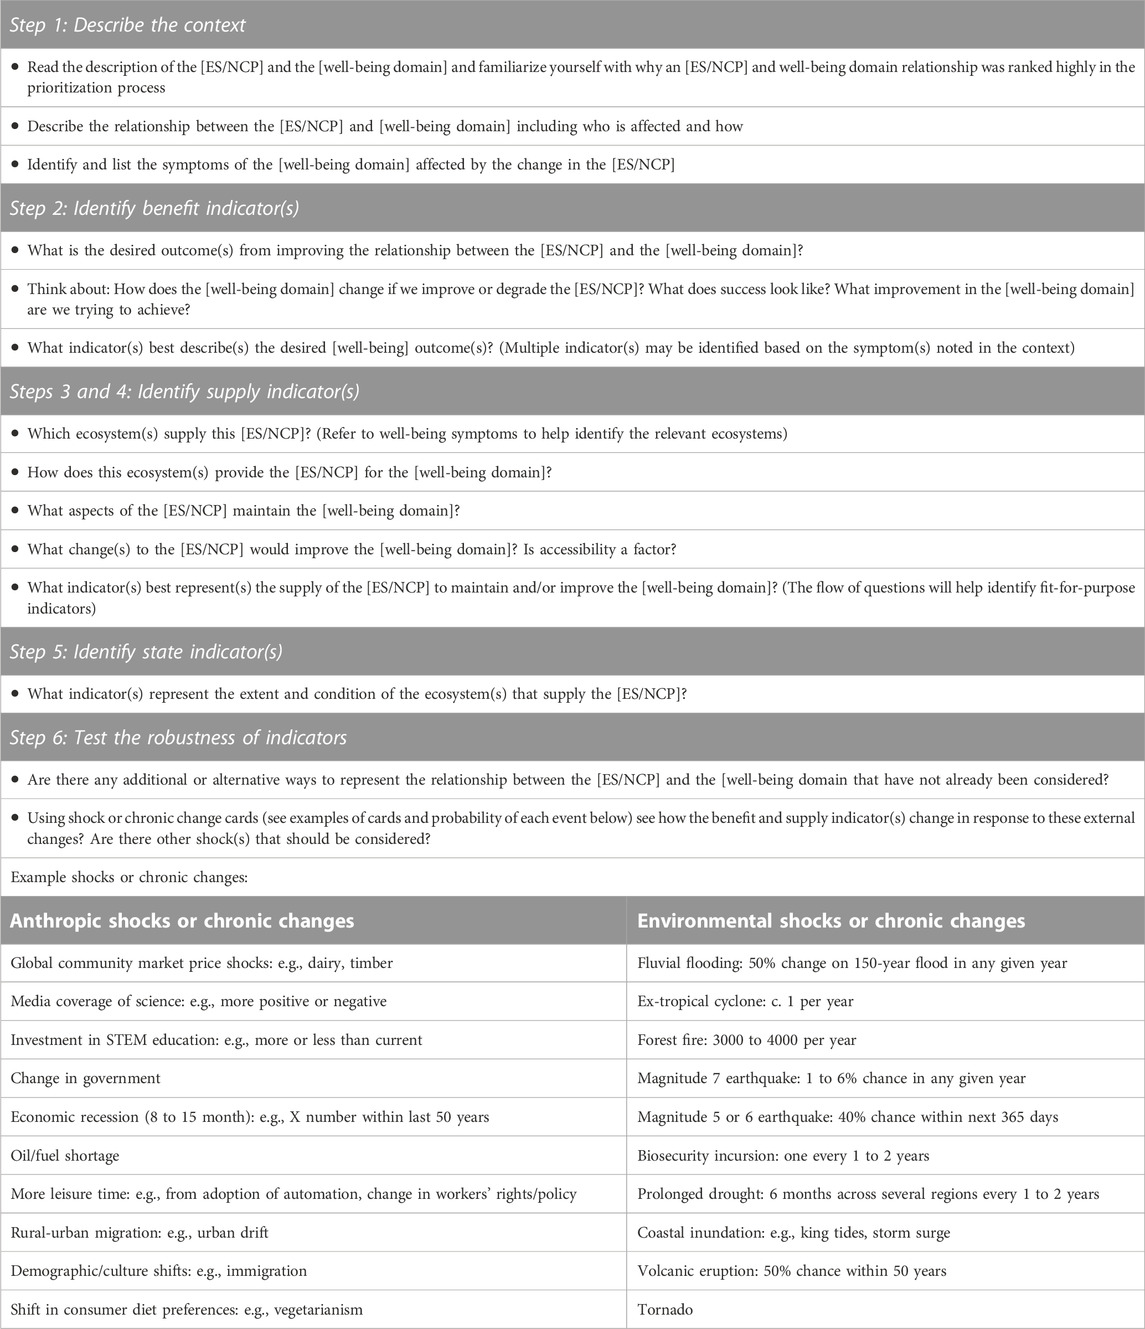
TABLE 3. Guiding questions for the indicator design.
Using a participatory approach, the six steps for designing fit-for-purpose indicators are:
1. Benefit indicator: Describe the context for how the ES/NCP affects the wellbeing domain. In this step, decision makers first familiarize themselves with the definition of the ES/NCP and the wellbeing domain before starting to describe the relationship. This includes noting who is impacted by changes in the ES/NCP for that wellbeing domain and how. Describing the relationship also means identifying symptoms, i.e., features that demonstrate changes in the wellbeing domain due to change(s) (both positive and negative) in the ES/NCP. It may be helpful to narrow down the specific aspect of an ES/NCP (e.g., flood and/or fire could be the issue for natural hazard regulation) and the wellbeing domain focus.
2. Benefit indicator: Identify the benefit indicator(s). Benefit indicator(s) reflect the desired outcome from improving the relationship between the ES/NCP and wellbeing domain. The symptoms described in Step 1 are helpful for identifying the benefits and appropriate indicators.
3. Supply indicator: Describe the context for how the supply of the ES/NCP affects the wellbeing domain. In preparation for selecting supply indicators, decision makers now familiarize themselves with what ecosystem(s) supply the ES/NCP and how the ecosystem(s) provide the ES/NCP for the wellbeing domain. Being explicit about the ecosystem(s) (e.g., forests) providing the ES/NCP and whose wellbeing is being affected (e.g., population next to forests) is needed to identify fit-for-purpose indicators.
4. Supply indicator: Identify the supply indicator(s). Supply indicator(s) reflect the ecosystem process (es) that drive a change in the ES/NCP that affects the wellbeing domain. Accessibility to the ES/NCP should also be considered. The prioritization process and the context for the benefit indicators (Step 1) can provide insights to the ecosystem(s) and the relationship between the ecosystem(s) and the wellbeing domain.
5. State indicator: Identify the state indicator(s). State indicator(s) describe the condition and extent of the ecosystem(s) providing or supplying the ES/NCP.
6. Test the sensitivity of indicators. The benefit, supply and state indicators identified during the process are tested for robustness using a series of potential and plausible environmental, social, and economic shocks or chronic changes e.g., what would happen to the ES/NCP–well-being domain if there was an earthquake, forest fire, change in government, or shift in consumer preferences. For each shock or chronic change, participants are encouraged to discuss whether it has any relevance to the wellbeing or ES/NCP and how effectively the identified indicators are expected to respond. If the indicator is not responsive to changes in the ES/NCP–well-being domain relationship, then the indicator choice should be revisited. There may also be a temporal element to some indicators that should be documented during the design process. For example, some indicators may be more relevant in the future than in the present as they may be responsive to emerging trends such as changes in societal preferences.
2.3 Approach to applying the indicator design process in New Zealand
To test the indicator design process, we used the New Zealand Treasury’s Living Standards Framework (LSF) wellbeing domains. The LSF was developed by the New Zealand Treasury to help inform its advice to government (The Treasury, 2019). It is based on the OECD wellbeing framework and reflects people’s wellbeing or the ‘capability of people to live lives that they have reason to value.’ The twelve domains of the LSF define current wellbeing based on broad topics around health, security, social relations, freedom of choice, environmental quality and material conditions.
For the workshops and this paper, we used the MEA definitions of ecosystem services (Millennium Ecosystem Service Assessment, 2005) as the ES/NCP classification to describe the different elements of nature. The indicator design process was tested using a subset of ES/NCP–well-being domain relationships from the prioritization process outlined in Ausseil et al. (2022). We tested several ES–well-being domain relationships. The chosen relationships tested were based on potential interest to participants (i.e., staff from New Zealand’s Ministry for the Environment).
Before the first workshop the draft indicator design process was applied to the air quality regulation–health domain and ethical and spiritual services–health domain relationships by two of this paper’s authors to determine the practicality and feasibility of the process. In the first workshop participants tested a refined process on:
- the natural hazard regulation–housing domain,
- water purification–health domain and,
- recreation and eco-tourism service–cultural identity domain.
In the second workshop, participants tested a further refined process on:
- the natural hazard regulation–personal security domain,
- water purification–civic engagement and governance domain,
- food and fibre services–jobs and earnings domain, and
- wild foods–skills and knowledge domain.
We present the results from the natural hazard regulation–housing domain relationship as an example to demonstrate the application of the indicator design process. The eight other examples of different ES/NCP–well-being relationships are provided in the supplementary materials. Participant feedback was that greater specificity on the components of either the ecosystem providing the benefit, spatial scales, or scope of the ES/NCP (e.g., floods and fire for natural hazard regulation) or the aspect of wellbeing domain in question enabled more meaningful discussions. The specific component of the ecosystem service or the wellbeing domain were selected by participants depending on their policy focus at the time. For instance, flood regulation and fire mitigation were the specific components chosen as the focus for natural hazard regulation. Housing is defined by the Treasury as “the quality, suitability, and affordability of the homes we live in”. In our case, participants chose to focus on housing quality, in relation to its vulnerability and resilience to hazards. Our indicator design process (Figure 2) was then applied to this ES–well-being domain relationship (Table 3).
3 Applying the indicator design process
3.1 Example: natural hazard regulation and housing domain
Natural hazard regulation directly impacts housing quality and suitability and has both localized and widespread impacts. Housing is affected by flooding and fire, which are components of natural hazard regulation, through losses or damage to property, and increase in rates,3 insurance or other costs related to the need for protection should this ES decline (Panel A in Table 4). Improved regulation of flooding and fire benefits housing by reducing risks, number of damaged houses or number of people exposed to these hazards, and by greater housing affordability (Panel B in Table 4). These benefits translate into indicators such as the number of vulnerable houses in a flood risk zone, or number of houses resilient to flooding in a flood-prone zone. Another indicator relates to the change in insurance flood premium costs over time. Underpinning these indicators is the number and size of flood-risk zones.

TABLE 4. An example of process and indicators identified to describe and track changes in the natural hazard regulation–housing domain relationship.
Mixed-species forest, wetlands, upland forest, mangroves, coastal vegetation, and riverine vegetation were all identified as providing regulating services for floods and/or fire (Panel C in Table 4). Increases in mixed-species forests and decreases in flammable underbrush provide more resistance to fire. Forest area and diversity can increase through anthropogenic interventions and bird-mediated seed dispersal (Panel D in Table 4). Thus, changes in fire management regimes and land management close to housing in a fire-risk zone would be good indicators of the supply of the fire regulating service. Similarly, fully functioning wetlands, upland forest/vegetation, mangroves, coastal vegetation, and riverine vegetation have greater capacity to slow down and retain water than most other ecosystems, retarding and changing the hydrological response and residence time of water at catchment scale during storm events and storm surges. Changes in surface water flow velocity, changes in river height, changes in hydrological residence time related to land cover change in a catchment, and distance upstream from the coast are all supply-side indicators that capture these relationships. Another pathway for ecosystems to provide flood regulation is through an increase in anthropogenic ways to capture rain in urban areas to reduce runoff during heavy rainfall such as rain gardens, tanks, swales, and water-sensitive urban design. While many of the other indicators also capture the impacts of urbanization on surface water retention and residence time, change in the spatial permeability is an additional indicator that directly captures the supply of these types of flood regulation services in urban areas.
Following on from supply, indicators for the state of ecosystem(s) that support flood and fire regulation for housing quality are discussed (Panel E in Table 4). The flow of mixed-species forests, fire-resilient forests, water retention and water velocity are measured through the supply indicators. However, the state of these forests is measured by the extent and condition of flammable/inflammable vegetation close to housing (in a fire-risk zone), species composition, change in inflammable vegetation that protects houses from summer prevailing wind, and change in forest understory to reduce fuel for fire. The state of ecosystems that support flood regulation is measured by the extent and condition of ecosystems that retard water flow, extent of impervious surfaces, and condition and permeability of the catchment soils.
Finally, the responsiveness of these indicators to various external shocks or chronic changes was discussed (Panel F in Table 4). In general, it was found that a change in land use or land cover resulting from a shock (e.g., shift in dietary preferences) might change the condition, extent, supply, and benefit from natural hazard regulation for housing.
3.2 Insights into the effective application of the indicator design process
Several insights arose through the testing phase related to the application of the process and engagement strategy with stakeholders and participants:
3.2.1 Start the process with the benefits
Our draft indicator design process started with identifying which ecosystem(s) are affected for a given ES/NCP–well-being domain relationship, i.e., explored the state of ecosystems, then the supply of ES/NCP from those ecosystems and then the benefits. However, we found participants quickly fell into focusing on familiar areas: ES/NCP supply and state indicators, and knowledge about the availability of data. Commencing the process with state and supply indicators did not enable them to think about how to fill the gap in benefit indicators and constrained their ability to focus on the causal links for the relevant ES/NCP–well-being. We also found participants sometimes struggled to separate supply and state indicators. As a result, we reversed the steps to focus first on the benefits of improving the ES/NCP and the subsequent impact on the wellbeing domain. This focused the participant’s attention on the relational aspect of ES/NCP–well-being and kept it for subsequent steps. Feedbacks from participants demonstrated that starting with symptoms not only kept the focus on the benefits to people, but also enabled us to streamline and shorten the question prompts, confirming the amendment to the overall structure (benefit, supply then state). In summary, the testing process showed that starting from the benefit indicator(s) better maintained the focus of the discussion on the wellbeing domain; this essentially reversed the more common flow found in the literature review.
3.2.2 Break the wellbeing domain and ES/NCP into different components
We started a generic discussion on the ES/NCP and the wellbeing domain but quickly asked the group to identify key aspects of the relationship to enable more in-depth discussions. To facilitate the benefits discussion, we found participants were able to better engage around benefits when asked to break down the benefits by diverse groups of people experiencing similar effects or impacts. The scale issue of local versus national representation was still challenging, especially for participants with responsibilities to guide policy development and implementation at a national level. Identifying the “who” is affected was highlighted as an important part of the process.
3.2.3 Note the overlaps with other ES/NCP–well-being domain relationships
While exploring the one-to-one relationship between an ES/NCP and a wellbeing domain is a simplification of the world’s view and overlooks the complexities that exist, our process did not prevent participants from recognizing and highlighting synergies and complementarities with other ES/NCP and wellbeing domains. These were documented but discipline was needed through facilitation to maintain focus on the specific relationship being discussed. In many instances, multiple indicators were deemed important and were needed to adequately describe the relationship between an ES/NCP and a wellbeing domain (Table 3).
3.2.4 Diversity in participants is important
Despite the relatively small participant group, it quickly became apparent that different ideological and disciplinary backgrounds enabled richer yet more grounded discussions on the ES/NCP–well-being relationships. This reinforced the value of using inclusive processes with participants from diverse backgrounds and knowledge sets. Indigenous knowledge, which was not adequately represented in our selected participants, was noted as providing another important perspective on the relationship between an ES/NCP and a wellbeing domain, especially for the benefit and supply indicators.
3.2.5 Use the five human senses to help describe the benefits
We observed during our process that direct outcomes often linked to our senses (smell, vision, audition, taste, and touch), and this was a useful way to connect direct benefits outcomes to wellbeing (explored further in the Supplementary Material). Indicators based on the senses are typically easier to understand and communicate to a lay audience (Boyd et al., 2015).
3.2.6 Use sensitivity test to check agility and suitability of indicators
Shocks or chronic changes, based on existing and potential future disruptors, enabled participants to test the validity of the indicators they had identified and to ensure they were legitimate, salient, and credible indicators for a specific ES/NCP–well-being domain relationship (van Oudenhoven et al., 2018). Feasibility, scalability, and monitoring over time are further considerations that would need to be looked at, although this is not the purpose of this paper. In terms of the shocks or chronic changes themselves, we also noted the importance of tailoring them to the temporal context. For example, king tides are relatively common in New Zealand, but tsunamis rarely happen. Therefore, we used king tides rather than tsunamis as a shock to ensure that the indicator was responsive to those more likely events. We also found the shocks needed to cover the unexpected events, such as natural disasters, and more chronic changes like technology innovation, market changes, consumer preferences or government policy.
3.2.7 The process highlighted knowledge gaps
Focusing the discussion on fit-for-purpose indicators highlighted the suitability of current information, data gaps and data investment needs. Our participants, who had policy backgrounds, often found themselves reverting to indicators or data they knew already existed. However, careful facilitation enabled the participants to identify new fit-for-purpose indicators and created space for the participants to determine how new data could be sourced and, more importantly, how existing data could be used differently to provide the type of information needed to populate an indicator.
3.3 Limitations and future improvements
While the logic chain from benefit–supply–state is useful to help understand the connections between most aspects of nature and wellbeing, we found during testing that there may be some instances where the causal relationship between supply of an ES/NCP and a wellbeing benefit may be weak (e.g., water purification for improving civic engagement and governance). By applying the indicator design process, we were able to identify this inadequacy in the cascade approach from benefit to supply, showing that some relationships may be too distant and require further investigation. It also shows the importance of having clear definitions of wellbeing aspects. For example, a revised version of the Treasury’s Living Standards Framework which we used to inform our wellbeing domains has been released since our project’s inception (The Treasury, 2021b). “Civic engagement and governance” is now focusing only on the capability of individuals to have a voice on issues of the day such as climate change. Qualities related to societal governance have been captured in another level of the framework. Modifications such as these could help improve the process and target discussion towards a better pathway in identifying the indicators.
We used a uni-directional and linear approach, yet taking a more circular approach may result in different evaluation metrics to assess inter-relationships between human wellbeing and nature. He Ara Waiora (The Treasury, 2021a) for example, uses a māori worldview to conceptualise wellbeing, putting values, belief and practices (Wairua) and nature (te Taiao) at the centre, with measures of means (what approaches we need to achieve the ends) and ends (what outcomes are important) for human wellbeing in the outer circles. To implement He Ara Waiora, McMeeking et al. (2019) suggested a suite of indicators based on outcomes and value-based approaches, thus reflecting our logic to start with people. Raworth (2017) has popularised the concept of doughnut economics. It recognises that wellbeing depends on ‘enabling every person to lead a life of dignity and opportunity while safeguarding the integrity of Earth’s life supporting systems’. It combines two concentric radar charts to reflect social foundation (with twelve social indicators) bounded by planetary boundaries defined by ecological indicators. Linkages between the social and ecological indicators are implicit rather than explicit, possibly reflecting that a process to design indicators using circular concepts may be harder to articulate.
The question of the ES/NCP–well-being relationship and its currency now and into the future was also raised in the workshops. Applying the sensitivity test showed that some relationships may change over time, and therefore indicators may need to be adapted in the future. Challenges for refining the indicator design process include consideration of current versus future needs to maintain/improve a wellbeing domain, and testing whether indicators can/should remain the same over time, e.g., in the face of slow-onset changes from climate change. Using a risk assessment approach with hazard, exposure, and vulnerability characteristics (Connelly et al., 2018) may be useful for some relationships. However, differences between perceived and actual risk (i.e., the perception of insecurity to flooding may increase, while the actual exposure to risk of flood may decrease) may still be a challenge for identifying fit-for-purpose indicators. Future improvements should therefore consider how to include resilience to future climate change and clarify the actual vs. perceived nature of indicators.
Another question that arose was around natural vs. anthropogenic assets. Measuring the flow of an ES/NCP from nature and how it affects a wellbeing domain may be hindered by a man-made substitute for that ES/NCP. Our participants did not resolve this issue and the decision on how to address it may be an ideological issue that each indicator design process should acknowledge with participants in the design process and agree on the stance to be taken.
Boyd et al. (2015) raised the question of the value of aggregated vs. disaggregated indicators, suggesting that disaggregated indicators tend to be more relevant to scientific experts, compared with aggregated indicators being more relevant to laypersons. For instance, a well-designed index may be able to convey the complexity of ecosystem and cultural values (Harmsworth et al., 2011). However, while aggregations may provide a general overview, they may not convey the outliers and extremes in the data. The question of aggregation remains to be tested in our process, since the ES/NCP–well-being relationship is not a one-to-one relationship and there may be value in aggregating over multiple wellbeing domains. Consensus is also needed on the process of aggregation (Abenayake et al., 2018; Drobnik et al., 2018). For future implementation, agreement should be reached on the level of aggregation to use through wide consultation and endorsement by government agencies on direction to take. As we acknowledge the limitations of the one-to-one relationship, further work should also be undertaken to map out the multiple causal links and decide whether a level of aggregation is necessary to facilitate decision-making and ease of communication.
The unit of measure for an indicator also requires further investigation. For example, a relative change indicator provides a unitless measure, but may also complicate any trend analysis as it is sensitive to the selected reference conditions (Ausseil et al., 2013; Boyd et al., 2015). Thresholds could be used alongside relative change indicators to categorize and improve the communication of the indicator. Spatial and temporal aspects of indicators are another aspect worthy of further consideration. For instance, during our workshop deliberations on natural hazard regulation, it was noted that indicators that relied on rare but extreme events may only partially capture the relationship between the ES/NCP and the wellbeing domain. Similarly, benefit indicators may also need to reflect specific timings (e.g., ability to swim during summer but not during the winter when most flood events occur) or spatial specificities pertaining to different stakeholder groups.
4 Implications for policy
4.1 National and international reporting
In New Zealand, the Ministry for the Environment has a legal requirement to report on the state of the environment using pressure, state, and impact indicators. Earlier research found there was a lack of “impact” indicators (Ausseil et al., 2021). Our process provides a conceptual framework and a structured approach to identify new data needs and enable its collection. To help narrow the potentially long list of indicators needed, prioritizing the relationships between nature and wellbeing as described in Ausseil et al. (2022) creates a process to identify those relationships most important for a particular decision, and a pathway to fill gaps in priority order.
Indicators identified and developed based on our indicator design process could also be used to provide evidence for national-level reporting on the progress against international commitments such as the Sustainable Development Goals (SDG). Biodiversity targets have interdependencies, thus having relevant and linking indicators to support both ecological and socio-economic dimensions will help (Perrings et al., 2011). To date, New Zealand’s reports against the SDGs (New Zealand Ministry of Foreign Affairs and Trade, 2019) or the now superseded Aichi Targets (Department of Conservation, 2019) have largely been informed by qualitative narratives, with few indicators. The Aotearoa New Zealand Biodiversity Strategy (Te Mana o te Taiao, Department of Conservation, 2020) provides an opportunity to design and implement national indicators aligned to the Kunming-Montreal Global Biodiversity Framework that set targets for nature’s contributions to people (target 11). The Indicators Aotearoa New Zealand (Statistics New Zealand, 2019) from Statistics New Zealand would also benefit from designed fit-for-purpose indicators that could then inform what data should be collected to productionise them.
Following a policy cycle (EU, 2021), designing a purposeful suite of nature–well-being indicators for monitoring could be beneficial for:
4.2 Policy design
A major resource management reform aiming to prevent further degradation of ecological integrity of the natural environment and protect human health is currently under way in New Zealand. The effectiveness of these new policies and their implementation will need to be assessed and monitored. Creating fit-for-purpose indicators to track the relationship between the state of ecological integrity and its impact on human wellbeing including health should enable a better understanding of the causal linkages. It can also help identify the characteristics (and associated indicators) of the natural environment that need to be managed through environmental limits to maintain or improve ecological integrity and protect human health, as described in the proposed new legislation (https://www.legislation.govt.nz/bill/government/2022/0186/latest/LMS501892.html).
4.3 Policy delivery
A better understanding of the cascading and causal chain of impacts of anthropogenic changes on ecosystems, ES/NCP and wellbeing is essential to monitoring progress towards management actions and policy objectives. For instance, those investing in adaptation to climate change are increasingly asked for monitoring and reporting indicators to track progress in the level of adaptation achieved (Hammill et al., 2014). If one objective was to link future heatwaves to a wellbeing outcome (e.g., maintain physical health) a possible indicator following our process could include the number of vulnerable urban people at risk of heat stress. By focusing on risks to people, more targeted nature-based adaptation interventions could be identified and implemented, in this case, the extent of greenspaces or woody vegetation in urban areas, for its ability to regulate air temperature.
4.4 Policy or programme review
Clarifying the relationship between nature and wellbeing provides an opportunity for transparent and informed decisions around investment priorities and better evaluation of progress towards outcomes (Parliamentary Commissioner for the Environment, 2021). To support New Zealand’s economic recovery from the impacts of COVID-19, the New Zealand Government invested in a NZ$1.219 billion in the Jobs for Nature programme.4 The programme aimed to create jobs, and ensure enduring benefits for healthy waterways, biodiversity, and climate change mitigation. The indicator design process outlined in this paper could help evaluate progress toward programme benefits for both people and nature and enable more targeted future investment.
5 Conclusion
As noted by New Zealand’s Parliamentary Commissioner for the Environment (2019), the indicators and data needed to understand the true state and value of New Zealand’s natural environment are woefully inadequate. Our research provides a sound methodology and process to tackle the challenge to link nature and its contribution to people’s wellbeing. More investment and efficiency are needed to collect data. An important next step in this journey will be to identify what new data is needed for wellbeing (benefit), supply and state indicators. An assessment on how existing data can be supplemented and used differently is also needed to better track linkages on how changes in nature are impacting on the wellbeing of our society. Moreover, data visualisation will also be an important tool (i.e., the use of maps to reflect spatial variability or diagrams) to help decision making in planning interventions for increasing resilience (of ecosystems and human societies) to abrupt and long-term changes caused by climate change and other drivers of change.
Nations other than New Zealand might sit in a similar situation where ill-suited data and indicators are re-used outside their primary purposes, but do not have the ability to track actual chain of impacts that may be occurring. This inhibits societies’ good decision-making as the real extent of the issues may not be known or misjudged. Most importantly, with the rate of change only increasing, fit-for-purpose indicators are becoming crucial enablers to evaluate the effectiveness of our interventions and adapt adequately in response to changes in our natural world.
Data availability statement
The original contributions presented in the study are included in the article/supplementary material, further inquiries can be directed to the corresponding author.
Author contributions
A-GEA, SG, PB, and AC wrote the manuscript. A-GEA, AC, and SG coordinated the study. A-GEA, PB, OS, and SG contributed to the analysis. AC provided review, writing, and editing input. All authors contributed to the article and approved the submitted version.
Funding
This research was supported by Manaaki Whenua–Landcare Research Strategic Science Investment Funding for Crown Research Institutes.
Acknowledgments
The authors would like to acknowledge the workshop participants from the Ministry for the Environment (Carla Gomez, Pierre Tellier, Constance Nutsford, Stephen Fragazsy, Carl Howarth), who generously gave their time to and critique of the process and to Dan Richards (Manaaki Whenua–Landcare Research) for his insightful comments on the manuscript. We would also like to acknowledge the Office of the Prime Minister’s Chief Science Advisor for hosting Anne-Gaelle Ausseil as a senior fellow for this project.
Conflict of interest
The authors declare that the research was conducted in the absence of any commercial or financial relationships that could be construed as a potential conflict of interest.
Publisher’s note
All claims expressed in this article are solely those of the authors and do not necessarily represent those of their affiliated organizations, or those of the publisher, the editors and the reviewers. Any product that may be evaluated in this article, or claim that may be made by its manufacturer, is not guaranteed or endorsed by the publisher.
Footnotes
1https://www.cbd.int/doc/c/3190/c3f4/1d9fe2d2dedc8c8b97023750/id-om-2022-01-02-en.pdf
2A version of the indicator design process was proposed during the first phase of prioritization process workshops which took place in February 2020 with 20 stakeholders from New Zealand’s central government agencies covering the environment, statistics, conservation, treasury, and the primary production sectors. The results from that prioritization process workshop are in described in Ausseil et al. (2022) and the preliminary results from indicator design portion of the workshop are described in a technical report (Ausseil et al., 2021). This paper presents the results from the two workshops held specially on the indicator design process in mid-2021. The nine participants were all part of the first phase for continuity.
3Rates in New Zealand are a legislated charge against an owner’s property and are set by local and regional government or councils. Rates are used to pay for services used by all people in a district or regional and are assessed for every urban household, lifestyle unit, commercial, industrial, and rural property each year.
4https://environment.govt.nz/what-government-is-doing/areas-of-work/jobs-for-nature/#:∼:text=Jobs%20for%20Nature%20is%20a,to%20run%20for%20four%20years
References
Abenayake, C. C., Mikami, Y., Matsuda, Y., and Jayasinghe, A. (2018). Ecosystem services-based composite indicator for assessing community resilience to floods. Environ. Dev. 27, 34–46. doi:10.1016/j.envdev.2018.08.002
Alba-Patiño, D., Carabassa, V., Castro, H., Gutiérrez-Briceño, I., García-Llorente, M., Giagnocavo, C., et al. (2021). Social indicators of ecosystem restoration for enhancing human well-being. Resour. Conserv. Recycl. 174, 105782. doi:10.1016/j.resconrec.2021.105782
Atkins, J. P., Burdon, D., and Elliott, M. (2015). “Chapter 5: identification of a practicable set of ecosystem indicators for coastal and marine ecosystem services,” in Coastal zones ecosystem services: from science to values and decision making. Editors R. K. Turner, and M. Schaafsma (Norwich, UK: Springer), 79–102.
Ausseil, A. E., Collins, A., Greenhalgh, S., Booth, P., and Samarasinghe, O. (2021). Environmental stewardship and well-being. Wellington, New Zealand. Available at: https://www.landcareresearch.co.nz/uploads/public/Publications/Working-papers-and-reports/LC3901_TechnicalReport.pdf?vid=7. Manaaki Whenua Landcare Research Contract report LC3901.
Ausseil, A. E., Dymond, J. R., Kirschbaum, M. U. F., Andrew, R., and Parfitt, R. (2013). Assessment of multiple ecosystem services in New Zealand at the catchment scale. Environ. Model. Softw. 43, 37–48. doi:10.1016/j.envsoft.2013.01.006
Ausseil, A. E., Greenhalgh, S., Booth, P., Lavorel, S., and Collins, A. (2022). A novel approach to identify and prioritize the connections between nature and people’s well-being in New Zealand. Front. Environ. Sci. 10. doi:10.3389/fenvs.2022.782229
Berghöfer, A., and Schneider, A. (2015). Indicators for managing ecosystem services – options and examples. ValuES Project Report. Helmholtz Zentrum für Umweltforschung (UFZ) GmbH, Leipzig, and Deutsche Gesellschaft für Internationale Zusammenarbeit (GIZ) GmbH. Germany: Eschborn, 49.
Boerema, A., Rebelo, A. J., Bodi, M. B., Esler, K. J., and Meire, P. (2017). Are ecosystem services adequately quantified? J. Appl. Ecol. 54, 358–370. doi:10.1111/1365-2664.12696
Boyd, J., Ringold, P., Krupnick, A., Johnston, R. J., Weber, M. A., and Hall, K. (2015). Ecosystem services indicators: improving the linkage between biophysical and economic analyses. Resour. Future Discuss., 15–40. doi:10.2139/ssrn.2662053
Brauman, K. A., Garibaldi, L. A., Polasky, S., Aumeeruddy-thomas, Y., Brancalión, P., DeClerck, F., et al. (2020). Global trends in nature’s contributions to people. PNAS 117, 32799–32805. doi:10.1073/pnas.2010473117
Brown, C., Reyers, B., Ingwall-King, L., Mapendembe, A., Nel, J., O'Farrell, P., et al. (2014). Measuring ecosystem services guidance on developing ecosystem service indicators. Cambridge, UK: UNEP-WCMC. doi:10.13140/RG.2.2.11321.83043
Brown, C., Reyers, B., Ingwall-King, L., Mapendembe, A., Nel, J., O’farrell, P., et al. (2014). Measuring ecosystem services: guidance on developing ecosystem service indicators. Cambridge, UK: UNEP-WCMC. doi:10.34892/ZH2N-1J26
Bryce, R., Irvine, K. N., Church, A., Fish, R., Ranger, S., and Kenter, J. O. (2016). Subjective well-being indicators for large-scale assessment of cultural ecosystem services. Ecosyst. Serv. 21, 258–269. doi:10.1016/j.ecoser.2016.07.015
Connelly, A., Carter, J., Handley, J., and Hincks, S. (2018). Enhancing the practical utility of risk assessments in climate change adaptation. Sustain 10, 1399. doi:10.3390/su10051399
Cruz-Garcia, G. S., Sachet, E., Blundo-Canto, G., Vanegas, M., and Quintero, M. (2017). To what extent have the links between ecosystem services and human well-being been researched in Africa, Asia, and Latin America? Ecosyst. Serv. 25, 201–212. doi:10.1016/j.ecoser.2017.04.005
Czúcz, B., Arany, I., Potschin-Young, M., Bereczki, K., Kertész, M., Kiss, M., et al. (2018). Where concepts meet the real world: a systematic review of ecosystem service indicators and their classification using CICES. Ecosyst. Serv. 29, 145–157. doi:10.1016/j.ecoser.2017.11.018
Czúcz, B., Haines-Young, R., Kiss, M., Bereczki, K., Kertész, M., Vári, Á., et al. (2020). Ecosystem service indicators along the cascade: how do assessment and mapping studies position their indicators? Ecol. Indic. 118, 106729. doi:10.1016/j.ecolind.2020.106729
Dale, V. H., Kline, K. L., Richard, T. L., Karlen, D. L., and Belden, W. W. (2018). Bridging biofuel sustainability indicators and ecosystem services through stakeholder engagement. Biomass Bioenergy 114, 143–156. doi:10.1016/j.biombioe.2017.09.016
Department of Conservation (2019). New Zealand’s Sixth national report to the united Nations Convention on biological diversity. Reporting period: 2014–2018. Wellington: Department of Conservation.
Department of Conservation (2020). Te Mana o te Taiao: aotearoa New Zealand Biodiveristy strategy 2020. Wellington: Department of Conservation.
Díaz, S., Pascual, U., Stenseke, M., Martín-López, B., Watson, R. T., Molnár, Z., et al. (2018). Assessing nature’s contributions to people. Science 359 (80), 270–272. doi:10.1126/science.aap8826
IPBES (2019). “Summary for policymakers of the global assessment report on biodiversity and ecosystem services of the Intergovernmental Science-Policy Platform on Biodiversity and Ecosystem Services,” in IPBES secretariat. Editors S. Díaz, J. Settele, E. S. Brondízio, H. T. Ngo, M. Guèze, J. Agardet al. (Bonn, Germany, 56. doi:10.5281/zenodo.3553579
Drobnik, T., Greiner, L., Keller, A., and Grêt-Regamey, A. (2018). Soil quality indicators – from soil functions to ecosystem services. Ecol. Indic. 94, 151–169. doi:10.1016/j.ecolind.2018.06.052
European Union (2021). The role of monitoring and evaluation in the policy cycle. Available at: https://ec.europa.eu/enrd/evaluation/back-basics/role-monitoring-and-evaluation-policy-cycle_en.html (Accessed on July 28, 2023).
Geijzendorffer, I. R., Cohen-Shacham, E., Cord, A. F., Cramer, W., Guerra, C., and Martín-López, B. (2017). Ecosystem services in global sustainability policies. Environ. Sci. Policy 74, 40–48. doi:10.1016/j.envsci.2017.04.017
Haines-Young, R. H., and Potschin, M. (2010). “The links between biodiversity, ecosystem services and human Potschin and Haines-Young,” in Ecosystem Ecology: a new synthesis. BES ecological reviews series, CUP. Editors D. Raffaelli, and C. Frid (Cambridge: Cambridge University Press), 110–139.
Haines-Young, R., Potschin-Young, M., and Czúcz, B. (2018). Report on the use of CICES to identify and characterise the biophysical, social and monetary dimensions of ES assessments. Deliv. D4.2. EU Horiz. 2020 Esmeralda Proj. Grant Agreem., 106. No 642007.
Hammill, A., Dekens, J., Leiter, T., Olivier, J., Klockemann, L., Stock, E., et al. (2014). Repository of adaptation indicators: real case examples from national monitoring and evaluation systems. Bonn, Germany: GmbH.
Harmsworth, G. R., Young, R. G., Walker, D., Clapcott, J. E., and James, T. (2011). Linkages between cultural and scientific indicators of river and stream health. New zeal. J. Mar. Freshw. Res. 45, 423–436. doi:10.1080/00288330.2011.570767
Hattam, C., Böhnke-Henrichs, A., Börger, T., Burdon, D., Hadjimichael, M., Delaney, A., et al. (2015). Integrating methods for ecosystem service assessment and valuation: mixed methods or mixed messages? Ecol. Econ. 120, 126–138. doi:10.1016/j.ecolecon.2015.10.011
Heink, U., Hauck, J., Jax, K., and Sukopp, U. (2016). Requirements for the selection of ecosystem service indicators – the case of MAES indicators. Ecol. Indic. 61, 18–26. doi:10.1016/J.ECOLIND.2015.09.031
Heink, U., Marquard, E., Heubach, K., Jax, K., Kugel, C., Neßhöver, C., et al. (2015). Conceptualizing credibility, relevance and legitimacy for evaluating the effectiveness of science-policy interfaces: challenges and opportunities. Sci. Public Policy 42, 676–689. doi:10.1093/SCIPOL/SCU082
Hole, D. G., Collins, P., Tesfaw, A., Barrera, L., Mascia, M. B., and Turner, W. R. (2022). Make nature’s role visible to achieve the SDGs. Glob. Sustain. 5, e8–e6. doi:10.1017/sus.2022.5
Krellenberg, K., Artmann, M., Stanley, C., and Hecht, R. (2021). What to do in, and what to expect from, urban green spaces – indicator-based approach to assess cultural ecosystem services. Urban For. Urban Green. 59, 126986. doi:10.1016/j.ufug.2021.126986
Layke, C., Mapendembe, A., Brown, C., Walpole, M., and Winn, J. (2012). Indicators from the global and sub-global Millennium Ecosystem Assessments: an analysis and next steps. Ecol. Indic. 17, 77–87. doi:10.1016/j.ecolind.2011.04.025
Loomis, D. K., and Paterson, S. K. (2014). Human dimensions indicators of coastal ecosystem services: a hierarchical perspective. Ecol. Indic. 44, 63–68. doi:10.1016/j.ecolind.2013.12.022
Luján Soto, R., Cuéllar Padilla, M., and de Vente, J. (2020). Participatory selection of soil quality indicators for monitoring the impacts of regenerative agriculture on ecosystem services. Ecosyst. Serv. 45, 101157. doi:10.1016/j.ecoser.2020.101157
Maes, J., Liquete, C., Teller, A., Erhard, M., Paracchini, M. L., Barredo, J. I., et al. (2016). An indicator framework for assessing ecosystem services in support of the EU Biodiversity Strategy to 2020. Ecosyst. Serv. 17, 14–23. doi:10.1016/j.ecoser.2015.10.023
Maes, J., Teller, A., Erhard, M., Liquete, C., Braat, L., Berry, P., et al. (2018). Mapping and Assessment of Ecosystems and their Services: an analytical framework for mapping and assessment of ecosystem condition in EU. Luxembourg: Publications office of the European Union. doi:10.2779/12398
Mandle, L., Shields-Estrada, A., Chaplin-kramer, R., Mitchell, M. G. E., Bremer, L. L., Gourevitch, J. D., et al. (2020). Increasing decision relevance of ecosystem service science. Nat. Sustain. 4, 161–169. doi:10.1038/s41893-020-00625-y
McKenna, T., Blaney, R., Brooker, R. W., Ewing, D. A., Pakeman, R. J., Watkinson, P., et al. (2019). Scotland’s natural capital asset index: tracking nature’s contribution to national well-being. Ecol. Indic. 107, 105645. doi:10.1016/j.ecolind.2019.105645
McMeeking, S., Kahi, H., and Kururangi, K. (2019). Implementing He Ara Waiora in alignment with the living standards framework and Whanau ora. Available at: http://hdl.handle.net/10092/17608.
Millennium Ecosystem Assessment (2005). Ecosystems and human well-being: synthesis. Washington, DC: Island Press.
Mononen, L., Auvinen, A. P., Ahokumpu, A. L., Rönkä, M., Aarras, N., Tolvanen, H., et al. (2016). National ecosystem service indicators: measures of social-ecological sustainability. Ecol. Indic. 61, 27–37. doi:10.1016/J.ECOLIND.2015.03.041
Müller, F., Burkhard, B., Hou, Y., Kruse, M., Ma, L., Wangai, P., et al. (2016). “Indicators for ecosystem services,” in Routledge Handbook of ecosystem services. Editors M. Potschin, R. Haines-Young, R. Fish, and R. K. Turner (London: Routledge), 156–169.
New Zealand Ministry of Foreign Affairs and Trade (2019). He waka eke noa – towards a better future together New Zealand’s progress towards the SDGs -2019. Wellington: New Zealand Ministry of Foreign Affairs and Trade.
Olander, L. P., Johnston, R. J., Tallis, H., Kagan, J., Maguire, L. A., Polasky, S., et al. (2018). Benefit relevant indicators: ecosystem services measures that link ecological and social outcomes. Ecol. Indic. 85, 1262–1272. doi:10.1016/j.ecolind.2017.12.001
Parliamentary Commissioner for the Environment (2019). Focusing Aotearoa New Zealand’s environmental reporting system. Wellington, New Zealand. Available at: https://pce.parliament.nz/publications/focusing-aotearoa-new-zealand-s-environmental-reporting-system/ (accessed June 13, 2023).
Parliamentary Commissioner for the Environment (2021). Well-being budgets and the environment: a promised land? Wellington, New Zealand. Available at: https://pce.parliament.nz/media/lxgb4pt5/wellbeing-budgets-and-the-environment-report-pdf-225mb.pdf (accessed June 13, 2023).
Perrings, C., Naeem, S., Ahrestani, F. S., Bunker, D. E., Burkill, P., Canziani, G., et al. (2011). Ecosystem services, targets, and indicators for the conservation and sustainable use of biodiversity. Front. Ecol. Environ. 9, 512–520. doi:10.1890/100212
Potschin-Young, M., Haines-Young, R., Görg, C., Heink, U., Jax, K., and Schleyer, C. (2017). Understanding the role of conceptual frameworks: reading the ecosystem service cascade. Ecosyst. Serv. 29, 428–440. doi:10.1016/j.ecoser.2017.05.015
Raworth, K. (2017). Doughnut economics: seven ways to think like a 21st century economist. London: Penguin Random House.
Razzaque, J., Visseren-Hamakers, I. J., McElwee, P., Rusch, G. M., Kelemen, E., Turnhout, E., et al. (2019). “Chapter 6. Options for decision makers,” in Global assessment report of the Intergovernmental Science-policy Platform on biodiversity and ecosystem services. Editors E. S. Brondízio, J. Settele, S. Díaz, and H. T. Ngo (Bonn, Germany: IPBES secretariat), 154. doi:10.5281/zenodo.3832107
Ringold, P. L., Boyd, J., Landers, D., and Weber, M. (2009). Report from the workshop on indicators of final ecosystem services for Streams. Environ. Prot. Available at: https://archive.epa.gov/nheerl/arm/web/pdf/indicatorsfinalworkshopreportepa600r09137.pdf.
Ringold, P. L., Boyd, J., Landers, D., and Weber, M. (2013). What data should we collect? A framework for identifying indicators of ecosystem contributions to human well-being. Front. Ecol. Environ. 11, 98–105. doi:10.1890/110156
Schröter, M., Başak, E., Christie, M., Church, A., Keune, H., Osipova, E., et al. (2020). Indicators for relational values of nature’s contributions to good quality of life: the IPBES approach for Europe and central Asia. Ecosyst. People 16, 50–69. doi:10.1080/26395916.2019.1703039
Statistics New Zealand (2019). Indicators Aotearoa New Zealand – Ngā Tūtohu Aotearoa. Wellington, NZ: Stats NZ. Available at : https://www.stats.govt.nz/indicators-and-snapshots/indicators-aotearoa-new-zealand-nga-tutohu-aotearoa (accessed June 13, 2023).
The Treasury (2021a). He Ara Waiora – brief overview. Available at: https://www.treasury.govt.nz/sites/default/files/2021-05/He%20Ara%20Waiora%20-%20brief%20overview%20A3.pdf.
The Treasury (2019). Our country, our future, our people. The living standards framework: dashboard update. Wellington, New Zealand. Available at: https://www.treasury.govt.nz/publications/tp/living-standards-framework-dashboard-update (accessed June 13, 2023).
The Treasury (2021b). The living standards framework (LSF 2021. Wellington, New Zealand. Available at: https://www.treasury.govt.nz/publications/tp/living-standards-framework-2021-html (accessed June 13, 2023).
van Oudenhoven, A. P. E., Schröter, M., Drakou, E. G., Geijzendorffer, I. R., Jacobs, S., van Bodegom, P. M., et al. (2018a). Key criteria for developing ecosystem service indicators to inform decision making. Ecol. Indic. 95, 417–426. doi:10.1016/j.ecolind.2018.06.020
Keywords: indicator development, process design, ecosystem services, nature’s contribution to people, wellbeing, quality of life
Citation: Ausseil A-GE, Booth P, Greenhalgh S, Samarasinghe O and Collins A (2023) Designing fit-for-purpose indicators to connect nature and people’s well-being in New Zealand. Front. Environ. Sci. 11:1241128. doi: 10.3389/fenvs.2023.1241128
Received: 21 June 2023; Accepted: 01 August 2023;
Published: 15 August 2023.
Edited by:
Pierre Glynn, United States Geological Survey (USGS), United StatesReviewed by:
Anna-Stiina Heiskanen, Finnish Environment Institute (SYKE), FinlandSmrithi Talwar, GNS Science, New Zealand
Copyright © 2023 Ausseil, Booth, Greenhalgh, Samarasinghe and Collins. This is an open-access article distributed under the terms of the Creative Commons Attribution License (CC BY). The use, distribution or reproduction in other forums is permitted, provided the original author(s) and the copyright owner(s) are credited and that the original publication in this journal is cited, in accordance with accepted academic practice. No use, distribution or reproduction is permitted which does not comply with these terms.
*Correspondence: Anne-Gaelle Elsa Ausseil, YW5uZS1nYWVsbGUuYXVzc2VpbEBtZmUuZ292dC5ueg==