 Adrian Dickson1*
 Nakia Belmer1
 Amy Denshire2Ingrid Garland3Sue Lennox2Shane Ruming4Dominic Lawler1Adam Wethered1
- 1Department of Planning and Environment, EES Laboratories, Lidcombe, NSW, Australia
- 2OzGREEN, Bellingen, NSW, Australia
- 3EnviroComm Connections, Hunter Valley (Whittingham), NSW, Australia
- 4North East Biodiversity and Conservation, Department of Planning and Environment, Coffs Harbour, NSW, Australia
In 2015, the sudden decline in the only known population of Myuchelys georgesi (the Bellinger River snapping turtle) triggered a strong community response, and a link between turtle mortality and poor water quality in the Bellinger River was suggested. A multi-agency investigation later attributed the mortalities of M. georgesi to a novel virus (the Bellinger River virus) and not a direct effect of poor water quality. However, a lack of consistent water quality or river health data in the catchment limited the research of factors that may have heightened susceptibility to the virus or exacerbated its symptoms. Community consultation identified strong connections with the riverine environment and highlighted the cultural, social, economic, and environmental values of the Bellinger River catchment. In 2017 OzGREEN, a not-for-profit environmental education charity based in Bellingen, built upon their existing citizen science water quality monitoring program in collaboration with the Saving our Species (SoS) team in the New South Wales (NSW) Department of Planning and Environment (DPE), who provided funding and equipment and solicited the involvement of NSW Waterwatch, Western Sydney University and Taronga Zoo. Now known as Bellingen Riverwatch (Riverwatch), the program has become a long-term citizen science program that aims to assist the recovery of M. georgesi, now a critically endangered species, through the delivery of monthly water quality data covering the Bellinger River and its tributaries. SoS also engaged the DPE Estuaries and Catchments Team to commence the Bellinger River Health Program (BRHP), focusing on water quality and aquatic macroinvertebrates to assess river health, with the aim of providing scientifically rigorous data to support the management and recovery of M. georgesi. This case study compares and evaluates the Riverwatch citizen science and the BRHP professional science, examining methods and results to compare the accuracy of the citizen science data and assess its reliability for informing ongoing river management. The results demonstrate that Bellingen Riverwatch is a well-managed citizen science program and generally provides valid, accurate, and representative results that can be confidently used to enhance the spatial and temporal coverage of the professional science monitoring program.
Introduction
Citizen science has been touted as a new way to perform science that could change the landscape and culture of science in general (Kasperowski and Kullenburg, 2019); however, there is some resistance from the scientific community, and some professional scientists question the quality of data collected through citizen science projects. Many citizen science projects produce high-quality data, but some projects have issues with deficits in data practices, such as a lack of accuracy, no standardised sampling protocol, poor spatial or temporal representation, and insufficient sample size (Anhalt-Depies et al., 2019), but quality and reproducibility are also issues faced by professional scientists (Baker, 2016). Today, most citizen scientists work with or are guided by professional scientists, either during the concept and design or throughout the life of a project. This provides an educational benefit to the citizen and the community more broadly and also benefits science through improved community engagement, data collection capacity, and insight through local knowledge, with better examples of citizen science benefiting both science and the community (Silvertown, 2009). Citizen science programs often have far-reaching social, educational, and community benefits for the citizens and professional scientists involved. Citizen science programs can also generate meaningful engagement opportunities on a local scale and often remove the divide between government and community (Jollymore et al., 2017).
There are many benefits of citizen science and it’s often through the collaboration of scientists and the communities they wish to engage that the success of scientific research is realised. For example, scientists are collaborating with communities in Cameroon, Namibia, the Democratic Republic of the Congo, and Brazil using smartphone software to monitor illegal poaching, conduct tree health surveys, and protect important resources during logging, and the success of these projects has led to government research funding awarding £1.5 m to projects that introduce citizen techniques to new fields of research (Piesing, 2020). It was recognised by the United Nations (UN) that citizen science has the potential to fill data gaps on a far wider scale than can be achieved by traditional professional field and laboratory-based water quality monitoring programs (Capdevila et al., 2020). Citizen science volunteers typically operate within a well-designed program underpinned by ongoing training provided by science professionals (Dickinson et al., 2012). This is highly evident in the United States of America, where it has been acknowledged that programs supported by state and federal administrations offer invaluable contributions to determining the status and temporal trends of water quality to the degree that citizen science programs have been recognised and included as part of their water protection strategies (Latimore and Stern, 2014; EPA, 2016; Poisson et al., 2020).
Water quality monitoring of freshwater environments globally is replete with large data gaps due to the complexity and resource constraints associated with quality monitoring on large spatial and temporal scales (Poisson, 2020). This lack of data limits the potential to identify long-term changes in water quality and reduces the ability to identify new threats to freshwater biodiversity on local and international scales (Babiso et al., 2023). Limitations of waterway management, particularly in Australia, are often due to large catchment areas, large distances across geographical regions, and logistic difficulties in achieving high sample frequency across such extensive geographic regions. This has led researchers to engage with the public and push for the inclusion of citizen science in research programs to fill these data gaps (Hampton et al., 2013; Pearce-Higgins et al., 2018).
Due to such large efforts globally to increase the inclusion of citizen science in waterway management, specifically water quality monitoring, to fill these data gaps, many factors have been identified that may ensure the success of a citizen science water quality monitoring program (Capdevila et al., 2020). Of these many factors, three have been identified as crucial: 1. The underlying knowledge attributes of the citizen scientists, such as previous knowledge of environmental problems, socio-economic background, and knowledge or experience of data collection and collation; 2. The underlying motivations and funding support of the organising institution; and 3. The interactions between the citizen scientists and the underpinning institution/s (Capdevila et al., 2020). The case study presented here has all three of these components and is underpinned by a highly supportive and motivated government institution, along with a highly motivated, well-funded, and knowledgeable not-for-profit organisation.
There are a handful of case studies that compare similar water quality parameters within freshwater environments akin to this study. Four of these case studies, which are discussed below, were performed in North America, one in Lebanon, and one in Ethiopia.
A case study in freshwater streams of Nova Scotia Canada investigated in situ water quality data gathered by citizen scientists and professional scientists. The presumptions were that there would be no significant difference between the results gathered by citizens when compared to professional scientists. The results show that some water quality parameters were found to be similar, such as pH, water temperature, and electrical conductivity. In contrast, dissolved oxygen was found to be significantly different (Shelton, 2013). Albus et al. (2020) found differences between citizen science and professional science in situ water quality data for dissolved oxygen and pH measured at multiple sites between 1992 and 2016 across the State of Texas in the USA, though these differences were not significant. Albus et al. (2020) concluded that the results showed an “agreement” of ∼80% between all data from 1992 to 2006 and an “agreement” of 91% for data gathered between 2009 and 2017. These results show that although there are differences between the citizen science and professional science data in this case study, they were found to be statistically reliable, and between 1992 and 2006 and between 2009 and 2017, an increase in reliability was observed, rising from 80% of the data being reliable to 91%.
Safford and Peters (2018) investigated the comparison of citizen science and professional science-gathered dissolved oxygen results in Georgia and Rhode Island in North America. The results of this case study showed that the two datasets had differences and the Georgia collected citizen science data was approximately 1 mg/L lower, while the Rhode Island data was approximately 1.8 mg/L lower. Though there were differences, these were not found to be significantly different, and it was concluded that these datasets were highly reliable (Safford and Peters, 2018). A comparative study was undertaken in the Yukon River Basin in Alaska and Canada, where the Indigenous Observation Network gathered water quality and chemistry from 50 locations. These datasets were compared to professionally gathered datasets, and it was found that there were no significant differences for pH, calcium, or alkalinity, whilst, in comparison, sodium, chloride, sulfate, and potassium were found to be statistically different. Although there were recorded differences, the authors concluded that these were likely not significant in terms of data interpretation (Herman-Mercer et al., 2018). This case study shows how the prescribed test for each parameter is likely the defining factor as to whether a selected parameter is significantly different or not. For example, this case study shows that the parameters pH, calcium, and alkalinity were in line with those collected by professional scientists, whilst the more complex test, usually performed in a laboratory when sampled by professional scientists, not in the field as they are when sampled by citizen scientists, were significantly different.
A study in Lebanon investigating groundwater monitoring comparing citizen and professional science-gathered data using 10 parameters found that the majority of the physical and chemical water quality parameters were comparable. Using t-tests, it was found that seven of the nine physical and chemical parameters were found to have no significant difference, these being pH, conductivity, turbidity, alkalinity, nitrates, and ammonia. However, both hardness and phosphate were found to be statistically different. It was found that bacteriological test results were much less reliable (Baalbaki et al., 2019). Here we find similar differences to the case studies above, with many of the field-sampled parameters being highly reliable, whilst more complex, laboratory-based tests undertaken by professional scientists were less reliable. Another case study in the Meki River, Ethiopia, found that citizen science-collected water samples, which were sent to be analysed in a commercial laboratory, have no significant difference when compared to professional science-collected water samples (Babiso et al., 2023). Parameters measured in this case study included PO4, NO3-, pH, and NH4+. This study, much like the previously described case studies, also shows that many of the parameters measured, for which professional scientists use laboratory equipment to achieve a higher level of accuracy, do not differ if the citizen science-collected water parameters use the same detection methods. In conclusion, these case studies show that it is often the test procedure and not the tester (i.e., professional or citizen scientist) that drives the differences.
Here, we present a case study from north-eastern New South Wales (NSW), Australia, where a strong community response to a significant localised mass mortality event affecting the only known population of Myuchelys georgesi (Cann, 1997) (a.k.a, Bellinger River snapping turtle) identified a publicly perceived link between turtle mortality and poor water quality. On the advice of researchers from Western Sydney University OzGREEN (Global Rivers Environmental Education Network Australia Inc.), an Australia-based non-government organisation initiated a partnership with the Citizen Science Unit in the NSW Department of Planning and Environment (DPE) in 2016. The Citizen Science Unit agreed and brought together OzGREEN, NSW Waterwatch (Waterwatch), and in-house scientists to co-design a citizen science project that could work alongside the scientific monitoring being undertaken. Bellingen Riverwatch (Riverwatch) was launched as a pilot project in May 2017, in collaboration with DPE, Waterwatch, Western Sydney University, and Taronga Zoo. Riverwatch has become a long-term citizen science program that aims to assist the recovery of M. georgesi through the delivery of monthly water quality data covering the Bellinger River and its subcatchments. Significant effort by the Saving our Species (SoS) Citizen Scientists of the Citizen Science Unit of the Science Strategy Branch was invested in the design of the monitoring program in collaboration with the Estuaries and Catchments Team (ECT) in the Science, Economics, and Insights Division of the NSW Department of Planning and Environment, hereafter referred to collectively as DPE.
A vital component was the strong community engagement, through OzGreen, DPE, and Waterwatch, to collect scientifically rigorous long-term data that can be used to inform management decisions that could aid in the recovery of M. georgesi and assess and manage the health of the Bellinger River and its subcatchments. Bellingen Riverwatch now engages over 40 local community volunteers and five schools to collect water quality data monthly across the Bellinger and Kalang catchments.
At the request of the SoS Citizen Scientist, ECT provided professionally qualified Environmental Scientists specialised in river health monitoring to commence biannual (twice-yearly) monitoring for the Bellinger River Health Program (BRHP) in 2017. The program initially investigated and sampled 25 sites across the Bellinger River catchment but was refined to 15 core sites for ongoing biannual monitoring in autumn 2018. The sites were selected to be representative of the study area, providing good spatial coverage and considering the land use and landscape features that had the potential to influence river health, also aligning with the citizen science monitoring where possible. The BRHP followed the methods, standards, and protocols required for compliance with the Australian and New Zealand Guidelines for fresh and marine water quality (ANZG, 2018), which follows the protocols and values given in the Australian and New Zealand Environment and Conservation Council (ANZECC) & Agriculture and Resource Management Council of Australia and New Zealand (ARMCANZ), hereafter referred to as the Guidelines (ANZECC, 2000). It also included the NSW AUSRIVAS Sampling and Processing manual (Turak et al., 2004) for the biological assessment of river health; however, only the water quality components are considered in this study.
In short, the BRHP was undertaken by professional environmental scientists qualified in aquatic ecosystem monitoring, with a focus on water quality and macroinvertebrate monitoring for the assessment of riverine health. The program has been designed to meet a set of objectives providing the highest spatial and temporal resolution, given the financial and human resource constraints, whilst also complementing the monthly citizen science data collection, effectively as a QA/QC check, and to allow for comparisons between the results of the citizen science program and the professional government science program. This comparison also helped to guide the training of the citizen scientists to improve the scientific rigour of their data collection methods and to verify the reliability of their results.
This research aims to assess the rigour of citizen science-gathered data in comparison to professional-gathered data and assess its reliability. To our knowledge, this is the first research in Australia to assess long-term datasets with high sampling intensity. This research indicates that citizen science water quality monitoring is highly reliable and informative and can fill gaps within a professional scientist water quality monitoring program, which is often not achievable due to time constraints and or funding.
Materials and methods
Study area
The Bellinger River catchment is in the Mid North Coast region of NSW. The catchment area is approximately 1,000 km2, 70 km in length and 20 km wide (DPE, 2023). The valley is surrounded by the steep eastern escarpment of the New England Tablelands and the Bellinger River flows from the Dorrigo Plateau through to the ocean at Urunga. The upper reaches of all streams are steep-sided valleys that drain onto alluvial floodplains. The steep areas of the catchment are under forest cover, while the narrow floodplain and associated foothills have some clearings for grazing, cropping, and other uses. The Bellinger catchment is highly valued for its natural environment and contains some regionally significant rainforest. Most of the forest is contained in either national parks or state forest areas.
The two main subcatchments are the Bellinger River to the north and the Kalang River to the south. The Bellinger and Kalang rivers converge downstream of Bellingen, within the Bellinger estuary. In median flow, the lower parts of both rivers are brackish, and tidal influence extends approximately 20 km upstream in the Bellinger River (to just downstream of Bellingen) and approximately 25 km upstream in the Kalang River. The freshwater reaches of these two subcatchments are therefore separated but hydrologically connected by brackish water. The Bellinger River includes two small subcatchments in the northwest of the main catchment (the Never Never River and the Rosewood River) and other small tributary streams that include the Boggy, Caratti, Cool, Hydes, and Woods creeks. The Kalang River catchment includes the Spicketts Creek catchment and some other small tributaries.
Monitoring sites
The monitoring sites included in the Bellingen Riverwatch citizen science program have increased over time, corresponding with increasing community interest and participation. By the most recent events considered in this study (June 2022), a total of 30 sites were regularly sampled by citizen scientists on a monthly basis for the Bellingen Riverwatch program; however, due to the time and resource constraints of the professional science BRHP, only half of these sites were consistently sampled, and only biannually in spring and autumn, and are indicated as core sites in Table 1; Figure 1. Furthermore, some of these sites are influenced by the intrusion of estuarine waters (as indicated in Table 1), which can dramatically change water quality conditions. As such, the results of these estuarine-influenced sites are not considered in all comparative assessments of water quality parameters.
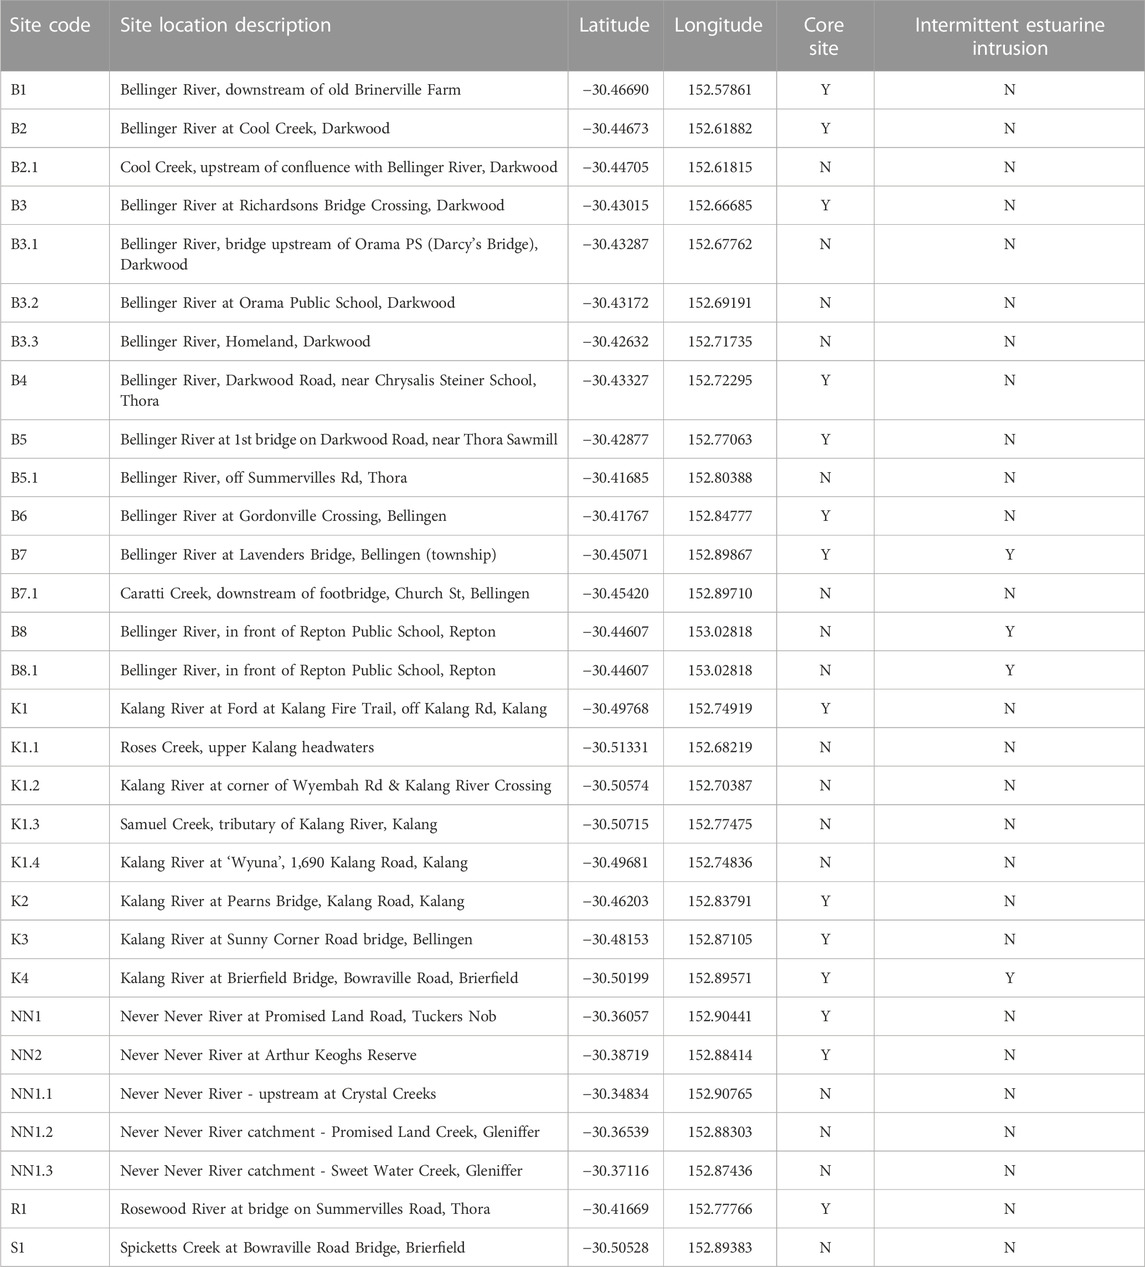
TABLE 1. Sites monitored for the Bellinger Riverwatch citizen science program and the core sites monitored by the professional Bellinger River Health Program.
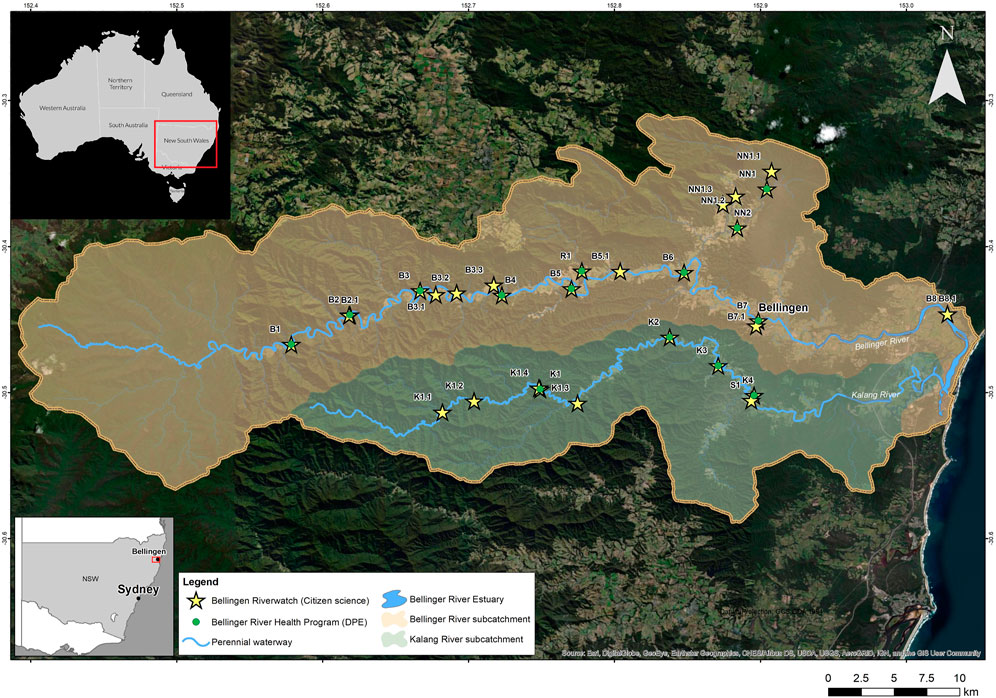
FIGURE 1. Map of monitoring sites for Bellingen Riverwatch and the Bellinger River Health Program.
Bellingen Riverwatch
The Bellingen Riverwatch program samples a total of 30 sites, which includes the 15 core sites also sampled for the BRHP (Table 1; Figure 1). The Bellingen Riverwatch program consists of 14 sites on the Bellinger River and three sites on small tributaries of the Bellinger, including Cool Creek in the upper catchment, Rosewood River in the mid-Bellinger catchment, and Caratti Creek in the township of Bellingen, near the lowest point of the freshwater catchment. There are five sites in the Never Never River subcatchment, with two on the main Never Never River and three on tributaries including Crystal Creek, Promised Land Creek, and Sweet Water Creek. The Kalang River is a subcatchment to the south of the Bellinger; it has six sites on the Kalang River and one additional site on Spickets Creek, a tributary in the lower Kalang River subcatchment.
Bellinger River health program
The monitoring performed by DPE for the BRHP included 15 core sites; these include 10 sample locations in the Bellinger catchment, which include the Never Never and Rosewood River subcatchments. In total, 7 of the sites are located on the Bellinger River, 2 on the Never Never River, and 1 on the Rosewood River. The remaining 5 sites to the south of Bellingen are in the Kalang River catchment, with 4 sites located on the Kalang River and 1 site on Spicketts Creek, a tributary of the Kalang River (Table 1; Figure 1). All 15 sites that were sampled by DPE for the BRHP are also sampled by the citizen scientists for the Bellingen Riverwatch program, although more recently, only 12 sites remain in the BRHP due to resource constraints.
Bellingen Riverwatch sampling methods
The water quality testing procedures and parameters measured for the Bellinger Riverwatch community monitoring program are dependent on the experience level of the person or team undertaking the sampling. The two levels are as follows:
• Junior Parameters: developed for school-age participants
• Senior Parameters: targeted to more experienced community participants that have some Waterwatch or higher-level training/qualifications
Step-by-step instructions for the procedures for each level can be found on the NSW Waterwatch website (https://nswwaterwatch.org.au/resources/testing-proceedures). The sample collection and measurement procedures are in alignment with the approved methods for water quality monitoring in NSW (EPA, 2022), which include calibration procedures for equipment, specifically for the Eutech ECScan conductivity meters, which are calibrated regularly by the citizen scientists. The parameters measured at each level are provided in Table 2, and the Riverwatch citizen scientists measure six water quality parameters across 30 sites (Table 1).
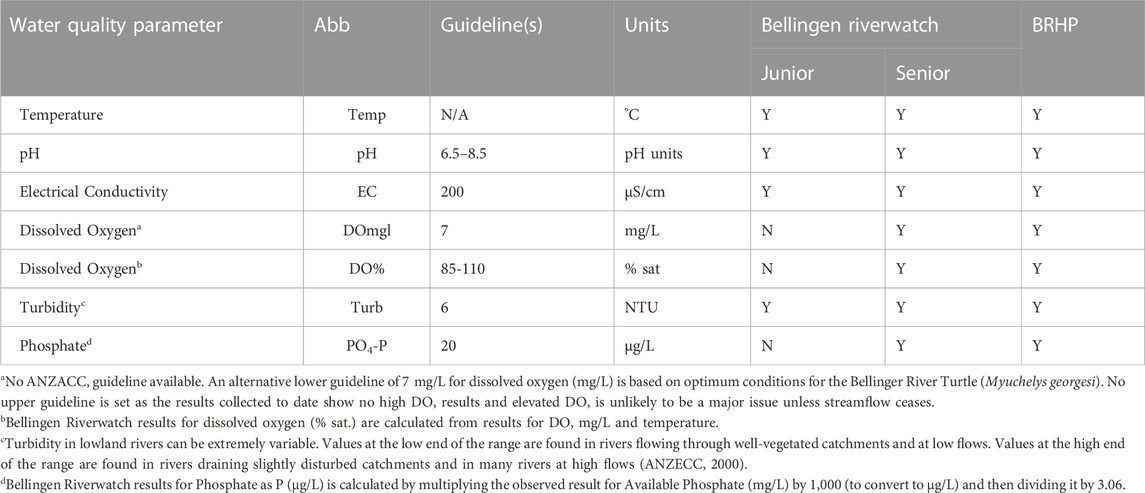
TABLE 2. Water quality parameters and guidelines for the Bellinger Riverwatch and Bellinger River Health Program (Y = parameter normally measured, N = not measured).
Bellinger River health program sampling methods
Parameters measured by DPE are given in Table 2. In brief, in situ measures of water temperature, pH, electrical conductivity, dissolved oxygen, and turbidity are taken with a multi-parameter water quality meter (YSI, ProDSS) that is calibrated following the manufacturer’s calibration procedures (Xylem, 2020) prior to field surveys. The DPE ECT currently uses YSI ProDSS water quality meters but also used Horiba U-50 m in the first year of this program, which were also calibrated in accordance with the manufacturer’s instructions (HORIBA, 2010). Nutrients are collected following standard protocols, including field filtration of samples to be analysed for dissolved nutrient concentration. Nutrients are frozen in the field and kept frozen until they are delivered to a National Association of Testing Authorities (NATA) accredited laboratory for analysis. Although phosphate is the only nutrient result presented and discussed in this study, as this is the only nutrient parameter also measured for Riverwatch, DPE also determines results for other parameters including total and dissolved nitrogen and phosphorus, nitrogen oxides, and ammonia. DPE sample collection and laboratory measurement procedures follow the approved methods for water quality monitoring in NSW (EPA, 2022).
Assessment of water quality results
Regardless of the sampling organisation or method used, the water quality results are compared to the Australian and New Zealand Guidelines for Fresh and Marine Water Quality (ANZG, 2018) to assess their compliance and implications for aquatic ecosystem health. The default guideline values (DGV) applied to the study sites are for slightly-to-moderately disturbed systems (95% species protection DGV) for lowland east-flowing coastal rivers of NSW. Where the is no reliable DGV, the 80th percentile value is used as a trigger value for assessment of the water quality condition. Guideline values applied to this program are provided in Table 2.
Temperature does not have a Guideline value (ANZECC, 2000) as it can vary widely across a site and fluctuates with diurnal patterns and weather and climatic conditions. Like temperature, dissolved oxygen can vary across a site and may be influenced by local site scale factors such as local air pressure, stream flow, depth, and diurnal cycles of oxygen concentration driven by biological processes. As such, comparison of DO % saturation results against Guidelines should be done with caution. A more accurate measure is dissolved oxygen concentration (mg/L) as it better represents the availability of oxygen to organisms within the waterway and is less influenced by local air pressure fluctuations. However, there is no ANZECC (2000) Guideline for DO concentration, so derivation of a study-specific value was proposed in the BRHP, and a value of 7 mg/L is suggested as the lower trigger value. This value was considered in the context of other studies that focused on the biological and ecological consequences of change in dissolved oxygen (Summers et al., 1997; Miller et al., 2002; Boulton et al., 2014; Crossman et al., 2019).
An understanding of the methods and equipment used to measure water quality is important when making results comparisons as data resolution and accuracy are directly linked to the methods used. The Bellingen Riverwatch program uses NSW Waterwatch kits to obtain their measurements. The DPE ECT uses calibrated multiparameter water quality meters and submits samples for the analysis of nutrients to a NATA-accredited laboratory for the BRHP. The details of the methods used for each parameter measured are given in Table 3. The detection limit is the lowest possible measure that can be obtained using the method. Resolution refers to the smallest change that a test or sensor can detect in the quantity that it is measuring. Accuracy refers to the confidence that the results are correct.
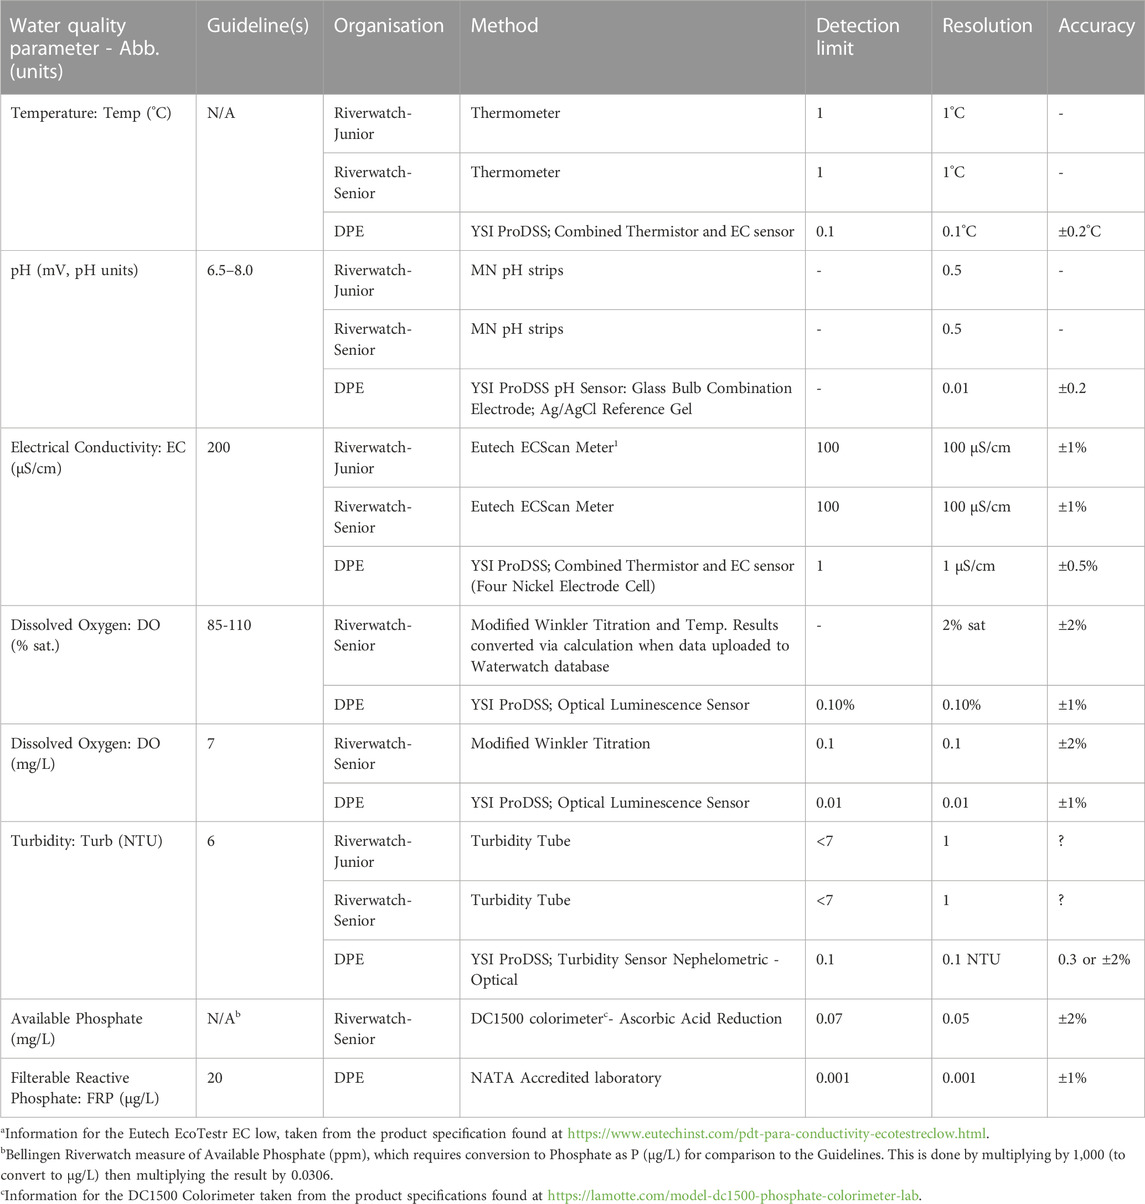
TABLE 3. Water quality parameters measured, method and sensitivity (“?” indicates accuracy of method unknown).
Data analysis methods
The data presented in this case study span over 6 years from 2017 to 2022, although not all years have a complete dataset as biannual sampling for the BRHP was not always possible and there were occasions when some sites were not sampled by either organisation. Certain factors, mostly related to illness or COVID-19 lockdown periods and subsequent travel restrictions, inhibited sampling in 2020/21 and safety issues due to environmental factors such as bushfires and flooding prohibited sample collection. However, over the 6-year study period, the Bellingen Riverwatch group collected 1,038 samples with an average of 35 sample events per site, consistently testing for all six water quality parameters with only a few exceptions. DPE recorded nine sample events, collecting 128 samples for all six water quality parameters at the majority of the 15 core sites.
Data collation and preparation were performed in Microsoft® Excel® for Microsoft 365 MSO (Version 2202 Build 16.0.14931.20988) and further analysis and visualisation was done in RStudio (2023.03.1 + 446“Cherry Blossom” Release for Windows). All Bellingen Riverwatch results up to June 2022 were combined with the BRHP results into one dataset to facilitate comparisons between the two programs. Each sample was designated a unique sample identification code (SampleID) and other factors were added to provide a means of categorising, grouping, and summarising the results.
Prior to detailed analysis, data cleansing was necessary to identify outliers and erroneous results that may have been transcription or data entry errors. Descriptive statistics of the parameters were used to identify where outliers and errors may occur. As the aim of this analysis was to compare the Riverwatch and BRHP results, it was important to evaluate data quality prior to and during the analysis. If the Riverwatch results are to be accepted as a quality source of high temporal resolution data, filling the gaps between the biannual BRHP results and those used to inform management decisions, then ensuring high-quality data should be a priority of the Bellingen Riverwatch program.
For each result of the Bellinger Riverwatch data identified as an outlier, the result was closely examined as it was important not to remove high values that may be representative of the conditions and better demonstrate the spatial and temporal variability that the biannual BRHP could not provide. Where a result was well above most of the data, it was checked to see if a data entry or transcription error may have been the cause (e.g., an incorrect decimal point placement) and, if so, the result could be altered (e.g., DO % sat = 950% changed to 95% where DO mg/L = 9). Where results had justifiable variability (e.g., high EC at sites near estuarine waters), they were left unaltered and remained in the analysis, but this case study is focused on freshwater, so most estuarine site data is omitted from analysis and discussion. Results indicating estuarine conditions were not considered to be an issue that would trigger an unnatural response from a chemical or ecological perspective when considering assessment of freshwater river habitats. Where results were clear outliers but could not be easily accepted as errors and justifiably altered, were from the core sites to be compared, and were considered outside the realm of possibility, given the nature of the waterways and an understanding of riverine chemistry and ecology, they were generally removed. See Supplementary Table S1, for details of the results that were either altered, removed, or modified and the justification for the alteration or omission.
Phosphate results adjustment
To allow a direct comparison between the results collected for phosphate, an adjustment of the Bellinger Riverwatch “Available Phosphate” result was necessary. DPE Science and other analytical chemistry laboratories use PO4-P as the standard for available phosphorus (i.e., only the P part of PO4) with the test of filterable reactive phosphorus (FRP) as the best approximation of available P. The Bellingen Riverwatch colorimetric test follows the NSW Waterwatch methods and measures the concentration of “phosphate” (PO4), which has a molar mass of approximately 3.06 times greater than that of phosphorus. The NSW Waterwatch manual advises users that they should multiply the National Guideline value by 3.06 to account for this difference. It is the opinion of the DPE Science Division that it is not logical or defensible to change the guideline to match an analytical idiosyncrasy and that the Riverwatch data should be expressed in the same units as the guidelines. This was achieved for this dataset by dividing all Riverwatch concentrations of PO4 by 3.06 and converting them to the appropriate units (µg/L) of PO4-P. This was to ensure that Riverwatch data would be comparable to the BRHP data, ANZECC (2000) Guidelines, and any other data expressed as PO4-P.
Comparing programs
To examine the statistical significance of any difference between the two programs, data were generally limited to the core study sites that were sampled by both the Riverwatch and BRHP programs and were freshwater, or not influenced by intermittent connection to estuarine waters, as indicated in Table 1. Descriptive statistics were derived for the water quality parameters measured by both programs, including temperature, pH, electrical conductivity, dissolved oxygen (mg/L), turbidity, and phosphate. For each parameter, the distribution of data was examined, and where data was normally distributed, t-tests (two-sample assuming equal variance) were performed. Parameters with non-parametric data distribution were assessed with the Wilcoxon signed ranks test. Interpretation of these results must be treated with caution due to the unbalanced design, as there are only nine sample events for the BRHP sites and up to 60 sample events for the Bellinger Riverwatch sites; however, we believe there is sufficient data for a realistic and representative comparison of results across organisations and sites.
To compare the results of the two programs thoroughly, a paired approach was conducted whereby samples collected for each program from the same site, within the same month, were considered a valid sample pair. While this may not be the most rigorous approach, it was the closest approximation to a paired design possible with this dataset. Most parameters can be considered sufficiently temporally consistent to permit this as a valid statistical approach, except for water temperature and dissolved oxygen, which fluctuate on a diurnal cycle, meaning that the time of day of sampling would strongly influence the results. Interpretation of these results must also be treated with caution as there may be days, or possibly a few weeks, between the Riverwatch and BRHP sampling. Nonetheless, this approach should be considered sufficient for a realistic and representative comparison of results across sampling programs and sites.
Visualising the results
For a simple and concise visual comparison of results between monitoring programs, a violin plot diagram was generated for each of the water quality parameters tested by both Riverwatch (Senior) and the BRHP (Table 2). The violin plot allows the visualisation of the distribution of a numeric variable, and each “violin” represents a group, while the shape represents the density estimate of the variable: the more data points in a specific range, the larger the violin is for that range (Hintze and Nelson, 1998). Further analysis at the site scale included box plots, which were chosen as they allow for a clear depiction of the results, indicated by the points on the graph, and the basic descriptive statistics including the min, max, and interquartile range; although useful for interpretation of the data, these box plots are included in the Supplementary Material rather than the main text to keep this article succinct. Additional time series line plots were also generated in some instances to investigate whether trends in the results over time were comparable between the Riverwatch and BRHP results.
Results
Initial examination of the results (Figure 2) suggested commonality between sampling organisations as the range and distribution for most parameters were similar. Although the Riverwatch results generally had a greater range, with some obvious outliers, which may suggest inaccuracies of some results, these results may be representative of the variability in environmental conditions that may not be detected by the biannual monitoring of the BRHP, which highlights one of the benefits of the monthly Riverwatch program. As the BRHP considers only nine sampling events for each site, the ranges displayed in box plot figures are unlikely to capture the full range and natural variability of each parameter at each site, even though the accuracy of the results is higher compared to the Riverwatch data, due to the better resolution and higher accuracy of the equipment and sample analysis methods used for the BRHP (Table 3).
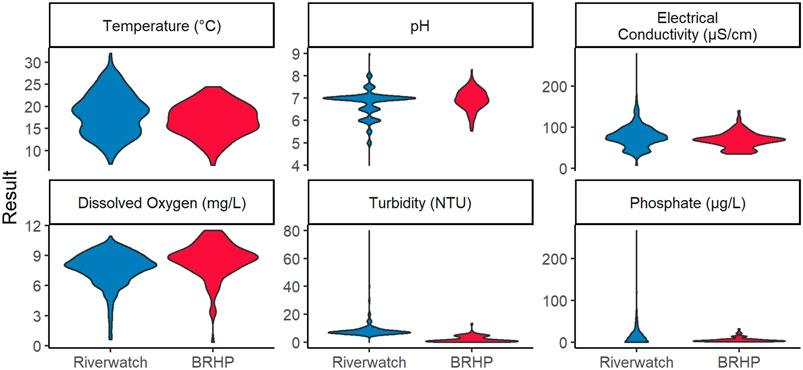
FIGURE 2. Violin plots demonstrating the range and density distribution of each water quality parameter measured for Bellingen Riverwatch (Riverwatch) citizen science program (blue) and the professional Bellingen River Health Program (BRHP) (red).
Water temperature
The mean water temperature of the Riverwatch results (M = 18.44, SD = 4.76) was significantly higher than BRHP (M = 16.94, SD = 3.61) for freshwater monitoring sites (t(1,026) = 3.26, p = 0.0006) (Table 4) and this difference was evident for all core sites (see Supplementary Figure S1). While this suggests the Riverwatch measurements may be an overestimate compared to BRHP results, which are collected using more accurate equipment, river water temperature exhibits diurnal cycles and seasonal patterns, so time of day and time of year need to be considered when making comparisons. For this reason, a paired approach (as conducted for other water quality parameters) was not considered a valid analysis for water temperature.
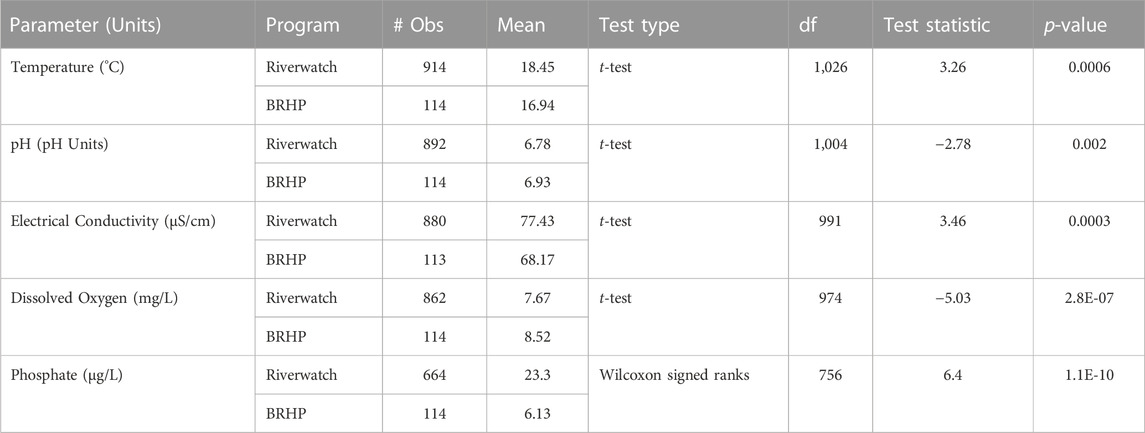
TABLE 4. Results of t-tests (two-sample assuming equal variances) comparing sampling for Bellingen Riverwatch (Riverwatch) and Bellinger River Health Program (BRHP) for each water quality parameter.
Considering only the 12 core sites that were not influenced by estuarine intrusion and were sampled regularly enough to include in a time series analysis, examination of the results for the two programs shows the seasonal patterns in temperature (Figure 3) that are similar for both the Riverwatch and the BRHP data. In general, the results indicate that the Riverwatch data consistently captures the extremes in patterns of seasonal temperature that BRHP cannot, due to the unavoidable limitations of biannual sampling.
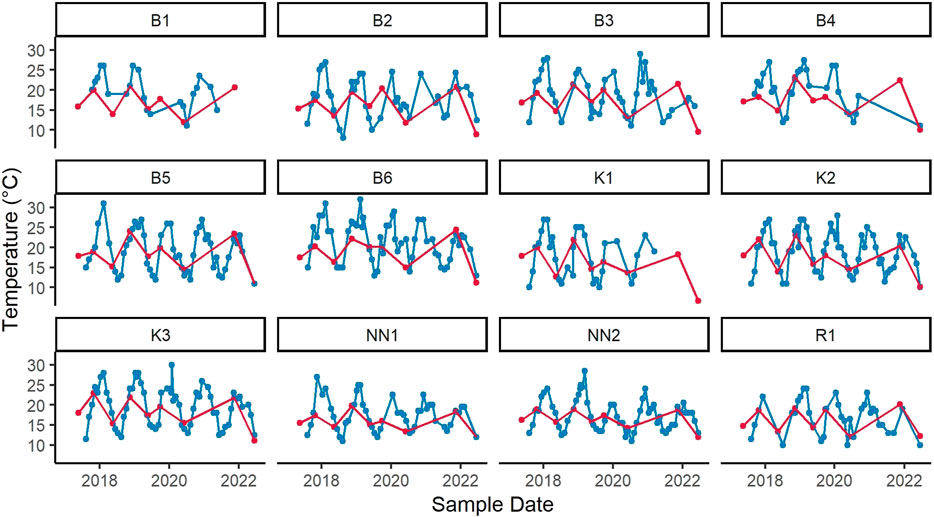
FIGURE 3. Seasonal variability in water temperature at each of the core sites sampled for the Bellingen Riverwatch citizen science program (blue) and the professional Bellinger River Health Program (red).
pH
The mean pH values for the Riverwatch results in the Bellinger River were within the Guideline values for all freshwater sites other than B7.1, which had a slightly acidic mean pH, outside the lower guideline. It should be noted that the catchment of site B7.1, Caratti Creek, is largely influenced by urban development as it flows through the township of Bellingen, so acidic conditions are likely on an intermittent basis. BRHP results for pH in the Bellinger River recorded all sites to be within the Guidelines (see Supplementary Figure S2). Results for the Never Never River indicated slightly more acidic conditions than the other waterways, and Riverwatch results indicated mean pH at the lower Guideline value (6.5) at site NN2, whilst the BRHP recorded mean pH below the Guideline at NN2. Riverwatch results for mean pH were equal to the lower Guideline at Kalang River sites K2 and K3. In comparison, the BRHP recorded mean pH within the guideline for the Kalang River sites K1, K2, and K3.
The results show that the pH measures collected by Riverwatch are coarse, with an accuracy of 0.5, which is a limitation of the method, while the BRHP method allows assessment to two decimal places. It should also be noted that although some of the pH results for both the Riverwatch and the BRHP are below the Guideline, this is not of concern as these waterways are likely naturally slightly acidic. These results show that although the ANZECC (2000) guidelines are robust, it is always pertinent to derive specific localised guidelines for water quality parameters if a dataset allows.
Considering all pH results for freshwater sites, the t-test revealed the Riverwatch results (M = 6.77, SD = 0.59) to be significantly lower than the BRHP results (M = 6.93, SD = 0.47), (t(1,004) = -2.8, p = 0.003) (Table 4). However, when considering just the results suitable for a paired t-test, there was no significant difference in mean values of the Riverwatch (M = 6.91, SD = 0.4) and BRHP (M = 6.96, SD = 0.47), (t(82) = -0.87, p = 0.19) (Table 5).
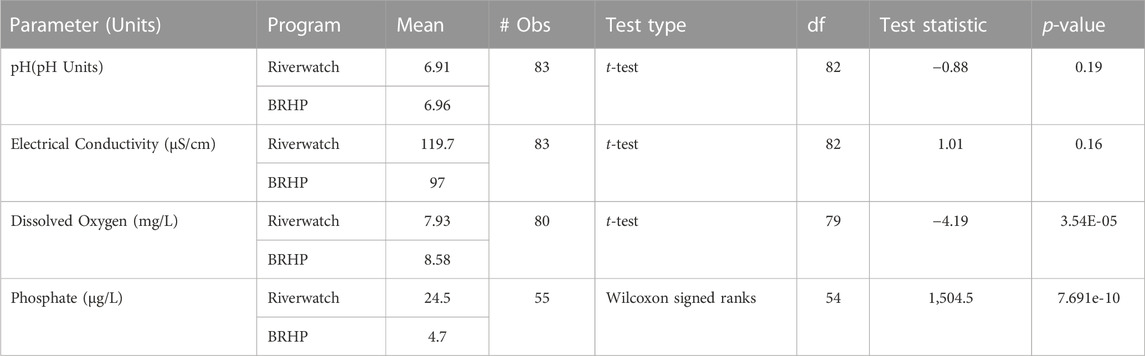
TABLE 5. Results of paired tests comparing Bellingen Riverwatch (Riverwatch) and Bellinger River Health Program (BRHP) for each water quality parameter.
Electrical conductivity
Electrical conductivity (EC) was within the Guideline value for almost all samples collected from freshwater sites (excluding any sites with possible estuarine intrusion (as indicated in Table 1) with only two measures in the Riverwatch results being outside the Guideline value (200 μS/cm). These exceptions included one sample at each of B7.1 and S1. The Kalang River catchment is known to have a greater level of disturbance in the form of forestry and agriculture, the latter being more common in the Spicketts Creek catchment; as such, slightly elevated EC is expected and the Riverwatch results are likely reflective of environmental conditions. Similarly, the catchment of site B7.1, Caratti Creek, is largely influenced by urban development as it flows through the township of Bellingen, so elevated EC is expected.
Comparison of the Riverwatch and BRHP results for EC of the core freshwater monitoring sites demonstrated the Riverwatch results to be more variable, with outliers more common, and to have higher mean values for most sites (see Supplementary Figure S3). Results of the t-test (two-sample assuming equal variances) comparing all results from the freshwater sites revealed the Riverwatch data to be significantly higher (M = 77.43, SD = 27.5) than the BRHP data (M = 68.17, SD = 19.4), (t (991) = 3.47, p = 0.0002) (Table 4). Considering the results from the core sites that were collected by both Riverwatch and BRHP within the same month, the closest approximation of a paired design, found that there was a difference in the mean values for Riverwatch (M = 119.7, SD = 188) and BRHP (M = 97, SD = 162.9), although this was not statistically significant (t(82) = 1.01, p = 0.16) (Table 5), which suggests that the Riverwatch and BRHP results for EC are reasonably consistent and comparative. Riverwatch data also provides calibration records, with the EC meters used being calibrated prior to almost 68% of sample events, which suggests these consistent results should be considered accurate. Evidence of this consistency in Riverwatch results is more apparent when considering the results of the monitoring programs over time (Figure 4).
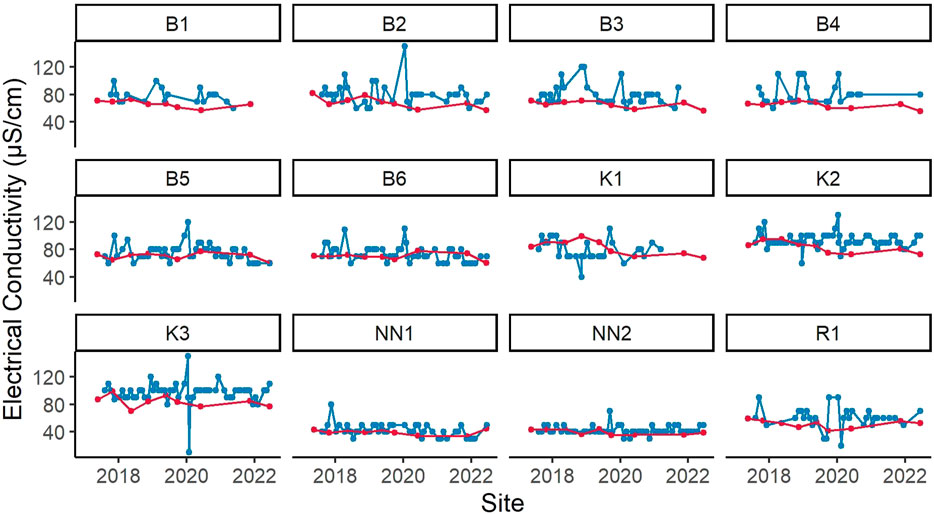
FIGURE 4. Electrical conductivity of the Bellingen Riverwatch (blue) and Bellinger River Health Program (red).
Dissolved oxygen
Considering all freshwater monitoring sites sampled, the results for dissolved oxygen (mg/L) (DO) indicated that although means for both datasets were within the Guideline values, the Riverwatch values (M = 7.67, SD = 1.68) were significantly lower than BRHP (M = 8.52, SD = 1.8), as determined by a two-sample t-test (t(974) = -5.03, p < 0.005) (Table 4). The comparative results for DO, considering only the results of the core freshwater sites sampled by both programs within the same month, a paired t-test indicated that the mean DO was significantly lower for Riverwatch (M = 7.93, SD = 1.48) compared to the mean of BRHP (M = 8.58, SD = 1.57), (t(79) = -4.19, p < 0.005) (Table 5). While this suggests the Riverwatch measurements may be an underestimate compared to the BRHP results, which are collected using more accurate equipment, river dissolved oxygen fluctuates over a diurnal cycle; therefore, the time of day of sample collection leads to differences in results. Furthermore, the results for all freshwater sites demonstrate similar trends between the Riverwatch and BRHP data at the site scale, and Riverwatch identified that sites B7.1 and S1 had low mean DO values, outside the lower guideline (see Supplementary Figure S4), which is representative of the degraded conditions of these sites. While there were a few outliers for some sites, including B2, B3, and K3, the Riverwatch results were generally within the standard error (SE) of the BHRP results (Figure 5).
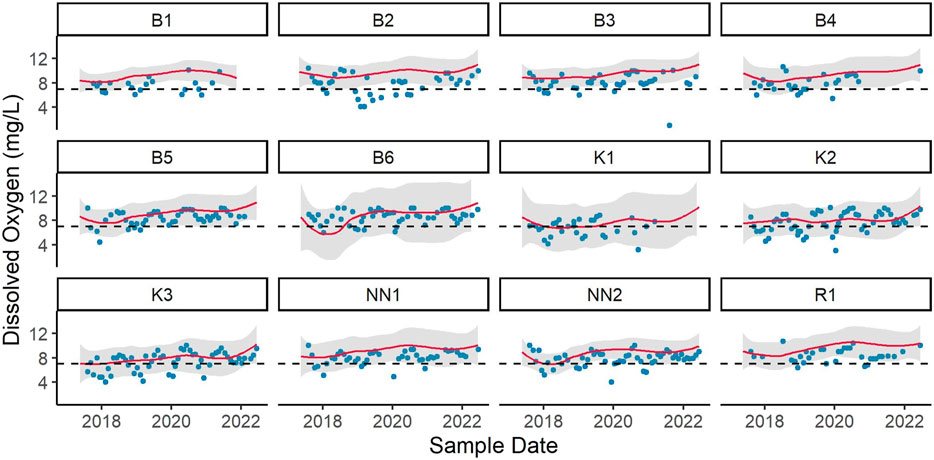
FIGURE 5. Dissolved oxygen (mg/L) for core freshwater sites of the Bellingen Riverwatch (blue dots) and Bellinger River Health Program (red line) with loess smoothing (standard error indicated by grey shading). The majority of the Riverwatch results are within the standard error of the BRHP results (-- Guideline).
Turbidity
Bellingen Riverwatch recorded turbidity above the Guideline (6 NTU) for all sites on all occasions. In contrast, the BRHP recorded turbidity below the Guideline at all sites on all occasions other than one single measure at site S1. Although site S1 was above the guideline on more than one occasion, the majority of the BRHP measures at site S1 were below the guideline. Although all samples collected by Riverwatch were above the Guideline, the detection limit of the turbidity tube method is 7 NTU (see Table 3) which is higher than the Guideline. The multi-parameter water quality meter used for the BRHP has an optical turbidity sensor, which provides results to a much higher level of detection (0.1 NTU, ±0.3 or 2%); as such, a comparison of the results is not justifiable or useful.
Phosphate
Phosphate results for BRHP were within the Guideline value for most sites and samples except for the Bellinger River core sites in autumn 2017. Some results for the Riverwatch measurements for available phosphate were 0 ppm, which is likely inaccurate and a result of the limit of detection of the measurement method (0.07 ppm Available Phosphate = 22.86 μg/L Phosphate as P); for this reason, these results of 0 ppm were removed from further analysis. The level of detection of the Riverwatch method for available phosphate, which follows Waterwatch methods, is a major limitation of the testing procedure that limits the ability to compare results. Nonetheless, analysis of the remaining Riverwatch results suggested phosphate levels were often elevated, but Wilcoxon signed ranks test (unpaired) of the results suggested the Riverwatch results (M = 23.3, SD = 28.36) were significantly higher than the BRHP results (M = 6.13, SD = 5.82), (W = 62,367, p < 0.005). While many Riverwatch results were outside the Guideline, mean values for most sites were within the Guideline, although there were many sites with outliers (see Supplementary Figure S5), which suggests potential errors in sampling or measurement.
Considering results from the core freshwater sites only, the BRHP results were more consistent than the Riverwatch results, with fewer outliers and a reduced range for most sites (Figure 6), and likely a more accurate and realistic representation of environmental conditions. Paired Wilcoxon signed ranks test, examining the core sites with sample pairs from the same sites sampled in the same month, suggests the phosphate results of Riverwatch (M = 24.5, SD = 33.69) were significantly higher than the BRHP results (M = 4.71, SD = 3.05), (V = 1,504.5, p < 0.005).
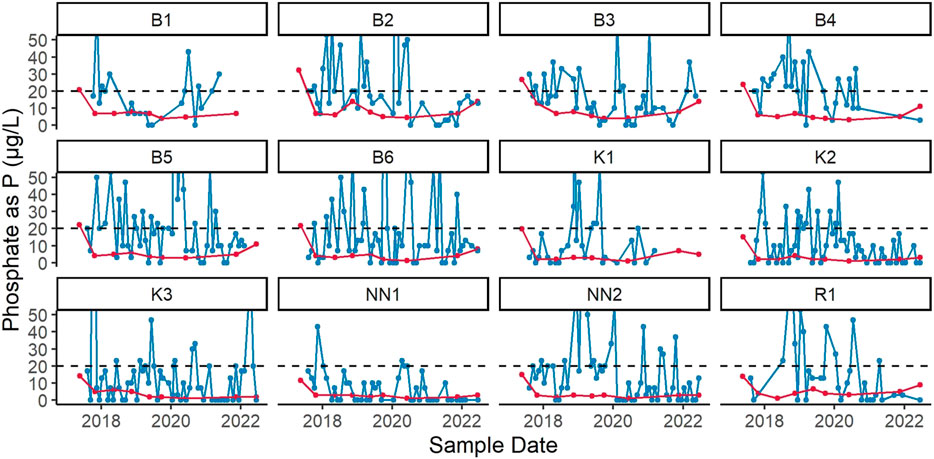
FIGURE 6. Phosphate as P (µg/L) for the Bellingen Riverwatch (blue) and Bellinger River Health Program (grey) programs (-- Guideline).
Discussion
This case study considers data collected for a community-led water quality monitoring program performed in conjunction with a professional science, Government-administered, water quality monitoring program. This case study highlights the notion that volunteer involvement in such projects can foster community engagement, raise awareness of the importance of river health, and reduce uncertainty about water quality issues within the community (Jordan et al., 2015; Gray et al., 2017). In addition, it highlights the potential for increasing the spatial and temporal coverage of monitoring programs and increasing the cost-effectiveness of traditional water quality monitoring programs while providing an incentive for corporate funding and support for citizen science programs (Haklay, 2013).
Comparative results between the Riverwatch and BRHP datasets show statistically significant differences for the majority of the water quality parameters considering all freshwater sites sampled. However, some parameters were found to be not significantly different when considering a paired analysis approach, which considered samples collected from the same site within the same month, for each of the separate programs, a valid sample pair. As such, the majority of the Riverwatch data should be considered reliable as it shows consistency over time at most sample sites, particularly for parameters of temperature, pH, and electrical conductivity. As the temperature fluctuates over diurnal and seasonal cycles and dissolved oxygen varies diurnally due to the photosynthesis and respiration of plants, algae, and bacteria (Bourg and Bertin, 1996; Boulton et al., 2014), assessment of these parameters needs to consider time of day for valid comparisons between programs. Nonetheless, paired sample comparisons demonstrated consistency between the two programs and the Riverwatch data appeared to capture seasonal variability and extreme values more accurately, which is important when considering factors that influence aquatic biota and river health (Liber et al., 2007). Similar discrepancies for dissolved oxygen and phosphorous were found in international research comparing citizen science and professional science-gathered datasets. For instance, this study and other international research found discrepancies in dissolved oxygen and phosphorous between citizen science-gathered data and professional science-gathered data. Albus et al. found discrepancies in dissolved oxygen gathered over a long period of time, and phosphorous was found to be statistically different when compared by Baalbaki et al. (2019) and Babiso et al. (2023).
The analysis of pH results across the two programs indicated comparative data even though the testing method of the Riverwatch citizen scientists (pH test strips) was much less precise than that of the BRHP (multiparameter water quality meter), with means and standard deviation of the two datasets being similar. The Electrical conductivity data also demonstrated similar results, with means not significantly different and similar standard deviations. Riverwatch uses single parameter meters for conductivity measurement, which, while not as precise as the meters used by BRHP, provides consistent results with minimal calibration required, although Riverwatch data shows that calibration of EC meters occurred prior to 68% of sample events. This shows that one of the overriding limitations of the Riverwatch data is the equipment used to measure parameters rather than the skills or abilities of citizen scientists. These pH and electrical conductivity results are similar to those found in international research performed by Safford and Peters in 2018 in Georgia and Rhode Island, Herman-Mercer et al., in 2018 in the Yukon area of Alaska and Canada, Albus et al., in 2020 in Texas State USA, Shelton in 2013 in Nova Scotia, Canada, and Baalbaki et al., in 2019 in Lebanon.
This work demonstrates that with adequate resources, well-trained and supported citizen science groups can provide professional scientists with valuable data that can be used to monitor riverine health at increasingly greater spatial and temporal scales. The social benefit of empowering the local community to be custodians of not only their local environment and the scientific information collected from it is boundless. One of the most obvious social outcomes of this joint citizen science and professional science program witnessed is the coming together of community members to help monitor and protect their local waterways with rigorous science. This creates waves within the community; the waterways become a greater talking point at the coffee shop, on social media, etc., and as such, this movement helps educate the wider community, which may not be involved in the citizen science program through word of mouth. There are far greater outcomes of this scenario, beyond monthly water quality monitoring, as the social gathering of like-minded individuals has, over the years, fostered the expansion of the citizen science water quality monitoring program, demonstrating a social snowball effect. There is no doubt that this program can be repeated in other parts of Australia or throughout the world.
By providing local communities with the tools, knowledge, and capability to effectively gather useful information, managers and custodians of ecosystems nationally (Robinson et al., 2020) and internationally (La Sorte and Somveille, 2020) will benefit. Having scientifically rigorous data collected by custodians at the doorstep of the environment in question can potentially deliver improved outcomes for waterways (Shupe, 2017) and the species that depend on them, such as the critically endangered Bellinger River snapping turtle. In this case study, the government scientists that deliver the monitoring for the BRHP are based over 500 km from the Bellinger River catchment. Although technology is providing increasingly more ways of connecting with communities (Wellman, 2004), the future of professional river health monitoring programs should incorporate as much collaboration with citizen science as possible. This would provide a more rigorous sampling regime than could be provided by the government’s biannual sampling regime and would have a much greater capacity to identify any water quality or chemistry changes that may make the turtle population more susceptible to the virus. This is crucial to ensure that if any poor water quality events occur, they are recognised as early as possible to facilitate intervention methods to help protect the turtle population from adverse water quality events.
This would facilitate more consistent and frequent data collection (Loiselle et al., 2017) and, providing there is some professional scientific cleansing and interpretation of the citizen science data, there is no reason why it cannot be used for valid scientific assessment and to inform management decisions (Jollymore et al., 2017). In an ideal scenario, citizen scientists would be provided sufficient funding to acquire the most accurate sampling and measurement equipment so that more reliable water quality data could be gathered. This could include funding for professional multi-parameter water quality meters and the provision of more sampling equipment, which would allow for highly reliable data that could be assessed against the Guidelines, reducing the time and resources needed for professional scientists to ensure appropriate interpretation of results. The collection of only the basic in situ water quality parameters is a major limitation of the Bellingen Riverwatch citizen science data. If funds and resources were made available for laboratory analysis of collected water chemistry samples, it would improve the reliability of more water quality parameters, such as nutrients, which may allow for a deeper understanding of the spatial and temporal variability of aquatic ecosystems (Forrest et al., 2019).
The alternative would be to prescribe regionally specific “citizen science” guidelines derived from their dataset to report against; however, this would have to consider a greater range of error due to the lower accuracy of the methods used for sample collection. In addition, it would need to consider, for some water quality parameters, specifically, phosphate and turbidity in this case study, that the methods do not allow the citizen scientists to reliably detect conditions within Guideline values. Thus, their results are commonly above the guidelines, which is problematic when assessing ecosystem health. Although this alternative of regionally specific “citizen science” guidelines would be more affordable than providing professional scientific equipment, it is our opinion that supplying professional equipment with appropriate additional training, funding laboratory analysis, providing ongoing QA/QC support, and providing mentoring for the interpretation of scientific data are essential to improve the results and outcomes of citizen science programs.
It is anticipated that this research will contribute to the citizen science research space, particularly for programs concerning the assessment of aquatic ecosystems, and it may lead to further discussion on factors that have led to the success of the program. The research demonstrates that the Bellingen Riverwatch community group provides robust, reliable data, which fills gaps in the professional science monitoring program. This is invaluable to the management of the waterways in the Bellingen and Kalang catchments and demonstrates that with the guidance, direction, and training of professional science, similar outcomes can be achieved by citizen scientists. This is a significant finding both nationally and internationally. It is important to note that cleansing of the Riverwatch data was required by professional scientists to effectively evaluate and analyse the results and should always be considered a necessity prior to using such results to inform management decisions. However, this highlights the need for citizen scientists and the scientific community to work collaboratively to ensure high-quality data are collected while providing opportunities for community education and the improvement of the spatial and temporal coverage that monitoring programs can deliver (Quinlivan et al., 2020).
The volunteers in this case study have a great deal of passion for the waterways discussed here and are able to focus this on their local waterways, more so than the professional scientists, who are stretched across many programs. These waterways are their local waterways; many of the volunteers were born in the area and therefore have a significant connection to the landscape. Such localised environmental stewardship underpinned by professional scientific equipment, training, QA/QC, and data management and interpretation should be nurtured and promoted by governments worldwide.
In conclusion, the case study of Bellingen Riverwatch provides insight into how a well-supported volunteer community science program, in conjunction with and supported by professional science, has the potential to deliver water quality monitoring programs that are highly robust and reliable to waterway managers. This program has provided educational benefits for the greater local community as well as both the citizen scientists and professional scientists involved. The lead authors of this manuscript are professional scientists who work for the Government. We are incredibly passionate about our scientific stewardship of the team of citizen scientists involved in this program. Their passion and dedication surrounding healthy waterways is a powerful motivator for professional scientists. We have a passion for waterway management, ecosystem improvement, and the protection of these environments for future generations. We want to pass on our knowledge to the community to empower communities to take scientific stewardship of their waterways. There is no better space in which to work as a waterway manager. The benefit for professional scientists is not lost here. In conclusion, we hope this case study can provide insights into what can be achieved with highly motivated community groups working collaboratively with the scientific community.
Data availability statement
The datasets presented in this study can be found in online repositories. The names of the repository/repositories and accession number(s) can be found below: https://datasets.seed.nsw.gov.au/dataset/f3bcc84c-3487-4558-a182-37c794232bf6/resource/4749ab3b-b376-4697-9536-efd6a4512772/download/bellingen-riverwatch-ongoing-data_last-updated-20210812_ig-1.xlsx.
Ethics statement
Ethical review and approval was not required for the study on human participants in accordance with the local legislation and institutional requirements. Written informed consent from the participants was not required to participate in this study in accordance with the national legislation and the institutional requirements.
Author contributions
All listed authors contributed to the conception and design of the study. All authors contributed to the monitoring programs that gathered data that contributed to the study. AmD and IG organised the Bellingen Riverwatch data and AdD and NB managed the DPE Science, Economics and Insights Division data. AdD and NB performed the statistical analysis. NB and AdD wrote the first draft of the manuscript. All authors contributed to the article and approved the submitted version.
Funding
This project was funded by the NSW Department of Planning and Environment (formerly the NSW Department of Planning Industry and Environment and the NSW Office of Environment & Heritage), Saving our Species, Local Land Services and Biodiversity and Conservation.
Acknowledgments
We acknowledge the traditional custodians of the land on which this research was performed on. It is a privilege to walk and work on the land of the Gumbaynggirr people. We pay our respects to ancestors and elders, past, present, and emerging. This manuscript is dedicated to the Bellingen Riverwatch group of citizen scientists. These volunteers have an undeniable passion for their local environment and are irrefutably devoted custodians of their local waterways. We would like to acknowledge the field and laboratory assistance provided by Peter Serov and Tara Steele. The original concept and community engagement was led and supported by the Saving Our Species team in the Citizen Science, Science Strategy and Impact Branch of DPE in combination with Ecosystems and Threatened Species Unit North East, DPE; Water Wetlands and Coastal Science Branch, DPE; the Australian Citizen Science Association (ACSA) Building better regions fund; OzGREEN; NSW Waterwatch; Australian Geographic; Billabong Zoo; Western Sydney University; Taronga Zoo Sydney; Bellinger Landcare; Earthwatch Institute; Eco Logical Australia; North Coast Local Land Services; Jaliigirr Biodiversity Alliance; Bellingen High School; Chrysalis Steiner School; Orama Public School; Repton Public School; and Bellingen Public School.
Conflict of interest
Author IG was employed by EnviroComm Connections.
The remaining authors declare that the research was conducted in the absence of any commercial or financial relationships that could be construed as a potential conflict of interest.
Publisher’s note
All claims expressed in this article are solely those of the authors and do not necessarily represent those of their affiliated organizations, or those of the publisher, the editors and the reviewers. Any product that may be evaluated in this article, or claim that may be made by its manufacturer, is not guaranteed or endorsed by the publisher.
Supplementary material
The Supplementary Material for this article can be found online at: https://www.frontiersin.org/articles/10.3389/fenvs.2023.1237580/full#supplementary-material
References
Albus, K. H., Thompson, R., Mitchell, F., Kennedy, J., and Ponette-González, A. G. (2020). Accuracy of long-term volunteer water monitoring data: a multiscale analysis from a statewide citizen science program. PLoS ONE 15 (1), e0227540. doi:10.1371/journal.pone.0227540
Anhalt-Depies, C., Stenglein, J. L., Zuckerberg, B., Townsend, P. A., and Rissman, A. R. (2019). Tradeoffs and tools for data quality, privacy, transparency, and trust in citizen science. Biol. Conserv. 238, 108195. doi:10.1016/j.biocon.2019.108195
ANZECC (2000). Australian and New Zealand guidelines for fresh and marine water quality. Canberra: Australian and New Zealand Environment and Conservation Council and Agriculture and Resource Management Council of Australia and New Zealand.
ANZG (2018). Australian and New Zealand Guidelines for fresh and marine water quality Canberra ACT, Australia: Australian and New Zealand Governments and Australian state and territory governments.
Baabaki, R., Ahmad, S. A., Kays, W., Talhouk, S. N., Saliba, N. A., and Al-Hindi, M. (2019). Citizen science in Lebanon - a case study for groundwater quality monitoring. R. Soc. Open Sci. 6, 181871. doi:10.1098/rsos.181871
Babiso, W. Z., Ayano, K. K., Haile, A. T., Keche, D. D., Acharya, K., and Werner, D. (2023). Citizen science for water quality monitoring in the Meki River, Ethiopia: quality assurance and comparison with conventional methods. Qual. Assur. Comp. Conventional Methods. Water 15, 238. doi:10.3390/w15020238
Baker, M. (2016). 1,500 scientists lift the lid on reproducibility. Nature 533, 452–454. doi:10.1038/533452a
Ballard, H., Dixon, C., and Harris, E. (2017). Youth-focused citizen science: examining the role of environmental science learning and agency for conservation. Biol. Conserv. 208, 65–75. doi:10.1016/J.BIOCON.2016.05.024
Boulton, A. J., Brock, M. A., Robson, B. J., Ryder, D. S., Chambers, J. M., and Davis, J. A. (2014). Australian freshwater ecology: processes and management. Chichester, West Sussex: Wiley Blackwell.
Bourg, A. C. M., and Bertin, C. (1996). Diurnal variations in the water chemistry of a river contaminated by heavy metals: natural biological cycling and anthropic influence. Water, Air, Soil Pollut. 86, 101–116. doi:10.1007/bf00279148
Capdevila, A. S. L., Kokimova, A., Ray, S. S., Avellán, T., Kim, J., and Kirschke, S. (2020). Success factors for citizen science projects in water quality monitoring. Sci. Total Environ. 728, 137843. doi:10.1016/j.scitotenv.2020.137843
Crossman, J., Futter, M. N., Elliott, J. A., Whitehead, P. G., Jin, L., and Dillon, P. J. (2019). Optimizing land management strategies for maximum improvements in lake dissolved oxygen concentrations. Sci. Total Environ. 652, 382–397. doi:10.1016/j.scitotenv.2018.10.160
Department of Planning and Environment (2023). Water in New South Wales: bellinger. Available: https://www.industry.nsw.gov.au/water/basins-catchments/snapshots/bellinger (Accessed April 13, 2023).
Dickinson, J. L., Shirk, J., Bonter, D., Bonney, R., Crain, L. R., Martin, J., et al. (2012). The current state of citizen science as a tool for ecological research and public engagement. Front. Ecol. Environ. 10, 291–297. doi:10.1890/110236
EPA (2022). “Approved methods for the sampling and analysis of water pollutants in NSW,” in Parramatta: NSW environment protection authority. Editor E. P. Authority
EPA (Environmental Protection Agency) (2016). Environmental protection belongs to the public: a vision for citizen science at EPA. Washington. DC: EPA.
Forrest, S. A., Holman, L., Murphy, M., and Vermaire, J. C. (2019). Citizen science sampling programs as a technique for monitoring microplastic pollution: results, lessons learned and recommendations for working with volunteers for monitoring plastic pollution in freshwater ecosystems. Environ. Monit. Assess. 191, 172. doi:10.1007/s10661-019-7297-3
Gray, S., Jordan, R., Crall, A., Newman, G., Hmelo-silver, C., Huang, J., et al. (2017). Combining participatory modelling and citizen science to support volunteer conservation action. Biol. Conserv. 208, 76–86. doi:10.1016/j.biocon.2016.07.037
Haklay, M. (2013). Citizen science and volunteered geographic information: overview and typology of participation. Knowledge, 105–122. doi:10.1007/978-94-007-4587-2_7
Hampton, S. E., Strasser, C. A., Tewksbury, J. J., Gram, W. K., Budden, A. E., Batcheller, A. L., et al. (2013). Big data and the future of ecology. Front. Ecol. Environ. 11, 156–162. doi:10.1890/120103
Havens, K., and Henderson, S. (2013). Citizen science takes root. American Scientist. America: Sigma Xi, The Scientific Research Honor Society.
Herman-Mercer, N., Antweiler, R., Wilson, N., Mutter, E., Toohey, R., and Schuster, P. (2018). Data quality from a community-based, water-quality monitoring project in the Yukon River Basin. Case Stud. 3, 1. doi:10.5334/cstp.123
Hintze, J. L., and Nelson, R. D. (1998). Violin plots: a box plot-density trace synergism. Am. Statistician 52, 181–184. doi:10.1080/00031305.1998.10480559
HORIBA (2010). Multi water quality checker U-50 series instruction manual. Miyanohigashi, kisshoin minami-ku, kyoto 601-8510 Japan. Kyoto, Japan: HORIBA Ltd.
Jollymore, A., Haines, M. J., Satterfield, T., and Johnson, M. S. (2017). Citizen science for water quality monitoring: data implications of citizen perspectives. J. Environ. Manag. 200, 456–467. doi:10.1016/j.jenvman.2017.05.083
Jordan, R., Crall, A., Gray, S., Phillips, T., and Mellor, D. (2015). Citizen science as a distinct field of inquiry. BioScience 65, 208–211. doi:10.1093/biosci/biu217
Kasperowski, D., and Kullenberg, C. (2019). The many modes of citizen science. Sci. Technol. Stud. 32 (2), 2–7. doi:10.23987/sts.74404
La Sorte, F. A., and Somveille, M. (2020). Survey completeness of a global citizen-science database of bird occurrence. Ecography 43, 34–43. doi:10.1111/ecog.04632
Latimore, J. A., and Steen, P. J. (2014). Integrating freshwater science and local management through volunteer monitoring partnerships: the Michigan Clean Water Corps. Freshw. Sci. 33, 686–692. doi:10.1086/676118
Liber, K., Goodfellow, W., Den Besten, P., Clements, W., Galloway, T., Gerhardt, A., et al. (2007). In situ-based effects measures: considerations for improving methods and approaches. Integr. Environ. Assess. Manag. Int. J. 3, 246–258. doi:10.1897/2006-029fin.1
Loiselle, S. A., Frost, P. C., Turak, E., and Thornhill, I. (2017). Citizen scientists supporting environmental research priorities. Sci. Total Environ. 598, 937. doi:10.1016/j.scitotenv.2017.03.142
Miller, D., Poucher, S., and Coiro, L. (2002). Determination of lethal dissolved oxygen levels for selected marine and estuarine fishes, crustaceans, and a bivalve. Mar. Biol. 140, 287–296. doi:10.1007/s002270100702
Pearce-Higgins, J. W., Baillie, S. R., Boughey, K., Bourn, N. A. D., Foppen, R. P. B., Gillings, S., et al. (2018). Overcoming the challenges of public data archiving for citizen science biodiversity recording and monitoring schemes. J. Appl. Ecol. 55, 2544–2551. 25. doi:10.1111/1365-2664.13180
Piesing, M. (2020). The rise of citizen science: can the public help solve our biggest problems? Sydney, Australia: The Guardian.
Poisson, A. C., McCullough, I. M., Cheruvelil, K. S., Elliott, K. C., Latimore, J. O., and Soranno, P. A. (2020). Quantifying the contribution of citizen science to broad-scale ecological databases. Front. Ecol. Environ. 18 (1), 19–26. Ecological Society of America. Wiley. doi:10.1002/fee.2128
Quinlivan, L., Chapman, D. V., and Sullivan, T. (2020). Validating citizen science monitoring of ambient water quality for the United Nations sustainable development goals. Sci. Total Environ. 699, 134255. doi:10.1016/j.scitotenv.2019.134255
Robinson, O. J., Ruiz-Gutierrez, V., Reynolds, M. D., Golet, G. H., Strimas-Mackey, M., and Fink, D. (2020). Integrating citizen science data with expert surveys increases accuracy and spatial extent of species distribution models. Divers. Distributions 26, 976–986. doi:10.1111/ddi.13068
Safford, H., and Peters, C. A. (2018). Citizen science for dissolved oxygen monitoring: case studies from Georgia and Rhode Island. Environ. Eng. Sci. 35, 362–372. doi:10.1089/ees.2017.0218
Science Council (2023). Our definition of science. London, England: The Science Council. Available at: https://sciencecouncil.org/about-science/our-definition-of-science/ (Accessed August 15, 2023).
Shelton, A. M. (2013). “The accuracy of water quality monitoring data: a comparison between citizen scientists and professionals,” in Partial fulfillment of the requirements for the degree of master of science in applied science (Halifax, Nova Scotia: A Thesis Submitted to Saint Mary's University).
Shupe, S. M. (2017). High resolution stream water quality assessment in the Vancouver, British Columbia region: a citizen science study. Sci. Total Environ. 603-604, 745–759. doi:10.1016/j.scitotenv.2017.02.195
Silvertown, J. (2009). A new dawn for citizen science. Trends Ecol. Evol. 24 (9), 467–471. doi:10.1016/j.tree.2009.03.017
Summers, J. K., Weisberg, S. B., Holland, A. F., Kou, J., Engle, V. D., Breitberg, D. L., et al. (1997). Characterizing dissolved oxygen conditions in estuarine environments. Environ. Monit. Assess. 45, 321–330. doi:10.1023/a:1005726718951
Theobald, E. J., Ettinger, A. K., Burgess, H. K., DeBey, L. B., Schmidt, N. R., Froehlich, H. E., et al. (2015). Global change and local solutions: tapping the unrealized potential of citizen science for biodiversity research. Biol. Conserv. 181, 236–244. doi:10.1016/j.biocon.2014.10.021
Turak, E., Waddell, N., and Johnstone, G. (2004). NSW Australian river assessment system sampling and processing manual. Sydney, Australia: NSW Department of Environment and Conservation, Natural Heritage Trust.
Wellman, B. (2004). Connecting communities: on and offline. Contexts 3, 22–28. doi:10.1525/ctx.2004.3.4.22
Keywords: citizen science, water quality monitoring, river health, Bellingen Riverwatch, transdisciplinary research, community-based monitoring, data validation
Citation: Dickson A, Belmer N, Denshire A, Garland I, Lennox S, Ruming S, Lawler D and Wethered A (2024) Can citizen science inform science? Evaluating the results of the Bellingen Riverwatch citizen science program and a complimentary government monitoring program. Front. Environ. Sci. 11:1237580. doi: 10.3389/fenvs.2023.1237580
Received: 09 June 2023; Accepted: 11 December 2023;
Published: 04 January 2024.
Edited by:
Erin Roger, Commonwealth Scientific and Industrial Research Organisation (CSIRO), AustraliaReviewed by:
Janet Anstee, Commonwealth Scientific and Industrial Research Organisation (CSIRO), AustraliaDidone Frigerio, University of Vienna, Austria
Copyright © 2024 Dickson, Belmer, Denshire, Garland, Lennox, Ruming, Lawler and Wethered. This is an open-access article distributed under the terms of the Creative Commons Attribution License (CC BY). The use, distribution or reproduction in other forums is permitted, provided the original author(s) and the copyright owner(s) are credited and that the original publication in this journal is cited, in accordance with accepted academic practice. No use, distribution or reproduction is permitted which does not comply with these terms.
*Correspondence: Adrian Dickson, YWRyaWFuLmRpY2tzb25AZW52aXJvbm1lbnQubnN3Lmdvdi5hdQ==