 Hongsheng Zhao
 Shuang Feng1,2†
- 1College of Desert Management, Inner Mongolia Agricultural University, Hohhot, Inner Mongolia, China
- 2Iner Mongolia Hangjin Desert Ecological Position Research Station, Ordos, Inner Mongolia, China
- 3Desert Ecosystem Conservation and Restoration Innovation Team, Inner Mongolia Agricultural University, Hohhot, Inner Mongolia, China
- 4Water Conservancy Science Research Institute of Inner Mongolia, Hohhot, Inner Mongolia, China
Better understanding the wind regimes and dune activity criteria are pre-requisites for the successful planning of any sand dune fixation project and hence have a high priority. To fully understand wind energy conditions and the intensity of aeolian activity, we investigated the wind conditions, sand-transporting potential, and sand-transporting capacity of the basins of mid-course ten tributaries of the Yellow River through field observations and indoor analyses. 1) The analysis of wind energy, which is based on sand transport potential, demonstrates that there is substantial spatial variation within the study area. The western part, which is located near the Kubuqi Desert, qualifies as a high wind energy zone. In contrast, the central part belongs to the medium wind energy zone, whereas the eastern part is categorized as a low wind energy zone. Even though there are notable differences in the sand transport potential characteristics across different time scales, the direction of the synthesized sand transport potential tends to be consistent, predominantly leaning towards the southeast. This orientation provides the requisite energy for the sand material to be transported into the river. 2) The prevailing sand-producing wind direction at various timescales in the research area was dominated by westward (W, WNW, NW) and northward (NNW, N) winds, with distinct seasonality. This seasonal variability was especially prominent in spring, which saw the highest frequency of aeolian activity and the largest volume of sand transport. Autumn and winter exhibited similar patterns, and, in the summer, it was the lowest 3) The relationship between sand-transporting potential and sand-transporting capacity, which is a crucial aspect of aeolian geomorphology, could be adequately depicted using a fitting function based on the temporal patterns of wind speed. During periods of high wind, the sand-transporting potential and sand-transporting capacity of the basins of the ten tributaries followed a power function relationship. Conversely, during periods of low wind, they followed an exponential function relationship. These results imply that spring should be deemed as the crucial period for wind-sand prevention and control. Additionally, emphasis should be placed on the western part, which is situated close to the sand source area, as the primary prevention and control zone.
1 Introduction
The middle reach area of the ten tributaries that border the Yellow River occupies approximately 38% of the total area of these tributaries, roughly 4,042.6 km2 (Wang and Chen, 2020). This region, which is characterized by extensive expanses of mobile sand dunes, stands as one of the primary contributors to the formation of the “suspended river” of the Yellow River in the Inner Mongolia segment and downstream sections. Consequently, it serves as one of the direct contributors to the “above-ground hanging river” in the Inner Mongolia section and downstream of the Yellow River. Driven by frequent sandstorms, sand dunes in this area are pushed towards the river channel at a rate of approximately 3–8 m per year. During the flood season, which is characterized by heavy rainfall, mudslides and flash floods bring a large amount of sediments into the Yellow River. These sediments disrupt the normal flow of the Yellow River in the Hetao Plain area, which is known for its delicate ecosystem, thus posing significant safety risks. Reports showed that, since the 1950s, sediments carried by the river had blocked the Yellow River eight times. Moreover, under the influence of northwestern winds, which are predominant in the region, the amount of sediments transported to the Yellow River annually exceed one-tenth of the total sediment input into the Yellow River. Most of the large, coarse particles entering the main stream, in the form of high-sediment flow, are deposited in the riverbed. This led to the formation of an actual “above-ground hanging river,” a phenomenon that significantly impacts the region’s geography (Xu, 2014).
The measurement of sand transport potential, which serves as an essential index to gauge the intensity of regional wind and sand activities, and its related variables have found widespread application in research concerning wind conditions, deserts, and dune landscapes both domestically and internationally (Moursy et al., 2002, for example, individually assessed the changes in sand transport potential within areas like the Nile Valley and Delta, Kuwait Desert, and Egypt’s E1-Khanka region. Similarly, studies were conducted by Wang et al., 2006), and others on the characteristics of sand transport potential in regions such as Northern China, the Taklimakan Desert, the Badain Jaran Desert, the Dunhuang Desert-Oasis transition zone, and the Qaidam Basin. Jewell and Nicol et al. (2011) utilized long-term meteorological observation data to construct a model correlating RDP with wind speed, which is used for estimating sand transport volumes in regions prone to frequent wind and sand damage, including areas in Africa, Asia, and North America, This empirical modeling approach is an efficient means of understanding patterns of seasonal sand transport without the complexity inherent in conventional sand transport models based on short time-increments of wind speed or shear velocity. In similar fashion, Abbasi et al. (2021) found that using wind run (i.e., wind speed integrated over time) to estimate sand drift resulted in smaller prediction errors than those typically found with conventional sand transport mod.
Wind is a powerful force that shapes the surface of our planet. When strong winds carry sand, they can cause erosion and even lead to sandstorms. The sand-transport potential and the resultant sand-transport potential can be used to measure the intensity of aeolian sand activity in a region and deduce the laws of aeolian sand geomorphology evolution. The Inner Mongolia section of the Yellow River is located in a high-altitude area with strong winds and sandstorms. Influenced by the Kubuqi Desert, ten tributaries deposit a large amount of sand into the river every year. Due to the lack of long-term wind energy environment monitoring data, our understanding of the wind energy environment is insufficient and relevant studies on the characteristics and evolution of desertification in this area are also lacking. Therefore, clarifying the wind and sediment transport conditions in the study area is helpful for understanding the regional wind-sand activity process, scientifically estimating the amount of wind-blown sand into the Yellow River, and providing data references for ecological management of the Yellow River Basin. The results are expected to provide data support for soil and water conservation and sand control work in the region, which are crucial for maintaining its ecological balance.
1.1 Overview of the research area
Originating from the northern edge of the Ordos Plateau, the ten tributaries along the Yellow River, which were central to this study, cross the Kubuqi Desert before eventually flowing into the Yellow River (Figure 1). The study area is located on the right bank of the Inner Mongolia section of the Yellow River, at the confluence with the river-bend of the head of Sanhu River outlet. Over a stretch of 220 km, the tributaries merged successively into the Yellow River from west to east in the following order: Mao Bulang River, Buersetai Gully, Hei Lai Gully, Xi Liu Gully, Hantai River, Haoqing River, Hashila River, Muhar River, Dong Liu Gully, and Husitai River. These tributaries have been recognized as the primary sand-producing tributaries in the Inner Mongolia section of the Yellow River.
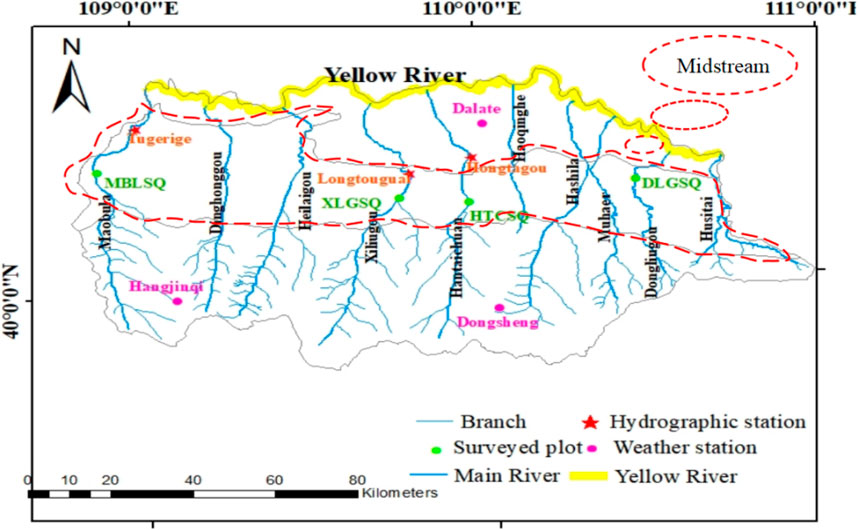
FIGURE 1. Geographic location of the ten tributary basins.
The total watershed area of the ten rivers is 10,767 km2. The climate in this region is characterized as a temperate continental monsoon climate, reflecting a natural desert region of the eastern Ordos Plateau. The precipitation in the study area is small and unevenly distributed in both time and space. The average annual precipitation ranges from 200 mm to 350 mm, with July to September accounting for about 70% of the total yearly rainfall. The climate is dry, with strong evaporation rates that are approximately seven times higher than the amount of precipitation. Due to low precipitation and a dry climate, strong and sandy weather often occurs, typically concentrated from March to May. The annual average number of strong days is 24, with wind speeds reaching up to 17 m/s. The distribution characteristics of soil and vegetation types in the ten regions are highly zonal. Loess and chestnut soils dominate the upstream hilly and gully region, while mobile, fixed, and semi-fixed aeolian soils dominate the middle aeolian sand region. In the lower alluvial plain region, irrigated silt, saline soil, alkaline soil, and meadow soil are dominant. The vegetation types gradually change from the typical steppe in the southeast to the desert steppe and steppe desert in the northwest, with xerophilous and semi-early-growing scrub and steppe being the main vegetation types in the region (Zhu et al., 2014).
2 Research methodology
2.1 Acquisition of meteorological data
Two types of meteorological data were used in this study. The first type was obtained from global ground meteorological stations at an observational height of 10 m. The data were collected from three meteorological stations, Dalad Banner, Dongsheng District, and Hangjin Banner, which are situated around the watershed of the ten tributaries. Wind data, covering the period from 2020 to 2022, were obtained from these stations via CMDC (http://data.cma.cn).
The second type of data was determined based on the actual terrain and flow field characteristics. Among the ten tributaries, four (Mao Bulang River, Xi Liu Gully, Hantai River, and Dong Liu Gully) were selected as typical research areas. In the midstream wind and sand area of these four watersheds, one automatic weather station (TZXBF01100W, United States) was set up. These stations are capable of simultaneously observing conventional meteorological factors such as temperature, wind direction, wind speed, solar radiation, ground temperature, and evaporation. The scanning frequency of the automatic weather station was 2 min, and the recorded data was the average value of the data within 30 min. The monitoring data were obtained from the website (http://cloud.usr.cn/). The observation period spanned 24 months, from 2020 to 2022.
2.2 Sand transport quantity determination
In March 2020, the basins of the Mao Bulang River, Xi Liu Gully, the Hantai River, and Dong Liu Gully were selected as typical research areas to examine the patterns of aeolian sand transport in their midstream wind and sand areas. At the junction of the riverbed and the sand dunes corresponding to different underlying surfaces, a flat terrain was selected as a typical observation cross-section on both the east and west banks (upstream and downstream wind directions) of the riverbed. The cross-section areas were designated A1/2/3/4 and B1/2/3/4, respectively (Figure 2).
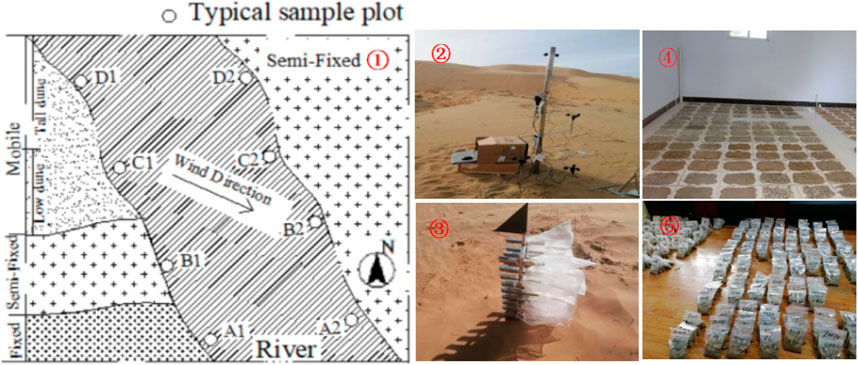
FIGURE 2. ① Schematic diagram of observation point arrangement; ② Instrument arrangement at the observation site; ③ HOBO weather station; ④ Sand catcher; ⑤, ⑥ Soil samples. Schematic diagram of plot setting and diagram of instrument arrangement.
To ensure date accueacy, wind conditions and wind sand transport were monitored simultaneously.
A small automatic weather station (ONSET HOBO U30-NRC, United States) was employed to obtain wind speed data at different heights within the range of 0–200 cm, with wind speed gradients at 10 cm, 30 cm, 50 cm, 70 cm, 100 cm, and 200 cm. For the monitoring of sand transport rate, step-type sand catchers were used. The sand catchers had a total height of 50 cm, 25 sand inlets, and a single inlet area of 2 cm × 2 cm, boasting a sand collection efficiency of 90%. During the observation of wind sand, the bottom of all sand catchers was at the ground level, and sand collection was carried out concurrently with wind measurement. To ensure sufficient and accurate sand collection, the direction of the sand inlet was adjusted based on the wind direction at the time, and each sand collection observation time lasted at least 20 min to simultaneously observe and record multiple sets of data. The sand samples collected by the sand catcher were air-dried and weighed with a one-thousandth electronic balance (accuracy 0.001 g), and the sand transport rate was expressed as the total sand transport quantity per unit time per unit width within the observation height. Before the observation began, surface sediment samples were collected from the predetermined observation positions (A, B, C, D), and three sets of samples were taken at each position for averaging.
2.3 Determination of wind erosion
Wind erosion was measured according to the standard meteorological station regulations set by the China Meteorological Administration, which typically considers a measurement height of 10 m for wind speed. However, due to the unique positioning of our automatic weather station within the dune group, the wind speed data was collected at a height of 2 m. Therefore, a conversion formula was necessary to translate the wind speed data at a height of 2 m to wind speed data at a height of 10 m. However, such a conversion was not required for the wind direction (Bagnold, 1974).
In this formula, U10 is wind speed at 10 m,U2 is wind speed at 2 m, and Z0 is surface roughness.
The friction wind speed U* is a critical determinant of the sand generation potential of the surface, and it remains virtually unchanged with height within the near-ground air layer. Using an empirical formula proportional to the distance from the solid wall, which introduces the experimental parameter, Karman’s constant, we arrived at the logarithmic law formula of the near-wall surface under fully developed steady-state turbulence. We assumed that the airflow within the internal boundary layer fully adjusts to the new surface, making the wind profile a logarithmic function of height (Fryberger and Dean, 1979).
In this formula, Uz is wind speed at z m (m/s), k is von Karman’s constant (0.4), Z0 is surface roughness m), and d is zero plane displacement m). Finally, Z0 could be obtained from the intercept of the linear function formed by ln (z-d) and U2.
The roughness parameter, which is directly related to the height of roughness elements (such as vegetation and random surface roughness), is an important parameter of rough surfaces, indicating the average level of momentum absorbed by individual roughness elements. Initially, we calculated d based on h using the following formula (Lancaster, 1997):
In this formula, h denotes the height of the roughness element. Eventually, we corrected d according to the relationship between ln (z-d) and U2. The optimal d was achieved when R2 was maximized.
In Eq. 2, the friction wind speed U* and the aerodynamic roughness Z0 can be calculated according to the wind speed profile under the neutral layer structure, even though the neutral layer structure generally occurs under high wind speed conditions. Nevertheless, we can judge this based on the Richardson number:
In this equation, Ri is the Richardson number, g is gravitational acceleration (9.8 m/s), and T is the atmospheric temperature K). Thom calculated the Richardson number under neutral stratification conditions to be between −0.01 and 0.01 (McKee, 1979).
2.4 Sand transport calculations
The sand transport potential reflects the ability of wind erosion in a certain direction to transport sand over a period of time. The formulas for the sand transport potential of the two wind directions with the highest frequency of wind over a period of time are as follows:
In the equation, DP is the sand transport potential (vector unit, VU), U and Ut are the wind speed and the threshold wind speed at 10 m height, respectively (knot), and t is the frequency of wind speed U. The synthetic sand transport direction (RDD) is the net sand transport direction; the synthetic sand transport potential (RDP) (VU) represents the net sand transport potential. The direction change rate is the ratio of RDP to the total DP, reflecting the singularity of the direction of the sand-raising wind.
Fryberge et al. divided the wind energy environment and wind direction change rate according to the size of the annual sand transport potential, as shown in Table 1.

TABLE 1. Classification of wind energy environment and wind direction change rate.
The wind direction frequency rose diagram is a statistical graph of the frequency of each wind direction over a period of time, and it is an important analytical tool reflecting wind conditions in the sand area. The sand transport rose diagram could reflect the wind conditions of the sand area, based on which the wind conditions could be divided into narrow single peak, wide single peak, sharp double peak, blunt double peak, and composite five types of wind conditions (Yizhaq et al., 2020).
2.5 Substrate type division
Field surveys were conducted from June to August in the years 2020–2022 to map the plant community within the research area. Survey points were selected in areas where the spatial distribution of plants was relatively uniform to ensure good representativeness. At each selected survey point, a 100 m × 100 m plot was selected and the five-point method and diagonal method were used to set up 5 shrub plots and 9 herb plots. Comprehensive investigations were carried out for all shrubs and herbs within the plot, and the ecological “three degrees one quantity” method was used to measure the basic characteristics of the plant (Figure 3).
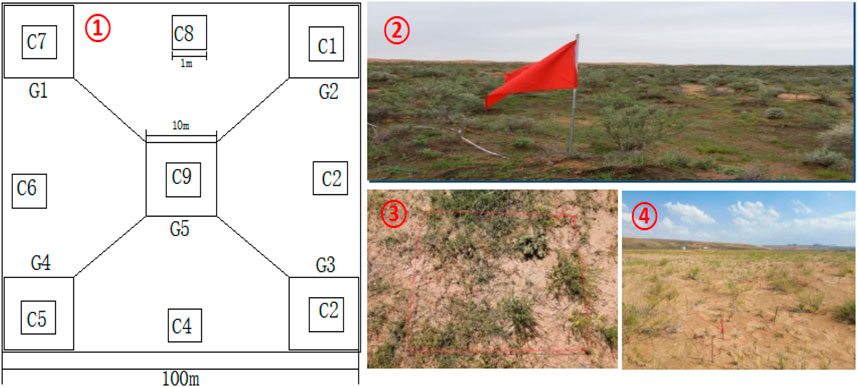
FIGURE 3. ① Schematic diagram of plot setting (C1-9: Herb plot; G1-5: Shrub plot); ② Plot selection; ③ Herb plot; ④ Shrub plot. Plot layout and survey.
2.6 Data processing
The calculation of vegetation coverage, analysis of wind speed, wind direction and sand transport data was performed using Microsoft Excel software. The representation of wind direction through a rose diagram and sand transport rate through a diagram was facilitated by the use of Origin 2021 software. Finally, the experimental layout diagram was created using AutoCAD version 19.0.
3 Results and analysis
3.1 Wind characteristics of the ten tributary basins
3.1.1 Variation of sand-raising winds at different time scales
Wind speed, which is a fundamental parameter in evaluating wind and sand activities in the region (Zhang et al., 2012), was comprehensively analyzed using data from seven meteorological stations. This analysis revealed a consistent trend in wind speed each month in the research area from 2020 to 2022 (Figure 4A). The speeds of the main sand-raising wind, which occurred from March to June, ranged from 0 to 13.49 m/s. The second-most significant period was winter, when the prevailing winds were observed to come from the west-northwest, northwest, and north-northwest (292.5°–337.5°) (Figure 4B).
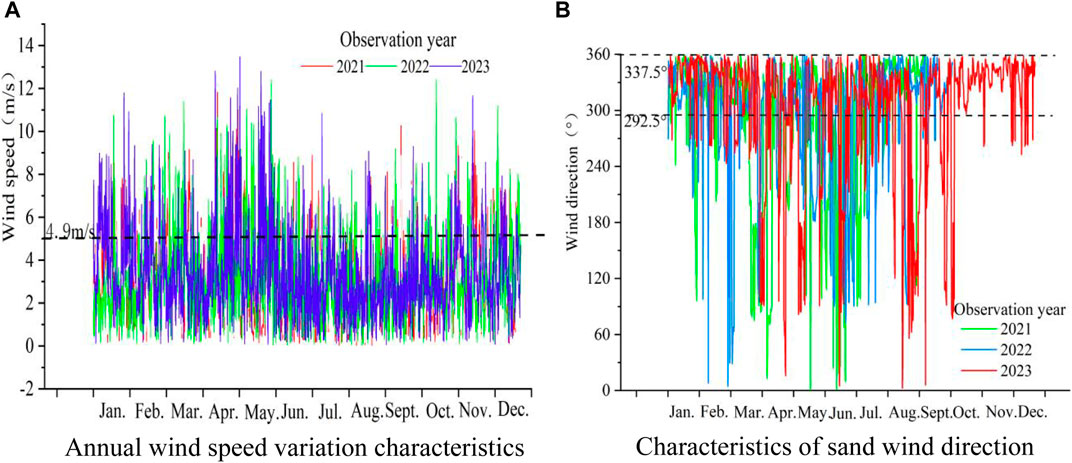
FIGURE 4. (A) Annual wind speed variation characteristics. (B) Characteristics of sand wind direction. Wind speed and direction characteristics of the ten tributaries.
The annual and monthly average wind speeds, which are crucial indicators for measuring the intensity of regional wind and sand activities, presented variations in wind speed at different time scales.
The annual average wind speed and sand-rasing wind speed, which remained relatively stable from 2020 to 2022, showed some variation across the ten tributaries dune region (Figure 5). The annual average wind speed, recorded at 7 sites, fluctuated between 2.91 m/s—4.41 m/s. Interestingly, the average sand-rasing wind speed, which was significantly higher than the average wind speed, ranged between 5.79 m/s—7.22 m/s. The frequency of these sand-rasing winds displayed an increasing trend and decreased progressively from west to east, which is due to the higher altitude and diverse topography in the western region, a factor that led to higher wind speeds than those recorded in the eastern region.
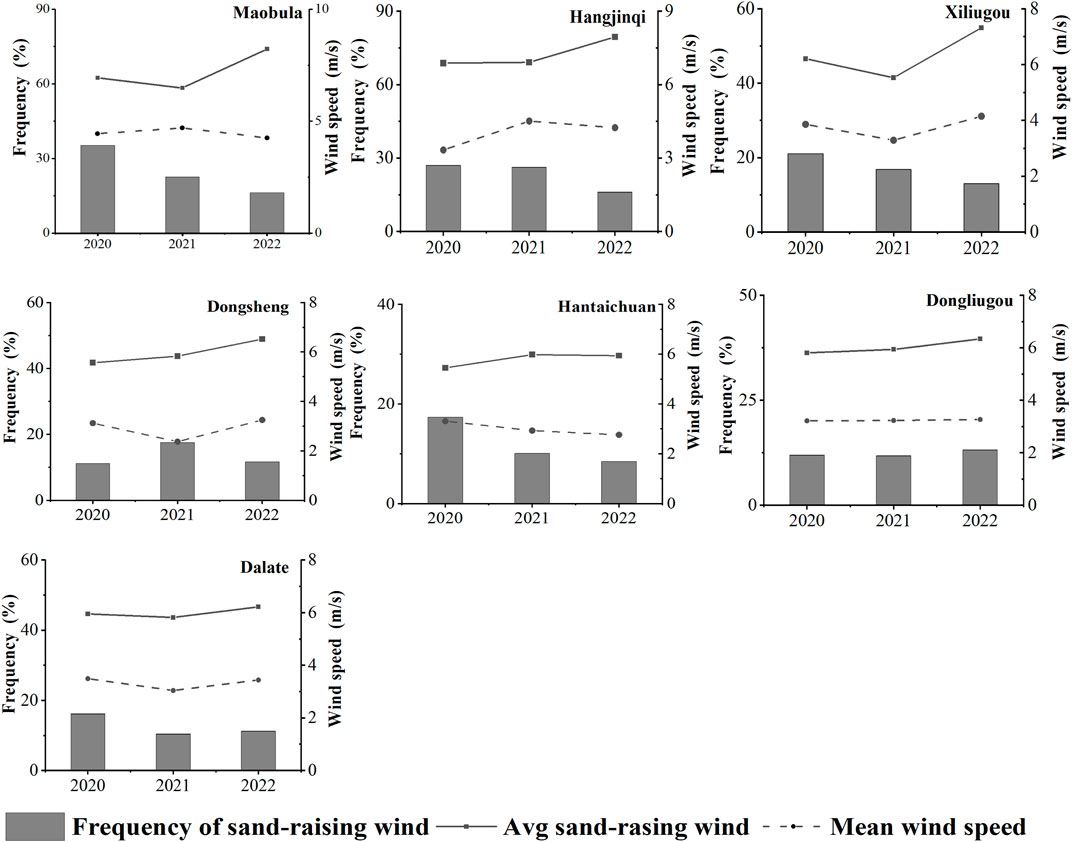
FIGURE 5. Characteristics of wind conditions at different meteorological stations.
The annual average speed of sand-raising wind was 6.41 m/s. The monthly average speed of sand-raising wind fluctuated between 5.93 m/s (in July) and 7.01 m/s (in May). The monthly average wind speed ranged from 2.55 m/s (in August) to 4.11 m/s (in May), all of which were below the average speed of sand-raising wind (5 m/s). This indicated that the frequency of sand-raising wind was relatively small in different months, calculated to be between 15.99% (in August) and 25.43% (in May), with an annual average sand-raising wind frequency of 17.85%. The maximum speed of sand-raising wind in different months ranged from 8.08 m/s (in August) to 11.37 m/s (in April), from which the annual average characteristics of sand-raising wind in the research area were derived (Figure 6).
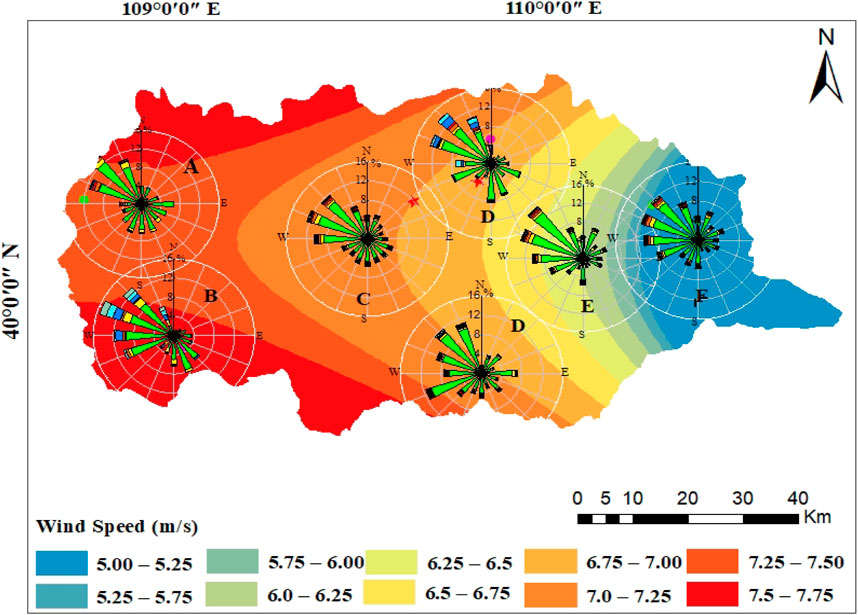
FIGURE 6. Annual average characteristics of sand-raising wind at different meteorological stations.
As depicted in Figure 7, the monthly average wind speed, maximum wind speed, and frequency of the sand-raising wind in the study area presented a trend of increase from December to April and decrease from May to September, followed by an increase from September to November. Seasonally, the average wind speeds of the four seasons were quite close, with the highest average wind speed (6.84 m/s) appearing in spring, followed by winter (6.39 m/s). The average wind speeds in autumn and summer were 6.33 m/s and 6.09 m/s, respectively. The frequency of sand-raising winds followed the order of spring (20.35%) > autumn (17.52%) > winter (17.04%) > summer (16.52%).
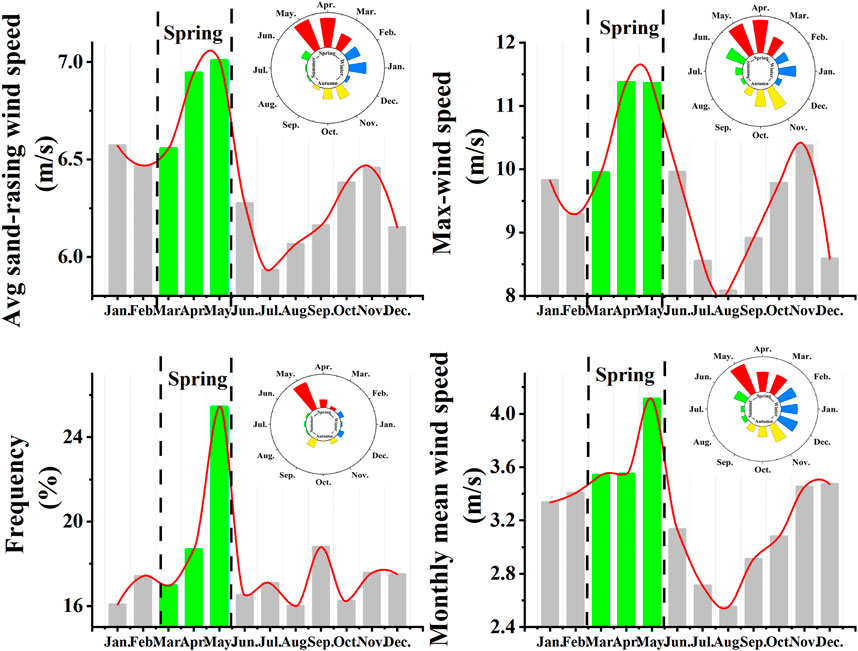
FIGURE 7. Variation of sand-raising winds in different months.
3.1.2 Annual and seasonal sand-raising
The characteristics of the sand-raising wind, which dictate the speed and direction of wind-sand particle movement in the near-surface layer, were found to be key indicators determining the occurrence of sand activity (Meng et al., 2022). These characteristics play a vital role in the study of wind-sand movement processes. According to the results of the field survey and subsequent calculations, the speed of sand-raising wind in the research area was 4.9 m/s. A comprehensive statistical analysis of wind direction data, which was gathered from seven stations (Figure 8), revealed that during the observation period, sand-raising wind in the basin predominantly moved westward (W, WNW, NW) and northward (NNW, N) on an annual scale.
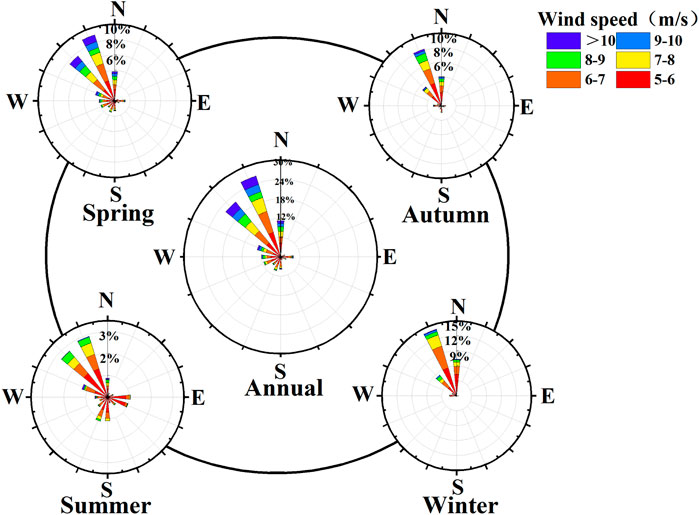
FIGURE 8. Annual and seasonal rose diagram of sand-raising wind in the basin.
As shown in Figure 9, the direction of sand-raising wind in the four seasons of the study area was consistent with the direction of annual sand-raising wind, primarily moving westward (W, WNW, NW) and northward (NNW, N). On an annual average scale, the westward sand-raising wind accounted for 35.72% of the wind frequency, with the NW wind being the main component (22.03%); the northward wind accounted for 37.45% of the wind frequency, with the NNW wind being the main component (26.26%), together accounting for 73.17% of the frequency of annual sand-raising wind.
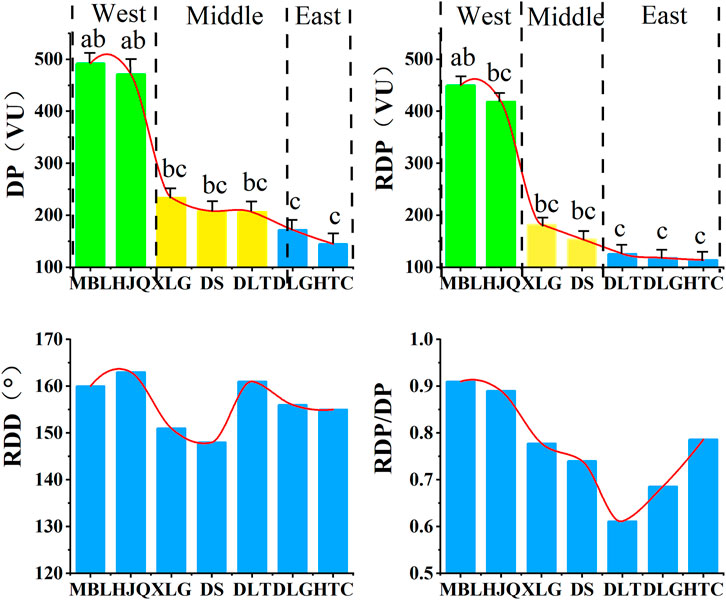
FIGURE 9. Different lowercase letters signify significant differences between variables. Average annual sand transport capacity at different meteorological stations.
The direction of sand-raising wind in spring and summer showed high similarity, with both being dominated by NW and NNW winds. In autumn and winter, the direction of sand-raising wind was more concentrated towards NNW. The seasonal changes in sand-raising winds in the research area were mainly manifested as differences in the frequency of sand-raising wind and the composition of the main wind direction.
3.2 Characteristics of sand transport capacity at different time scales
3.2.1 Annual and seasonal sand transport capacity
The sand transport capacity (DP), which is reflected in wind speed statistics, indicates the ability of a particular wind direction to transport sand over a certain period (Richards et al., 2022). It has been widely used in assessing the intensity of wind-sand activity and facilitating the formation of wind-sand landforms. The intensity of wind-sand activity in the study area was evaluated by analyzing DP at different time scales. The synthetic sand transport capacity (RDP) is a vector composition of DP from 16 directions, which served as a direct indicator of the intensity of wind-sand activity in an area. The directional variation index (RDP/DP) was smaller when the directional variation was larger.
As shown in Figures 9, 10, significant differences were observed in DP among different meteorological stations. A decreasing trend in DP from west to east was observed, with the largest DP in the Maobula Basin and the smallest in the Dongliugou Basin. On the whole, DP was markedly higher in the western part of the research area than in the central and eastern parts. As a result, the research area was partitioned into eastern, central, and western regions based on DP, which laid the groundwork for subsequent aeolian meteorological research.
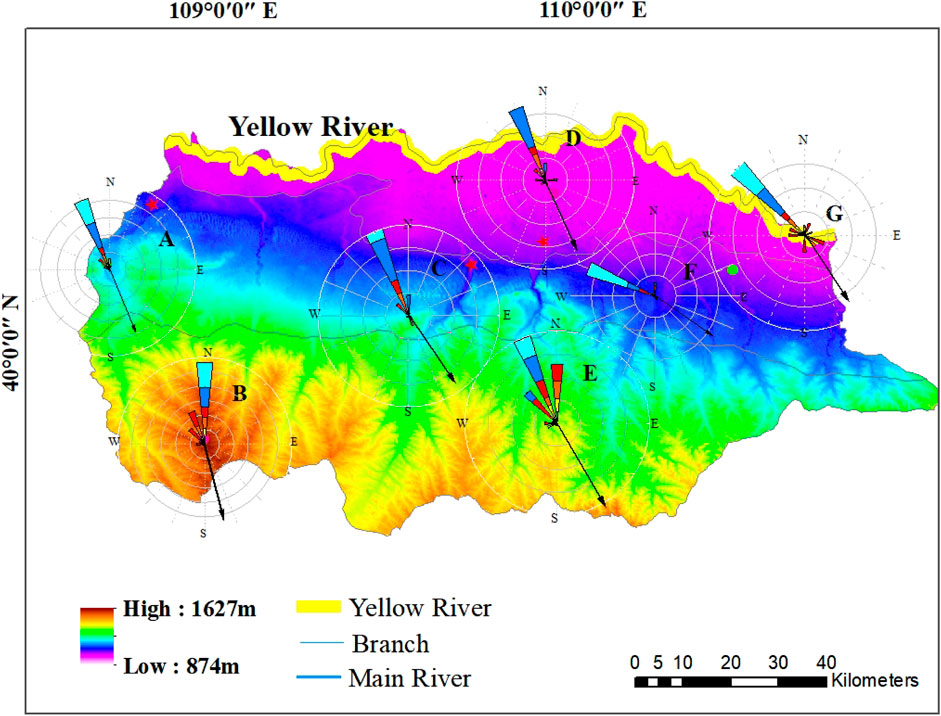
FIGURE 10. Rose diagram of average annual sand transport capacity at different meteorological stations.
According to Figure 11, for which wind speed data from seven meteorological stations from 2020 to 2022 were used, the annual DP of the research area was 1211.41VU, while the synthetic sand transport capacity was 947.85 VU and the directional variation index (RDP/DP) was 0.78. According to the wind energy classification standard formulated by Fryberger et al., the research area was generally in a high wind energy environment (DP > 400) for the entire year. The annual directional variation index was at a medium variation level, with the largest sand transport capacity observed in the NNW direction (539.15 VU), followed by the NW direction (360.39VU). The annual synthetic sand transport capacity direction (RDD) was 146.58°, towards the south-southeast (SSE). This indicated that the annual wind-sand movement was primarily in the southeast-southeast direction, leading to a substantial amount of wind-sand entering the River Channel and providing abundant sand materials to the Yellow River.
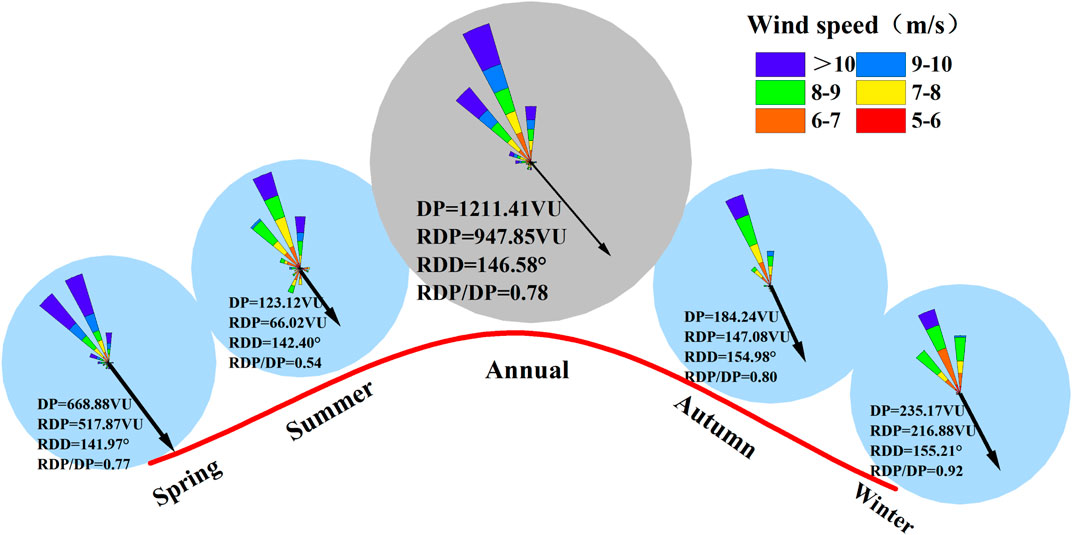
FIGURE 11. Rose diagram of annual and seasonal sediment sand transport capacity of the basin.
On a seasonal scale, noticeable differences in DP and RDP were observed between different seasons. DP and RDP were the largest in spring, at 668.88 VU and 517.87 VU, respectively. The DPs in spring, summer, autumn, and winter accounted for 55.21%, 10.16%, 15.21%, and 19.41% of the annual DP, respectively. RDD remained generally consistent among the four seasons, all pointing in the SSE direction. Significant differences were also observed in the directional variation indices, with the largest difference in winter at 0.92.
A comprehensive comparison revealed that the characteristics of the seasonal changes in the DP of the study area were consistent with the trend of the annual DP. Therefore, compared to other seasons, DP was higher in spring. Moreover, as temperatures increased, surface sand particles increasingly loosened, providing favorable dynamic conditions and rich sand sources for wind-sand activity in the Yellow River. Therefore, spring is a period of frequent wind-sand activity, and requires more attention and management.
3.2.2 Changes in monthly sand transport potential
According to Figure 12, which provides insights into the monthly DP at seven meteorological stations, DP and RDP showed considerable variation across different months and meteorological stations. Under the influence of the seasonal monsoon climate of the Kubuqi Desert, DP and RDP progressively decreased from west to east. Due to seasonal factors, the research area was in a medium wind energy environment during winter and spring, while it was in a low wind energy environment during summer and autumn. The sand transport direction, which did not vary much, was primarily SSE, SE, and ESE. This directly led to a large amount of sand being transported into the Yellow River annually, posing serious threats to the safe development of the Yellow River Basin.
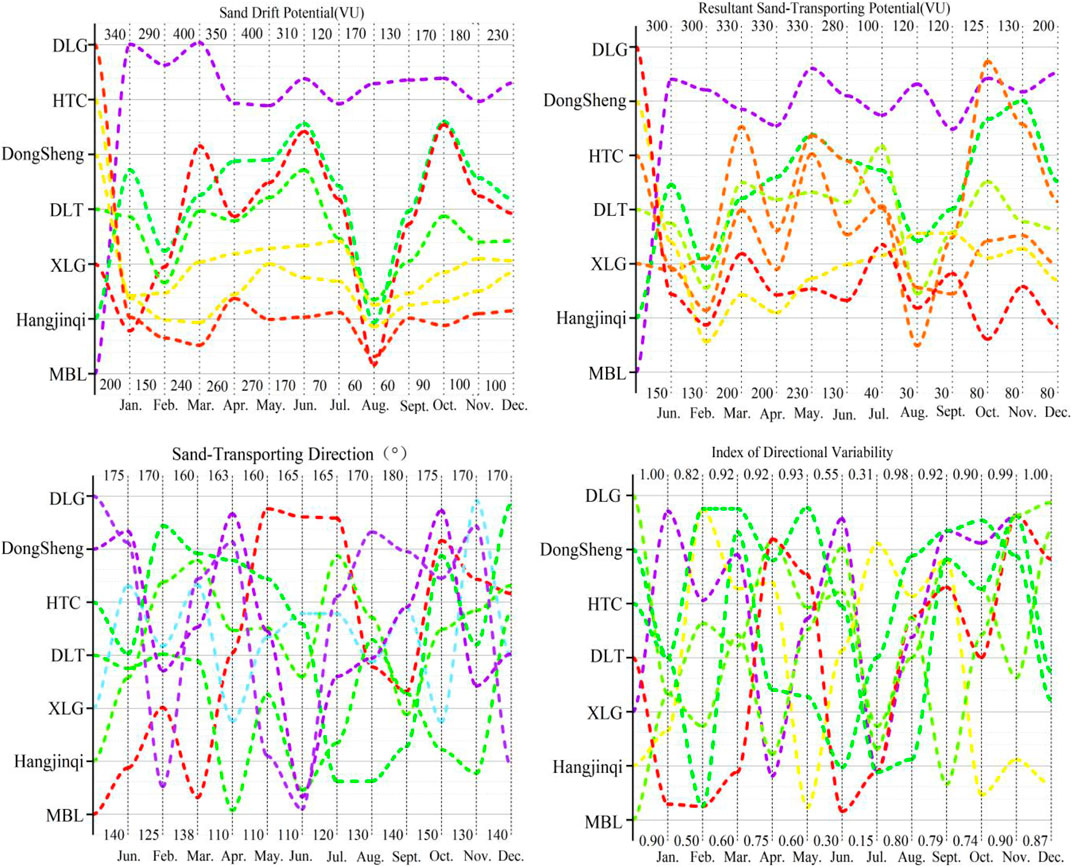
FIGURE 12. Monthly average sand transport potential at different meteorological stations.
From 2020 to 2022, the monthly average DP in the research area, as shown in Figure 11, showed that the monthly DP and RDP trends were consistent. The highest DP (27.75 VU) and RDP (13.66 VU) were observed in May, with RDD ranging from 132.85° to 165.43°, in the SE and SSE directions. The direction change index in February was 0.21, which is considered high. According to the concept of the direction change index of sand-transporting wind proposed by Fryberger et al., when the index is < 0.3, the sand-transporting wind conditions are complex. In February, May, and June, the direction change index was between 0.43 and 0.78, which is considered medium, indicating sharp bimodal wind conditions. In January, March, April, August, September, October, November, and December, the direction change index was found to be greater than 0.8, which is considered low, indicating narrow unimodal wind conditions.
Considering the overall trends, the annual, seasonal, and monthly changes in RDD were relatively stable, mainly in the SE and SSE directions, with a larger proportion in the SSE direction.
3.3 Estimation of basin sand transport volume
From 2020 to 2022, a single sand collector, which was used to measure sand transport volume, was installed with a fixed inflow direction consistent with the NNW direction. As shown in Figure 13, the sand transport volume in the research area was affected by seasonal variations, with significantly higher volumes in winter and spring compared to summer and autumn. After fitting the NNW DP with the sand transport rate, DP and sand transport rate were found to have a Logarithmic function [y = aln(x)+b] relationship in winter and spring, and an exponential function (y = beax) relationship in summer and autumn, with correlation coefficients greater than 0.9, indicating extremely high correlation.
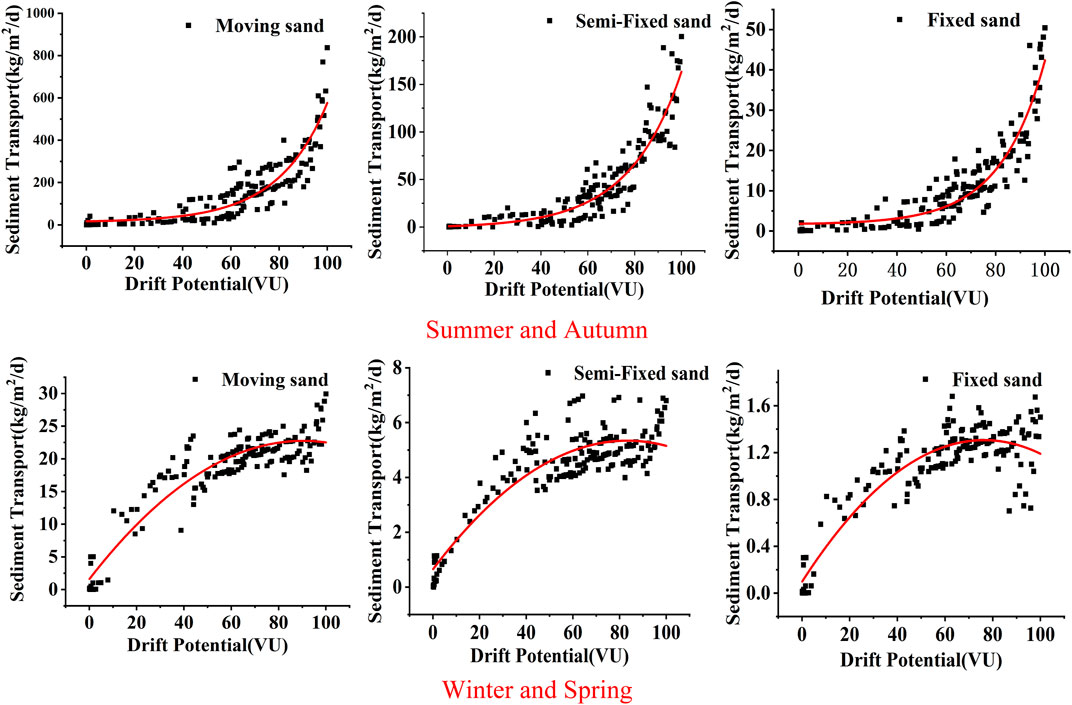
FIGURE 13. Fitting diagram of sand transport potential and sand transport volume for different seasons and underlying surfaces.
The prediction models for winter, spring, and summer, autumn are Logarithmic function models and exponential function models respectively. There are significant differences in sediment transport between them, mainly due to the influence of underlying surface characteristics in the study area. In summer and autumn, the frequency and duration of sand-driving winds are significantly lower than those in winter and spring. The dunes have a high water content, which plays a crucial role in stabilizing them. Moreover, Kubuqi Desert is the main source area of wind-driven sand where vegetation blooms during this period. A large number of annual herbs revive, increasing surface vegetation coverage and roughness that ultimately lead to an increase in sand-driving wind speed. In winter and spring, due to vegetation wilting and strong winds, evaporation exceeds precipitation, resulting in a decrease in soil moisture content. This creates favorable conditions for wind erosion by providing sufficient sand materials.
The fitting results of sand transport potential and sand transport rate for different seasons and three sand land types are shown in Table 2.
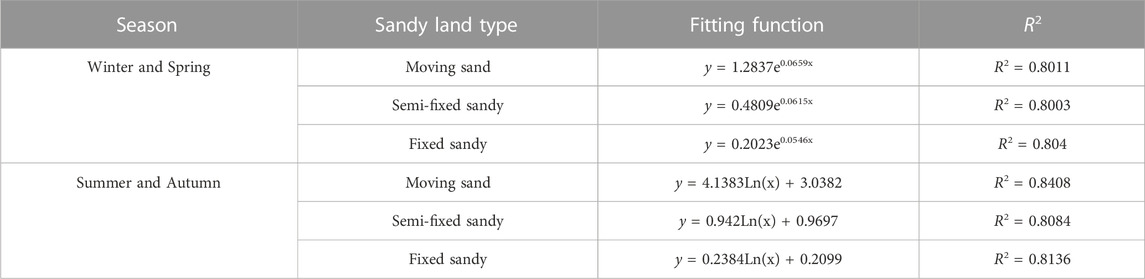
TABLE 2. Fitting formula of sediment transport potential and sediment transport rate of different underlying surfaces in different seasons.
Using the relationship function between NNW DP and sand transport rate, and according to the monthly average DP, the sand transport rate for the remaining 15 directions for different sand land types and four seasons and annual rates were calculated.
As shown in Figure 14, sand transport rate per unit area was significantly higher in spring than in other seasons. The average sand transport rate was 19.65 kg/m2/d, accounting for 63.78% of the annual total sand transport rate. Following spring, the next highest rate was observed in spring, with an average sand transport rate of 9.60 kg/m2/d, accounting for 31.18% of the annual total. The lowest rate was found in summer, at 0.59 kg/m2/d, and autumn, at 0.97 kg/m2/d. In all four seasons, the sand transport rate was found to be relatively high in the N, NW, and NNW directions, accounting for up to 85%. Based on the sand transport rate in different directions, the annual sand transport volume of a single wind sand area (Kongdui) was calculated to be 8.0 × 10⁵ tons/year, and the annual wind sand input into the Yellow River from ten tributary basins was estimated to be 8.0 × 10⁶ tons/year.
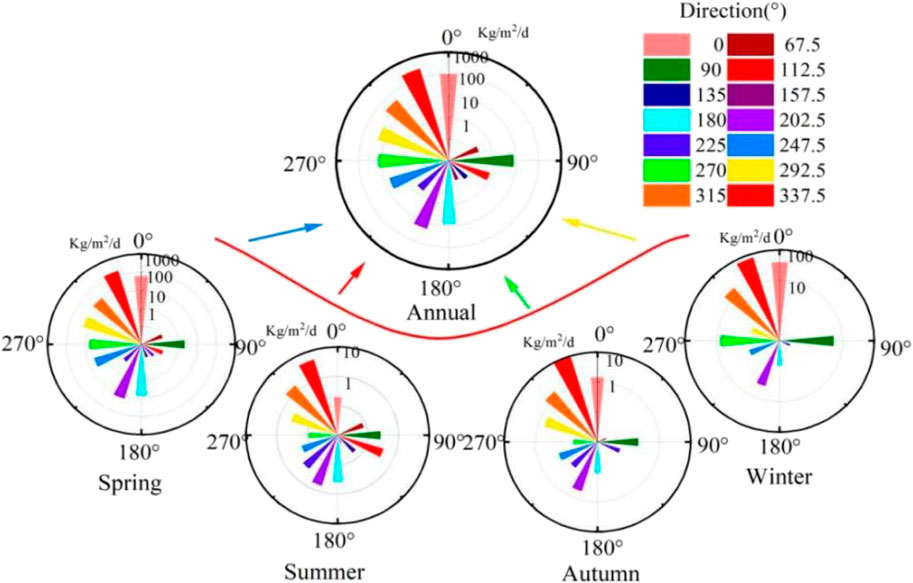
FIGURE 14. Annual and seasonal sand transport volume in the Basin.
4 Discussion
4.1 Variation characteristics of sediment transport potential on time scale
DP, which is a crucial indicator for determining the intensity and rules of aeolian activities in a particular region, widely varies according to regional surface characteristics (Zhang et al., 2015). Therefore, significant variations were observed in aeolian activities across different regions. The annual DP and RDP of the ten tributaries were found to be 1211.41 and 947.85 VU, respectively. These values correspond to a high wind energy environment. The RDP/DP value of 0.78 indicates the presence of dull twin peaks or sharp twin peaks. The wind energy environment of the ten tributaries, which was profoundly influenced by the Kubuqi Desert, demonstrated a sand transport potential slightly higher than that of the desert itself, and the coefficient of variation was less than 6%. The frequencies of sand-raising wind, which were concentrated primarily in winter and spring when the wind was typically stronger (Yang et al., 2015). The annual average wind speed was 23 m/s, while the average speed of sand-raising wind was 67 m/s. This wind speed was found to be similar to the wind conditions observed in the desert located north of the Yinshan Mountain in Inner Mongolia, the northeast edge of Ulan Buh Desert, and the western part of the Horqin Sandy Land. A marked correlation was observed between the increasing frequency of high wind speed and the average wind speed, which is consistent with the conclusion of Yang et al. (2015). This study, which aimed to decipher the nuances of aeolian activities, found a promising correlation between the frequency of sand-raising wind and the average wind speed. However, Zhu (2014), who employed NDVI data to explore inter-monthly changes in the average value of sand-raising wind, discovered that its trend was almost entirely opposite to the frequency and average speed of sand-raising wind. This contradiction could be attributed to the differing underlying surface characteristics and data sources.
Considering the frequency of sand-raising wind, the average wind speed, and DP, the wind conditions and DP of the ten tributaries exhibited distinct seasonal fluctuations. Aeolian activities were the most frequent and dynamic in spring, characterized by a high frequency of sand-raising wind, increased wind speed, robust sand transport potential, frequent sandstorms, and a copious amount of sandy material being eroded by strong wind. In contrast, the sand transport rate in other seasons was significantly lower than that in spring. This fluctuation could be traced back to the unique geographical location of the research area, which is under the perennial influence of the Mongolian high-pressure air mass and the desert monsoon climate. This results in a climate characterized by cold, dry winters, and windy springs. In the spring season, as the wind speed escalates, precipitation is significantly outweighed by evaporation, leaving the soil dry and loose. With vegetation in its greening period, the coverage is relatively low, and thus, the capacity to prevent wind and fix sand is weakened (Gao et al., 2019). Although DP is higher in winter than in summer and autumn, the falling temperatures coupled with the influence of surface condensation water and soil water consolidate the soil below 10 cm from the sand dune surface, leading to a considerable reduction in the available sand source. Consequently, temperature emerges as a key factor affecting soil wind erosion, in agreement with the findings of Alamusa et al. (2014) and others. The warmer months of summer and autumn see a decrease in wind speed, which coincides with an increase in rainfall. Consequently, soil moisture content and vegetation coverage increase. Therefore, the ability to prevent wind and fix sand during these seasons is considerably stronger than that in winter and spring. Therefore, the spring season, which exhibited the most frequent and intense aeolian activities in the ten tributaries, demands focused attention.
4.2 Wind regime characteristics
Wind, being the primary force behind desert formation and development, plays a crucial role in the region. The characteristics of the sand-rasing winds and the potential for sand transport, dynamic factors in the formation of aeolian landforms, lay the foundation for research in this area, focusing on aeolian landforms, aeolian activity, and aeolian control. From 2020 to 2022, the ten tributaries dune region, which was generally characterized by a high wind energy environment, experienced winds exceeding 5 m/s-1. These winds, in turn, had a significant impact on the aeolian environment. It was observed that the frequency and average speed of sand-lifting winds peaked during spring, thus indicating that spring is the primary period of aeolian activity in the area, followed by winter, and least in summer, a fact primarily attributed to the influence of the Mongolian high-pressure system, leading to hot and dry summers and windy springs. The sand-lifting wind direction, predominantly N and W, played a vital role in shaping the area’s landscape. The ten tributaries dune region, which serves as a key protection area for the safe development of the Yellow River basin, is faced with the intensification of desertification issues. These issues pose serious constraints on the sustainable economic and social development of the desert region, making it imperative to delve deeper into the study of wind energy characteristics in this region. This exploration is crucial, given its significance in the prevention and control of wind erosion and desertification in the region.
In May, the average wind speed reaches its peak in the ten tributaries, with the wind predominantly blowing from the west and north. The characteristics of monthly, quarterly, and annual DP were found to closely mimic the characteristics of sand-raising wind and exhibited a good correlation with the average speed of sand-raising wind. This indicates that the surface wind field characteristics of the ten tributaries are not directly influenced by the time scale. Hence, for practical calculations, when the proportion of sand-raising wind in winter and spring is relatively large, changes in the time period could be considered to reflect the annual changes in the surface wind field of the ten tributaries. Moreover, under the influence of climatic factors such as low temperatures and minimal evaporation in winter, the sand transport rate per unit area was significantly lower than that in spring. Hence, the period with the largest contribution to the annual sand transport amount is spring. This agrees with the findings of Guo et al. (2021) and others on the downstream wind-sand flow of the Shiyang River.
4.3 Protective measures and status considerations
The root cause of the wind-blown sand into the ten tributaries of the Yellow River lies in the absence of fundamental windbreak and sand stabilization techniques on the bare dunes flanking the river, especially during dry and windy winter and spring seasons. Therefore, a diligent focus on the conservation and administration of both sides of the river is necessary. This paper presents a comprehensive analysis of the research findings in conjunction with prior studies to suggest some fundamental protective measures. First, existing protective measures must be preserved, and the adverse impact of human activities such as grazing and sand mining must be contained. It is incumbent on regional governments to place great emphasis on river management while not endangering the environment to facilitate developmen.
Secondly, a scientifically designed windbreak and sand-fixing belt should be established in the around infrastructure and dunes on both sides of the river (Salix psammophila sand barrier、PLA sand barrier et al.). In the upwind direction, where erodible materials are abundant, the content of wind erosion increases exponentially with increasing wind speed. Therefore, reducing wind speed around the river dunes is a necessary means to address the problem of wind erosion. Various measures should be implemented based on existing protection strategies. Increasing the roughness of the dune surface, altering airflow conditions near the earth’s surface, while blocking sand sediment loss can slow the speed of dune movement, thereby reducing the amount of sand transport in the river channel. Finally, during the governance in the Yellow River Basin, we should actively conduct environmental monitoring and protection, prohibiting all types of environmental hazards and ensuring the proper protection of the ecological environment of the Yellow River Basin (He et al., 2023).
To achieve objective evaluation of wind-sand activities in the middle sand area of the ten tributaries in the Yellow River Basin and to analyze the relationship between different underlying surface characteristics and wind-sand activities, a thorough understanding of aeolian activities in the basin is essential. This would assist in scientifically estimating the vector characteristics of sand transportation to the Yellow River and providing a theoretical basis for the future evaluation of the intensity of aeolian activities along the Yellow River Basin. This research could also serve as a reference for the governance of wind-sand hazards in the ecologically fragile areas of the Yellow River Basin, thereby aiding the development of ecological civilization in the basin. Nevertheless, it is important to note that the management of the Yellow River Basin is entering a new phase, and much remains to be explored and studied. It is crucial to effectively integrate the underlying surface characteristics, climatic factors, and aeolian activities, analyze them layer by layer, and conduct comprehensive field observations of wind-sand flow. By evaluating the intensity of regional surface wind-sand activities based on multiple results, this research could provide a reference for the development of ecological safety measures in the Yellow River Basin. In practice, studies focusing on the characteristics of surface wind-sand activities primarily emphasized on factors such as wind conditions and sand transport potential, paying little attention to the interrelationships among influencing factors. Therefore, based on the existing groundwork, more in-depth exploration and research should be conducted on these influencing factors to provide a theoretical basis for the prevention and control of regional wind-sand hazards and the restoration and protection of ecosystems (Ali K. K. et al., 2021).
5 Conclusion
The predominant directions of sand-raising wind in the ten major tributaries of the Yellow River were found to be strikingly similar across different time scales, as they were generally oriented towards the northwest. Aeolian activities appear to be more frequent in spring, with significantly higher sand transport potential and synthetic sand transport potential compared to other seasons. Therefore, we conclude that effective control of sand erosion in spring, when erosion is the strongest, is key to the prevention and control of sand erosion in the Yellow River Basin. Under the influence of the geographical location and environmental factors of the basin, the area had showed a high sand transport potential and was in a high wind energy environment. According to the characteristics of sand transport potential, the research area, could be divided into three distinct regions: west, central, and east. The predominant direction of the synthetic sand transport potential (RDP), regardless of the time scale, was generally towards the southeast (SSE). This indicates that sand materials in the wind-sand zone of the basin move mainly towards the southeast, which is conducive to the deposition of a large amount of sand materials into the river. The exponential relationship between sand transport potential and sand transport amount is a significant finding. Based on this finding, it is estimated that wind erosion caused by wind-sand activities in the tributary basins could result in up to 8.0 × 10⁶ tons of sand entering the historically significant Yellow River on an annual scale. Moreover, other issues such as dune migration and atmospheric dust deposition were identified. Hence, it can be concluded that the constant generation of large amounts of wind-eroded sand particles pose serious threats to the ecological safety and development of the Yellow River Basin.
Data availability statement
The original contributions presented in the study are included in the article/supplementary material, further inquiries can be directed to the corresponding author.
Author contributions
HZ——Writing-Original Draft: preparation, creation and/or presentation of the published work by those from the original research group, specifically critical review, commentary or revision—including pre-or postpublication stages YG——Conceptualization: ideas; formulation or evolution of overarching research goals and aims SF Provision of study materials, reagents, materials, patients, laboratory samples, animals, instrumentation, computing resources, or other analysis tools XD Preparation, creation and/or presentation of the published work by those from the original research group, specifically critical review, commentary or revision—including pre-or postpublication stages ZM Oversight and leadership responsibility for the research activity planning and execution, including mentorship external to the core team ZC Management and coordination responsibility for the research activity planning and execution. All authors contributed to the article and approved the submitted version.
Conflict of interest
The authors declare that the research was conducted in the absence of any commercial or financial relationships that could be construed as a potential conflict of interest.
Publisher’s note
All claims expressed in this article are solely those of the authors and do not necessarily represent those of their affiliated organizations, or those of the publisher, the editors and the reviewers. Any product that may be evaluated in this article, or claim that may be made by its manufacturer, is not guaranteed or endorsed by the publisher.
References
Abbasi, H. R., Opp, C., Groll, M., Gohardoust, A., and Rouhipour, H. (2021). Wind regime and aeolian sand transport in Khuzestan Sand Sea. Aeolian Res. 53, 100746. doi:10.1016/j.aeolia.2021.100746
Alamusa, C., Niu, C., and Qin, Z. (2014). Temporal and spatial changes of freeze-thaw cycles in ulan'aodu region of Horqin sandy land, northern China in a changing climate. Soil Sci. Soc. Am. J. 78 (1), 89–96. (in Chinese with English abstract). doi:10.2136/sssaj2013.07.0312
Ali, K. K., Abood, N. M., and Hashim, K. I. (2021). Review to reasons and desertification control in Iraq. IOP Publ. 904 (1), 012006. doi:10.1088/1755-1315/904/1/012006
Bagnold, R. A. (1974). Fluid forces on a body in shear-flow; experimental use of ‘stationary flow. Proc. R. Soc. Lond. A. Math. Phys. Sci. 340 (1621), 147–171. doi:10.1098/rspa.1974.0145
Fryberger, S. G., and Dean, G. (1979). “Dune forms and wind regime,” in A study of global sand seas. Editor E. D. McKee (Washington: U.S. Geological Survey, Washington, Professional Paper). 1052, 137–169.
Gao, X., Dong, Z., Duan, Z., Liu, M., Cui, X., and Li, J. (2019). Wind regime for long-ridge yardangs in the Qaidam basin, northwest China. J. Arid Land 11, 701–712. doi:10.1007/s40333-019-0108-4
Guo, S., Yang, Z., and Wang, Q. (2021). Sediment transport fluxes of wind-sand flows on different underlying surfaces of dry lake in the lower reaches of Shiyang River Basin. Sci. Silvae Sin. 57 (12), 13–21. (in Chinese with English abstract).
He, S., Xiong, K., Song, S., Chi, Y., Fang, J., and He, C. (2023). Research progress of grassland ecosystem structure and stability and inspiration for improving its service capacity in the karst desertification control. Plants 12 (4), 770. doi:10.3390/plants12040770
Hu, Z., Wang, G., Liu, Y., Shi, P., Zhang, G., Liu, J., et al. (2022). Analysis of spatial and temporal variations of the near-surface wind regime and their influencing factors in the Badain Jaran Desert, China. Atmosphere 13 (8), 1316. doi:10.3390/atmos13081316
Jewell, P. W., and Nicoll, K. (2011). Wind regimes and aeolian transport in the Great Basin, U.S.A. Geomorphology 129, 1–13. doi:10.1016/j.geomorph.2011.01.005
Lancaster, N. (1997). Response of eolian geomorphic systems to minor climate change: examples from the southern Californian deserts. Geomorphology 19 (3–4), 333–347. doi:10.1016/s0169-555x(97)00018-4
Liu, Z., Dong, Z., Zhang, Z., Cui, X., and Xiao, N. (2019). Spatial and temporal variation of the near-surface wind regimes in the Taklimakan Desert, Northwest China. Theor. Appl. Climatol. 138, 433–447. doi:10.1007/s00704-019-02824-w
McKee, E. D. (1979). A study of global sand seas. Washington: U.S. Geological Service, Washington, Professional Paper. 1052: 3–19. doi:10.3390/app9245543
Meng, N., Wang, N., Zhao, L., Niu, Z., and Sun, J. (2022). Wind regimes and associated sand dune types in the hinterland of the Badain Jaran Desert, China. J. Arid Land 14 (5), 473–489. doi:10.1007/s40333-022-0063-3
Moursy, F. I., Uaber, E. I., and Samak, M. (2002). Sand Drilt Potential in El-Khanka Area,Egypt. Water. Air Soil Pollut. 136 (1), 225–242. doi:10.1023/A:1015233507882
QiYang, D. X. (2019). Sedimentological and geochemical composition of aeolian sediments in the Taklamakan Desert: Implications for provenance and sediment supply mechanisms. J. Geophys. Res. Earth Surf. 124 (5), 1217–1237. doi:10.1029/2018jf004990
Richards, J. H., Smesrud, J. K., Williams, D. L., Schmid, B. M., Dickey, J. B., and Schreuder, M. D. (2022). Vegetation, hydrology, and sand movement interactions on the Slate Canyon alluvial fan-Keeler Dunes Complex, Owens Valley, California. Aeolian Res. 54, 100773. doi:10.1016/j.aeolia.2022.100773
Takayama, N., Kimura, R., Liu, J., and Moriyama, M. (2020). Long-term spatial distribution of vegetation and sand movement following the commencement of landscape conservation activities to curb grassland encroachment at the Tottori Sand Dunes natural monument: (Vegetation and sand movement in the Tottori Sand Dunes). Int. J. Remote Sens. 41 (8), 3070–3094. doi:10.1080/01431161.2019.1698783
Wang, S., Chen, Y., Wu, J. h., Xue, L., and Fan, T. T. (2020). Pollution status of the Yellow River tributaries in middle and lower reaches. Sci. Total Environ. 722, 137861. doi:10.1016/j.scitotenv.2020.137861
Wang, X., Zhou, Z., and Dong, Z. (2006). Control of dust emissions by geomorphic conditions, wind environments and land use in northern China: An examination based on dust storm frequency from 1960 to 2003. Geomorphology 81 (3-4), 292–308. doi:10.1016/j.geomorph.2006.04.015
Xu, J. (2014). Temporal and spatial variations in erosion and sediment yield and the cause in the ten small tributaries to the Inner Mongolia reach of the Yellow River. J. Desert Res. 34 (6), 1641–1649.
Yang, D., Wang, X., and Hu, Y. (2015). Some problems in wind data analyzing in oasis-desert ecotone: a case of Qira Oasis. Arid. Land Geogr. 38 (3), 549–559. (in Chinese with English abstract). doi:10.1002/bit.25460
Yingjun, P., Bo, W., and Xiaohong, J. (2019). Characteristics of wind regime and drift potential in Mu Us Sandy Land. J. Desert Res. 39 (1), 62. doi:10.13869/j.cnki.rswc.2021.04.005
Yizhaq, H., Xu, Z., and Ashkenazy, Y. (2020). The effect of wind speed averaging time on the calculation of sand drift potential: New scaling laws. Earth Planet. Sci. Lett. 544, 116373. doi:10.1016/j.epsl.2020.116373
Zhang, K., Qu, J., and An, Z. (2012). Characteristics of wind-blown sand and near-surface wind regime in the Tengger Desert, China. Aeolian Res. 6, 83–88. doi:10.1016/j.aeolia.2012.08.003
Zhang, Z., Dong, Z., and Li, C. (2015). Wind regime and sand transport in China’s Badain Jaran Desert. Aeolian Res. 17, 1–13. doi:10.1016/j.aeolia.2015.01.004
Zhu, J., Jiren, L., Shifeng, H., and Wenbin, Z. (2014). “Study on the Assessment Methods of Soil Erosion Intensity-In Case of Ten Tributaries Upstream,” in 2014 7th International Conference on Intelligent Computation Technology and Automation, Changsha, China, 25-26 October 2014, 717–720. doi:10.1109/ICICTA.2014.174
Keywords: Yellow River Basin, ten tributaries, wind regime, sediment transport potential, sediment discharge
Citation: Zhao H, Feng S, Dang X, Meng Z, Chen Z and Gao Y (2023) Wind regime and sand transport in the mid-course of ten tributaries of the Yellow River, Inner Mongolia of China. Front. Environ. Sci. 11:1233922. doi: 10.3389/fenvs.2023.1233922
Received: 03 June 2023; Accepted: 22 August 2023;
Published: 31 August 2023.
Edited by:
Niall Patrick Hanan, New Mexico State University, United StatesReviewed by:
Jianhua Xiao, Chinese Academy of Sciences (CAS), ChinaWen Huo, Institute of Desert Meteorology, China
Copyright © 2023 Zhao, Feng, Dang, Meng, Chen and Gao. This is an open-access article distributed under the terms of the Creative Commons Attribution License (CC BY). The use, distribution or reproduction in other forums is permitted, provided the original author(s) and the copyright owner(s) are credited and that the original publication in this journal is cited, in accordance with accepted academic practice. No use, distribution or reproduction is permitted which does not comply with these terms.
*Correspondence: Yong Gao, R1kxMzk0ODgxNTcwOUAxNjMuY29t
†These authors have contributed equally to this work