
95% of researchers rate our articles as excellent or good
Learn more about the work of our research integrity team to safeguard the quality of each article we publish.
Find out more
ORIGINAL RESEARCH article
Front. Environ. Sci. , 18 December 2023
Sec. Interdisciplinary Climate Studies
Volume 11 - 2023 | https://doi.org/10.3389/fenvs.2023.1231767
 Antje Herrmann1
 Supriya Verma2*Anna Techow1
 Christof Kluß2
 Klaus Dittert3
 Robert Quakernack4
 Andreas Pacholski5,6
 Henning Kage6Friedhelm Taube2
Significant greenhouse gas emissions during substrate cultivation reduces the potential environmental benefits of biogas production. This study investigates the productivity of different cropping systems and their environmental impact in terms of nitrous oxide (N2O) emissions under the environmental conditions of the coastal marsh regions (Northern Germany) with heavy clay soils, in a 2-year field trial (April 2009-March 2011). Treatments included four cropping systems (perennial ryegrass (Lolium perenne, PR) ley, continuous maize (Zea mays), a rotation (CR1) of spring wheat (Triticum aestivum), Italian ryegrass (Lolium multiflorum, IR) and maize, and a rotation (CR2) of maize, winter wheat and IR; two sources of N (nitrogen) fertilizers (calcium ammonium nitrate, and biogas residue (BR)), and three levels of N fertilizer applications (control, moderate, high). Nitrous oxide emissions were determined for the unfertilized and highly fertilized cropping systems comprising PR ley, CR1 and CR2. Cumulative annual N2O emissions varied across the treatments, ranging from 0.82 to 3.4 kg N2O-N ha−1 year−1. Under high N fertilizer applications, PR ley incurred higher N2O-N losses compared to other tested cropping systems, and IR cover crop caused relatively high N2O-N emissions in a short vegetation period. The study observed wide range of yield-scaled emissions (0.00–5.60 kg N2O-N (Mg DM)−1) for different crops, emphasizing the variability in N2O emissions linked to cropping systems. The N2O-N emission factors for the three cropping systems were found to be low to moderate for all treatments, ranging from 0.03% to 0.53% compared to IPCC default Tier 1 N2O-N EFs. The lower emissions in the study were associated with prolonged high soil moisture conditions (water filled pore space >70%.), indicated by its negative correlation with N2O-N fluxes. Low dry matter and N yield of PR and of the wheat-IR sequence after BR application compared to other crops indicated a low N use efficiency. The estimation of N2O-N emissions based on N surplus was not promising specifically for the coastal study site where high groundwater level and organic matter in the soils were the predominant drivers for N2O-N emissions.
In the recent decades, there has been an increasing interest towards greener energy alternatives in Europe to decrease the reliance on conventional fuels such as natural gas. One such approach is promoting the production and use of biogas as a renewable energy source, which is generated from anaerobic digestion of various organic wastes or energy crops (Herrmann et al., 2013; Prays et al., 2018). According to the “REPowerEU” plan, European Union (EU) aims to produce 35 billion cubic metres of biogas each year by 2030 to increase the resilience of EU’s energy system (European and Directorate-General for, 2022). In the German context, production of bioenergy from anaerobic digestion of slurry and/or biomass has been intensively promoted via its Renewable-Energy-Act which led to a significant increase in the number of biogas plants in Germany from 850 to 9,331 between 2000 and 2017 as a means to achieve the goals set out to reduce greenhouse gas (GHG) emissions by at least 80%–95% by 2050 compared to the 1990 levels (Rahaman et al., 2021). This has resulted in a rapid expansion of silage maize (Zea mays) production which is a preferred substrate for co-fermentation due to its high energy content and yield performance. However, continuous maize production systems are often overfertilized, and are associated with land use change, soil degradation and high nitrogen (N) losses (Herrmann et al., 2017; Kim et al., 2021). One of the strong GHGs emitted during crop substrate production is nitrous oxide (N2O), which has longer atmospheric lifespan (114 years) and 265 times stronger global warming potential than carbon dioxide (CO2) over a 100-year horizon (Mathivanan et al., 2021). Simultaneously, more than half of the anthropogenic N2O emissions arise directly from fertilizer N applications in agriculture (Tian et al., 2020). This makes it crucial to ensure that the reduction in GHG emissions from replacing fossil fuel by biogas production is not diminished by the emissions resulting from crop substrate production.
Biogas residues (BR) offer a cost competitive, and environmentally sound alternative to mineral fertilizer as is known to have good fertilization value. These residues are derived from anaerobically digested organic wastes and contain a range of macro and micronutrients in readily available forms for plants. They have been found to improve soil quality, plant productivity, and resilience to biotic and abiotic stress agents (Guo et al., 2021; Mdlambuzi et al., 2021). However, studies have also shown that due to their high carbon (C) and ammonium (NH4+) content, BR can lead to even higher CO2 and N2O emissions as well as nitrate (NO3−) leaching from the soils compared to mineral fertilisers (Senbayram et al., 2009; Eickenscheidt et al., 2014). While for most regions, the crop methane (CH4) yield potential and N2O emissions from agricultural activities are relatively well studied, the database is still scarce for the coastal marsh regions which are characterized by relatively low mean temperatures and high precipitation. Additionally, these specific soil characteristics (i.e., high soil organic content and precipitation) can lead to increase in anoxic microsites and promotion of denitrification processes (Pelster et al., 2012; Friedl et al., 2016; Li et al., 2022), especially if high amounts of BR are applied. Substantially higher N2O emissions for a clay compared to a sandy soil were reported by van Groenigen et al. (2004), whereas Jungkunst et al. (2006) found regularly waterlogged soils to cause lower emissions than well aerated soils.
Nitrous oxide is emitted from soils by several microbial processes, with nitrification and denitrification being major pathways (del Prado et al., 2006). Nitrification is an aerobic process, in which the most important influence factors are the soil NH4+ content and oxygen (O2) availability. Denitrification is driven primarily by i) the availability of an electron donor or energy source for the denitrifying bacteria, i.e., mainly the availability of C, ii) the presence of anoxic conditions, and iii) the soil mineral N both NH4+ and NO3−) content (Butterbach-Bahl et al., 2013; Li et al., 2013). The present understanding assumes a stimulation of N2O emissions with increasing N inputs, however, the effects of fertilizer type on the extent of these emissions are variable (Mathivanan et al., 2021).
Furthermore, high groundwater level and clay-rich soils in the coastal marsh areas may lead to reduced suitability for cultivating maize as a substrate for biogas production in comparison to alternatives such as grasses and whole-crop cereals (Quakernack et al., 2012; Claus et al., 2014). The adverse environmental effects associated with these systems can be countered by the diversification of substrate cropping systems, which reduces the reliance on a single crop and hence minimizes the need for high N inputs (Biernat et al., 2020; Rusch et al., 2020). This has led to a call for alternatives to biogas substrate, and diversification of cropping systems. Integration of grassland leys or cover crops in the conventional cropping systems has been shown to reduce nutrient imbalances, promote nutrient-use efficiency and productivity of the systems even at marginal sites (Herrmann and Rath, 2012; Drury et al., 2014).
Consequently, the present study aimed to exclusively investigate the complex interplay between soil and environmental conditions, and different N sources on productivity and N2O emissions from different substrate cropping systems to inform the development of more targeted strategies for mitigating these emissions from agriculture. The specific objectives of the study were, i) to assess the effect of different cropping systems, i.e., perennial ryegrass (Lolium perenne, PR) ley, crop rotation of maize—winter wheat (Triticum aestivum, WW)—Italian ryegrass (Lolium multiflorum, IR) and crop rotation of spring wheat (SW)- IR—maize, on N2O emissions from a typical marsh site, ii) to analyse the impact of fertilizer type (BR vs. mineral fertilizer) on the productivity of these systems and N2O-N emissions, and iii) to evaluate the indicators of N2O-N losses from the system. It was hypothesized that 1) the high groundwater level and soil organic matter with high precipitation prevailing in the coastal marsh region would lead to high N2O emissions compared to standard emission factors, 2) BR application causes higher N2O emissions than mineral N fertilizer, 3) a higher dry matter (DM) productivity will be achieved by crops growing year-round, such as PR or a rotation combining the high photosynthetic capacity of maize with the higher productivity of C3 crops in spring and autumn (Rusch et al., 2020), and 4) substrate production from PR ley has a smaller “ecological footprint” in terms of product-related N2O emission than the crop rotation.
A 2-year field experiment (April 2009–March 2011) was conducted near Waygaarddeich at the Western North Sea coast of Schleswig-Holstein, northern Germany. The soil type at the experimental site is a gleyic fluvisol (calcaric). The soil is characterized as a heavy, silt-clayey soil with about 400 g clay (kg soil)−1, 550 g silt (kg soil)−1 and 50 g sand (kg soil)−1, and a pH value of 7.2. Due to pedogenesis, the soil is rich in organic matter with organic C content of 65.2 g (kg soil)−1 in the upper layer (0–30 cm) and of 46.1 (kg soil)−1 in the subsoil. The site had tile drains at 0.9 m depth, with 12 m spacing between the lines of the drains. Groundwater table is shallow at about 1 m depth, though with considerable seasonal fluctuations (0.31–1.87 m below soil surface during the investigation period) as the ground water level is regulated by a system of ditches, pumping stations and sluice gates. The climate is humid temperate with a long-term mean annual temperature of 8.6°C and an annual precipitation of 832 mm (weather station Leck, 1975–2021). The weather data from the site was collected throughout the experiment, and average air temperature and precipitation for the experimental years are shown in Table 1.
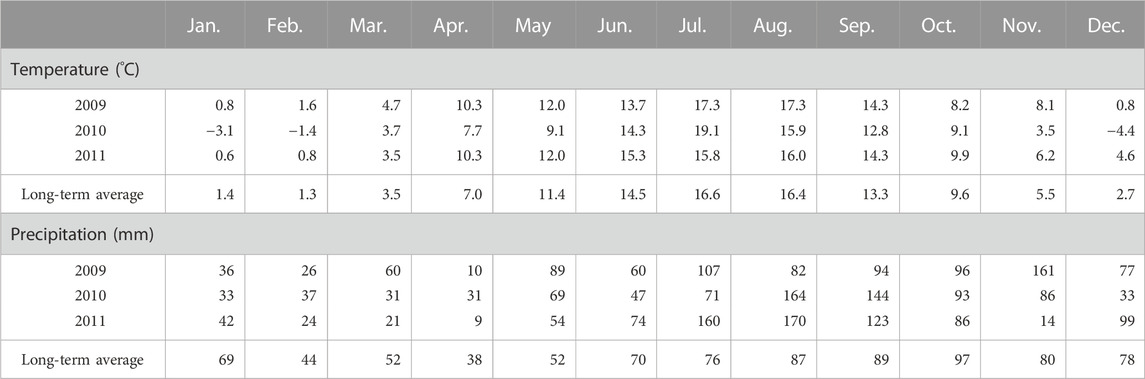
TABLE 1. Monthly precipitation (mm) and mean air temperature (°C) for the experimental period and the long-term average (weather station Leck, 1975–2021; provided by Deutscher Wetterdienst).
The study was a part of the interdisciplinary “Biogas-Expert” project of Kiel University. The measurements were embedded in a field experiment which was established in 2007 as a randomized complete block design with four blocks and a plot size of 12 m × 12 m. Winter wheat and IR, fertilized with pig slurry, were grown on the field site before the project started. The treatment factors included crop type, N fertilizer type and N fertilizer application rate. Cropping systems included a PR ley, continuous maize, a crop rotation consisting of SW, IR and maize (CR1), and a rotation of maize, WW and IR catch crop (CR2) (Figure 1). According to the principles of crop rotation experiments, each crop of the rotation was grown in each year. Due to unfavorable weather conditions in the autumn of 2008, sowing of WW was prevented and SW was grown instead in 2009.

FIGURE 1. Schematic overview of the cropping systems where N2O measurements were conducted for the period of April 2009 to March 2011.
Maize (cv. Amatus, early) was planted in the second half of April at a seed rate of 9–10 kernels m−2 and a row distance of 0.75 m. SW (cv. Thasos) was sown beginning of April 2009 with 360 grains m−2, WW (cv. Magnus) was sown end of September 2009 and 2010 with 360 seeds m−2. After wheat harvest, IR (60% cv. Gisel tetraploid, mid-early; 40% cv. Lema, diploid, mid-early; 40 kg ha−1) was established. PR (cv. Trend, tetraploid, mid-early; 30 kg ha−1) was sown in September 2007.
Crop yield was determined by utilizing a Haldrup plot-harvester (Logstor, Denmark) from a subplot which was excluded from any measurement activities during the vegetation period. The subplot sizes varied between 17.7 m2 for grass and 13.5 m2 for wheat and maize. Perennial ryegrass ley was cut four times a year, with the first cutting before ear emergence. Italian ryegrass was cut once in autumn and was then treated with herbicide (glyphosate) before winter. Wheat was harvested as whole crop between late-milk and early dough stages, and the main criterion for maize harvest was to have minimum of 30% DM content. Representative subsamples were dried at 58°C to determine the DM and N content. Crop N concentration was estimated by Near Infrared Reflection Spectroscopy (Model 5000 FOSS-NIRSystems, Rellingen, Germany), with N concentration of the calibration and validation subsets being determined by a CN analyzer (Vario Max CN, Elementar Analysensysteme, Hanau, Germany).
In the present study, we assessed three N application rates, control (without N fertilizer), moderate, high, and N fertilizer (N type) was applied either in the form of calcium-ammonium-nitrate (CAN) or BR. The level of fertilization rates ranged from unfertilized to overfertilized in order to estimate efficiencies and N losses under wide ranges of fertilization rates. Biogas residue was obtained from a farm biogas plant (370 kWel.) which co-fermented silages (70%) of whole crop wheat and grass together with pig slurry (30%) and was applied using a dribble bar system. The residue was characterized by an average DM content of 6.5%, total N content of 5.5 kg m−3 with an NH4-N share of 68% with the pH value of 7.8.
The timing and method of fertilization for the crops are detailed in Table 2. Wheat received two dressings: at the beginning of growth in spring, and shortly before shoot elongation. Italian ryegrass was fertilized in one dressing applied 2–3 weeks after sowing, and for PR, N fertilization was split into four dressings. In maize, N fertilizer was split into two dressings: a banded starter (5 cm below and 5 cm to the side of the seed) was applied as CAN (50 kg N ha−1) in all treatments including the control, and a second dressing was given in mid-May to the moderate and high treatments for both N types. Application of phosphorus, potassium, magnesium and pesticides, as well as other crop management activities were performed according to standardised good agricultural practices. The plots were not ploughed, but primary soil tillage was carried out using a field cultivator.
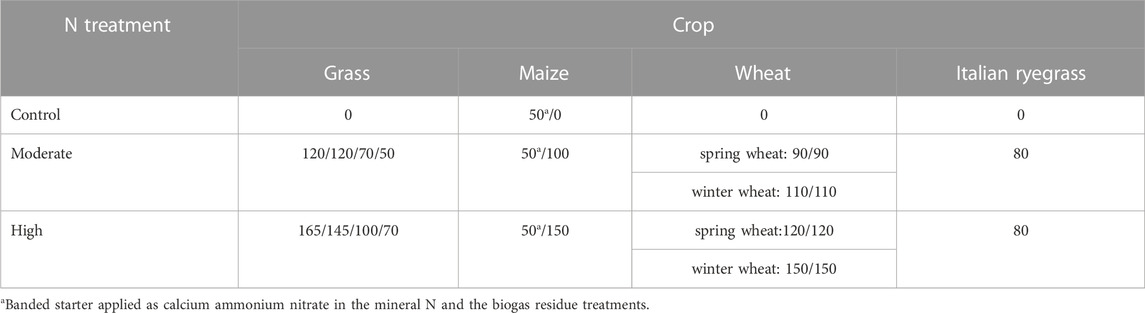
TABLE 2. Nitrogen fertilization (kg N ha−1 yr−1) of the tested crops and allocation to different dressings.
Nitrous oxide measurements were restricted within three cropping systems: PR ley, CR1 and CR2 (Figure 2). The N treatments considered for these cropping systems included control (no N fertilizer), BR (high N treatment), and CAN (high N treatment). This reflects the common practice of N oversupply in intensively managed grasslands and maize production (Poyda et al., 2021). The high fertilizer treatments were included with the aim to capture the full range of emissions that may occur in real-world scenarios. Soil surface N2O fluxes were monitored at weekly intervals from April 2009 until March 2011 (measurements were taken daily for the first 10 days after fertilizer application) using the closed chamber method (Hutchinson and Mosier, 1981). Briefly, a basal PVC ring (60 cm diameter, 10 cm height) was inserted into the soil (5 cm depth) in each plot and rings were removed only for tillage and harvesting operations. For maize grown with 70 cm row distance, Cai et al. (2012) reported higher N2O emissions from interrow + row soil than interrow soil, especially after fertilizer application. In order to capture the peak emissions caused by the banded starter, we placed rings in maize across rows and moved them to the interrow without maize plants in the chamber area after application of the second N dressing, which also avoided the need to raise the height of the chamber with the growing crop. At the time of sampling, a PVC chamber (60 cm diameter, 25 cm height) was fitted to the basal rings. The chambers had been painted to reflect the incoming radiation. The connection between chamber and basal ring was made airtight by using a taut butyl rubber band. In later growth stages of wheat, chambers with a height of 110 cm were used. Gas samples were collected from the chamber headspace through a rubber septum at regular intervals of 0, 25, and 50 min after chamber deployment using a 60 mL polypropylene syringe. Immediately after collection, the samples were transferred to evacuated 12 mL Exetainer vials (Labco, High Wycombe, UK). Sampling time was appointed between 10 a.m. and 1 p.m. as it has been shown that this time frame effectively represents the average daily N2O emissions (Alves et al., 2012). During the period of December 2009 to March 2010, high snow cover on the plots prevented the N2O measurements, thus explaining the gap in the graphical representations (Figures 2–4).
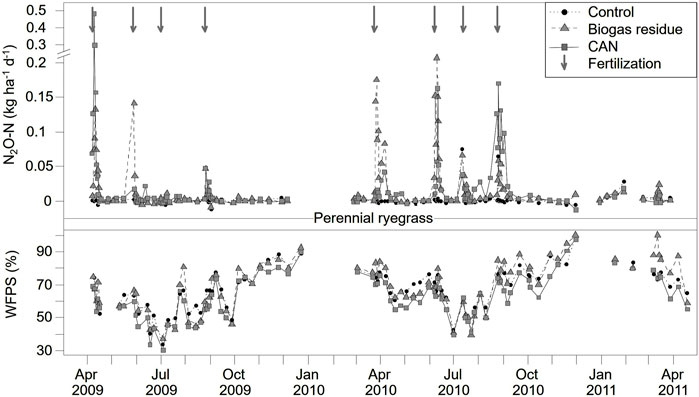
FIGURE 2. Daily N2O-N fluxes (kg N2O-N ha−1 d−1) and water filled pore space (WFPS, %) monitored in the perennial ryegrass ley from April 2009 to March 2011, as affected by N fertilizer type [Biogas residue and CAN: Calcium ammonium nitrate (mineral-N)] in the highly fertilized and the control (unfertilized) treatment. Arrows indicate fertilization events.
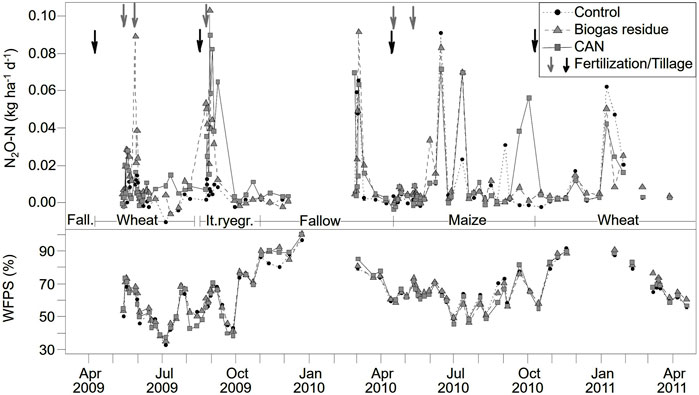
FIGURE 3. Daily N2O-N fluxes (kg N2O-N ha−1 d−1) and water filled pore space (WFPS, %) monitored in the spring wheat—Italian ryegrass—maize—winter wheat rotation from April 2009 to March 2011, as affected by N fertilizer type [Biogas residue and CAN: Calcium ammonium nitrate (mineral-N)] in the highly fertilized and the control (unfertilized) treatment. Grey arrows indicate fertilization events, black arrows show soil tillage activities.
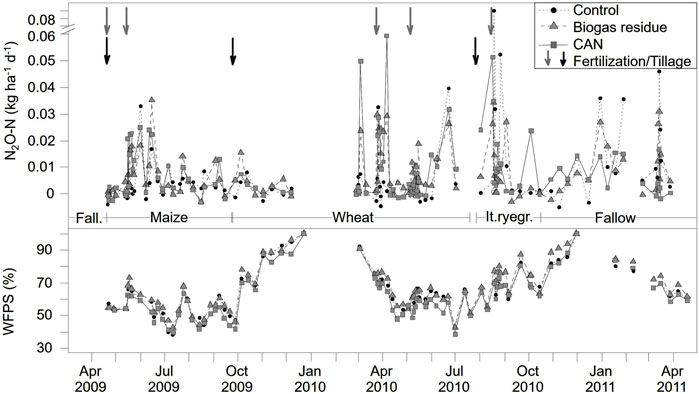
FIGURE 4. Daily N2O-N fluxes (kg N2O-N ha−1 d−1) and water filled pore space (WFPS, %) monitored in the maize—winter wheat—Italian ryegrass rotation from April 2009 to March 2011, as affected by N fertilizer type [Biogas residue and CAN: Calcium ammonium nitrate (mineral-N)] in the highly fertilized and the control (unfertilized) treatment. Grey arrows indicate fertilization events, black arrows show soil tillage activities.
The N2O concentration was analysed by ECD (electron capture detector) gas chromatography (model 3400 CX, Varian Inc., Palo Alto, CA, United States). The operating conditions for the gas chromatograph were: injector temperature 95°C, column temperature 85°C, detector temperature 320°C. A model 222 XL autosampler (Gilson Inc., Middleton, WI, United States) was used to introduce the samples, and the Varian Star Chromatography Workstation (version 6.2) software was used for data processing. Nitrous oxide fluxes were determined from the rate of change in concentration within the closed chamber using linear regression, with the coefficient of determination serving as criterion for linearity. For R2 values below a threshold of 0.6, which applied to 25% of the flux measurements, the N2O flux was set to zero. Cumulative N2O emissions were calculated for each chamber by linearly interpolating emissions between sampling dates. The N2O-N emission factor (EF) for different cropping systems was calculated using the IPCC (2021) recommended method considering the total amount of N input using the below equation.
For the crop rotations (CR1 and CR2) comprising maize, total N input in the system was deducted with N applied as banded starter (CAN: 50 kg N ha−1 yr−1) for maize which was applied in all treatments including control.
Plots under control and the highly fertilized treatments of the crop rotations and of PR ley located in the third block were equipped with temperature sensors (Kooltrak Inc., United States) installed at 3 cm and 10 cm depth, to record soil temperature at hourly intervals. The soil N status was characterized by the soil mineral N (Nmin) content in the 0–10 cm-depth layer. Soil samples were collected at 10-day intervals, with more frequent sampling every 2 days during the initial 10 days following fertilization. The samples were stored at −20°C until analysis. Nitrate and NH4+ concentration in the soil were determined by extracting the sample with 0.01 M CaCl2 and a subsequent photometric measurement using a dual channel continuous flow analyser (Skalar Analytical Instruments, Breda, the Netherlands) equipped with a reducing column for NO3− to nitrite conversion. Representative soil subsamples were used for determination of gravimetric water content by oven drying samples at 105°C until constant weight. Volumetric water content (VWC) was derived from gravimetric water content by assuming a soil bulk density of 1.2 g cm−3. Water-filled pore space (WFPS) was calculated using the following equation
where, WFPS = water filled pore space (%), VWC = volumetric soil water content (%), BD = Soil bulk density (1.2 g cm−3) and PD = particle density (2.65 g cm−3).
Statistical analysis of cumulated N2O emissions and yield-related emission, (i.e., the N2O-N emission per unit of biomass produced) was conducted at the crop and at the cropping system level as each crop of the rotation was grown in each year. We assessed the impact of crop species, N treatment (control, CAN-high, BR-high), and year on cumulated N2O-N emissions as well as yield-scaled N2O emissions. Data was subjected to an analysis of variance (ANOVA) using Proc Mixed of the SAS Release 9.2 statistical package (Stroup et al., 2018). Crop type, N treatment, year and corresponding interactions were considered fixed factors and block was assumed as a random factor. Crop type was nested in the year, since SW was grown in 2009 and WW in 2009/2010. Years were regarded as repeated measurement as it covered also the residual N effects.
The impact of influence factors on yield-scaled emissions were analysed by using two-factor ANOVA. This analysis considered the cropping system and N treatment, along with their interactions, as fixed factors, while the block was included as a random factor. Multiple comparisons were conducted by the Tukey-Kramer method or by t-test and subsequent Bonferroni-Holm adjustment. The DM and N yield of the crop species and of the cropping systems was analysed similarly, using N fertilizer type (CAN, BR) and N dosage (control, moderate, high) as influence factors. Furthermore, a Spearman’s rank correlation analysis was conducted to examine the relationship between N2O fluxes and various environmental variables, including soil NO3−-N and NH4+-N concentrations, soil temperature, rainfall amount, potential evapotranspiration, and solar radiation.
Daily N2O fluxes ranged from 0 to 0.49 kg N2O-N ha−1 day−1 for different N treatments depending on the cropping systems and experimental years. In general, these patterns mainly followed fertilization and tillage events (Figures 2–4), and generally receded and remained low till the next fertilizer application, which is in line with previous research (Kim et al., 2021). Contrary to our hypothesis, N2O emissions from PR ley (Figure 2) was higher compared to two tested crop rotation systems CR1 (Figure 3) and CR2 (Figure 4) during the experimental period. The highest average daily N2O fluxes in the PR ley reached a maximum of 0.49 kg N2O-N ha−1 day−1 in the first experimental year (April 2009-March 2010) and 0.24 kg N2O-N ha−1 day−1 in the second experimental year (April 2010-March 2011), exceeding maximum fluxes reported in the companion study on a humus sandy soil (Senbayram et al., 2009). In the first experimental year, the highest average daily flux in the PR ley was observed under CAN treatment after the first N dressing, while in the case of BR treatment, higher emissions were observed after the second dressing. The third application had only a small impact on total emissions, probably due to lower application rate (70 kg N/ha) as well as low WFPS (42%–57%), which are regarded as main determinants of N2O emissions (von Haden et al., 2019). The largest average fluxes in the second experimental year was observed in BR treatment after the second N dressing. With the exception of the first emission event in 2009, the daily fluxes in 2010 were generally higher than those in 2009.
In CR1, the highest flux, with 0.11 kg N2O-N ha-1 day-−1, was recorded under the BR treatment (Figure 3). In 2009, BR application was found to cause higher daily fluxes compared to CAN treatment. The emissions detected during the IR phase were mainly triggered by N application, as indicated by low fluxes in the control plots. The increase in soil moisture combined with the soil cultivation event could have promoted favourable conditions for both nitrification and denitrification to occur by enhancing substrate availability (Ariani et al., 2021). We did not observe an increase in N2O fluxes after the herbicidal spraying of the IR (with glyphosate). Generally, decomposition of stubble and roots provide favourable conditions for nitrification and denitrification processes (Thorup-Kristensen et al., 2003; Magid et al., 2004). However, high C:N ratio of the grass (13.6) or high soil moisture (73%–96%) may have slowed down the decomposition processes. Studies have shown that C:N ratio of crop residues can greatly influence N2O emissions associated with the incorporation of catch-crop residues in the soil. In the study by Li et al. (2016), incorporation of PR with high C:N ratio (28.2) led to net N immobilization resulting in lower N2O emissions compared to the leguminous crop catch residues (C:N ratio: 9.9). In the second experimental year, fertilizer applications did not result in immediate N2O-N pulses, but were delayed until June, despite high soil moisture conditions (WFPS: 72%–97%) and soil N availability (Figure 3). Based on our measurements, we cannot ascertain which variables caused these delayed emissions in June. The absence of N2O fluxes immediately after fertilisation application could be attributed to soil loosening through primary tillage, which promotes oxidation and improves gas diffusivity. This can lead to lower activity and synthesis of reductase enzymes essential for denitrification (Rochette, 2008). Additionally, increased soil temperatures in June would have facilitated the suitable conditions for N-mineralisation, accelerating the nitrification and denitrification processes in the soil (Flessa et al., 1995).
The emissions were found to be consistently low in the year 2009 ranging from 0 to 0.07 kg N2O-N ha−1 day−1 in CR2 system (Figure 4). The first increase in fluxes was observed just before the second fertilizer dressing in mid-May. Throughout the summer and autumn of 2009, detectable, but low N2O emissions were observed. This could be attributed to the low WFPS which was below 60% during almost all of spring/early summer (May to July). Emissions in 2010 were slightly higher, with the largest daily flux (0.10 kg N2O-N ha−1 day−1) occurring after the sowing of IR in the control treatment, which could be a result of high variation in WFPS (58%–82%) during the period from July till September. Rewetting after a period of low soil moisture as seen for summer 2010, can result in release of large amounts of organic N which serves as a substrate for nitrification and denitrification, thereby enhancing soil N2O emissions (Sang et al., 2022). Relatively higher emissions were observed during the IR phase of both rotations, which is consistent with results reported by Senbayram et al. (2009). Inclusion of catch crops is known to promote stable pools of soil C and N and improve nutrient use efficiency. However, they have limited effect on reducing nutrient losses in the short-term. The study by Bressler and Blesh (2022) showed that the organic matter accumulated over time would have a dominant effect on soil microbial processes compared to the immediate effects of short term inclusion of cover crops.
In the current study, emissions during the winter period (November till March) accounted for 29% of N2O emissions during the total experimental period. These findings contrast with results from other studies conducted across different locations in Germany characterized by a more continental climate, where winter emissions accounted for more than 50% of the annual N2O budget were observed (Jungkunst et al., 2006). However, N2O emissions in winter amounted to around 15%–26% for a fertilised pasture in northern Germany (Lampe et al., 2006). Apart from the generally milder climate at our study site characterized by fewer days with ground frost, very high WFPS (>80%) documented for the late autumn/winter period may have contributed to the observed effects. Nitrous oxide emissions are assumed to increase up to 70%–75% WFPS (del Prado et al., 2006). Beyond this optimal range, anaerobic conditions prevail in the soil, promoting the dominance of denitrification as the primary process. This can eventually lead to the complete reduction of N2O to N2, which was not measured in the present study. A study by Friedl et al. (2016) showed that at WFPS levels of 80% and 100%, N2 was found to be the main product of denitrification and exceeded N2O emissions by a factor of approximately 8 and 17 respectively.
The annual average temperature in the experimental years 2009 (9.1°C) and 2011 (9.1°C) was higher than the long-term average (8.2°C), while the year 2010 (7.2°C) was substantially colder (Table 1). Compared to the average long-term precipitation, the two experimental years were characterized by substantially lower rainfall in winter and spring, however the annual precipitation differed only slightly (2009: 897 mm, 2010: 839 mm, 2011: 879 mm). During the experimental period, the average soil temperatures in the cropping systems showed clear seasonal patterns with high soil temperatures during the period from June to October, and lowest temperatures were recorded from December till April. The N2O fluxes were found to be positively correlated to soil (R 3 cm depth = 0.11***, and R10cm depth = 0.13***) and air temperature (R = 0.05**) (Table 3). The positive association between soil temperature and N2O-N fluxes, at both 3 and 10 cm depth, is consistent with previous studies illustrating an increase of N2O-N emission in response to increased temperature, e.g., Rahaman et al. (2021) and Hernandez-Ramirez et al. (2009). Rising temperatures can promote soil respiration, leading to soil anaerobic conditions which is a precursor and major driver for denitrification (Butterbach-Bahl et al., 2013).
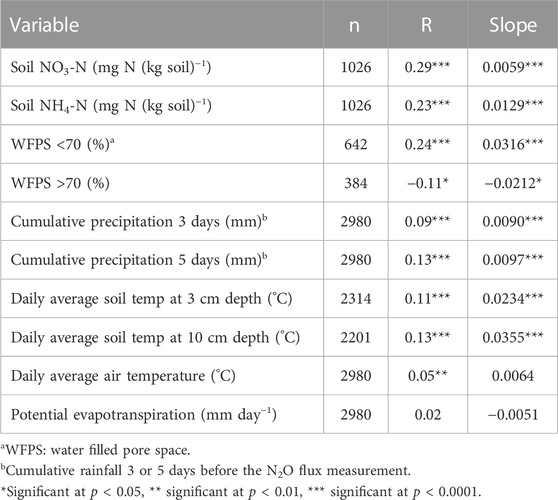
TABLE 3. Relationship among environmental variables and nitrous oxide fluxes (kg N2O-N ha-1 d−1) for all tested cropping systems in both experimental years, quantified as Spearman’s rank correlation coefficient (R) and slope when assuming linear relationships. Nitrous oxide flux data have been subject to log-normal transformation because of deviation from normal distribution. n denotes the number of measurements included in the calculation.
As seen for N2O emissions, the application of both BR and CAN substantially increased both NO3−-N and NH4+-N concentrations in the uppermost soil layer (10 cm) compared to the unamended soils (Figure 5). Subsequently, these concentrations were more closely correlated to N2O-N fluxes compared to the variation in soil moisture and temperature which was true under all the tested cropping systems. The significant impact of N form (NO3−-N, NH4+-N, organic-N) and N application rate as well as supply with organic C compounds (easily degradable, recalcitrant) on the extent of N2O-N emissions after fertilizer application has been well documented (Dittert et al., 2005; Smith et al., 2012). In a study conducted by Lazcano et al. (2016), across three different dairy farms, it was observed that the primary soil variables influencing N2O fluxes in maize-based cropping systems were soil inorganic N content, WFPS, and soil temperature. However, the impact of these variables varied remarkably across the tested farms. Water filled pore space and soil temperature were the main factors influencing N2O daily flux rates for one farm whereas N2O fluxes in another farm were driven mainly by NO3− and NH4+ concentrations in the soil as seen for our study.
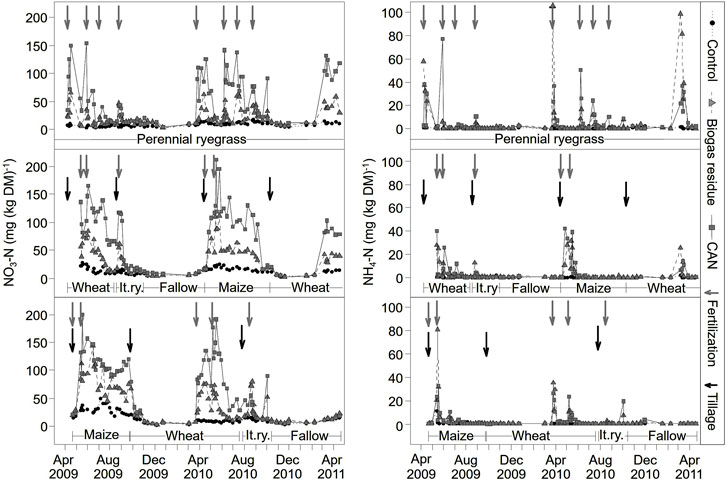
FIGURE 5. Soil nitrate-N and ammonia-N content (kg N ha−1) in the 0–10 cm soil layer monitored from April 2009 to March 2011 in the tested cropping systems, as affected by N fertilizer type [Biogas residue and CAN: Calcium ammonium nitrate (mineral-N)] in the highly fertilized and the control (unfertilized) treatment. Grey arrows indicate fertilization events, black arrows show soil tillage activities.
In our study, WFPS showed a strong variation ranging from 29% to 100% (Figures 2–4), with lowest values detected in the PR in 2009, where a complete water saturation or even oversaturation was observed during the winter period for all cropping systems. Throughout the experiment, WFPS was found to be consistently higher than 70% from November to March, and a concomitant decline in N2O-N emissions was observed in all the cropping systems. The combination of high clay content (400 g clay (kg soil)−1) and high annual rainfall (839–897 mm) would have resulted very low O2 status soils (WFPS >70%). Similar results were observed in a study examining arable cropping systems in the United Kingdom, where it was observed that in regions experiencing annual rainfall exceeding 750 mm, increase in clay content led to a reduction in N2O emissions. Under saturated or oversaturated conditions, supply of O2 becomes restricted, leading to limited O2 diffusion. Overall, the combination of labile C, neutral to high soil pH, limited O2 diffusion, and high soil moisture and temperature promotes complete denitrification to N2 (Senbayram et al., 2012; Butterbach-Bahl et al., 2013; Bracken et al., 2021). This may in part explain the lower N2O emissions found at the study site compared to the values reported in the previous studies conducted in the same region (Dittert et al., 2009; Brocks et al., 2014). Consequently, we identified a positive correlation between WFPS below 70% and N2O-N fluxes and a negative relation for WFPS above 70%. The relative product ratio of N2O:N2 produced, depends on complex interactions among the factors such as plant growth, management practices, and soil properties (texture, labile C content, pH, temperature, and moisture, etc.), soil micro-organisms, and climatic factors (Dittert et al., 2005; Schmeer et al., 2014). However, the mechanisms and at rates at which these factors affect the N2O:N2 product ratios remains poorly understood, as relatively few studies concomitantly measure N2O and N2 emissions to assess their effect (Saggar et al., 2013).
Our hypothesis that soil and environmental conditions of coastal marsh regions will result in high N2O-N losses did not hold true and observed lower emission levels at the study site compared emissions reported in the same region (Brocks et al., 2014). The measurement gap during the winter 2009/2010 caused by high snow cover could have led to underestimation of N2O-N losses in our study. Climates experiencing freeze-thaw cycles can emit significant amount of their annual N2O-N emissions during winter, and denitrification can continue even under low temperatures granted presence of adequate amount of unfrozen water and availability of C sources (Byers et al., 2021). However, the low winter emissions observed during the second experimental year indicates that the underestimation was not substantial, but these emissions are nevertheless significant. The assumption that the denitrification potential of soils is strongly connected to soil type, i.e., clay > loam > sand (van Groenigen et al., 2004; Lesschen et al., 2011), therefore has to be critically reviewed. Simultaneously, under the specific conditions of the marsh region, the soil aeration appears to be a more decisive factor which is driven by soil water conditions rather than mean climatic conditions, presumably resulting in complete denitrification to N2 instead of N2O during periods of high soil moisture content (Jungkunst et al., 2006; Phillips et al., 2015).
Contrary to our hypothesis, no significant effect of cropping systems was observed on cumulative N2O-N emissions (Figure 6), and emissions from PR ley was higher than crop rotation systems in our study. The interaction between the year and crop type had a significant effect on the cumulative N2O-N emissions (p< 0.05) (Table 4). In the first experimental year (April 2009–March 2010), no differences were found among crops, while in the second year (April 2010–March 2011), PR emitted higher N2O-N compared to WW. Emissions were generally higher in the second year, but significant variation among the years was detected only for PR and maize crop. This may be attributed to interactions between crops and weather conditions as well as the residual N effect, which can be assumed to be higher in the second year, as well as to differences in the length of the crop-specific growing periods. Lesschen et al. (2011) compared the N2O-N emissions from different agricultural soils, and found that grasslands tend to have a higher denitrification potential than arable lands due to the absence of tillage and higher soil organic matter arising from root exudates and readily available labile C sources from manure application. A recent modelling study concluded that environmental conditions deemed to be the key factor driving nitrification and denitrification processes in arable crops, while in grasslands the N amount seemed to be a decisive factor (Lijun et al., 2022). Perennial ryegrass is one of the most widely sown grass species in Europe due to its persistence under frequent harvesting, production of high-quality forage and year-round biomass production. Incorporating legumes, such as grass clover swards, in these systems can minimize the need for external N inputs and associated N losses as well as improve their N use efficiency of the systems (Lüscher et al., 2014; Chen et al., 2016).
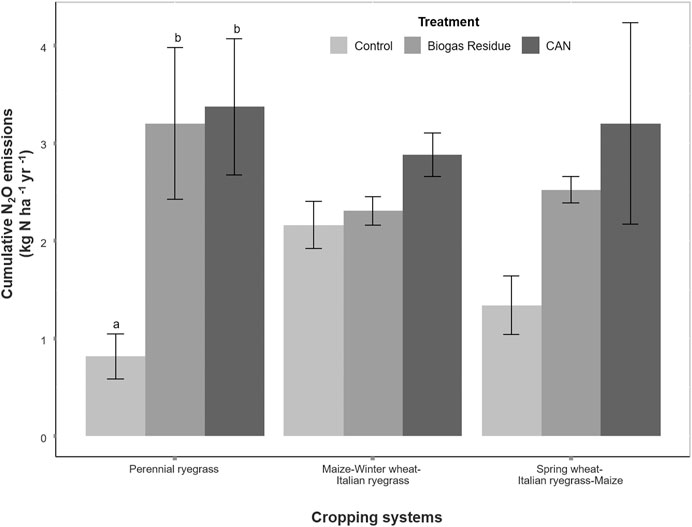
FIGURE 6. Annual cumulative N2O-N emission (kg N2O-N ha−1 yr−1) as affected by cropping system and fertilizer treatment. The biogas residue and CAN (mineral-N) treatments are restricted to the high-N application rate. Different letters indicate significant differences in N2O-N emission between N treatments.
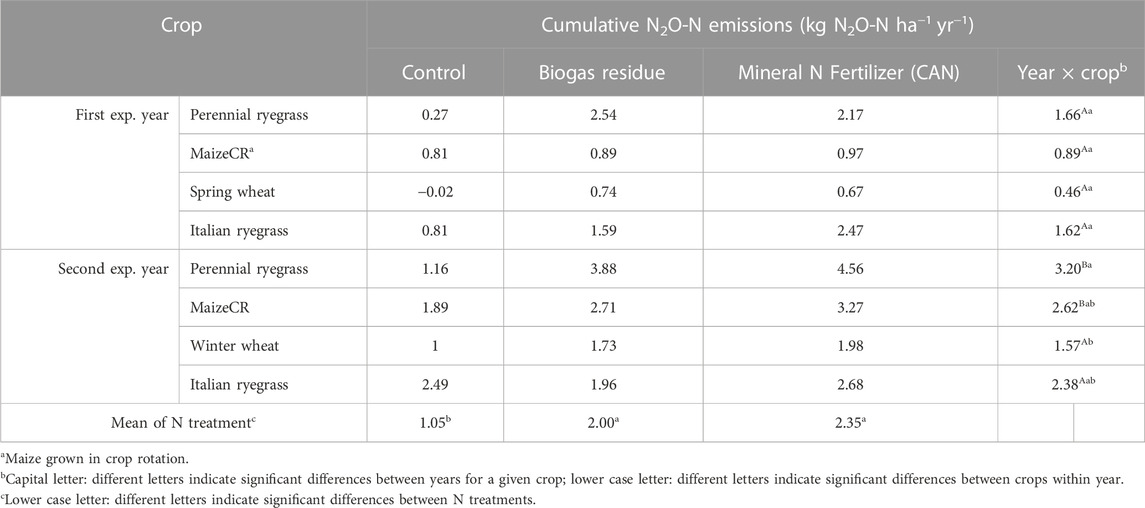
TABLE 4. Cumulative N2O-N emissions (kg N2O-N ha-1 yr−1) monitored from April 2009 to March 2011 as affected by year, fertilizer treatment, and crop. The biogas residue and mineral-N (CAN) treatments are restricted to the high-N application rate. Measurement periods covered by the different crops in the first experimental year: perennial ryegrass (1 April 2009–31 March 2010), maize (20 April −23 September 2009), spring wheat (8 April-11 August 2009), Italian ryegrass (18 August 2009–16 April 2010); in the second experimental year: perennial ryegrass (1 April 2010–31 March 2011), maize (16 April-11 October 2010), winter wheat (25 September 2009–19 July 2010), Italian ryegrass (27 July 2010–31 March 2011).
Both CAN and BR application led to significantly cumulative higher N2O emissions than the unfertilized control at both crop (p < 0.001) as well as cropping system level (p < 0.05). In contradiction to our initial assumption that BR application would lead to higher emissions than CAN application, N2O emissions from both the treatments were mostly similar (Tables 4). The presence of high NH4+ content and labile C in the BR residue as well as alkaline pH can lead to elevated nitrification and denitrification processes in the soil resulting in high N losses (Quakernack et al., 2012; Prays et al., 2018). However, we found that the major driving forces for the emission patterns in the present study were the soil and weather conditions. Our results are consistent with previous studies, where the N treatment (organic vs. mineral) had no significant effect on N2O emissions from fine textured and high C soils whereas coarse textured soils emit higher N2O with organic amendment compared to mineral N (Pelster et al., 2012). Nitrous oxide emissions from soil with high native soil organic C are mainly limited by N availability whereas effect of labile C from organic fertilizers on soil microbial processes would be much greater in the soils contain low SOC (Hansen and Eriksen, 2016).
Contrary, to our hypothesis, the overall EFs, i.e., the N2O-N emission related to N input in our study (Table 5), were found to be lower than IPCC default Tier 1 N2O-N EFs reported for synthetic (1.6%) and organic fertilizer (0.6%) in the wet temperate climate (Hergoualc’h et al., 2019). However, the IPCC default EF is a global average value with a large uncertainty. Depending on the system, it can vary highly across regions due to the differences in environmental conditions, soil properties, and management factors. The low EFs in our study are within the range of previously reported EFs for Germany (Henseler and Dechow, 2014; Mathivanan et al., 2021). For example, N2O-N EFs for grasslands in Northern Germany under CAN and slurry treatments ranged 0.1%–0.97% and 0.07%–0.56% respectively (Nyameasem et al., 2021), and highly intensively managed grasslands, including the impact of soil compaction due to heavy wheel traffic, exhibited EFs ranging from −1.44%–2.98% (Schmeer et al., 2014). Furthermore, a study conducted by Biernat et al. (2020) in the same region found the EFs ranging from 0.2% to 1.8% in the conventional crop rotation systems. The low EFs in the present study could also result from higher N2O emissions from the control plots as the current study site was highly fertilized in the years preceding the experiments. Studies have shown that historical fertilizer applications can lead to the accumulation of residual N (Drury et al., 2014; LaHue et al., 2016). This further affects the microbial dynamics in soil, N mineralization, abundance, and activity of nitrifier and denitrifier microbial communities in the long term and consequently, influence the magnitude of N2O emissions (Nyameasem et al., 2021).
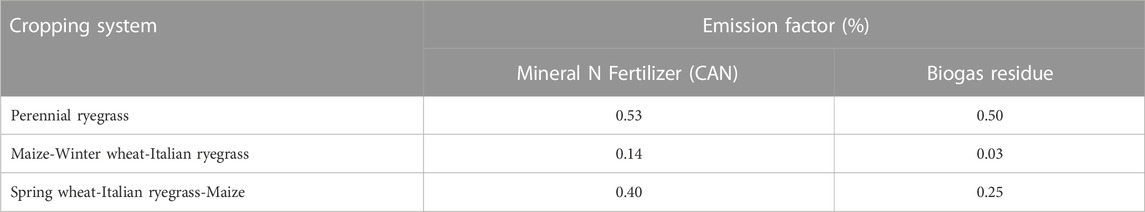
TABLE 5. Nitrous oxide emission factor (% of applied N emitted as N2O-N) as affected by different cropping systems and N fertilizer type. The biogas residue and mineral-N (CAN) treatments are restricted to the high-N application rate.
The DM yield of the cropping systems accumulated over the 2-year period was affected by an interaction of year x cropping system x N fertilizer type x N amount (p < 0.05). The effect of cropping system was most pronounced in PR ley under control treatment, as it resulted in significantly lower yields compared to the other cropping systems (Table 6). The significant effect of N fertilizer type on DM yield was observed only for PR ley and CR2, where BR application resulted in significantly lower yield than CAN. Comparable DM yields were observed from continuous maize and CR1 cropping system under both N treatments. This could be attributed to the large variation in DM and N yield of the tested crops was found in this study, ranging from 1.6 to 20.0 Mg DM ha−1 and 20.1–447.5 kg N ha−1, respectively (Table 7). Dry matter and N yields of the crops were significantly influenced by the crop type, fertilizer type and different N-application rates as well as the experimental year. Italian ryegrass catch crop accumulated less above-ground biomass than expected, with the yield ranging from 0.27 to 2.5 Mg DM ha−1 and 7.4–80.6 kg N ha−1 during the experimental period, and was combined with wheat yield for further analysis. Following IR, lowest DM and N yield values were recorded for the unfertilized PR in both the years. The highest DM yield in 2010 was achieved by the WW-IR sequence, whereas PR or maize showed highest yield performance under moderate and high N application rates in 2009. With respect to N uptake, PR clearly had higher yields compared to maize and wheat when fertilized with CAN, whereas the differences among the crops were lower under BR amendments.
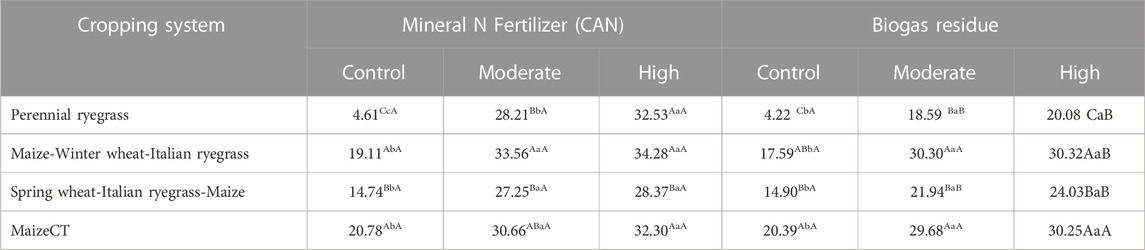
TABLE 6. Dry matter yield (t DM ha-1) of the tested cropping systems accumulated over the 2-year period, as influenced by year, type of N fertilizer (CAN, biogas residue) and N amount (control, moderate, high). First (capital) letter: different letters indicate significant differences at p = 0.05 between cropping systems within N fertilizer type and N level; second (lower case) letter: different letters indicate significant differences between N levels, within cropping system and N fertilizer type; third (capital) letter: different letters indicate significant differences between N fertilizer types, within cropping system and N level. Control: unfertilized, mod: moderate N fertilization, high: high N fertilization.
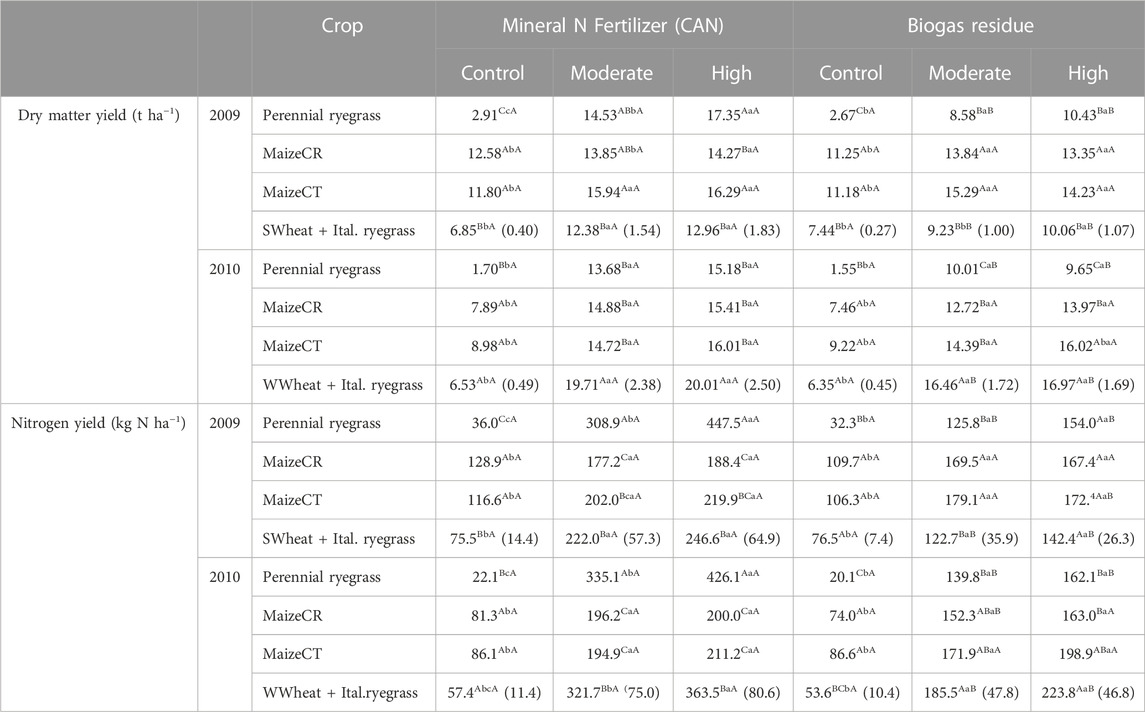
TABLE 7. Dry matter yield (Mg ha-1) and nitrogen yield (kg N ha-1) as influenced by year, crop, type of N fertilizer (CAN, biogas residue) and N-amount (control, moderate, high). Values in parenthesis give the DM and N yield of the Italian ryegrass. First (capital) letter: different letters indicate significant differences at p = 0.05 between crops within N fertilizer type and N level; second (lower case) letter: different letters indicate significant differences between N levels, within crop and N fertilizer type; third (capital) letter: different letters indicate significant differences between N fertilizer types, within crop and N level. Control: unfertilized, Moderate: moderate N fertilization, High: high N fertilization, MaizeCT: continuous maize, MaizeCR: maize grown in crop rotation, S-Wheat + Ital.: spring wheat followed by Italian ryegrass catch crop, W-Wheat + Ital.: winter wheat followed by Italian ryegrass catch crop.
Additionally, the cropping systems with crops growing year-round, i.e., PR ley and crop-rotation systems, did not achieve significantly higher biomass accumulation than continuous maize which was not in line with our initial assumption. This could be ascribed to several reasons, substitution of WW by SW in 2009 due to unfavourable weather conditions, being the most evident. However, while interpreting these results the higher yield risk of maize cultivation under changing climatic patterns in the coastal regions should be considered. In the pre-trial, owing to a dry spell in spring/early summer of 2008 there was a complete maize crop failure due to delayed or prevented emergence. Similarly, crop rotation seems to have a higher yield risk because WW establishment after late maize harvest was not successful in 2008/2009 and in the following year due to unfavourable weather conditions.
In general, BR application produced lower crop yields compared to CAN application. A stronger influence of N type was seen on the DM and N yields of the wheat—IR sequence and PR in both experimental years, where CAN application resulted in significantly higher yields of up to 25% and 41% respectively compared to BR amendments. The lower yield performance of wheat and grass than maize under BR treatment can be attributed to their differences in N uptake dynamics. It is well documented that maize N uptake coincides with the period of favourable environmental conditions triggering N mineralization from soil organic matter or BR, which can be efficiently converted into biomass (de Oliveira Santos et al., 2023). On the contrary, wheat requires high amounts of plant-available N in spring/early summer when soil N release is slower, which may explain its lower N use efficiency of BR (Sieling et al., 2013). Furthermore, low N-use efficiency under BR amendments can be ascribed to several reasons. Firstly, high N-losses via NH3 emissions (9%–21% of NH4-N applied) reduced the amount of plant-available N substrate for biomass production under BR treatment (Quakernack et al., 2012). Also, BR application by dribble bar system may have hampered infiltration especially in summer, whereas maize received part of the N as a banded starter which ensured its immediate access to the nutrients. Finally, the enhanced N demand for regrowth of PR causes a generally lower N-use efficiency after defoliation (Herrmann et al., 2013). Recent studies have shown that substitution of mineral fertilizer with up to 50% BR can produce yields comparable to biomass production from sole mineral N application or in some cases even higher yields due to longer and shorter period of N availability for crop growth (Yang et al., 2020; Rahaman et al., 2021).
In majority of the studies, agricultural N2O emissions inventories are based on the relationship between direct N2O emissions and the applied N-inputs. However, in order to identify effective management strategies to mitigate N2O emissions without comprising crop productivity, indicators linking crop productivity and their corresponding N2O emissions needs to be employed (Kim et al., 2023). In the present study, we employed two different indicators for estimating N2O-N losses from the systems, yield-scaled N2O-N emissions (YSNE) and N2O-N emissions related to N surplus, which are regarded as valuable tools to develop appropriate N management strategy to mitigate N2O emission and optimizing the C footprint of cropping systems.
Yield-scaled N2O emissions links productivity and environmental stability of system by accounting for both N2O emissions and DM yield and thereby allowing examination of the ecological efficiency of co-substrate production (van Groenigen et al., 2004; Kim et al., 2023). A significant interaction effect of crop x N treatment x year was observed on yield-scaled N2O emissions (Table 8). The influence of crop type and year was observed only under the control N treatment, where IR had significantly higher yield-scaled emissions compared to other crops in both the years. In both years and across all N treatments, wheat and maize demonstrated the lowest N2O-N emissions per unit of dry matter (DM) yield. In contrast to previous studies, the present study found that high N application rates did not result in a significant increase in yield-scaled N2O emissions, with the exception of IR. A significant N treatment effect on YSNE of IR was observed in the second experimental year, with lower yield-scaled emissions than the control. Our values are in line with values reported by Senbayram et al. (2009) who analysed YSNE of different crops in a companion study. At a humus sandy site, maize (0.14 kg N2O-N (Mg DM)−1, averaged over N treatments) performed somewhat better than grass (0.12–0.21 kg N2O-N (Mg DM)−1), and thus was able to compensate for its higher area-related emissions by its higher yield. At a sandy loam site, a higher denitrification potential resulted in yield-scaled emission between 0.11 and 0.77 kg N2O-N (Mg DM)−1 (average over N treatments) for maize. Italian ryegrass, particularly when heavily fertilized, exhibited higher yield-scaled emissions reaching up to 2.3 kg N2O-N ((Mg DM)−1, indicating a lower ecological efficiency. A data synthesis conducted by Kim et al. (2023) on YSNE for maize, wheat, and rice, found that there was a high disparity in YSNE response to N input rate, as increased N inputs resulted in higher yields as well as higher N2O emissions. Further studies need to be conducted to determine the key factors and influence of crop type on YSNE.
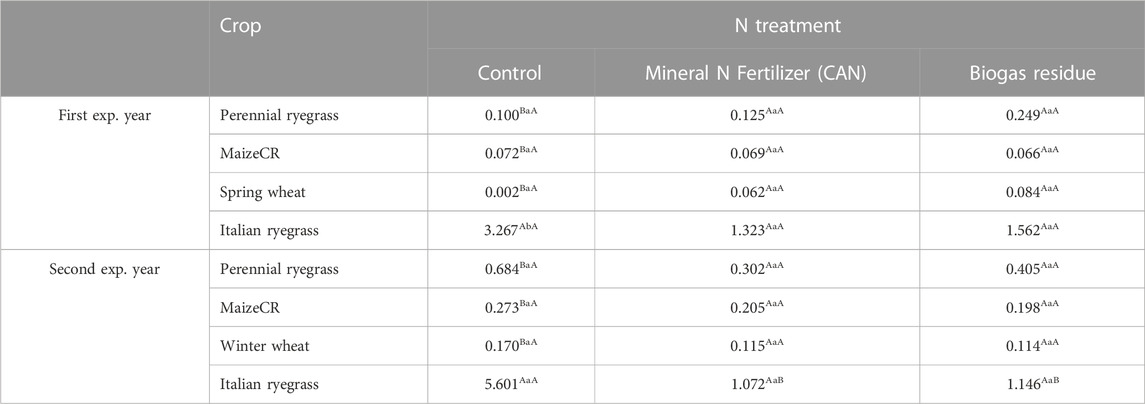
TABLE 8. Yield-scaled N2O-N emissions (kg N2O-N (Mg DM)−1) as affected by year (first exp. year: April 2009-March 2010; second exp. year: April 2010-March 2011), crop and N treatment. The biogas residue and mineral-N (CAN) treatments are restricted to the high-N application rate. First (capital) letter: different letters indicate significant differences at p = 0.05 between crops within N treatment and experimental year; second (lower case) letter: different letters indicate significant differences between N treatments, within crop and year; third (capital) letter: different letters indicate significant differences between years, with crop and N treatment. For the N2O measurement periods of the different crops underlying the calculations please see Table 4.
The yield-scaled approach has been refined by van Groenigen et al. (2010), suggesting that N2O-N emissions related to indicators of the N status by an exponential function of N surplus, could provide a useful tool for evaluating and optimizing cropping systems. However, the data from our study did not demonstrate a consistent exponential increase in YSNE as N surplus exceeded zero (Figure 7). For the control treatments, the van Groenigen equation underestimated the N-yield scaled N2O-N loss of PR and the CR1, while it was overestimated for CR2 rotation. A strong overestimation became apparent for N treatments, especially under BR application as NH3 volatilization losses were not considered for N surplus calculation which amounted for 47 and 30 kg NH3-N in 2009 and 2010 respectively (Quakernack et al., 2012). Similarly, Venterea et al. (2011) validated the N-surplus approach for maize cropping systems in Minnesota and found a substantial overestimation of N2O-N loss and provided a modified function fitted to their data. This underscores the importance of conducting site-specific assessments and implementing customized N management strategies to effectively mitigate N2O emissions in agricultural systems.
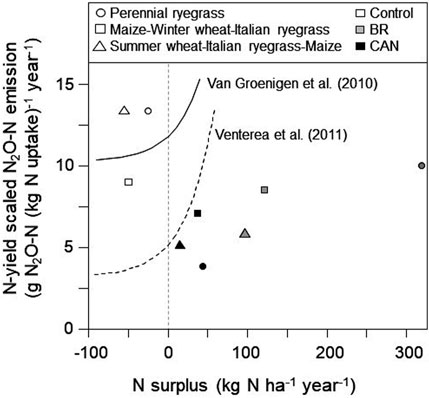
FIGURE 7. Relationship between N yield-scaled N2O-N emission and N surplus (N fertilization minus N yield) as affected by cropping system and N treatment [control, biogas residue (BR), calcium ammonium nitrate (CAN, mineral-N)]. The BR and CAN treatments are restricted to the high-N application rate.
Coastal ecosystems play a significant role in the global N2O budget; however, accurate estimates of N2O emissions from these regions remain elusive. Contrary to our hypothesis that environmental conditions like high soil organic matter, high groundwater level as well as high precipitation in the marsh region would result in higher N2O emissions especially under BR amendments, we found low to moderate overall N2O emissions during the experimental period. At higher soil moisture conditions (oversaturated soil), the emissions were found to decline, which indicates a possibility of complete reduction to N2. The results illustrate that N2O emissions were influenced mainly by climatic and weather conditions rather than the type of N fertilizer applied. Similarly, our hypothesis stating that substrate production from a PR ley would have a lower ecological footprint in terms of product-related N2O emission compared to crop rotation, was not confirmed especially under high N inputs, mainly due to higher DM yields of maize and WW. However, results from a pre- and post-trial year indicate low yield stability of maize and of WW sown after maize in late autumn, illustrating the need of long-term studies under these specific environmental conditions. The environmental performance of biogas cropping systems can be considerably improved by exploiting the optimization potential in improving N-use efficiency of BR residue and thereby, reducing the yield-scaled emissions, by employing management strategies such as through injection and/or acidification of BRs. Further research on improvement of process-oriented models considering temporal and spatial variability of environmental conditions and soil characteristics is imperative as simple indicators of N2O emissions, such as the approach based on N surplus for assessing or analysing the impact of land use systems, do not account for differences in soil properties, groundwater level, and management practices.
The original contributions presented in the study are included in the article/supplementary material, further inquiries can be directed to the corresponding author.
AH and SV wrote the final version of the manuscript. AT conducted the sampling and prepared an initial draft of the study. AT and CK supported with the data collection and data analysis. AH, AP, HK, and FT initiated, designed, and supervised this study. AH and SV prepared the revised manuscript, assisted in review and editing of the manuscript. All authors contributed to the article and approved the submitted version.
The author(s) declare financial support was received for the research, authorship, and/or publication of this article. Financial support for this research was obtained from the “Programme for the Future–Economy,” financed by the European Regional Development Fund, which is gratefully acknowledged.
We would like to thank M. Hasler for all his valuable advice on the statistical analysis, to A. Hopkins for linguistic editing of the manuscript, to M. Senbayram for helpful suggestions concerning N2O measurements, to R. Loges for assistance in NIRS, as well as to H.C. Hinrichsen, B. Thiessen, K. Makoben and K. Helmich for expert technical support in the field and laboratory. We also acknowledge the Deutscher Wetterdienst for providing weather data. We acknowledge financial support by Land Schleswig-Holstein within the funding programme Open Access Publikationsfonds.
Author RQ is employed by Bauernblatt GmbH.
The remaining authors declare that the research was conducted in the absence of any commercial or financial relationships that could be construed as a potential conflict of interest.
All claims expressed in this article are solely those of the authors and do not necessarily represent those of their affiliated organizations, or those of the publisher, the editors and the reviewers. Any product that may be evaluated in this article, or claim that may be made by its manufacturer, is not guaranteed or endorsed by the publisher.
Alves, B. J. R., Smith, K. A., Flores, R. A., Cardoso, A. S., Oliveira, W. R. D., Jantalia, C. P., et al. (2012). Selection of the most suitable sampling time for static chambers for the estimation of daily mean N2O flux from soils. Soil Biol. Biochem. 46, 129–135. doi:10.1016/j.soilbio.2011.11.022
Ariani, M., Setyanto, P., and Wihardjaka, A. (2021). Water filled-pore space and soil temperature related to N2O fluxes from shallot cultivated in rainy and dry season. IOP Conf. Ser. Earth Environ. Sci. 648, 012109. doi:10.1088/1755-1315/648/1/012109
Biernat, L., Taube, F., Loges, R., Kluß, C., and Reinsch, T. (2020). Nitrous oxide emissions and methane uptake from organic and conventionally managed arable crop rotations on farms in northwest Germany. Sustainability 12, 3240. doi:10.3390/su12083240
Bracken, C. J., Lanigan, G. J., Richards, K. G., Müller, C., Tracy, S. R., Grant, J., et al. (2021). Source partitioning using N2O isotopomers and soil WFPS to establish dominant N2O production pathways from different pasture sward compositions. Sci. Total Environ. 781, 146515. doi:10.1016/j.scitotenv.2021.146515
Bressler, A., and Blesh, J. (2022). Episodic N2O emissions following tillage of a legume–grass cover crop mixture. Biogeosciences 19 (13), 3169–3184. doi:10.5194/bg-19-3169-2022
Brocks, S., Jungkunst, H., and Bareth, G. (2014). A regionally disaggregated inventory of nitrous oxide emissions from agricultural soils in Germany - a GIS-based empirical approach. Erdkunde 68, 125–144. doi:10.3112/erdkunde.2014.02.04
Butterbach-Bahl, K., Baggs, E. M., Dannenmann, M., Kiese, R., and Zechmeister-Boltenstern, S. (2013). Nitrous oxide emissions from soils: how well do we understand the processes and their controls? Philosophical Transactions of the Royal Society B. Biol. Sci. 368 (1621), 20130122. doi:10.1098/rstb.2013.0122
Byers, E., Bleken, M. A., and Dörsch, P. (2021). Winter N2O accumulation and emission in sub-boreal grassland soil depend on clover proportion and soil pH. Environ. Res. Commun. 3, 015001. doi:10.1088/2515-7620/abd623
Cai, Y., Ding, W., and Luo, J. (2012). Spatial variation of nitrous oxide emission between interrow soil and interrow plus row soil in a long-term maize cultivated sandy loam soil. Geoderma 181-182, 2–10. doi:10.1016/j.geoderma.2012.03.005
Chen, S.-M., Lin, S., Loges, R., Reinsch, T., Hasler, M., and Taube, F. (2016). Independence of seasonal patterns of root functional traits and rooting strategy of a grass-clover sward from sward age and slurry application. Grass Forage Sci. 71 (4), 607–621. doi:10.1111/gfs.12222
Claus, S., Taube, F., Wienforth, B., Svoboda, N., Sieling, K., Kage, H., et al. (2014). Life-cycle assessment of biogas production under the environmental conditions of northern Germany: greenhouse gas balance. J. Agric. Sci. 152 (S1), 172–181. doi:10.1017/s0021859613000683
de Oliveira Santos, T., Júnior, A., and Moulin, M. (2023). Maize breeding for low nitrogen inputs in agriculture: mechanisms underlying the tolerance to the abiotic stress. Stress. 3, 136–152. doi:10.3390/stresses3010011
del Prado, A., Merino, P., Estavillo, J. M., Pinto, M., and González-Murua, C. (2006). N2O and NO emissions from different N sources and under a range of soil water contents. Nutrient Cycl. Agroecosyst. 74 (3), 229–243. doi:10.1007/s10705-006-9001-6
Dittert, K., Lampe, C., Gasche, R., Butterbach-Bahl, K., Wachendorf, M., Papen, H., et al. (2005). Short-term effects of single or combined application of mineral N fertilizer and cattle slurry on the fluxes of radiatively active trace gases from grassland soil. Soil Biol. Biochem. 37 (9), 1665–1674. doi:10.1016/j.soilbio.2005.01.029
Dittert, K., Senbayram, M., Wienforth, B., Kage, H., and Mühling, K. (2009). Greenhouse gas emissions in biogas production systems.
Drury, C. F., Reynolds, W. D., Tan, C. S., McLaughlin, N. B., Yang, X. M., Calder, W., et al. (2014). Impacts of 49–51 years of fertilization and crop rotation on growing season nitrous oxide emissions, nitrogen uptake and corn yields. Can. J. Soil Sci. 94 (3), 421–433. doi:10.4141/cjss2013-101
Eickenscheidt, T., Freibauer, A., Heinichen, J., Augustin, J., and Drösler, M. (2014). Short-term effects of biogas digestate and cattle slurry application on greenhouse gas emissions affected by N availability from grasslands on drained fen peatlands and associated organic soils. Biogeosciences 11 (22), 6187–6207. doi:10.5194/bg-11-6187-2014
European and Directorate-General for (2022). REPowerEU, joint European action for more affordable, secure and sustainable energy. Publications Office of the European Union.
Flessa, H., Dörsch, P., and Beese, F. (1995). Flessa H, Dorsch P, Beese F. Seasonal variation of N2O and CH4 fluxes in differently managed arable soils in Southern Germany. J. Geophys. Res. 1002, 23115–23124. doi:10.1029/95JD02270
Friedl, J., Scheer, C., Rowlings, D. W., McIntosh, H. V., Strazzabosco, A., Warner, D. I., et al. (2016). Denitrification losses from an intensively managed sub-tropical pasture – impact of soil moisture on the partitioning of N2 and N2O emissions. Soil Biol. Biochem. 92, 58–66. doi:10.1016/j.soilbio.2015.09.016
Guo, Y., Anjum, A., Khan, A., Naeem, A., and Mühling, K. H. (2021). Comparative effectiveness of biogas residue acidification and nitrification inhibitors in mitigating CO2 and N2O emissions from biogas residue-amended soils. Water, Air, & Soil Pollut. 232 (9), 345. doi:10.1007/s11270-021-05282-1
Hansen, E., and Eriksen, J. (2016). Nitrate leaching in maize after cultivation of differently managed grass-clover leys on coarse sand in Denmark. Agric. Ecosyst. Environ. 216, 309–313. doi:10.1016/j.agee.2015.10.010
Henseler, M., and Dechow, R. (2014). Simulation of regional nitrous oxide emissions from German agricultural mineral soils: a linkage between an agro-economic model and an empirical emission model. Agric. Syst. 124, 70–82. doi:10.1016/j.agsy.2013.10.005
Hergoualch, K., Akiyama, H., Bernoux, M., Chirinda, N., Prado, A. D., Kasimir, A., et al. (2019). "N2O emissions from managed soils, and CO2 emissions from lime and urea application", in 2019 Refinement to the 2006 IPCC Guidelines for National Greenhouse Gas Inventories, Volume 4: Agriculture, Forestry and Other Land Use Switzerland. E. Calvo Buendia, K. Tanabe, A. Kranjc, J. Baasansuren, M. Fukuda, S. Ngarizeet al. Intergovernmental Panel on Climate Change.
Hernandez-Ramirez, G., Brouder, S. M., Smith, D. R., and Van Scoyoc, G. E. (2009). Greenhouse gas fluxes in an eastern corn belt soil: weather, nitrogen source, and rotation. J. Environ. Qual. 38 (3), 841–854. doi:10.2134/jeq2007.0565
Herrmann, A., and Rath, J. (2012). Biogas production from maize: current state, challenges, and prospects. 1. Methane yield potential. BioEnergy Res. 5 (4), 1027–1042. doi:10.1007/s12155-012-9202-6
Herrmann, A., Sieling, K., Wienforth, B., Taube, F., and Kage, H. (2013). Short-term effects of biogas residue application on yield performance and N balance parameters of maize in different cropping systems. J. Agric. Sci. 151 (4), 449–462. doi:10.1017/s0021859612000548
Herrmann, A., Kage, H., Taube, F., and Sieling, K. (2017). Effect of biogas digestate, animal manure and mineral fertilizer application on nitrogen flows in biogas feedstock production. Eur. J. Agron. 91, 63–73. doi:10.1016/j.eja.2017.09.011
Hutchinson, G. L., and Mosier, A. R. (1981). Improved soil cover method for field measurement of nitrous oxide fluxes. Soil Sci. Soc. Am. J. 45 (2), 311–316. doi:10.2136/sssaj1981.03615995004500020017x
IPCC (2021). "Climate Change 2021: The Physical Science Basis. Contribution of Working Group I to the Sixth Assessment Report of the Intergovernmental Panel on Climate Change", in IPCC, 2021. (eds.) V. Masson-Delmotte, P. Zhai, A. Pirani, C. P. Connors, S. Berger, N. Caudet al. (New York, NY, USA: Cambridge University Press), 2391.
Jungkunst, H. F., Freibauer, A., Neufeldt, H., and Bareth, G. (2006). Nitrous oxide emissions from agricultural land use in Germany— a synthesis of available annual field data. J. Plant Nutr. Soil Sci. 169 (3), 341–351. doi:10.1002/jpln.200521954
Kim, S. U., Lee, H. H., Moon, S. M., Han, H. R., and Hong, C. O. (2021). Nitrous oxide emissions and maize yield as influenced by nitrogen fertilization and tillage operations in upland soil. Appl. Biol. Chem. 64 (1), 18. doi:10.1186/s13765-021-00593-7
Kim, D.-G., Giltrap, D., and Sapkota, T. B. (2023). Understanding response of yield-scaled N2O emissions to nitrogen input: data synthesis and introducing new concepts of background yield-scaled N2O emissions and N2O emission-yield curve. Field Crops Res. 290, 108737. doi:10.1016/j.fcr.2022.108737
LaHue, G. T., van Kessel, C., Linquist, B. A., Adviento-Borbe, M. A., and Fonte, S. J. (2016). Residual effects of fertilization history increase nitrous oxide emissions from zero-N controls: implications for estimating fertilizer-induced emission factors. J. Environ. Qual. 45 (5), 1501–1508. doi:10.2134/jeq2015.07.0409
Lampe, C., Dittert, K., Sattelmacher, B., Wachendorf, M., Loges, R., and Taube, F. (2006). Sources and rates of nitrous oxide emissions from grazed grassland after application of 15N-labelled mineral fertilizer and slurry. Soil Biol. Biochem. 38 (9), 2602–2613. doi:10.1016/j.soilbio.2006.03.016
Lazcano, C., Tsang, A., Doane, T. A., Pettygrove, G. S., Horwath, W. R., and Burger, M. (2016). Soil nitrous oxide emissions in forage systems fertilized with liquid dairy manure and inorganic fertilizers. Agric. Ecosyst. Environ. 225, 160–172. doi:10.1016/j.agee.2016.04.009
Lesschen, J. P., Velthof, G. L., de Vries, W., and Kros, J. (2011). Differentiation of nitrous oxide emission factors for agricultural soils. Environ. Pollut. 159 (11), 3215–3222. doi:10.1016/j.envpol.2011.04.001
Li, D., Watson, C. J., Yan, M. J., Lalor, S., Rafique, R., Hyde, B., et al. (2013). A review of nitrous oxide mitigation by farm nitrogen management in temperate grassland-based agriculture. J. Environ. Manag. 128, 893–903. doi:10.1016/j.jenvman.2013.06.026
Li, X., Sørensen, P., Olesen, J. E., and Petersen, S. O. (2016). Evidence for denitrification as main source of N2O emission from residue-amended soil. Soil Biol. Biochem. 92, 153–160. doi:10.1016/j.soilbio.2015.10.008
Li, Y., Moinet, G. Y. K., Clough, T. J., and Whitehead, D. (2022). Organic matter contributions to nitrous oxide emissions following nitrate addition are not proportional to substrate-induced soil carbon priming. Sci. Total Environ. 851, 158274. doi:10.1016/j.scitotenv.2022.158274
Lijun, Y., Zhang, Q., Tian, Y., Sun, W., Scheer, C., Li, T., et al. (2022). Global variations and drivers of nitrous oxide emissions from forests and grasslands. Front. Soil Sci. 2, 1094177. doi:10.3389/fsoil.2022.1094177
Lüscher, A., Mueller-Harvey, I., Soussana, J. F., Rees, R. M., and Peyraud, J. L. (2014). Potential of legume-based grassland–livestock systems in Europe: a review. Grass Forage Sci. 69 (2), 206–228. doi:10.1111/gfs.12124
Magid, J., Luxhøi, J., and Lyshede, O. B. (2004). Decomposition of plant residues at low temperatures separates turnover of nitrogen and energy rich tissue components in time. Plant Soil 258 (1), 351–365. doi:10.1023/b:plso.0000016565.14718.4b
Mathivanan, G. P., Eysholdt, M., Zinnbauer, M., Rösemann, C., and Fuß, R. (2021). New N2O emission factors for crop residues and fertiliser inputs to agricultural soils in Germany. Agriculture. Ecosyst. Environ. 322, 107640. doi:10.1016/j.agee.2021.107640
Mdlambuzi, T., Muchaonyerwa, P., Tsubo, M., and Moshia, M. E. (2021). Nitrogen fertiliser value of biogas slurry and cattle manure for maize (Zea mays L.) production. Heliyon 7, e07077. doi:10.1016/j.heliyon.2021.e07077
Nyameasem, J. K., Malisch, C. S., Loges, R., Taube, F., Kluß, C., Vogeler, I., et al. (2021). Nitrous oxide emission from grazing is low across a gradient of plant functional diversity and soil conditions. Atmosphere 12 (2), 223. doi:10.3390/atmos12020223
Pelster, D. E., Chantigny, M. H., Rochette, P., Angers, D. A., Rieux, C., and Vanasse, A. (2012). Nitrous oxide emissions respond differently to mineral and organic nitrogen sources in contrasting soil types. J. Environ. Qual. 41 (2), 427–435. doi:10.2134/jeq2011.0261
Phillips, R. L., McMillan, A. M. S., Palmada, T., Dando, J., and Giltrap, D. (2015). Temperature effects on N2O and N2 denitrification end-products for a New Zealand pasture soil. N. Z. J. Agric. Res. 58 (1), 89–95. doi:10.1080/00288233.2014.969380
Poyda, A., Reinsch, T., Struck, I. J., Skinner, R. H., Kluß, C., and Taube, F. (2021). Low assimilate partitioning to root biomass is associated with carbon losses at an intensively managed temperate grassland. Plant Soil 460 (1), 31–50. doi:10.1007/s11104-020-04771-2
Prays, N., Dominik, P., Sänger, A., and Franko, U. (2018). Biogas residue parameterization for soil organic matter modeling. PLOS ONE 13, e0204121. doi:10.1371/journal.pone.0204121
Quakernack, R., Pacholski, A., Techow, A., Herrmann, A., Taube, F., and Kage, H. (2012). Ammonia volatilization and yield response of energy crops after fertilization with biogas residues in a coastal marsh of Northern Germany. Agric. Ecosyst. Environ. 160, 66–74. doi:10.1016/j.agee.2011.05.030
Rahaman, M. A., Zhang, Q., Shi, Y., Zhan, X., and Li, G. (2021). Biogas slurry application could potentially reduce N2O emissions and increase crop yield. Sci. Total Environ. 778, 146269. doi:10.1016/j.scitotenv.2021.146269
Rochette, P. (2008). No-till only increases N2O emissions in poorly-aerated soils. Soil Tillage Res. 101 (1), 97–100. doi:10.1016/j.still.2008.07.011
Rusch, H. L., Coulter, J. A., Grossman, J. M., Johnson, G. A., Porter, P. M., and Garcia, A. G. Y. (2020). Towards sustainable maize production in the U.S. upper Midwest with interseeded cover crops. PLOS ONE 15, e0231032. doi:10.1371/journal.pone.0231032
Saggar, S., Jha, N., Deslippe, J., Bolan, N. S., Luo, J., Giltrap, D. L., et al. (2013). Denitrification and N2O: N2 production in temperate grasslands: processes, measurements, modelling and mitigating negative impacts. Sci. Total Environ. 465, 173–195. doi:10.1016/j.scitotenv.2012.11.050
Sang, J., Lakshani, M. M. T., Chamindu Deepagoda, T. K. K., Shen, Y., and Li, Y. (2022). Drying and rewetting cycles increased soil carbon dioxide rather than nitrous oxide emissions: a meta-analysis. J. Environ. Manag. 324, 116391. doi:10.1016/j.jenvman.2022.116391
Schmeer, M., Loges, R., Dittert, K., Senbayram, M., Horn, R., and Taube, F. (2014). Legume-based forage production systems reduce nitrous oxide emissions. Soil Tillage Res. 143, 17–25. doi:10.1016/j.still.2014.05.001
Senbayram, M., Chen, R., Mühling, K. H., and Dittert, K. (2009). Contribution of nitrification and denitrification to nitrous oxide emissions from soils after application of biogas waste and other fertilizers. Rapid Commun. Mass Spectrom. 23 (16), 2489–2498. doi:10.1002/rcm.4067
Senbayram, M., Chen, R., Budai, A., Bakken, L., and Dittert, K. (2012). N2O emission and the N2O/(N2O+N2) product ratio of denitrification as controlled by available carbon substrates and nitrate concentrations. Agric. Ecosyst. Environ. 147, 4–12. doi:10.1016/j.agee.2011.06.022
Sieling, K., Herrmann, A., Wienforth, B., Taube, F., Ohl, S., Hartung, E., et al. (2013). Biogas cropping systems: short term response of yield performance and N use efficiency to biogas residue application. Eur. J. Agron. 47, 44–54. doi:10.1016/j.eja.2013.01.002
Smith, K. A., Dobbie, K. E., Thorman, R., Watson, C. J., Chadwick, D. R., Yamulki, S., et al. (2012). The effect of N fertilizer forms on nitrous oxide emissions from UK arable land and grassland. Nutrient Cycl. Agroecosyst. 93 (2), 127–149. doi:10.1007/s10705-012-9505-1
Stroup, W. W., George, A. M., Elizabeth, A. C., and Russell, D. W. (2018). SAS® for mixed models: introduction and basic applications. Cary, NC: SAS Institute Inc. SAS Institute.
Thorup-Kristensen, K., Magid, J., and Jensen, L. S. (2003). Catch crops and green manures as biological tools in nitrogen management in temperate zones. Adv. Agron. 79, 227–302. doi:10.1016/s0065-211379005-6
Tian, H., Xu, R., Canadell, J. G., Thompson, R. L., Winiwarter, W., Suntharalingam, P., et al. (2020). A comprehensive quantification of global nitrous oxide sources and sinks. Nature 586 (7828), 248–256. doi:10.1038/s41586-020-2780-0
van Groenigen, J. W., Kasper, G. J., Velthof, G. L., van den Pol-van Dasselaar, A., and Kuikman, P. J. (2004). Nitrous oxide emissions from silage maize fields under different mineral nitrogen fertilizer and slurry applications. Plant Soil 263 (1), 101–111. doi:10.1023/b:plso.0000047729.43185.46
Van Groenigen, J. W., Velthof, G. L., Oenema, O., Van Groenigen, K. J., and Van Kessel, C. (2010). Towards an agronomic assessment of N2O emissions: a case study for arable crops. Eur. J. Soil Sci. 61 (6), 903–913. doi:10.1111/j.1365-2389.2009.01217.x
Venterea, R. T., Maharjan, B., and Dolan, M. S. (2011). Fertilizer source and tillage effects on yield-scaled nitrous oxide emissions in a corn cropping system. J. Environ. Qual. 40 (5), 1521–1531. doi:10.2134/jeq2011.0039
von Haden, A. C., Marín-Spiotta, E., Jackson, R. D., and Kucharik, C. J. (2019). Soil microclimates influence annual carbon loss via heterotrophic soil respiration in maize and switchgrass bioenergy cropping systems. Agric. For. Meteorology 279, 107731. doi:10.1016/j.agrformet.2019.107731
Keywords: biogas residue, perennial ryegrass, maize, wheat, coastal marshes, yield-scaled N2O emission, climate change
Citation: Herrmann A, Verma S, Techow A, Kluß C, Dittert K, Quakernack R, Pacholski A, Kage H and Taube F (2023) Assessing nitrous oxide emissions and productivity of cropping systems for biogas production using digestate and mineral fertilisation in a coastal marsh site. Front. Environ. Sci. 11:1231767. doi: 10.3389/fenvs.2023.1231767
Received: 30 May 2023; Accepted: 01 December 2023;
Published: 18 December 2023.
Edited by:
Shuhab Khan, University of Houston, United StatesCopyright © 2023 Herrmann, Verma, Techow, Kluß, Dittert, Quakernack, Pacholski, Kage and Taube. This is an open-access article distributed under the terms of the Creative Commons Attribution License (CC BY). The use, distribution or reproduction in other forums is permitted, provided the original author(s) and the copyright owner(s) are credited and that the original publication in this journal is cited, in accordance with accepted academic practice. No use, distribution or reproduction is permitted which does not comply with these terms.
*Correspondence: Supriya Verma, c3Zlcm1hQGdmby51bmkta2llbC5kZQ==
Disclaimer: All claims expressed in this article are solely those of the authors and do not necessarily represent those of their affiliated organizations, or those of the publisher, the editors and the reviewers. Any product that may be evaluated in this article or claim that may be made by its manufacturer is not guaranteed or endorsed by the publisher.
Research integrity at Frontiers
Learn more about the work of our research integrity team to safeguard the quality of each article we publish.