 Yi Wang
 Fangxin Chen2
95% of researchers rate our articles as excellent or good
Learn more about the work of our research integrity team to safeguard the quality of each article we publish.
Find out more
ORIGINAL RESEARCH article
Front. Environ. Sci. , 04 August 2023
Sec. Soil Processes
Volume 11 - 2023 | https://doi.org/10.3389/fenvs.2023.1230565
Limited by the current monitoring and collection methods of subsurface flow data, the characteristics of phosphorus (P) migration loss in different soil layers on sloping cropland under natural rainfall conditions need to be clarified. In this study, a reliable U-trough collection method was used to explore P migration losses in different purple soil layers (L0: surface, L1: 0–20 cm, L2: 20–40 cm, and L3: 40–60 cm) for purple soil sloping cropland during a field monitoring campaign spanning two calendar years under natural rainfall conditions. The results suggested that the annual surface P loss load was 1.08 kg*ha−1*yr−1, where 92.1% was particulate P. The annual leaching loss load of total P from the L1 layer was 3.55 kg*ha−1*yr−1, where 74.2% and 10.5% were intercepted by the L2 and L3 layers, respectively, to increase the in situ soil P stocks. Only 15.3% of L1’s annually leached P, and only half the surface P loss load (L0), was lost to underground water. Heavy-rain events on the purple soils in the studied sloping cropland induced 43.9% of the annual surface P loss load. In contrast, 36.1%, 30.5%, and 30.3% of P’s eventual annual leached loss loads resulted from heavy, moderate, and torrential rain events, respectively. The maize season was the main period of surface and subsurface P migration loss. Due to the limitation of experimental conditions, the results of this experiment could not represent the soil phosphorus migration process in the natural purple slope farmland in nature, but it could partially represent the soil phosphorus migration in the newly cultivated purple sloping cropland in Chongqing.
Diffuse phosphorus (P) and nitrogen (N) loss from agricultural fields is the critical factor causing agricultural nonpoint source pollution (AGNSP), seriously damaging the ecological environment by water eutrophication and algal blooms (Bechmann et al., 2019; Cheng et al., 2021; Hanrahan et al., 2021). Soil P is derived from fertilizer and pesticide applications, soil parent material release, and atmospheric deposition, wherein fertilizer is the critical source of arable land soil P (Linderholm et al., 2012). Therefore, the regular location of P migration is soil bodies, manifesting as temporary sinks or sources for P (Jahanzad et al., 2019; Weihrauch and Weber, 2021). Loss of P in farmland is an essential cause of eutrophication in the water environment, as P is transported from soils to rivers and other water bodies (He et al., 2019). Therefore, controlling the loss of P in soil is essential.
P migration is a complicated biogeochemical process that includes P accumulation, sorption–desorption, and water movement in the soil profile (Hua and Zhu, 2020). There are three major locations for fertilizer P: one is in planting roots for growth, approximately 30%, as some have reported (Wang, 2021), one is stored in the soil body to enrich the soil P storage by soil sorption and soil bacteria utilization, and the last is migrated from the in situ soil body by surface and subsurface runoff (Cameron et al., 2013). Particulate P (PP) loss is dominant in surface runoff and sediment (Bah et al., 2020), while dissolved reactive P (DRP) is the main form of P in subsurface runoff and soil leachate (Chen and Arai, 2020). McDowell et al. (2016) also noted that soil P loss is mainly caused by sediment transport in surface runoff. P mobilization in agricultural landscapes is affected by both hydrologic (transport) and biogeochemical (supply) processes interacting within soils (Plach et al., 2018), specifically embodied in erosion and runoff factors, which are the dominant pathways of agricultural nutrient loss ((Liu et al., 2012; Zhang et al., 2013). Factors affecting P migration are various and comprehensive (Wang et al., 2021a), among which surplus P input from fertilizers, especially chemical fertilizers, is the main factor increasing soil P losses (Fischer et al., 2018). Soil pores and fissures, especially macropores and cracks, provide migration channels for soil P.
Moreover, sloping farmland is one of the most serious agricultural P loss areas globally (Wang et al., 2018). Sixty percent of cultivated land in the Three Gorges Reservoir Area (TGRA), one of China’s main economic development zones, is purple soil with rich porosity and high transitivity (Zhang et al., 2019; Wang et al., 2021b), which is convenient for soil nutrient migration. In 2016, the loss of chemical fertilizer in the TGRA reached 1.06 × 10⁴ t, accounting for 8.9% of fertilizer consumption (MEP, 2020). Agricultural N and P losses have become major threats to water quality and agricultural development in the TRGA (Zhu et al., 2012; Zhang et al., 2015). Therefore, P losses in purple soil sloping farmland need greater attention (Luo et al., 2013).
In summary, previous studies have mainly focused on P loss in surface runoff, while research on the migration characteristics and loading from different soil layers is scarce and needs further study. Agricultural P mainly migrates from the top to the bottom soil layer in the soil body through soil pores under both gravity and water pressure; during the process, the migrated P fractions are intercepted and absorbed by soil particulates. However, the role of each soil layer is still unclear. Weihrauch and Weber (2021) suggested that the spatial hotspots of P loss are the top soils and the deep P stocks in the riparian buffer zones. Therefore, it is meaningful for the prevention and control of AGNSP to explore the P loss rule of each soil layer. In this paper, a reliable U-trough collection method (UCM) was used to analyze the agricultural P migration loss loads from different soil layers under natural rainfall. This study aimed to provide a practical reference for quantitative research on soil nutrient migration losses from different soil layers.
The experimental site was located at the National Monitoring Base for Purple Soil Fertility and Fertilizer Efficiency, which is in Beibei District (29°48′38″N, 106°24′40.6″E), Chongqing Municipality, China (Figure 1A). This field is in the typical subtropical monsoon climate zone with a mean annual temperature of 18.3 °C and a mean annual precipitation of 1105.4 mm. The rainy season is mainly from May to October, overlapping with the hot season. This region is rich in low hilly landforms and sloping farmlands. The soil is mainly purple, classified as Pup-Orthic Entisols in Chinese Soil Taxonomy or Regosols in Food and Agricultural Organization (FAO) Taxonomy or Entisols in United States Department of Agriculture (USDA) Taxonomy. The soils are shallow (approximately 30 cm–80 cm depth), and the parent bedrock has poor water permeability. The soil for this study is developed from the Jurassic Shaximiao Formation. The basic physicochemical properties of each layer’s soil are shown in Table 1. The common crop rotation in this region is summer maize rotated with winter mustard.
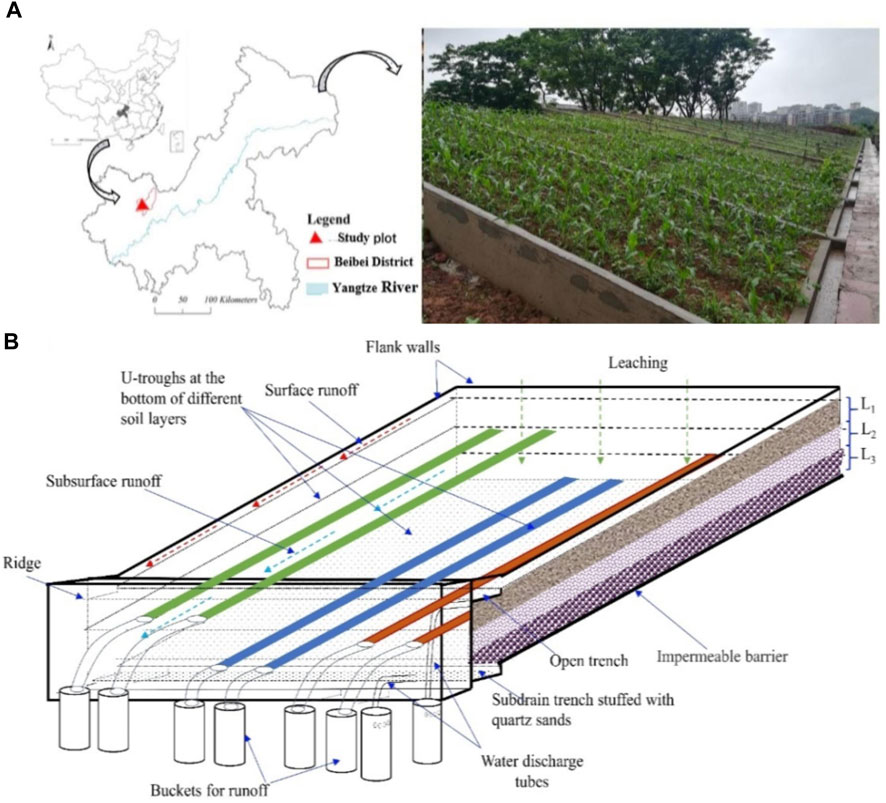
FIGURE 1. Location of test plots (A) and layout of the U-trough collection method (UCM) (B). L1: 0 cm–20 cm, L2: 20 cm–40 cm, and L3: 40 cm–60 cm.
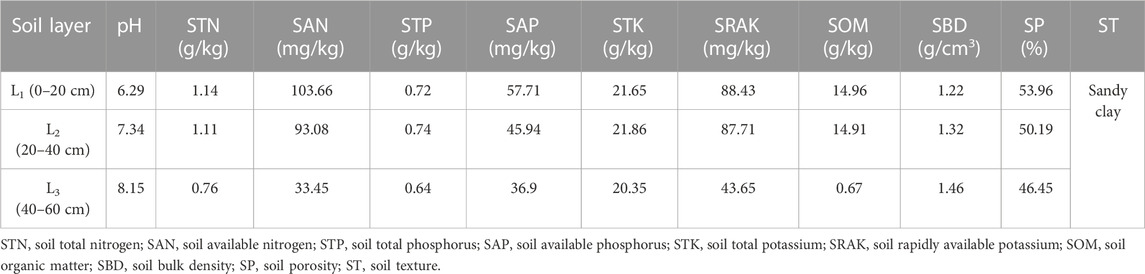
TABLE 1. Basic properties of experimental soil.
Each runoff field was constructed as a separate plot with dimensions of 9 m (length) × 3 m (width) × 0.8 m (depth). Each runoff plot’s slope and soil depth were 15° and 60 cm, respectively. Adjacent ones were hydrologically isolated with cement walls to avoid unexpected interplot cross-flow between plots. A reinforced concrete floor was made to imitate the parent bedrock with poor water permeability. The test soil in each runoff field was filled in different soil layers (L1: 0 cm–20 cm, L2: 20 cm–40 cm, and L3: 40 cm–60 cm) according to the technical code for the newly cultivated land in Chongqing. The open trench collected surface (L0) flow and subsurface flow from three different soil layers were collected via U-shaped PVC conflux troughs settled on the bottom of each soil layer and conveyed to buckets by using water discharge tubes (Figure 1B). Each conflux trough (rectangle without cover, 10 cm width, 5 cm depth) was of the same length, parallel to the experimental field, and then, filled with clean quartz sand and covered by two layers of 200-mesh gauze to enhance the trough’s hydraulic conductivity (Wang et al., 2021a). Runoff with sediment samples could be obtained in each corresponding bucket. The possible overflow was collected into a sub-bucket by using a pipe (nominal diameter 32 mm) to measure the overflow from the bucket to obtain the accurate runoff flow of each plot. Specifically, to improve the test accuracy, two identical collection troughs for each soil layer of a single runoff plot and three runoff plots with the same treatment (as three replicates) were conducted. Conventional along-slope cropping and fertilization were conducted according to farmers’ planting habits. The fertilization amounts and dates for different crops during the test period (3/1/2018-2/29/2020) are shown in Table 2.
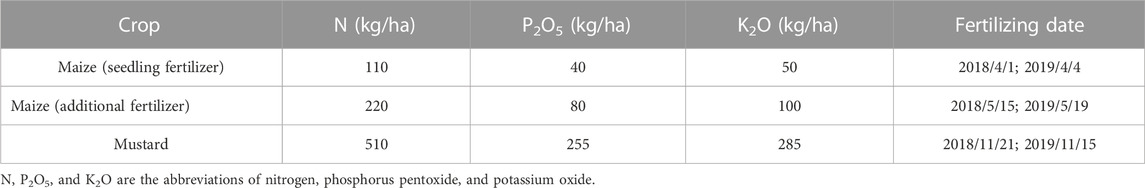
TABLE 2. Fertilizer application per unit cropland area during the test period (pure amount).
The observation of P migration from different soil layers by runoff and sediment was from March 2018 to February 2020. Hourly meteorological data were obtained from a small automatic-collection weather station near the research plots. Soil samples were taken with auger and ring samples before planting and after harvesting. The basic physicochemical properties of the soil and sediment samples were determined by following Yang et al.’s (2008) methods.
After each rainfall-runoff event, the volumes of surface flow and subsurface flow from each soil layer in each runoff plot were monitored. Subsequently, water samples of surface and subsurface flow in the buckets were collected separately and then analyzed promptly in the laboratory. Water samples from surface and subsurface flows were used to measure sediment yield after oven drying at 105 °C for 24 h and the concentrations of P fractions. The total phosphorus (TP) concentration in the water samples was measured without filtration. Water samples used to analyze the phosphate–phosphorus (PO43-–P) concentration and total dissolved phosphorus (TDP) were filtered through 0.45 μm filtration membranes. After digestion with potassium persulfate, TP and TDP concentrations were determined through the molybdenum blue colorimetry method (Huang et al., 2020). The concentration of PO43-–P was measured using the same method used for TDP without digestion. The PP concentration was calculated by the following equation: PP = TP−TDP (Li et al., 2017). The TP content of each soil layer was determined by the molybdenum blue colorimetry method after melting with NaOH, while the available phosphorus (AP) was measured by the Olsen method (Wang, 2021). The sediment samples were dried in an oven at 105 °C to a constant weight. The conventional pipette method determined the sediment particle size distribution (PSD) (Zuo et al., 2020).
Each fluid sample’s runoff volume was the water collected in the corresponding bucket of each collection device. The runoff flux of surface runoff and subsurface runoff under the ith rainfall event was calculated by the following formulas, modified from the work of Peng et al. (2016):
where
The following formulas were used to calculate the P migration load of the surface and subsurface under the ith rainfall event:
where
This study analyzed the migration loads of P under different planting stages (S1: maize season, S2: summer fallow period, S3: mustard season, and S4: winter fallow period) and different rainfall patterns (TR: torrential rain, HR: heavy rain, MR: moderate rain, and LR: light rain, classified by the Classification Standard of China Meteorological Administration), as shown in Figure 2.
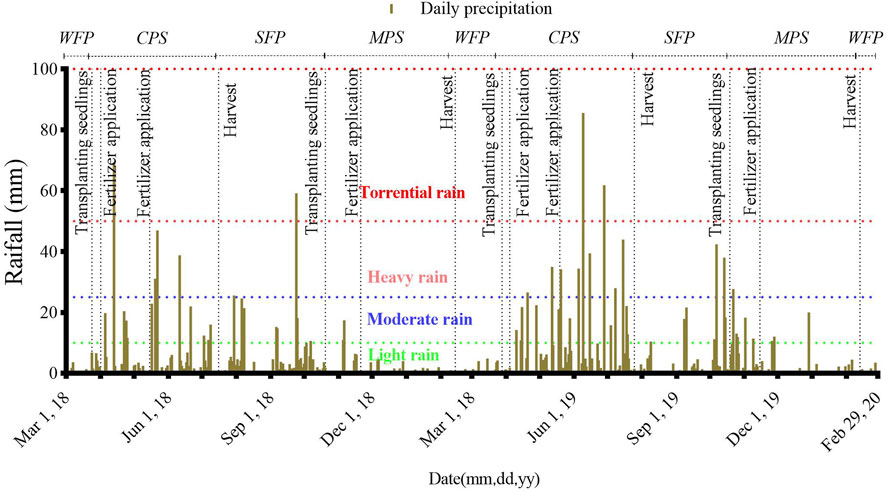
FIGURE 2. Temporal distribution of natural daily rainfall in the experimental plot during the testing period. WFP: winter fallow period; CPS: maize planting stage; SFP: summer fallow period; and MPS: mustard planting stage.
IBM SPSS Statistics 26 was the data analysis tool utilized in this study, and GraphPad Prism 8 was the mapping software used in this paper. Pearson correlation was used for the correlation analysis. The least significant difference (LSD) method at p = 0.05 was performed to elucidate any significant differences between different levels.
There were differences in the annual cumulative rainfall and each soil layer’s annual cumulative runoff loss between different rainfall patterns in the test period. Figure 3A shows that the annual cumulative rainfall amounts of TR, HR, MR, and LR were 137.9, 246.1, 338.9, and 286.3 mm, accounting for 13.7%, 24.4%, 33.6%, and 28.4% of the annual cumulative rainfall, respectively. However, the differences in annual cumulative rainfall amounts between different rainfall patterns were nonsignificant. Figure 3B suggests that, except for the annual loss of surface runoff, the annual cumulative subsurface runoff loss amount measured from each soil layer decreased with increasing soil depth. The annual surface runoff losses under TR, HR, MR, and LR were 19.4, 26.0, 22.3, and 2.5 mm, respectively. The corresponding rainfall-surface runoff rates were 14.1%, 10.6%, 6.6%, and 0.9%, respectively, indicating that the lower the rainfall grade was, the more difficult it was to produce surface runoff. The annual cumulative amounts of intercepted subsurface flow were 63.2 mm (TR), 144.4 mm (HR), 220.6 mm (MR), and 270.1 mm (LR), accounting for 45.8%, 58.7%, 65.1%, and 94.3% of the annual cumulative rainfall, respectively. The lower the rainfall grade was, the higher the proportion of the intercepted flow of supplying soil water to the total rainfall. The subsurface runoff loss amounts from the L1 layer under different rainfall patterns were 102.7 mm (TR), 166.7 mm (HR), 165.1 mm (MR), and 28.4 mm (LR), which meant that the intercepted amounts of the L1 layer were 25.0%, 37.0%, 68.7%, and 94.6% of the total intercepted amounts under different rainfall patterns, respectively. The subsurface flow flux decreased significantly with increasing soil depth. In contrast, the intercepted subsurface runoff decreased, which meant that the interception ability of the soil layer for permeated subsurface runoff weakened with increasing soil depth. The eventual annual loss amounts of subsurface runoff under various rainfall patterns were only 46.7% (TR), 34.4% (HR), 30.3% (MR), and 4.8% (LR) of the annual total amounts permeated into the soil and only 40.1% (TR), 30.8% (HR), 28.4% (MR), and 4.8% (LR) of the annual cumulative rainfall.
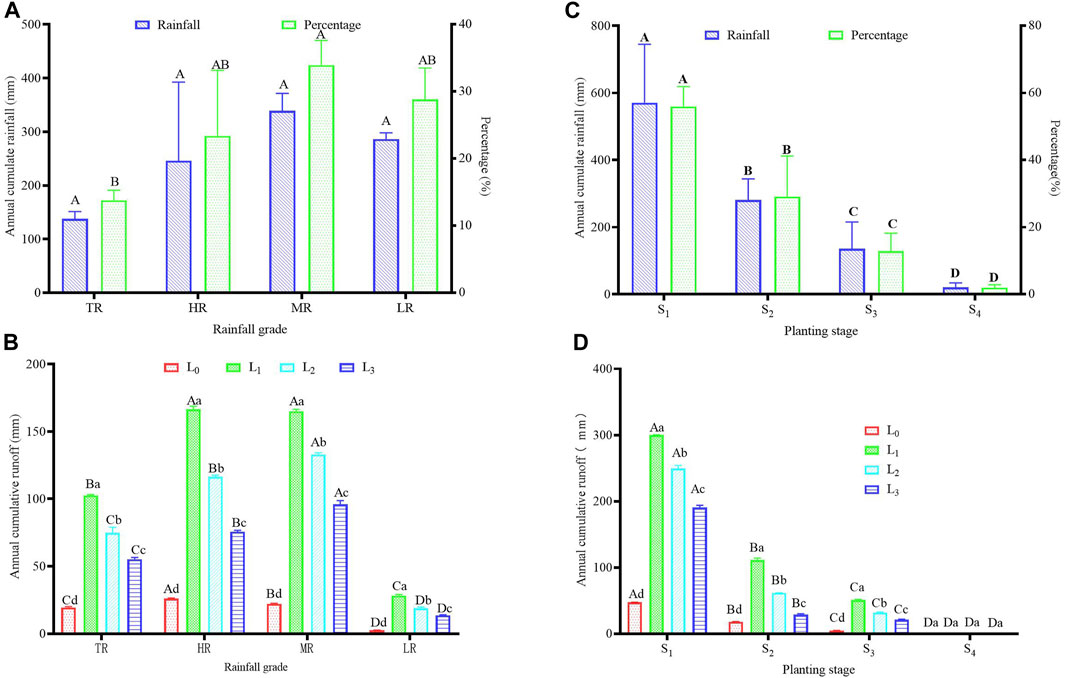
FIGURE 3. Annual cumulative rainfall (A) and runoff permeating loss from different soil layers (B) under different rainfall grade, and annual cumulative rainfall (C) and runoff permeating loss from different soil layers (D) under different planting stages. L1, L2, and L3 represent the soil layer of 0 cm–−20 cm, 20 cm–40 cm, and 40 cm–60 cm under the soil surface, respectively. Values of L0 represent the loss of surface runoff, and values of L1, L2, and L3 represent the loss of subsurface runoff. TR, HR, MR, and LR are the abbreviations of torrential rain, heavy rain, moderate rain, and light rain, respectively. S1, S2, S3, and S4 represent the maize, summer fallow, mustard, and winter fallow period, respectively. The capital letters represent the significant difference between different rainfall grades or planting stages at p = 0.05; the lowercase letters represent the significant difference between different soil layers at p = 0.05.
The distributions of the rainfall and runoff loss amounts of each planting stage were uneven during the whole test period. Figure 3C shows that 56.0% and 29.1% of the annual rainfall amounts were from the maize season (S1: 571.3 mm) and summer fallow period (S2: 281.5 mm), respectively; only 12.9% and 2.0% were from the mustard season (S3) and winter fallow period (S4), respectively. Figure 3D shows that 67.7% of the annual surface runoff loss amount and 79.1% of the annual subsurface loss amount occurred in the maize season; 25.9% of the annual surface runoff loss amount and 12.0% of the annual subsurface loss amount occurred in the summer fallow period. No surface or subsurface runoff loss phenomenon was found due to the slightly scattered rainfall in the winter fallow period. The annual surface runoff loss and each soil layer’s annual subsurface runoff loss amount decreased from S1 to S4 seasons. The annual subsurface runoff-permeated loss amount in each planting season significantly decreased with the increase in soil depth (p < 0.05).
The difference between the average migration loss intensities of P per rainfall-runoff event under different rainfall patterns was significant. As shown in Figure 4, each soil layer’s average P migration loss intensity per rainfall-runoff event increased remarkably with increasing rainfall grades. Notably, the average surface migration loss intensities of TP and PP measured under the TR pattern were exceptionally higher than those measured under other rainfall patterns. The average leached loss intensities of each form’s P decreased sharply from soil depths of 20 cm–40 cm under each rainfall pattern. The average leached loss intensities of TP and PP at the 40 cm depth were significantly lower than those at the 20 cm depth, indicating that the 20 cm–40 cm soil layer intercepted most of the leached TP and PP from the 0 cm–20 cm soil layer under all rainfall events. The rainfall patterns significantly affected the average migration loss intensities of TP and PP in the surface runoff. The change characteristics of the average migration loss intensities of TDP and PO43-–P per rainfall-runoff event under each rainfall pattern showed the same trends. In summary, the higher the rainfall intensity was, the greater the TP and PP migrating loads through runoff were.
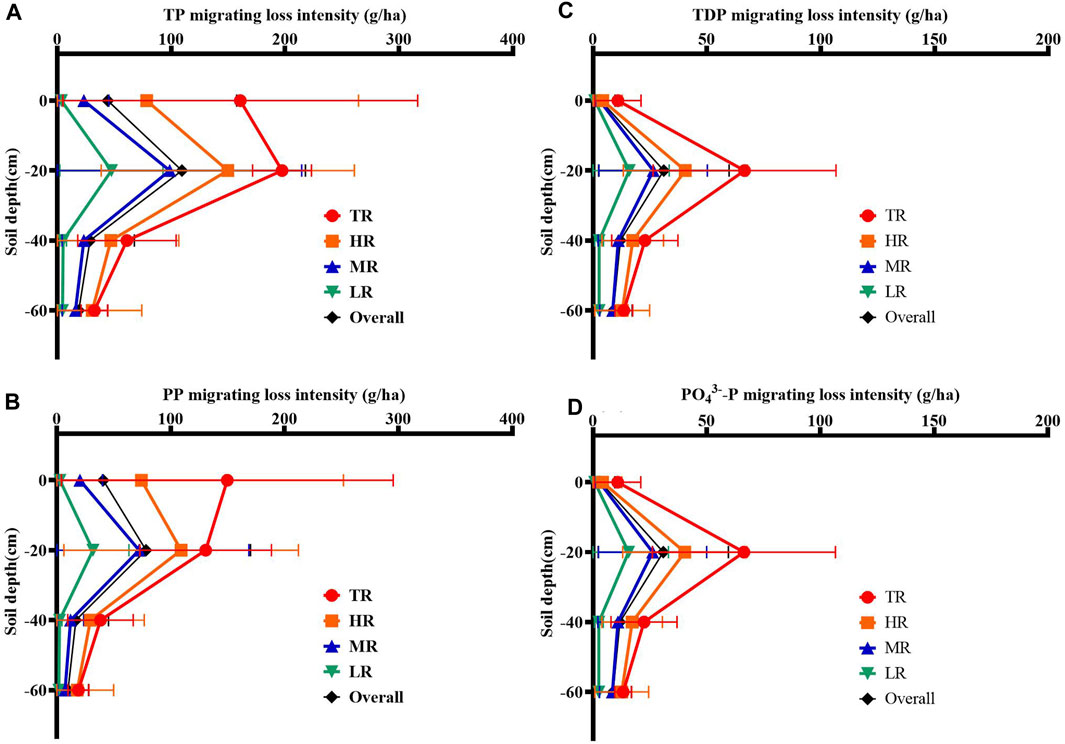
FIGURE 4. Change characteristics of P migration loss intensities with soil depth under the average single rainfall-runoff event of rainfall types. (A) TP migration intensity; (B) PP migration intensity; (C) TDP migration intensity; and (D) PO43-–P migration intensity. When the soil depth was 0 cm, the values represent the migration loss intensities through surface runoff. TR, HR, MR, and LR are the abbreviations of torrential rain, heavy rain, moderate rain, and light rain, respectively. S1, S2, S3, and S4 represent the maize, summer fallow, mustard, and winter fallow period, respectively.
Figure 5 shows that each form of P’s leached loss intensities from each soil layer presented positive linear relationships with rainfall. The leached loss intensities of each form of P from each soil layer increased significantly with rainfall. The regression coefficient between each soil layer’s leached loss intensities of various P and rainfall decreased with increasing soil depth, which meant that the effect of rain on each leached P loss intensity decreased with the increase in soil depth. Notably, the gaps of each form’s P leached loss intensities between the L1 layer and L2 layer were significantly higher than those between the L2 layer and L3 layer, indicating that the interception ability of the L2 layer was significantly higher than that of the L3 layer.
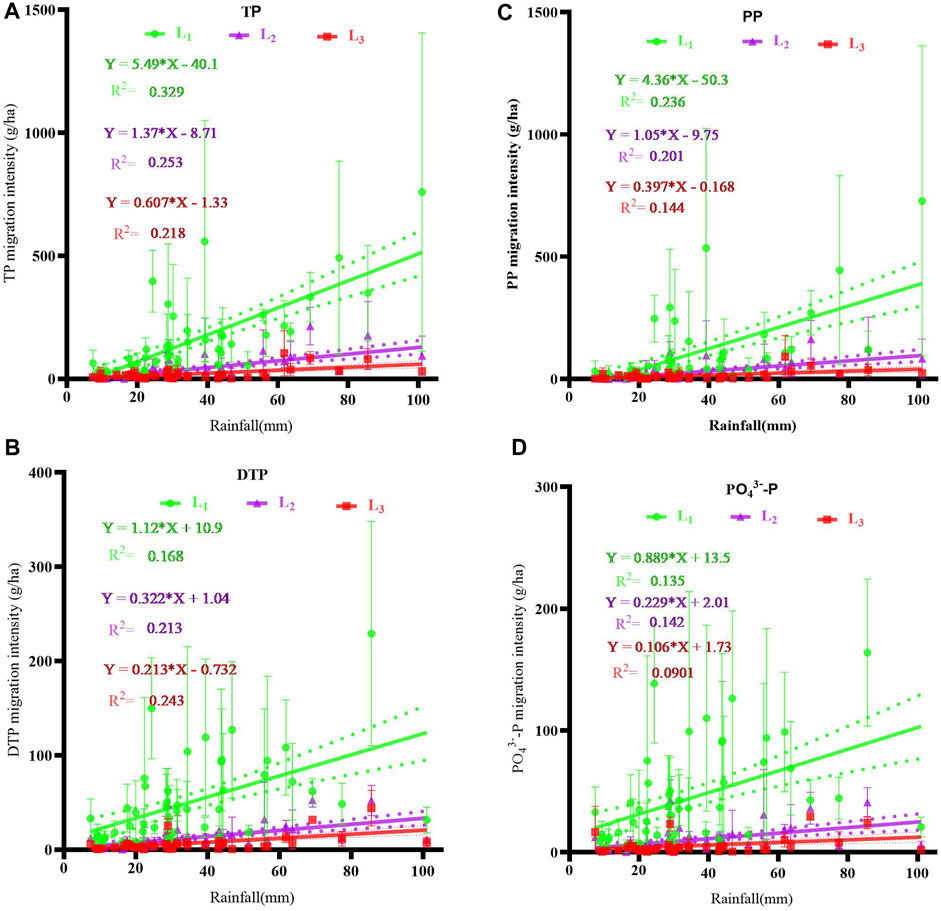
FIGURE 5. Correlation between migration intensities of each soil layer’s different P forms and rainfall. (A) TP, (B) TDP, (C) PP, and (D) PO43-–P. L1, L2, and L3 represent the soil layers of 0 cm–20 cm, 20 cm–40 cm, and 40 cm–60 cm under the cultivated land surface, respectively. Values of L1, L2, and L3 in this figure represent the loss intensities of P through subsurface runoff, respectively. TP, DTP, PP, and PO43-–P are the abbreviations of total phosphorus, total dissolved phosphorus, particulate phosphorus, and phosphate–phosphorus, respectively. The solid line is the best-fitting line for simple linear regression analysis, and the dotted line is the 95% confidence band.
As shown in Table 3, the average annual migration loss loads of each form’s P from different soil layers under different rainfall patterns were significantly different. The TR, HR, MR, and LR patterns caused 1041.09 g*ha−1*yr−1, 1884.35 g*ha−1*yr−1, 1551.64 g*ha−1*yr−1, and 153.99 g*ha−1*yr−1 of TP yearly migration loss from the L1 layer, 29.0% (302.27 mm), 25.2% (474.67 mm), 18.4% (285.11 mm), and 12.3% (18.95 mm) of which was lost through surface runoff, respectively. It was concluded that the higher the rainfall grade was, the higher the proportion of the annual surface loss to the L1 layer’s total annual migration loss was. Additionally, 71.9% of the TP’s annual surface loss occurred under the TR and HR patterns. The annual leached loss loads of TP from L1 and L2 under TR, HR, MR, and LR were 738.82 g*ha−1*yr−1, 1409.68 g*ha−1*yr−1, 1266.53 g*ha−1*yr−1, and 135.04 g*ha−1*yr−1 and 259.05 g*ha−1*yr−1, 295.52 g*ha−1*yr−1, 332.70 g*ha−1*yr−1, and 30.15 g*ha−1*yr−1, respectively, indicating that the L2 layer intercepted 64.9%, 79.0%, 73.7%, and 77.7% of the L1 layer’s leached TP. The annual leached loss loads of TP from the L3 layer under the TR, HR, MR, and LR grades were 163.96 g*ha−1*yr−1, 195.53 g*ha−1*yr−1, 165.07 g*ha−1*yr−1, and 17.36 g*ha−1*yr−1, respectively, indicating that the L3 layer intercepted 12.9%, 7.1%, 13.2%, and 9.5% of the L1 layer’s leached TP, respectively.
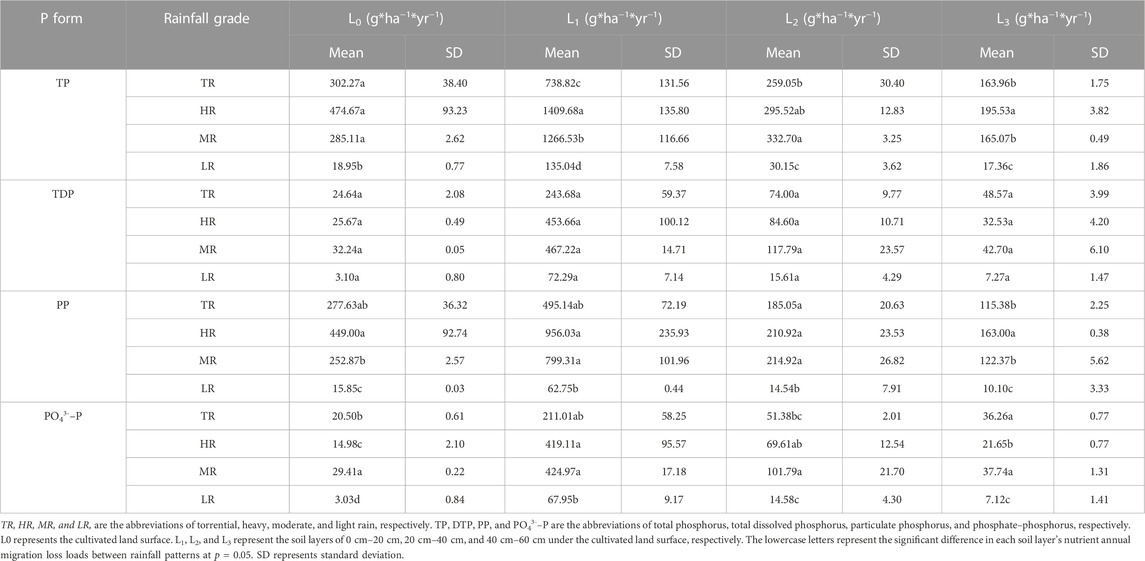
TABLE 3. Annual migration loss loads of different P forms from each soil layer under different rainfall patterns.
The annual surface migration loss loads of PP under different rainfall patterns were 91.8% (TR), 94.6% (HR), 88.7% (MR), and 83.6% (LR) of the surface migration loss loads of TP. The annual leached loss loads of PP underground under different rainfall patterns were 70.4% (TR), 83.4% (HR), 74.1% (MR), and 58.2% (LR) of the annual leached loss loads of TP underground. According to one-way ANOVA, except for TDP, the annual migration loss loads of each form’s P under different rainfall grades showed significant differences. The annual surface migration loss loads of each form’s P and the annual leached loss loads of each form’s P at each soil layer under the TR, HR, and MR grades were significantly higher than those under LR. Notably, TR and HR were the major rainfall patterns that caused P surface migration losses; however, HR and MR were the primary rainfall grades that induced underground leached P losses.
The annual migration loss loads of different P forms from the same soil layer in different planting stages were significantly different. The annual migration loss loads of each form’s P in different planting stages mostly occurred in the S1 and S2 stages. There was no observed migration loss of each form’s P from every soil layer in the S4 stage. Table 4 shows that the annual migration loss loads of surface TP in different planting stages were 850.03 g*ha−1*yr−1 (S1), 193.39 g*ha−1*yr−1 (S2), 37.58 g*ha−1*yr−1 (S3), and 0.00 g*ha−1*yr−1 (S4), accounting for 78.6%, 17.9%, 3.5%, and 0.0% of the annual total surface migration loss load of TP, respectively. There was no observed migration loss of each form’s P from every soil layer in the S4 stage. The annual leached loss loads of TP from different soil layers were 3550.07 g*ha−1*yr−1 (L1), 917.43 g*ha−1*yr−1 (L2), and 541.91 g*ha−1*yr−1 (L3). The sequence of contribution rates of each soil layer’s TP leached loss loads in different planting stages to the corresponding soil layer’s annual total leached loss loads were 60.7% (S1), 31.9% (S2), 7.4% (S3), and 0.0% (S4) at the L1 layer, 62.8% (S1), 30.1% (S2), 7.1% (S3), and 0.0% (S4) at the L2 layer, and 73.0% (S1), 14.7% (S2), 12.3% (S3), and 0.0% (S4) at the L3 layer. Except for the S4 stage, the percentage of PP surface loss loads to the TP surface loss load in each planting stage gradually decreased from 93.0% (S1) to 83.3% (S3), while the percentages of the leached PP loss load to the leached TP loss load in each planting stage were 75.0% (S1), 79.4% (S2), and 76.0% (S3). The percentages of the leached PO43--P loss load to the leached TP loss load in each planting stage gradually increased from 5.4% (S1) to 14.7% (S3).
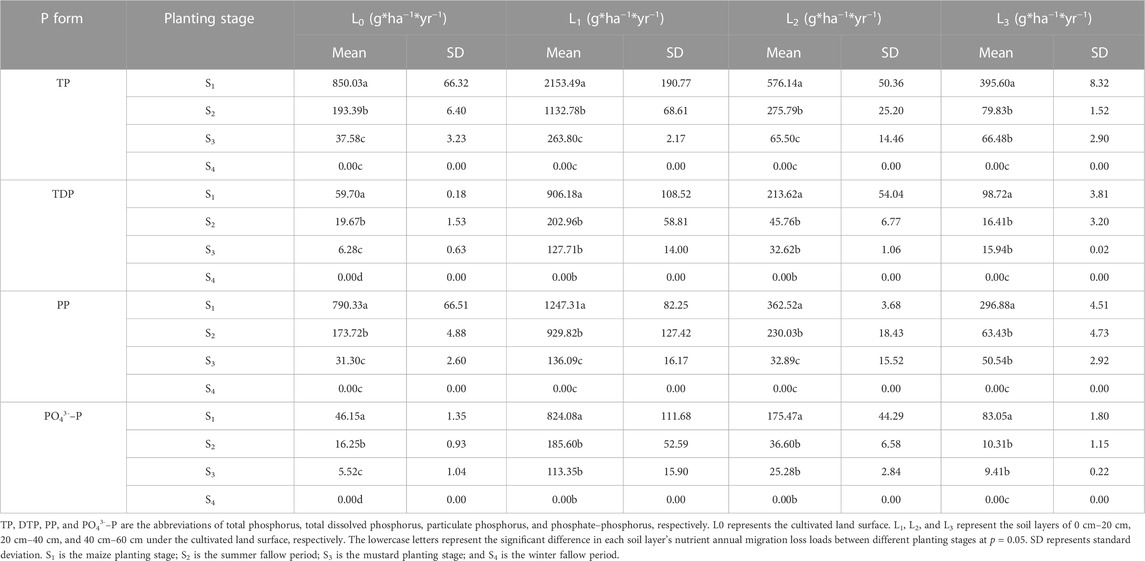
TABLE 4. Annual migration loss loads of different P forms from each soil layer under different planting stages.
Figure 6 shows that soil layers significantly differed in each form of P’s annual migration loss loads. The annual surface loss loads of different forms of P were 1.08 kg*ha−1*yr−1 (TP), 0.99 kg*ha−1*yr−1 (PP), 0.09 kg*ha−1*yr−1 (TDP), and 0.07 kg*ha−1*yr−1 (PO43-–P). The eventual annual leached loss load of each form’s P was 0.54 kg*ha−1*yr−1 (TP), 0.41 kg*ha−1*yr−1 (PP), 0.13 kg*ha−1*yr−1 (TDP), and 0.10 kg*ha−1*yr−1 (PO43-–P), accounting for 50.1%, 41.3%, 152.3%, and 151.5% of their annual total surface migration loss loads, respectively. TP’s annual leached loss load from the L1 layer was up to 3.55 kg*ha−1*yr−1, among which 65.2% was PP. TP’s annual leached loss loads from the L2 and L3 layers were 0.92 kg*ha−1*yr−1 and 0.54 kg*ha−1*yr−1, among which 68.2% and 75.8% were PP, respectively. The surface loss loads of PP and PO43-–P accounted for 92.0% and 6.3% of the annual total surface TP loss load, respectively, while the underground eventual leached loss loads were 75.8% and 19.0% of the annual total underground leached loss load of TP, respectively. According to one-way ANOVA and the LSD test, the annual leached loss loads of TP and PP weakened significantly with the increase in soil depth (p < 0.05).
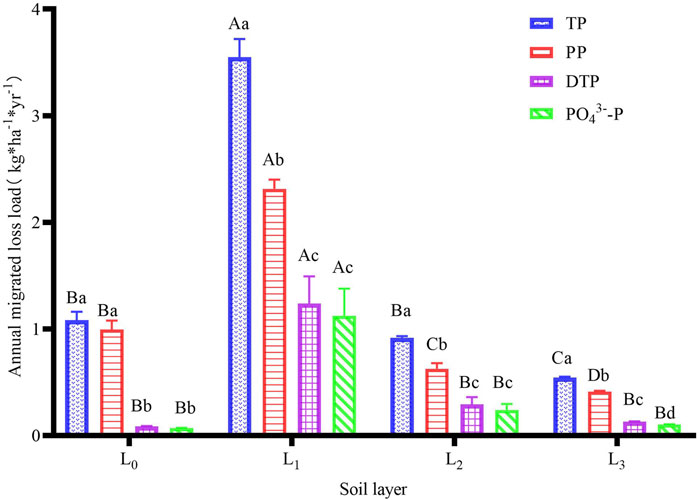
FIGURE 6. Annual migration loads of different P forms of each soil layer during the test period. TP, DTP, PP, and PO43-–P are the abbreviations of total phosphorus, total dissolved phosphorus, particulate phosphorus, and phosphate–phosphorus, respectively. The capital letters represent the significant difference between different soil layers at p = 0.05; the lowercase letters represent the significant difference between different P forms in the same soil layer at p = 0.05.
Surface and underground leaching losses were the two major routes by which P was lost on the studied purple soil sloping cropland under natural rainfall conditions. Most studies have reported that soil P losses are mainly caused by surface sediment transport (McDowell et al., 2016; Deng et al., 2020; Pisani et al., 2020). However, in this study, it was found that the cultivated soil layer’s annual leaching P loss load was approximately three times the annual surface P loss load. P’s eventual annual leaching loss load from the bottom of the parent material layer was only half of the annual surface loss loads. In this study, P loss mainly consisted of PP losses through surface runoff; this result was consistent with the research results of McDowell et al. (2016). In this study, the proportion of surface PP loss load to the total surface P loss loads was 92.0%, similar to the proportion of 85%–94.1% obtained by Xie et al. (2014).
The bottom soil layers (L2 and L3) intercepted 84.7% of the underground lost P leached from the cultivated soil layer to enrich the subsoil P pool, similar to the result of more than 80% obtained by Gachter et al. (2004). This was mainly because the surface soil is rich in pores and cracks due to plant roots, soil microbial activity, and human activities. Under rainfall-runoff events, P leaches downward with water flow in pores or cracks (Kleinman et al., 2005) to transport topsoil P, especially PP, to the subsoil layers (Makowski et al., 2020). However, under gravity and leaching, after subsiding, the soil structure of the bottom layer is dense and has few soil pores (Gachter et al., 2004; Peng et al., 2014). The bottom layer might hinder the migration process of sediment particles with adsorbed P. Wang et al. (2021a) found that the proportion of sediment particles 0.002 mm in size decreased significantly with an increase in the soil layer, which indirectly proved that the subsoil layers might affect the soil PP migration process. Gachter et al. (2004) found that the P content in the subsoil increased by 1.2–2.5 times after 15 years of fertilization and cultivation, further confirming that the subsoil layers had an interception and enrichment effect on the leaching of P from the soil. This result was also consistent with the research results obtained by Makowski et al. (2020), who reported that the underlying soil could intercept most sediment and particle nutrients lost from the cultivated soil layer. In this study, the soil TP of L1, L2, and L3 improved by 2.57%, 5.61%, and 1.65%, respectively, after two consecutive years of monitoring in soil TP (Figure 7), which could prove the agricultural P migration rule in different soil layers. Moreover, Wang et al. (2022) concluded that annual P application led to greater accumulation of soil P in the topsoil layers in Northeast China. Therefore, P fertilizer should be applied to avoid P accumulation in the topsoil to limit P losses in surface runoff and leaching through the soil profile.
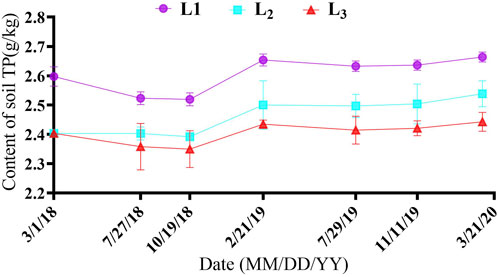
FIGURE 7. Change of each soil layer’s TP content during the test period. L1, L2, and L3 represent the soil layers of 0 cm–20 cm, 20 cm–40 cm, and 40 cm–60 cm under the cultivated land surface, respectively.
The large amount of applied fertilizer and the overlap with the rainstorm season cause the maize season to be the main period of P loss. In this study, it was found that soil P surface loss and underground leaching loss presented significant positive linear correlations with rainfall (p < 0.05), similar to the results obtained by McDowell et al. (2001). Heavy-rainfall events mostly occurred in the maize season and summer fallow period. In contrast, moderate and light rain was dominant, under which it was difficult to produce runoff in the mustard season. Simultaneous fertilization and preferential flow channels are the major reasons for the sharp observed increases in P losses (Gachter et al., 1998; Stamm et al., 1998; Geohring et al., 2001; Barton et al., 2005). Therefore, the annual P loss load and proportion of PP were higher in the maize season and lower in the mustard season. Torrential and heavy rain events dominated the annual surface P loss, but heavy rain and moderate rain events controlled the annual underground P leaching load. The rainfall intensity and amount mostly controlled the surface P loss. The higher the rainfall intensity was, the greater the splash erosion degree, the faster the surface runoff yield, and the more PP loss occurred. However, soil P leaching was affected by the rainfall intensity and rainwater infiltration discharge. Heavy- and moderate-rain events could produce a certain amount of splashing sediment particles and ensure stable runoff production to ensure leached nutrient transport and carrying processes. This result was consistent with the work of Pu et al. (2014) and Zhang et al. (2016), who reported that higher rainfall could easily lead to increased loss of N and P in surface runoff. In conclusion, the prevention and control of P loss in purple soil sloping cultivated land should focus on preventing and controlling P loss in the cultivated soil layer during the maize and summer fallow seasons.
Remarkably, in this study, the soil layered filling and the installation of runoff troughs would damage the soil structure from top to bottom and increase the soil hydraulic conductivity, which might cause the soil phosphorus migration to be higher than the actual situation. Therefore, due to the aforementioned limitations of experimental conditions, the results of this experiment could not fully represent the soil P migration process in the natural sloping cropland of purple soil, but it could partially represent the soil P migration in the newly cultivated sloping farmland of purple soil in Chongqing.
The cultivated soil layer was the source of P loss on the purple soil sloping cropland. PP was the primary form of surface and subsurface P losses. Surface loss and underground leaching loss were two major loss pathways of P in the studied cultivated soil layer of purple soil sloping land under natural rainfall conditions. P’s annual leaching loss from the cultivated soil layer was three times its surface loss. The bottom soil layers intercepted most of the P leached from the cultivated soil layer. Remarkably, 74.2% and 10.5% of the annual leached P were retained by the plow pan soil layer and parent material layer, respectively, to increase in situ soil P stocks. Only 15.3% of the annual leached P from the cultivated soil layer, almost half the annual surface P loss load, was eventually lost underground, and 43.9% of the annual surface P loss load was from the heavy-rain events on the purple soil sloping cropland during the test period. In comparison, 36.1%, 30.5%, and 30.3% of the annual leached loss underground were from heavy-, moderate-, and torrential-rain events, respectively. The maize season was the primary period of soil P surface and subsurface loss in hilly areas. Therefore, it is important to strengthen the prevention and control of P migration losses in the maize season for surface losses and underground leached P losses. Furthermore, due to the limitations of experimental conditions, the results of this experiment could not fully represent the soil P migration process in the natural sloping cropland of purple soil, but it could partially represent the soil P migration in the newly cultivated sloping farmland of purple soil in Chongqing.
The raw data supporting the conclusion of this article will be made available by the authors, without undue reservation.
Conceptualization and methodology: YW and JN; writing–original draft preparation: YW; writing–review and editing: FC and HZ; and project administration and funding acquisition: JN, DX, and DL. All authors contributed to the article and approved the submitted version.
This work was supported by the National Key Research and Development Program of China (grant number 2018FYD0200701), the National Natural Science Foundation of China (grant number 41371275), the Special Social Livelihood Key R & D Project of Chongqing (grant number cstc2018jscx-mszdx0008), the Incentive Performance Guidance Special Project of Chongqing (grant number cstc2022jxjl0025), and the special project of Chongqing Municipal research finance (grant number cqaas2022jxjl001).
The authors declare that the research was conducted in the absence of any commercial or financial relationships that could be construed as a potential conflict of interest.
All claims expressed in this article are solely those of the authors and do not necessarily represent those of their affiliated organizations, or those of the publisher, the editors, and the reviewers. Any product that may be evaluated in this article, or claim that may be made by its manufacturer, is not guaranteed or endorsed by the publisher.
Bah, H. D., Zhou, M. H., Ren, X., Hu, L., Dong, Z. X., and Zhu, B. (2020). Effects of organic amendment applications on nitrogen and phosphorus losses from sloping cropland in the upper Yangtze River. Agr. Ecosyst. Environ. 302, 107086. doi:10.1016/j.agee.2020.107086
Barton, L., Schipper, L. A., Barkle, G. F., McLeod, M., Speir, T. W., Taylor, M. D., et al. (2005). Land application of domestic effluent onto four soil types: Plant uptake and nutrient leaching. J. Environ. Qual. 34 (2), 635–643. doi:10.2134/jeq2005.0635
Bechmann, M., Greipsland, I., and Ogaard, A. F. (2019). Implementation of mitigation measures to reduce phosphorus losses: The vestre vansjo pilot catchment. Agriculture-Basel 9 (1), 15–19. doi:10.3390/agriculture9010015
Cameron, K. C., Di, H. J., and Moir, J. L. (2013). Nitrogen losses from the soil/plant system: A review. Ann. Appl. Biol. 162 (2), 145–173. doi:10.1111/aab.12014
Chen, A., and Arai, Y. (2020). Current uncertainties in assessing the colloidal phosphorus loss from soil. Adv. Agron. 163, 117–151. doi:10.1016/bs.agron.2020.05.002
Cheng, Y. T., Li, P., Xu, G. C., Wang, X. K., Li, Z. B., Cheng, S. D., et al. (2021). Effects of dynamic factors of erosion on soil nitrogen and phosphorus loss under freeze-thaw conditions. Geoderma 390, 114972. doi:10.1016/j.geoderma.2021.114972
Deng, L. Z., Fei, K., Sun, T. Y., Zhang, L. P., Fan, X. J., Wu, Y. H., et al. (2020). Characteristics of phosphorus loss from the weathered granite slopes of Southeast China. Pol. J. Environ. Stud. 29 (3), 2139–2150. doi:10.15244/pjoes/111136
Fischer, P., Pothig, R., Gucker, B., and Venohr, M. (2018). Phosphorus saturation and superficial fertilizer application as key parameters to assess the risk of diffuse phosphorus losses from agricultural soils in Brazil. Sci. Total Environ. 630, 1515–1527. doi:10.1016/j.scitotenv.2018.02.070
Gachter, R., Ngatiah, J. M., and Stamm, C. (1998). Transport of phosphate from soil to surface waters by preferential flow. Environ. Sci. Technol. 32 (13), 1865–1869. doi:10.1021/es9707825
Gachter, R., Steingruber, S. M., Reinhardt, M., and Wehrli, B. (2004). Nutrient transfer from soil to surface waters: Differences between nitrate and phosphate. Aquat. Sci. 66 (1), 117–122. doi:10.1007/s00027-003-0661-x
Geohring, L. D., McHugh, O. V., Walter, M. T., Steenhuis, T. S., Akhtar, M. S., and Walter, M. F. (2001). Phosphorus transport into subsurface drains by macropores after manure applications: Implications for best manure management practices. Soil Sci. 166 (12), 896–909. doi:10.1097/00010694-200112000-00004
Hanrahan, B. R., King, K. W., Duncan, E. W., and Shedekar, V. S. (2021). Cover crops differentially influenced nitrogen and phosphorus loss in tile drainage and surface runoff from agricultural fields in Ohio, USA. J. Environ. Manage 293, 112910. doi:10.1016/j.jenvman.2021.112910
He, S., Li, F. Y., Liu, Z. W., Wang, Z. R., Wu, S. S., Zhang, T. Y., et al. (2019). Retarding effect of migration of colloidal phosphorus in three types of soil (in Chinese with English abstract). J. Zhejiang Univ. (Agric. Life Sci.) 45 (2), 205–210. doi:10.3785/j.issn.1008-9209.2018.03.262
Hua, K. K., and Zhu, B. (2020). Phosphorus loss through surface runoff and leaching in response to the long-term application of different organic amendments on sloping croplands. J. Soil Sediment. 20 (9), 3459–3471. doi:10.1007/s11368-020-02675-3
Huang, R., Gao, X. S., Wang, F. H., Xu, G. X., Long, Y., Wang, C. Q., et al. (2020). Effects of biochar incorporation and fertilizations on nitrogen and phosphorus losses through surface and subsurface flows in a sloping farmland of Entisol. Agri Ecosyst. Environ. 300, 106988. doi:10.1016/j.agee.2020.106988
Jahanzad, E., Saporito, L. S., Karsten, H. D., and Kleinman, P. J. A. (2019). Varying influence of dairy manure injection on phosphorus loss in runoff over four years. J. Environ. Qual. 48 (2), 450–458. doi:10.2134/jeq2018.05.0206
Kleinman, P. J. A., Srinivasan, M. S., Skarpley, A. N., and Gburek, W. J. (2005). Phosphorus leaching through intact soil columns before and after poultry manure application. Soil Sci. 170 (3), 153–166. doi:10.1097/00010694-200503000-00001
Li, Z. G., Gu, C. M., Zhang, R. H., Ibrahim, M., Zhang, G. S., Wang, L., et al. (2017). The benefic effect induced by biochar on soil erosion and nutrient loss of slopping land under natural rainfall conditions in central China. Agr. Water Manage 185, 145–150. doi:10.1016/j.agwat.2017.02.018
Linderholm, K., Mattsson, J. E., and Tillman, A. M. (2012). Phosphorus flows to and from Swedish agriculture and food chain. Ambio 41 (8), 883–893. doi:10.1007/s13280-012-0294-1
Liu, Y., Tao, Y., Wan, K. Y., Zhang, G. S., Liu, D. B., Xiong, G. Y., et al. (2012). Runoff and nutrient losses in citrus orchards on sloping land subjected to different surface mulching practices in the Danjiangkou Reservoir area of China. Agr. Water Manage 110, 34–40. doi:10.1016/j.agwat.2012.03.011
Luo, C., Gao, Y., Zhu, B., and Wang, T. (2013). Sprinkler-based rainfall simulation experiments to assess nitrogen and phosphorus losses from a hillslope cropland of purple soil in China. Sustain Wat Quali Ecol 1-2, 40–47. doi:10.1016/j.swaqe.2014.03.001
Makowski, V., Julich, S., Feger, K-H., and Julich, D. (2020). Soil phosphorus translocation via preferential flow pathways: A comparison of two sites with different phosphorus stocks. Front Glob Chang 3, 48. doi:10.3389/ffgc.2020.00048
McDowell, R., Sharpley, A., Brookes, P., and Poulton, P. (2001). Relationship between soil test phosphorus and phosphorus release to solution. Soil Sci. 166 (2), 137–149. doi:10.1097/00010694-200102000-00007
McDowell, R. W., Norris, M., and Cox, N. (2016). Using the provenance of sediment and bioavailable phosphorus to help mitigate water quality impact in an agricultural catchment. J. Environ. Qual. 45 (4), 1276–1285. doi:10.2134/jeq2015.10.0536
Ministry of Environmental Protection,, , and Mep, P. R. C. (2020). Ecological and environmental monitoring of the yangtze three Gorges project bulletin 2018 2020-12-16. Beijing: Ministry of Ecology and Environment of People’s Republic of China. Available at: http://english.mee.gov.cn/Resources/Reports/.
Peng, X., Zhu, Q. H., Xie, Z. B., Darboux, F., and Holden, N. M. (2016). The impact of manure, straw and biochar amendments on aggregation and erosion in a hillslope Ultisol. Catena 138, 30–37. doi:10.1016/j.catena.2015.11.008
Peng, X. D., Shi, D. M., Jiang, D., Wang, S. S., and Li, Y. X. (2014). Runoff erosion process on different underlying surfaces from disturbed soils in the Three Gorges Reservoir Area, China. Catena 123, 215–224. doi:10.1016/j.catena.2014.08.012
Pisani, O., Liebert, D., Bosch, D. D., Coffin, A. W., Endale, D. M., Potter, T. L., et al. (2020). Element losses from fields in conventional and conservation tillage in the Atlantic Coastal Plain, Georgia, United States. J. Soil Water Conserv. 75 (3), 376–386. doi:10.2489/jswc.75.3.376
Plach, J. M., Macrae, M. L., Ali, G. A., Brunke, R. R., English, M. C., Ferguson, G., et al. (2018). Supply and transport limitations on phosphorus losses from agricultural fields in the lower great lakes region, Canada. J. Environ. Qual. 47 (1), 96–105. doi:10.2134/jeq2017.06.0234
Pu, Y. L., Xie, D. T., Lin, C. W., Ni, J. P., and Wei, C. F. (2014). Effect of hedgerow patterns controlling nitrogen loss of slope farmland in purple soil area (in Chinese with English abstract). Trans. Chin. Soc. Agric. Eng. 30 (23), 138–147. doi:10.3969/j.issn.1002-6819.2014.23.018
Stamm, C., Fluhler, H., Gachter, R., Leuenberger, J., and Wunderli, H. (1998). Preferential transport of phosphorus in drained grassland soils. J. Environ. Qual. 27 (3), 515–522. doi:10.2134/jeq1998.00472425002700030006x
Wang, M., Pendall, E., Fang, C. M., Li, B., and Nie, M. (2018). A global perspective on agroecosystem nitrogen cycles after returning crop residue. Agr. Ecosyst. Environ. 266, 49–54. doi:10.1016/j.agee.2018.07.019
Wang, Y., Ni, C. S., Wang, S., Xie, D., and Ni, J. P. (2021a). A reliable U-trough runoff collection method for quantifying the migration loads of nutrients at different soil layers under natural rainfall. Sustainability 13 (4), 2050. doi:10.3390/su13042050
Wang, Y., Ni, J. P., Ni, C. S., Wang, S., and Xie, D. T. (2021b). Effect of natural rainfall on the migration characteristics of runoff and sediment on purple soil sloping cropland during different planting stages. J. Water Clim. Change 12 (7), 3064–3081. doi:10.2166/wcc.2021.333
Wang, Y. (2021). “Research on N and P loss load and nutrient balance under farming-mulberry system on purple soil sloping cropland of Three Gorge Reservoir Area,”. Thesis: Ph. D. in Chinese with English abstract (Chongqing, China: Southwest University).
Wang, Y. Z., Peng, X. Y., Whalen, J. K., Shi, Y., Lu, C. Y., Huang, B., et al. (2022). Can periodic phosphorus fertilizer applications reduce the risk of P loss. Nutr. Cycl. Agroecosys 124, 135–151. doi:10.1007/s10705-021-10184-z
Weihrauch, C., and Weber, C. J. (2021). Comparative risk assessment of phosphorus loss from "deep phosphorus stocks" in floodplain subsoils to surface waters. Sci. Total Environ. 796, 149037. doi:10.1016/j.scitotenv.2021.149037
Xie, D. T., Ni, J. P., Ding, E. J., and al, e. (2014). Study on control technology of agricultural non-point source pollution in Three Gorges reservoir area (in Chinese). Beijing: Science Press. ISBN: 978-7-03-042100-5.
Yang, J. H., Wang, C. L., and Dai, H. L. (2008). Soil agrochemical analysis and environmental monitoring. Beijing: China Land Press. In Chinese.
Zhang, T., Ni, J. P., and Xie, D. T. (2015). Severe situation of rural non-point source pollution and efficient utilization of agricultural wastes in the Three Gorges Reservoir Area. Environ. Sci. Pollut. R. 22 (21), 16453–16462. doi:10.1007/s11356-015-5429-z
Zhang, Y., Fan, F. L., Zhou, C., Ni, J. P., and Xie, D. T. (2016). Effects of crop/mulberry intercropping on surface nitrogen and phosphorus losses in Three Gorges Reservoir Area (in Chinese with English abstract). Acta Pedol. Sin. 53 (1), 189–201. doi:10.11766/trxb201507160248
Zhang, Y., Xie, D. T., Ni, J. P., and Zeng, X. B. (2019). Optimizing phosphate fertilizer application to reduce nutrient loss in a mustard (Brassica juncea var. tumida)-maize (Zea mays L) rotation system in Three Gorges Reservoir area. Soil Till Res. 190, 78–85. doi:10.1016/j.still.2019.03.001
Zhang, Z. Y., Kong, L. L., Zhu, L., and Mwiya, R. M. (2013). Effect of drainage ditch layout on nitrogen loss by runoff from an agricultural watershed. Pedosphere 23 (2), 256–264. doi:10.1016/s1002-0160(13)60014-4
Zhu, B., Wang, Z. H., Wang, T., and Dong, Z. X. (2012). Non-Point-source nitrogen and phosphorus loadings from a small watershed in the three Gorges Reservoir area. J. Mt. Sci-Engl. 9 (1), 10–15. doi:10.1007/s11629-012-2196-x
Keywords: phosphorus migration loss, maize-mustard rotation, purple soil, sloping cropland, soil layers
Citation: Wang Y, Chen F, Zhao H, Xie D, Ni J and Liao D (2023) Characteristics of agricultural phosphorus migration in different soil layers on purple soil sloping cropland under natural rainfall conditions. Front. Environ. Sci. 11:1230565. doi: 10.3389/fenvs.2023.1230565
Received: 06 June 2023; Accepted: 24 July 2023;
Published: 04 August 2023.
Edited by:
Marco Contin, University of Udine, ItalyReviewed by:
Yefang Jiang, Agriculture and Agri-Food Canada (AAFC), CanadaCopyright © 2023 Wang, Chen, Zhao, Xie, Ni and Liao. This is an open-access article distributed under the terms of the Creative Commons Attribution License (CC BY). The use, distribution or reproduction in other forums is permitted, provided the original author(s) and the copyright owner(s) are credited and that the original publication in this journal is cited, in accordance with accepted academic practice. No use, distribution or reproduction is permitted which does not comply with these terms.
*Correspondence: Yi Wang, Y3Jld2V2b25AZW1haWwuc3d1LmVkdS5jbg==; Jiupai Ni, bmlqaXVwYWlAc3d1LmVkdS5jbg==
Disclaimer: All claims expressed in this article are solely those of the authors and do not necessarily represent those of their affiliated organizations, or those of the publisher, the editors and the reviewers. Any product that may be evaluated in this article or claim that may be made by its manufacturer is not guaranteed or endorsed by the publisher.
Research integrity at Frontiers
Learn more about the work of our research integrity team to safeguard the quality of each article we publish.