
94% of researchers rate our articles as excellent or good
Learn more about the work of our research integrity team to safeguard the quality of each article we publish.
Find out more
ORIGINAL RESEARCH article
Front. Environ. Sci., 08 September 2023
Sec. Atmosphere and Climate
Volume 11 - 2023 | https://doi.org/10.3389/fenvs.2023.1228817
This article is part of the Research TopicClimate-Environment Interactions under Global WarmingView all 25 articles
 Waheed Ullah1,2
 Aisha Karim2,3
 Sami Ullah3
 Atta-Ur Rehman3
 Tehmina Bibi4
 Guojie Wang2*
 Safi Ullah5,6
 Asher Samuel Bhatti7Gohar Ali8
 Adnan Abbas2
 Daniel Fiffi Tawia Hagan2
 Isaac Kwesi Nooni9Chenxia Zhu2
 Azfar Hussain10
This study assessed spatiotemporal trends in daily monsoon precipitation extremes at seasonal and sub-seasonal scales (June, July, August, and September) and their links with atmospheric circulations over Pakistan. The study used observed precipitation data from fifty in-situ stations and reanalysis products from the European Centre for Medium-Range Weather Forecasts (ECMWF) and National Centers for Environmental Prediction/the National Center for Atmospheric Research (NCEP/NCAR) during 1981–2018. A suite of seven extreme precipitation indices and non-parametric statistical techniques were used to infer trends in the frequency and intensity of extreme precipitation indices. An increase in frequency and intensity of overall extreme indices was evident, with a maximum tendency in the country’s northwestern (z-score=>2.5), central, and eastern (z-score > 4) monsoon-dominant parts. The northern and southwestern parts of the country exhibited a slight decrease (z-score <–2) in frequency and intensity. The Sen’s Slope estimator (SSE) shows an increase in western parts (0.20 days) indicating a shift in the maxima of the monsoon precipitation. The regional precipitation shows an increase in wet days (R1 mm) with higher values of mMK (3.71) and SSE (0.3) in region 2 Similar results of moderate regional increase are evident for extreme indices except regions 1 and 3. The extreme 1-day maximum precipitation increased in region 3 (mMK: 1.39, SSE: 2.32). The extremely wet days (R99p TOT) precipitation has a moderate increase in all regions with a decrease in region 1. The temporal mutations showed dynamic changes, clearly reflecting the country’s historical extreme events. The frequency and intensity of precipitation extremes negatively correlated with the altitude (R = −0.00039). The probability density function (PDF) showed a significant increase in the density during June and September with a probabilistic positive shift during July and August. The intensified mid-latitude westerlies and subtropical zonal easterlies teleconnections, strengthening of the monsoon trough, and land-ocean thermal contrast are the potential drivers of the increasing trend in precipitation extremes. The current study could serve as a benchmark for future researchers and policymakers to devise effective mitigation strategies for sustainable development.
Anomalous precipitation patterns at intra-seasonal and inter-annual scale result in hydrometeorological hazards, such as floods and droughts (Ullah et al., 2021b; Lu et al., 2021; Yu et al., 2023; Zhang et al., 2023). Likewise, the Sixth Assessment Report of the Intergovernmental Panel on Climate Change (IPCC-AR6) stated that anthropogenic global warming increased the frequency and intensity of precipitation extremes globally (IPCC, 2022). These extremes threaten human life, agriculture, water resources, biodiversity, and sustainable development (Khan et al., 2020; Ullah et al., 2022a). South Asian (SA) countries, including Pakistan, are at peak risk due to water and energy cycle changes (Eckstein and Kreft, 2020; Hussain M. et al., 2023). Therefore, assessing the nature and magnitude of changes in extreme and mean precipitation over SA countries has been the subject of several studies in recent years (Raghavan et al., 2012; Turner and Annamalai, 2012; Dahri et al., 2016; Naveendrakumar et al., 2019; Almazroui et al., 2020; Syed et al., 2022; Abbas et al., 2023b).
In Pakistan, two dominant precipitation patterns are primarily attributed to westerlies during the winter season (from December to the end of March) and summer monsoon season (from the end of June till September) (Hanif et al., 2013; Ullah et al., 2018a; Abbas et al., 2023b). The SA monsoon dominates Pakistan’s climate; about 65% of the total annual precipitation is received during the monsoon season (June to September) (Waqas and Athar, 2019; Ullah et al., 2021b; Abbas et al., 2022). The drought period of the late 1990s and the historic flooding event of 2010 and 2022, as examples, resulted in losses with severe impacts on crop production, gross domestic product (GDP), livelihoods, and water resources (Rahman and Khan, 2011; Xie et al., 2016; Ullah et al., 2019a; Rahman Z. U. et al., 2023). The increase in precipitation in the historical and future projections is obvious (Ahmad et al., 2018; Bhatti et al., 2020; Abbas et al., 2023a; Rebi et al., 2023), yet deviation of monsoon precipitation on a sub-seasonal scale has significant impacts on food security and socioeconomic conditions.
Changes in the regional hydrometeorological cycle of Pakistan have been extensively studied, reporting an overall increase and westward shift in the mean (Hanif et al., 2013; Latif and Syed, 2016; Ullah et al., 2018a; Preethi et al., 2019; Ali S. et al., 2020). These changes affected the country’s aridity, cropping patterns, eco-environmental, and socioeconomic conditions (Rahman and Khan, 2011; Befort et al., 2016; Arshad et al., 2017; Fahad and Wang, 2019; Ullah et al., 2022a). The monsoon precipitation magnitude has shown an increasing trend in northwestern and southeastern Pakistan while a decreasing trend in the southern coastal belt and central Indus basin (Abbas et al., 2014; Amin et al., 2017; Ali et al., 2019). In another study, Befort et al. (2016) reported that the country’s northern and northeastern plateaus had experienced an increasing trend in monsoon precipitation. Hussain et al. (2023a) and Bhatti et al. (2020) also explored an overall increase in daily precipitation extremes from rain-gauge observation over Pakistan. Such increasing trends in monsoon precipitation and its extremes are also reported in eastern and western India (Vinnarasi and Dhanya, 2016; Sharma et al., 2018; Venkata Rao et al., 2020), China (Ding et al., 2019; Shen et al., 2022a; 2022b) and central Asia (Wei et al., 2023).
The large-scale circulation patterns, including the Rossby waves, mid-latitude, and sub-tropical teleconnections, are linked to the historic flooding events of the region (Ullah et al., 2021b). The synoptic heavy precipitation events over western India and Pakistan are mostly due to the long-lived low-pressure system over the Bay of Bengal (Kale, 2012; Hunt and Fletcher, 2019). The continental precipitation recycling and evapotranspiration increase the moisture contents of the lower troposphere for enhanced precipitation (Martius et al., 2013; Pathak et al., 2017). The dynamic mountain’s ascent from extratropical waves influences the localized convective events, resulting in a heavy downpour (Ullah et al., 2021b; 2021a). The mid-latitude blocking and quasi-stationary synoptic waves from the Tibetan Plateau are continental sources, amplifying the regional precipitation extremes and enhancing moisture transport (Webster et al., 2011; Lau and Kim, 2012; Rasmussen et al., 2015). Moreover, consistent atmospheric blockings and westward extension of the Western Pacific Subtropical High (WPSH) due to El Niño–Southern Oscillation (ENSO) are further anticipated with extreme precipitation events over the region (Hong et al., 2011; Mujumdar et al., 2012; Yamada et al., 2016).
The above-cited literature has provided a detailed overview of the changes and variability in extreme and mean precipitation and their potential drivers. However, the sub-seasonal (monthly) precipitation extremes’ nature and variability have not been explored. The historic flooding events of 2010 and 2012 in Pakistan resulted from a synoptic-scale heavy downpour, resulting in serious flooding and losses on a wide spectrum (Webster et al., 2011; Rahman K. U. et al., 2023; Ishaque et al., 2023). Similarly, the region’s catastrophic drought episode of 1997–2002 resulted from an anomalous decrease and shift in seasonal precipitation for an extended period. The changes in water and energy cycles are extensively studied and attributed to global warming, which profoundly affects regional aridity, flood, and drought patterns. However, the flood and drought phenomena resulting from extreme sub-seasonal precipitation events are not fully explored in Pakistan. The current study has thus, attempted to explore the trend in daily monsoon precipitation extremes using observed precipitation data during 1981–2018. The underlying changes in the circulation patterns, convective activities, and relative humidity are further assessed to identify the potential drivers of the anticipated trend in precipitation extremes.
Pakistan is located in the tropical to subtropical climatic zone, with > 60% of its regional climate classified as arid (Haider and Adnan, 2014; Ahmed et al., 2019). The country’s annual temperature distribution shows that the maximum and minimum temperatures range from 15°C to 35 °C and ≤ 0°C–14°C, respectively (Ullah et al., 2019b; 2019c; Hussain et al., 2023b). The land-cover classes, derived from the Terra and Aqua combined Moderate Resolution Imaging Spectroradiometer (MODIS) Land Cover Type (MCD12Q1) Version 6 (Sulla-Menashe and Friedl, 2019), indicate that most of the croplands dominate the Indus River Basin (Figure 1A). The regional (Figure 1B) variation in the land cover and climate classes varies from one region to another. In the north, region 1 is a semiarid climate with grasslands, region 2 is semiarid to arid with dominant croplands, region 3 is humid with croplands, and region 4 is an extremely arid region with variable precipitation and cropland. The complex topography derived from the Advanced Spaceborne Thermal Emission and Reflection Radiometer Global Digital Elevation Model (ASTER-GDEM) shows that the terrains and rigid mountains in the north stretched towards the country’s northwestern parts mostly define precipitation variability (Figure 1B).
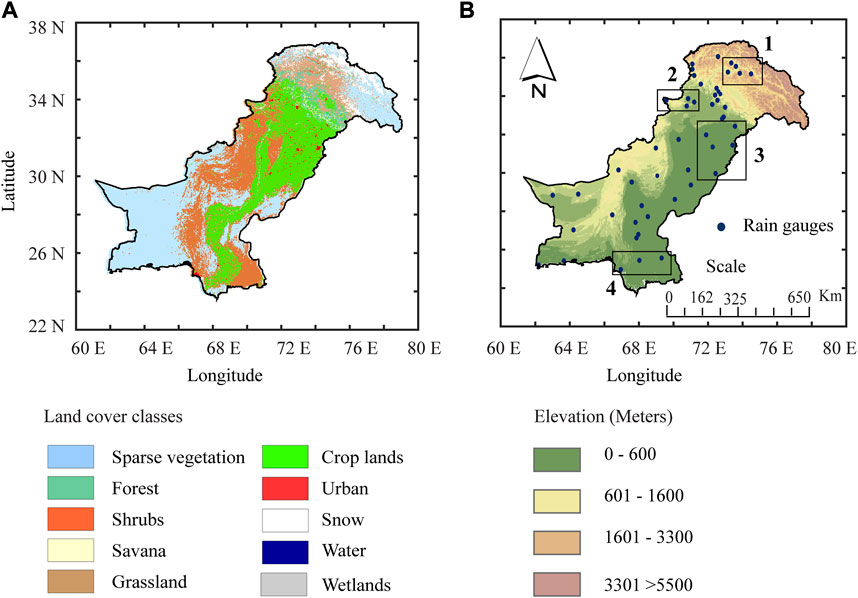
FIGURE 1. (A) Land cover classes and (B) digital elevation model (DEM) shows different elevation classes of Pakistan. The rectangles show the selected regions for aggregate average trend analysis.
Figure 2 shows Pakistan’s annual water cycle and interannual mean precipitation averaged from the Pakistan Meteorological Department (PMD) observatories during 1981–2018. Two dominant precipitation peaks (Figure 2A) can be seen during the annual water cycle, indicating the winter westerlies and the summer monsoon. As in Figures 2A–C, a clear transition can be observed in precipitation from the north (>70 mm) to the south (20 mm) and west (80 mm) to the east (60 mm) of the country during the winter and spring. This transition is due to the westerly weather system, originating from the Mediterranean Sea, mostly active in Pakistan’s northwestern parts. Similarly, the monsoon is the peak precipitating season (Figure 2D); about 65% of the annual precipitation is received during the monsoon season. During the autumn season (Figure 2E), relatively less precipitation is received at most stations. Like precipitation, temperature exhibits high spatial variability with maximum intensity in the southern parts and minimum intensity in the northern mountainous parts (Ullah et al., 2019a; Hussain et al., 2023b). The monsoon daily precipitation extremes often result in severe flooding and drought (Rahman and Dawood, 2017; Fahad and Wang, 2019). Thus, studying the variability in extremes is necessary for understanding the sub-seasonal water cycle dynamics.
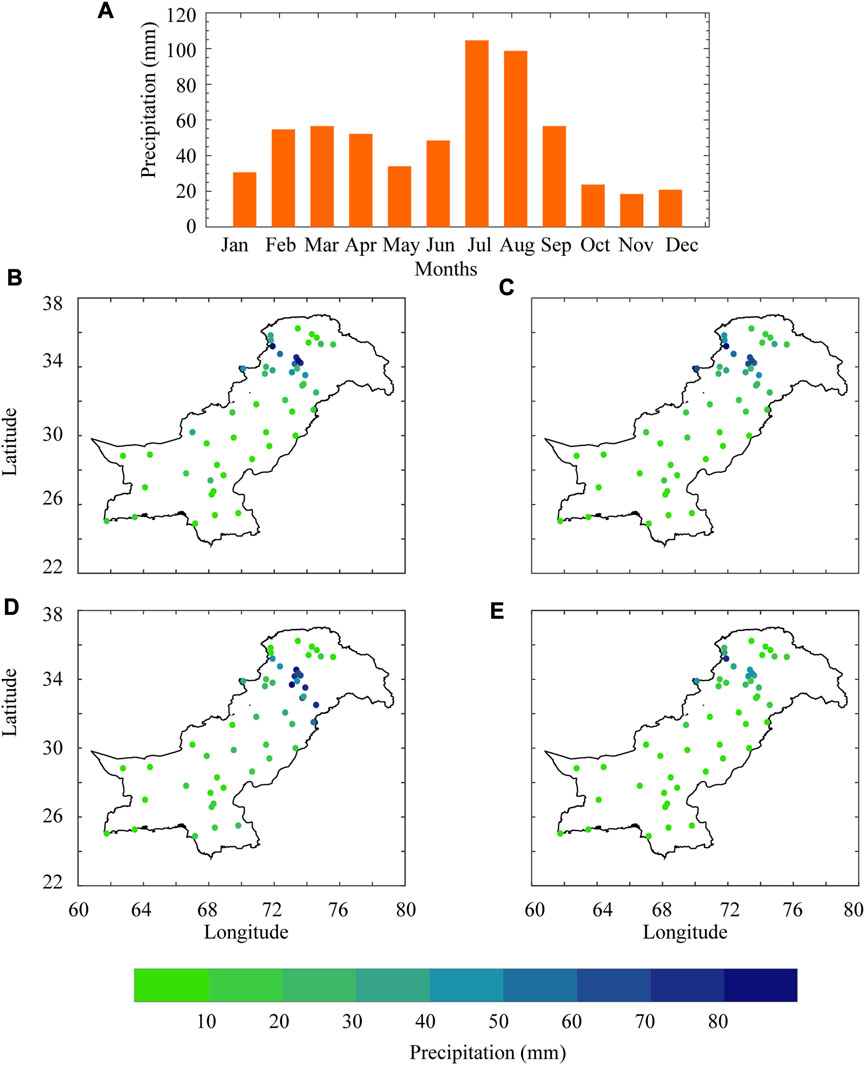
FIGURE 2. The multi-year mean of (A) monthly total precipitation and interannual mean of (B) winter, (C) spring, (D) summer, and (E) autumn seasons during 1981–2018 over Pakistan.
In the current study, two types of datasets are used, i.e., observed and reanalysis for 1981–2018 based on the in-situ precipitation data available from the Pakistan Meteorological Department (PMD). The observed precipitation data of fifty (50) meteorological stations for the monsoon season (June, July, August, and September months) are obtained from the Pakistan Meteorological Department (PMD). The station density of the current study is shown in Figure 1B, representing the dense network in the north and relatively sparse density in the south. The dominant precipitation patterns of the country have a relatively higher deviation in the north than in the south and are better represented by the prevailing station density (Hanif et al., 2013; Bhatti et al., 2020). Figure 1B further shows the selected four regions for an area average trend analysis based on the individual differences in land cover, elevation, and climate class. The rain-gauge data are indeed subjected to deviations attributed to climatic and non-climatic factors, which are removed from the primary data before application (Toreti et al., 2011; Tapiador et al., 2012; Kidd et al., 2017; Tapiador et al., 2018). In addition, the atmospheric reanalysis datasets were acquired from the European Centre for Medium-Range Weather Forecasts (ECMWF) and the National Centers for Environmental Prediction/National Center for Atmospheric Research (NCEP/NCAR) data archives.
The ECMWF 5th generation atmospheric reanalysis (ERA5) of zonal and meridional wind components, relative humidity, air temperature, sea surface temperature, and geopotential height were used (Hersbach et al., 2020). The horizontal resolution of ERA5 is 31 km and has 137 vertical levels to 0.01 hPa (Dee et al., 2011). The advantages of the ERA5 include its improvements in precipitation and cloud schemes, model parametrizations, snow schemes, and improved radiative balance of the model (Shen et al., 2021; 2022b). For the current study, monthly mean data of the above variables were downloaded for the monsoon season with a grid size of 0.75°. The ERA5 atmospheric reanalysis data were downloaded from the following link: https://cds.climate.copernicus.eu/cdsapp#!/home.
The current study also used the NCEP/NCAR monthly mean outgoing longwave radiation (OLR) data (Liebmann and Smith, 1996). The resolution of radiance observation of OLR is 1.0 × 1.0°, derived from a high-resolution infrared radiation sounder (HIRS). The data was interpolated at a 2.5-degree spatial resolution of the initial National Oceanic and Atmospheric Administration (NOAA) data. The interpolated data provide a smooth and error-free overview of the tropical convective activities due to consistent quality control and conditional checks before interpolation. The OLR data used in this study were retrieved from https://psl.noaa.gov/.
(a) Extreme precipitation indices
For extreme precipitation, a set of seven precipitation indices were derived from the Experts Team on Climate Change Detection Indices (ETCCDI) of the World Meteorological Organization (WMO) (Zhang et al., 2011). Table 1 shows a detailed overview of the selected indices and their classification for the current study. Using these indices, we have considered two aspects of the precipitation extremes, i.e., the frequency of the days and their relative intensity for the monsoon months. It should be noted that the precipitation variability over Pakistan significantly varies from the east to the west, especially during the monsoon season (Hanif et al., 2013). Therefore, these indices are useful in characterizing monsoon precipitation variability in arid, semiarid, and humid climates. The choice of multiple absolute and percentile-based relative threshold indices could provide a tangible way of assessing trends in regional heavy and very heavy precipitation extremes.
(b) Trend analysis
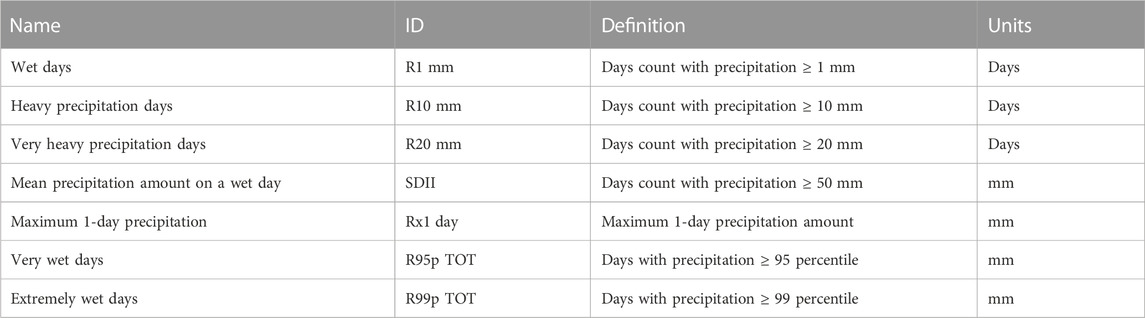
TABLE 1. Extreme precipitation indices used in the study.
For inferring trends in the extreme precipitation indices, a suite of non-parametric statistical techniques, namely, modified Mann-Kendall (mMK) (Hamed and Rao, 1998) and Sen’s slope estimator (SSE) were used (Sen, 1968). The mMK test was used to determine the significance of the trend with a 95% significance bound, and SSE was employed to estimate the magnitude of the monotonic trend (Ullah et al., 2019c; Ali G. et al., 2020). Both the original Mann-Kendall (MK) and its modified version (mMK) tests are often used to detect the significance of the trend in a time series; the MK test is sensitive to autocorrelation (Ullah et al., 2018b; Khan et al., 2021), which may affect its outcomes regarding significance. On the other hand, the mMK effectively nullifies the effect of autocorrelation before determining statistical significance (Salman et al., 2017; Xie et al., 2020; Hussain et al., 2022). Therefore, the present study preferred the mMK test over the MK to overcome autocorrelation in the datasets. Moreover, the mMK test is simple and robust against outliers, missing values, and normal distribution and is less sensitive to abrupt breaks in time series.
Similarly, the Sequential Mann-Kendall (SQMK) test (Sneyers, 1990) was further used to detect the abrupt changes (mutations) in the temporal trends of the sub-seasonal extreme precipitation indices. In addition, linear regression analyses were used to estimate the temporal trend across time and the elevation during the study period. More details about mMK, SSE, SQMK, and linear regression tests can be found in recent studies (Ullah et al., 2018a; Hussain et al., 2022). Finally, a non-parametric Probability Density Function (PDF) was employed to describe the distribution pattern of the extreme precipitation indices, allowing for the changes in the input to shape the distribution pattern and moments based on the mean, mode, median, kurtosis, and skewness. A Gaussian kernel with zero mean and unit standard deviation represents a normal distribution for a simple PDF. In contrast, a deviation on either the left or right side suggests a decrease or increase in the respective field’s magnitude, frequency, and/or intensity (McColl et al., 2017; Ullah et al., 2021b).
(c) Extreme precipitation indices relationship with atmospheric circulations
We further attempted to explore the extreme precipitation indices’ relationship with the atmospheric circulation strength in the region following previous studies (Rasmussen et al., 2015; Ullah et al., 2021b). To find such a relationship, we used the South Asian High (SAH) oscillations and the long-term interannual scale difference in the intensity of the atmospheric processes. The SAH oscillation and regional deviations were previously linked with Asian monsoon precipitation variability and changes (Ge et al., 2018; Zhang et al., 2020). The SAH index was calculated from the meridional shift of the 200 hPa geopotential height difference between the southwest (20—27.5°S, 50—80°W) and northwest (27.5–35°N, 50—80°E), as shown in a recent study (Wei et al., 2015). We calculated the relative mean difference by dividing the study period into two phases to estimate the long-term differences in the atmospheric processes, including divergent circulations (200 hPa), outgoing longwave radiation, relative humidity (850 hPa), and atmospheric temperature (850 hPa). The first phase spans from 1981 to 1990, and the second spans from 2009 to 2018 for the monsoon season. The first phase is then averaged and subtracted from the second phase. The purpose of this relative difference between the 2 decades relates to global warming and its impact on the circulation intensity of the region. Unlike a composite analysis of the selected extreme events, the relative difference may better state the probabilistic changes and relative differences in the atmospheric states.
Figure 3 shows the spatial trend of extreme precipitation indices derived from the sub-seasonal daily precipitation during 1981–2018. The stations with the significant trend at 95% confidence bounds are encircled. The frequency of wet days (R1 mm) showed a general increase in the country’s central, southern, and northern parts with a z-score value of >1.5 (Figure 3A). The core monsoon and adjacent mountainous regions experienced an erratic trend, with few stations showing a decrease (z-score = −5) and an increase in the mountainous parts. For the frequency of heavy precipitation days (R10 mm), a consistently increasing trend was explicit in the monsoon domain of the region (Figure 3B). The magnitude of the increasing trend was relatively high in the central and eastern parts (>2.5), which are considered key monsoon areas. On the other hand, a decrease in the frequency of heavy precipitation days (R10 mm) was evident in the northern mountainous (z-score <–2) (Figure 3B) and arid southwestern climate (z-score = −1.49).
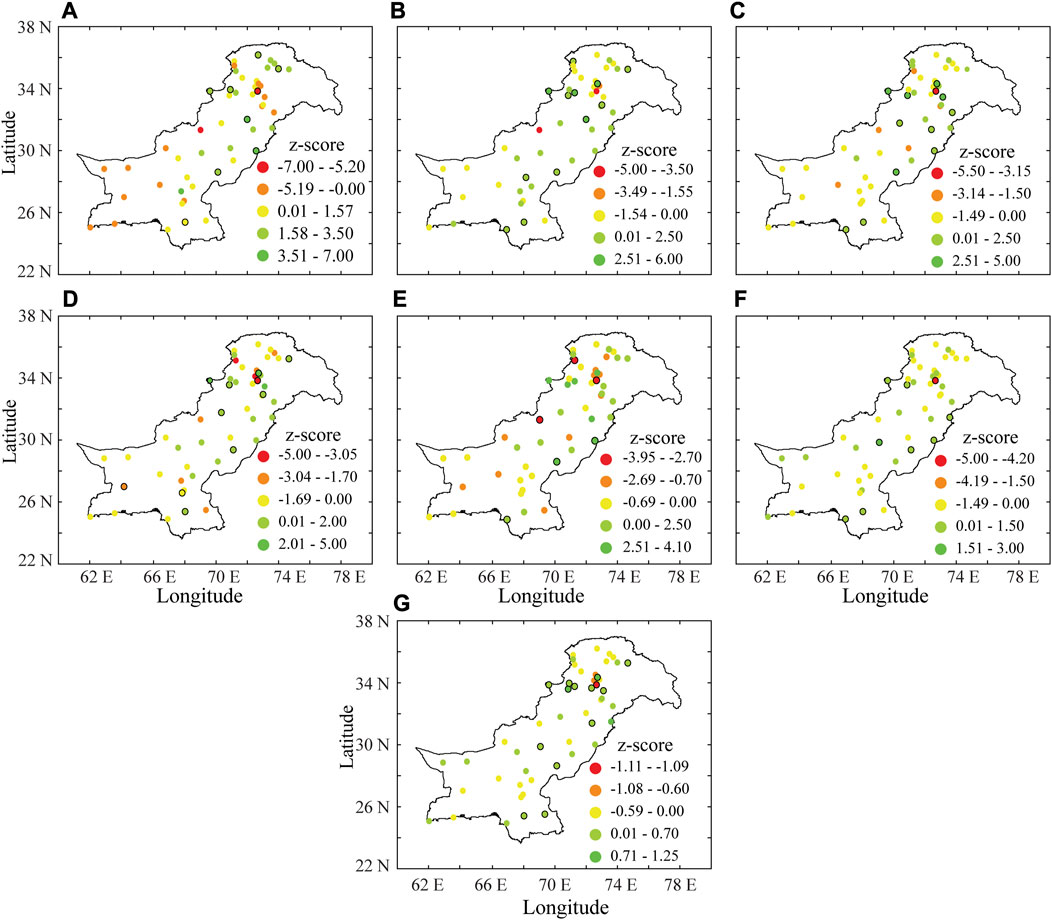
FIGURE 3. Modified Mann-Kendall (mMK) trend of the extreme precipitation frequency during 1981–2018 over Pakistan; (A) wet days (R1 mm), (B) heavy precipitation days (R10 mm), (C) very heavy precipitation days (R20 mm), (D) Mean precipitation on wet days (SDII), (E) One-day maximum precipitation (Rx1 day), and (F) very wet days (R95p TOT), (G) extremely wet days (R99p TOT) precipitation. The encircled stations have passed the significant presence of trend with a 95% confidence.
As seen in Figure 3C, the frequency of very heavy precipitation days (R20 mm) increased in the eastern parts of the region (z-score > 4) and was erratic in the rest of the country with a moderate decrease of < –1.80 notable in northern and southern regions. The increase is relatively high in the eastern parts, followed by the northwestern region (z-score: 3.5). The intensity of wet days average precipitation (SDII) showed an increase in the central monsoon region (z-score= >2), including the eastern and central regions of the country (Figure 3D). In the rest of the country, the SDII trend is erratic, with a general increase in the monsoon regions and a decrease in the arid western stations. The maximum 1-day precipitation (Rx1 day) trend is consistent with SDII in the core monsoon regions and erratic in the rest of the country (Figure 3E). The country’s eastern and western foothills regions have shown an increasing trend (z-score = 2.50) and a decrease in the arid southern region (z-score = −0.69).
The intensity of the very wet days (R95p TOT) has decreased in the central arid plains, increasing in the Indus Basin eastern parts and southern coastal regions with a z-score of 1.5 (Figure 3F). The decrease in the intensity of very wet days is smaller, mostly in the country’s central arid regions, with a z-score of −1.49. However, the increase is dominant in the central and western foothills of the country, with a z-score of >1.5. The intensity of extremely wet days (R99p TOT) precipitation (Figure 3G) is generally erratic but shows an increase in the monsoon regions. The eastern, central, and western foothills increase is 0.71, stretching towards the southwestern and coastal regions.
Figure 4 shows the SSE of the extreme precipitation frequency and intensity from 1981 to 2018. As seen in Figure 4A, the frequency of wet days (R1 mm) increased in the eastern, northern, and northwestern parts (0.20 days), whereas a moderate decrease in the south and southwest is obvious (<–0.19 days). For heavy precipitation days (R10 mm) (Figure 4B), the increase is concentrated in the central monsoon region (>0.11 days). These parts are the main monsoon domain where the average increase amounts to >0.25 days. The frequency of very heavy precipitation days (R20 mm) has a moderate increase in northwestern parts (>0.13 days) and a moderate decrease (−0.02 days) in northern and southern parts of the country (Figure 4C). The mean precipitation on a wet day (SDII) (Figure 4D) exhibited an increase in the eastern, western parts of the region (>0.2 mm), alongside a decrease in the north and southeastern coastal regions (−0.14 mm). The maximum 1-day precipitation (Rx1 day) (Figure 4E) precipitation is erratic in the north and southwest (−0.27—0.17 mm) and increased in the eastern, northwestern, and central parts of the region (0.52 mm). The very wet days (R95p TOT) precipitation (Figure 4F) showed an obvious increase in the eastern and central parts of the region (0.11 mm), whereas the rest of the country, including the northern, western, and southern parts, showed a consistent decrease (−0.14 mm). The intensity of extremely wet days (R99p TOT) precipitation (Figure 4G) has a small decrease and thus can be referred to as unchanged during the study period. More detailed analysis with long time series of the precipitation data can better predict this trend.
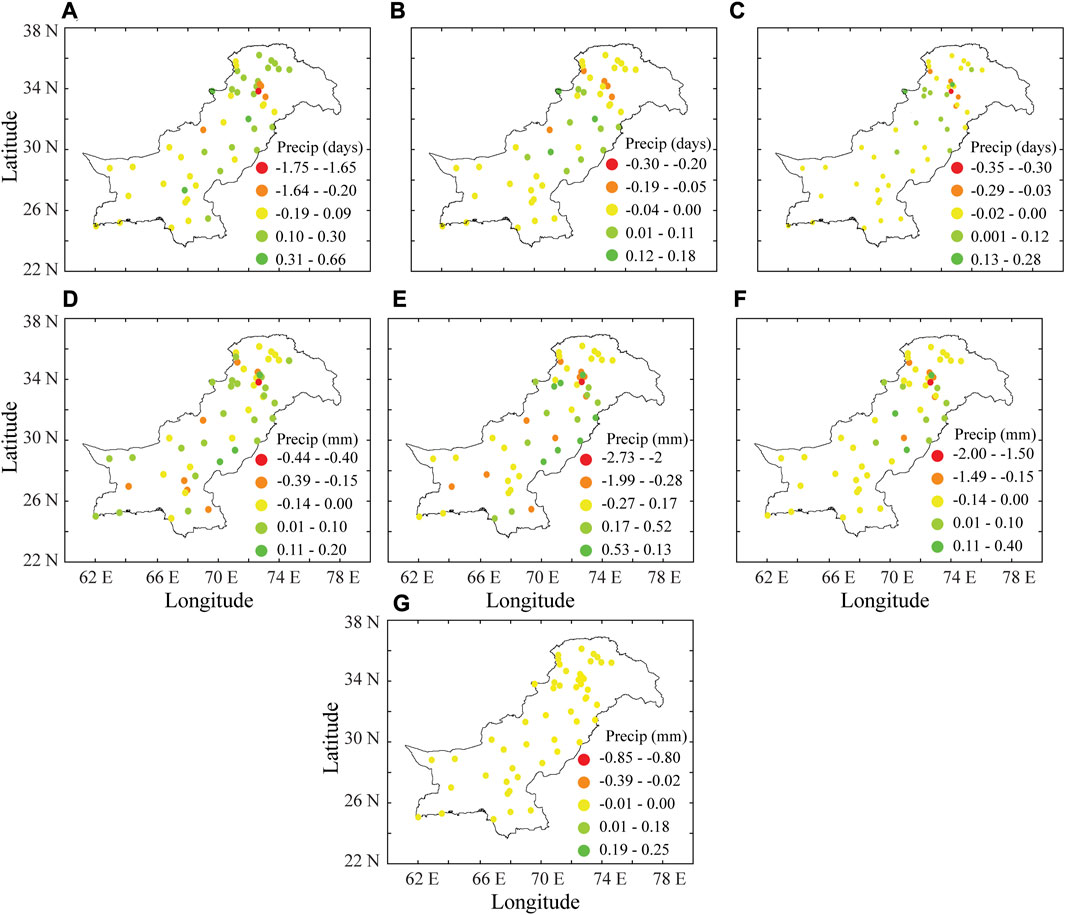
FIGURE 4. Theil Sen slope of the extreme precipitation frequency during 1981–2018 over Pakistan; (A) wet days (R1 mm), (B) heavy precipitation days (R10 mm), (C) very heavy precipitation days (R20 mm), (D) Mean precipitation on wet days (SDII), (E) One-day maximum precipitation (Rx1 day), and (F) very wet days (R99p TOT), (G) extremely wet days (R99p TOT) precipitation.
The mMK and SSE of regional precipitation averaged for the selected stations in each region (Figure 1B) are further shown in Table 2. The regional average precipitation trend can better capture the regional precipitation behavior concerning the erratic nature of the spatial trend. The regional relative highest trend values for mMK and SSE magnitude are shown in bold. The relative increase in the wet days (R1 mm) showed an overall increase in all regions, with the highest values of mMK (3.71) and SSE (0.3) in region 2. For heavy precipitation days (R10 mm), the increase was moderate in all regions, with a consistent increase in region 2 (mMK: 2.92, SSE: 0.12) and a decrease in region 4 (mMK: –0.062, SSE: 0). For very heavy precipitation days (R20 mm), a similar increase in region 2 (mMK: 3.38, SSE: 0.078) was obvious, with a moderate increase in the rest of the regions. For SDII, a decrease in regions 1 and 4 (mMK: –1.45, −1.95, SSE: –0.035; −0.16) was obvious, and an increase in region 3. The 1-day maximum precipitation (Rx1 day) decreased in region 2 and 4, with a moderate increase in region 3 (mMK: 1.39, SSE: 2.32). For very wet days (R95p TOT), a decrease in regions 1 and 4 was obvious, along with an increase in region 2 (mMK: 2.46, SSE: 2.32). The extremely wet days (R99p TOT) precipitation has a moderate increase in all regions with a decrease in region 1.
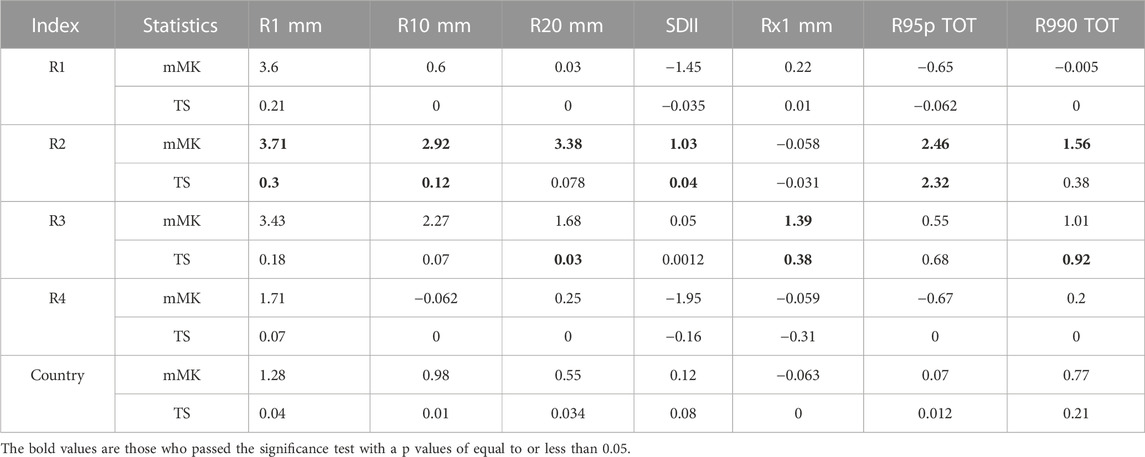
TABLE 2. The mMK and TS trend of selected regions average precipitation during 1981–2018.
Figure 5 shows the abrupt changes (mutations) in extreme precipitation indices’ temporal trends over Pakistan from 1981 to 2018. The UB statistics (blue dashed line) show the backward trend from 2018 towards 1981, while the UF statistics (orange line) show the forward trend (1981–2018); the green line shows the 95% significance limit for the trend in a time series. The points where UB and UF lines cross each other represent the abrupt shift in trend from decreasing to increasing state and vice versa. For the frequency of wet days (R1 mm) (Figure 5A), a constantly increasing trend is evident from 1981 with multiple mutations from 1990 to 2000. The catastrophic flooding and drought events in Pakistan are depicted in mutation points during the study period (Xie et al., 2016; Abbas et al., 2021). These events limited access to food and water, damaged the basic infrastructure, and affected the socioeconomic and sustainable development of the country (Rahman and Khan, 2011; Ullah et al., 2021b).
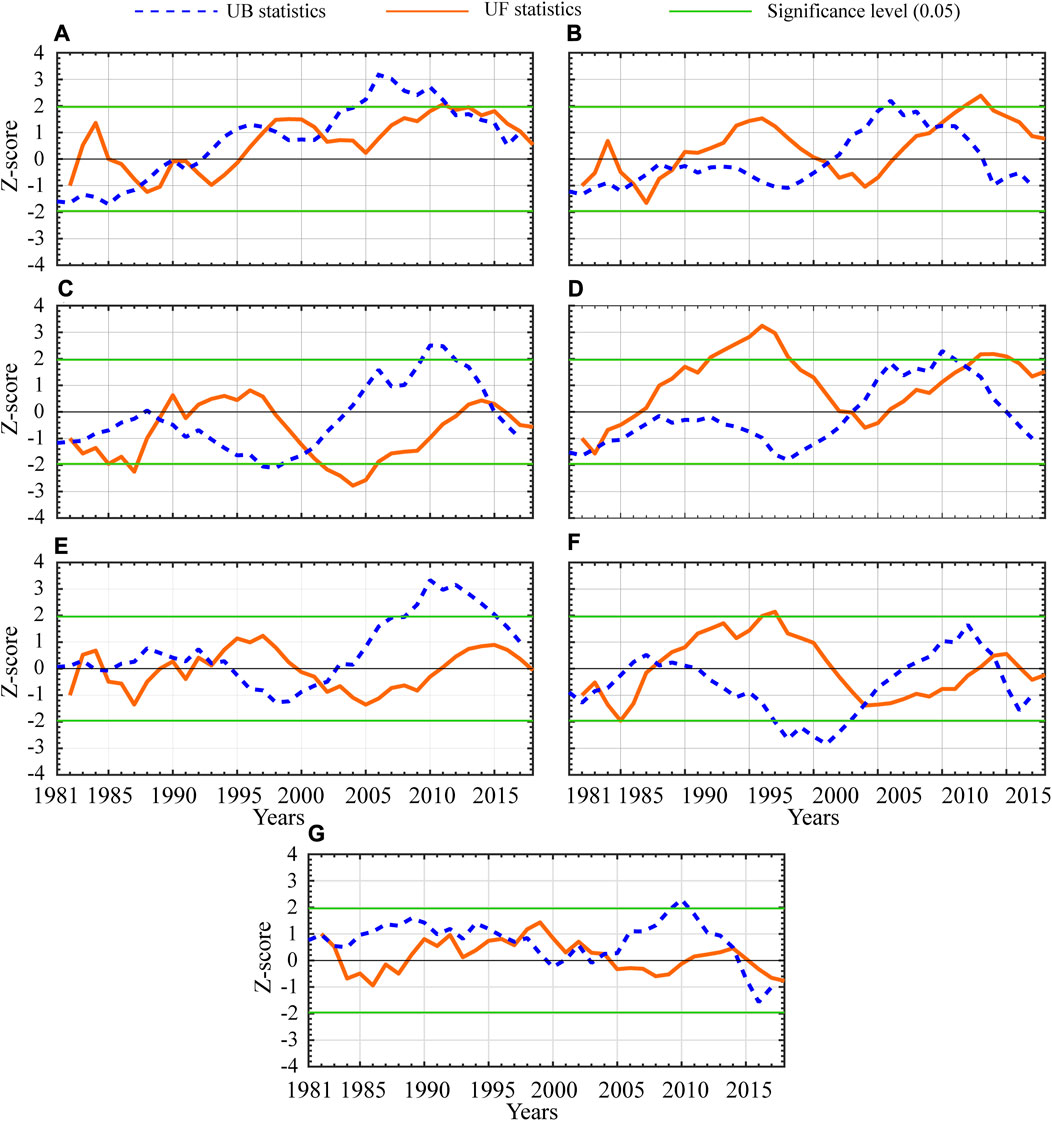
FIGURE 5. The abrupt changes in sub-seasonal daily precipitation extreme during 1981–2018 over Pakistan; (A) wet days (R1 mm), (B) heavy precipitation days (R10 mm), (C) very heavy precipitation days (R20 mm), (D) Mean precipitation on wet days (SDII), (E) One-day maximum precipitation (Rx1 day), and (F) very wet days (R99p TOT), (G) extremely wet days (R99p TOT) precipitation.
For the frequency of heavy precipitation (R10 mm) (Figure 5B), a consistent periodicity with multiple turning points inferred a continuous change in the trend. The drought periods of 1988–1990 and 1997–2002 and the flooding events of 1990 and 2010 showed a phase shift in the trend. For the frequency of very heavy precipitation days (R20 mm) (Figure 5C), three turning points were explicitly evident in early 1990, 2000, and 2015, inferring a shift in the frequency trend. The drought period of the late-1990 was very obvious, followed by a smooth increase afterward. The intensity of wet days mean precipitation (SDII) (Figure 5D) has different statistics and dynamical patterns evident from the respective frequency plot with a significant increase during 1985–1995, followed by a sharp decline during early 2000. The 1-day maximum (Rx1 day) precipitation (Figure 5E) showed the dry and wet episodes of the region with dynamic mutations in the early 1990s and a moderate increase in post-2010 with a decrease afterward. The intensity of the very wet days (R95p TOT) precipitation (Figure 5F) has shown four turning points in the trend linked with changes in the precipitation intensity. The mutation points reflect the major precipitation extremes, such as the floods in the early-1990s, the drought in 1997–2002, and the 2010 floods. The extremely wet days (R99p TOT) precipitation (Figure 5G) showed a moderate to very lower variation over the study period and rather dynamic mutations with no obvious trend visible. In conclusion, Figure 5 shows that the precipitation variability over Pakistan is moderately associated with and influenced by the large-scale atmospheric and oceanic forcing as previously explored. The forcing appears to influence the interannual monsoon precipitation extremes over Pakistan during their transition from one phase to another, such as during the 2010 flooding and drought phases (Webster et al., 2011; Xie et al., 2016).
Figure 6 shows the relationship between extreme precipitation frequency and intensity with the altitude of rain gauges. The mMK values for the frequency and intensity of the selected absolute and percentile-based precipitation indices are regressed against the elevation of the stations. The mMK values for the frequency (Figure 6A) of wet days (R1 mm) showed a decreasing trend with elevation with regression coefficients of −0.00039. The mMK values of heavy precipitation days (R10 mm) showed a similar decreasing trend with regression coefficients of −0.0011 (Figure 6B), with a similar decrease for very heavy precipitation days (R20 mm), with a regression coefficient of −0.00085 (Figure 6C), respectively. The mean precipitation on wet days (SDII) showed an overall decreasing trend with altitude (−0.00054); however, the trend was erratic in the lower and moderate altitudes (Figure 6D). The 1-day maximum precipitation (Rx1 day) also showed a decrease across altitude (−0.00045), but the station density in lower and moderate elevations showed an increase in the precipitation (Figure 6E). The very wet days (R95p TOT) intensity (Figure 6F) has decreased across altitude with regression coefficients of −0.00028, followed by a similar decrease for extremely wet days (R99p TOT) intensity with the highest decreasing trend compared to the intensity-based indices (Figure 6G).
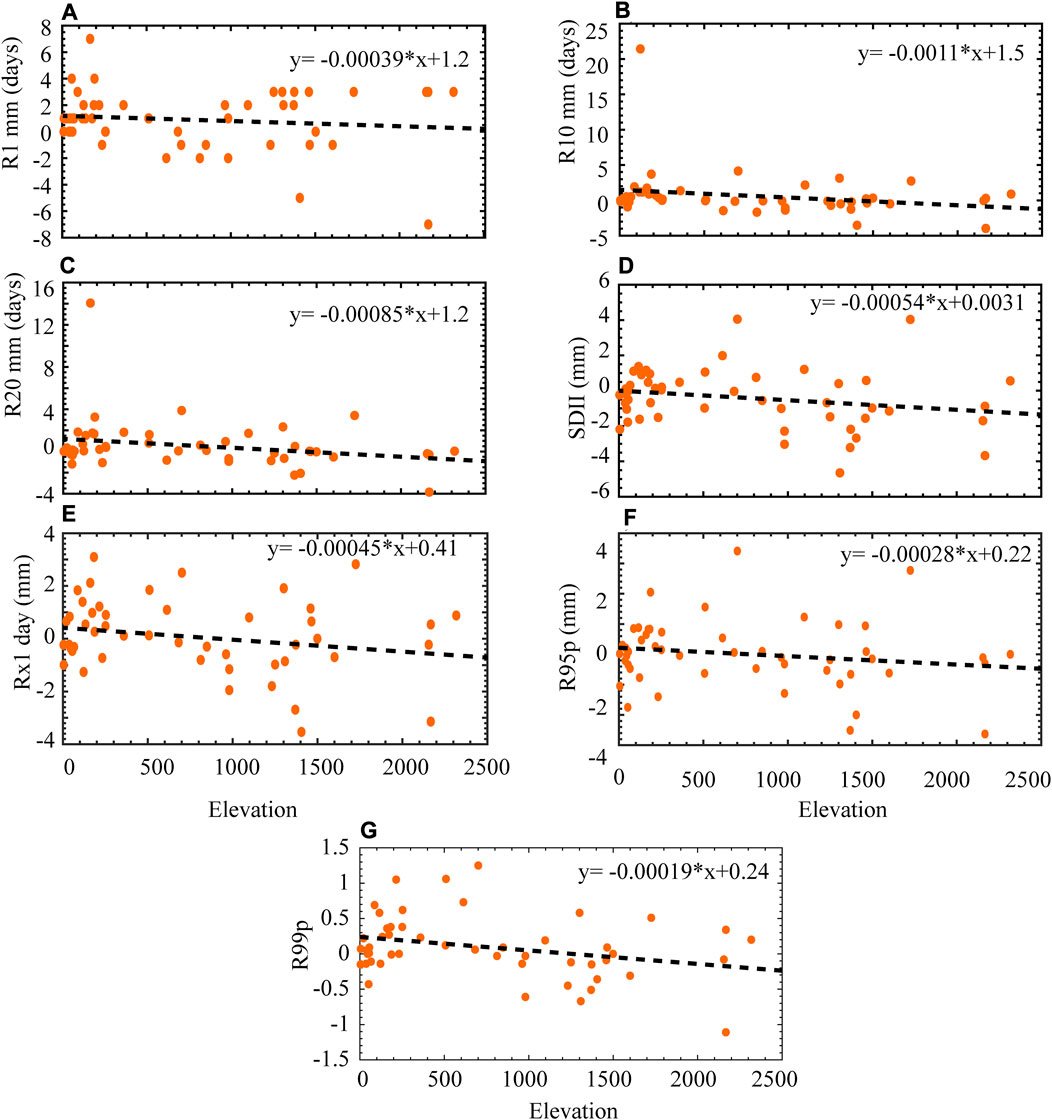
FIGURE 6. Linear trend in sub-seasonal daily precipitation extreme against elevation during 1981–2018 over Pakistan; (A) wet days (R1 mm), (B) heavy precipitation days (R10 mm), (C) very heavy precipitation days (R20 mm), (D) Mean precipitation on wet days (SDII), (E) One-day maximum precipitation (Rx1 day), and (F) very wet days (R95p TOT), (G) extremely wet days (R99p TOT) precipitation.
In conclusion, Figure 6 shows that the frequency and intensity of precipitation extremes concerning altitude exhibited a decreasing trend during the monsoon season. The relationship showed that some stations have positive and negative residues in the lower and higher altitude regions, inferring that precipitation increases with altitude in the moderate altitudes. Still, the overall relationship is negative due to the higher altitude and density of the stations in the northern parts of the study region. The possible reason for such a weaker and negative relationship could be that the extreme monsoon precipitation is centered in the country’s central regions, mostly in the middle and lower altitude classes. Furthermore, the extreme precipitation indices have a diverse regional variability, with each regional index trend varying from the rest. The results also agree with the previous studies showing a decrease in monsoon mean precipitation and an increase in wet days across moderate and lower altitudes (Ullah et al., 2018a; Bhatti et al., 2020).
Figure 7 shows the probability density function (PDF) of the extreme precipitation frequency, intensity, and its moments of distribution (Table 3). The wet days (R1 mm) (Figure 7A) PDF shows an overall positive asymmetric distribution in monsoon months, indicating an inconsistent increase. This indicates that the onset and recession of the monsoon season are getting vibrant, while the mid-monsoon season is getting intense with more precipitation days. As seen in Table 3, the wet days’ precipitation (R1 mm) has shown a higher deviation towards maxima during August (4.54), followed by July (1.44), September (1.01), and June (0.94). Similarly, July and August have the highest mean wet days’ precipitation at 5.59 and 5.42, respectively.
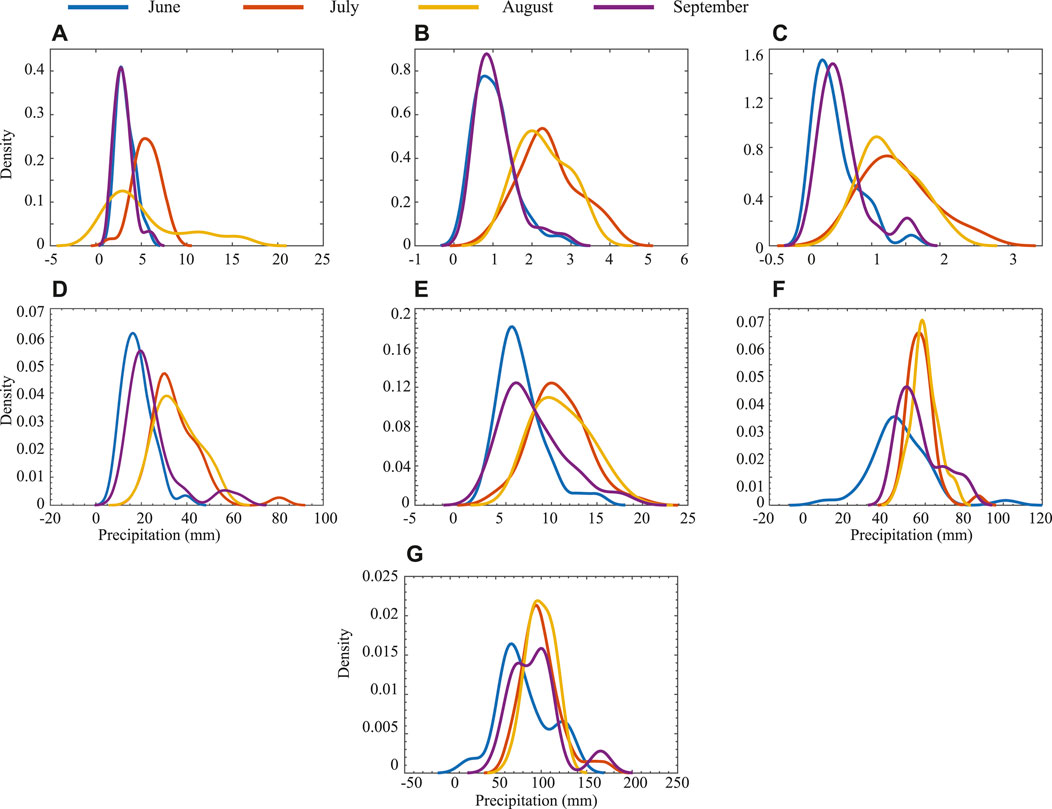
FIGURE 7. Probability density function (PDF) of daily monsoon precipitation intensity indices for June, July, August, and September months during 1981–2018 over Pakistan; (A) wet days (R1 mm), (B) heavy precipitation days (R10 mm), (C) very heavy precipitation days (R20 mm), (D) Mean precipitation on wet days (SDII), (E) One-day maximum precipitation (Rx1 day), and (F) very wet days (R95p TOT), (G) extremely wet days (R99p TOT) precipitation.
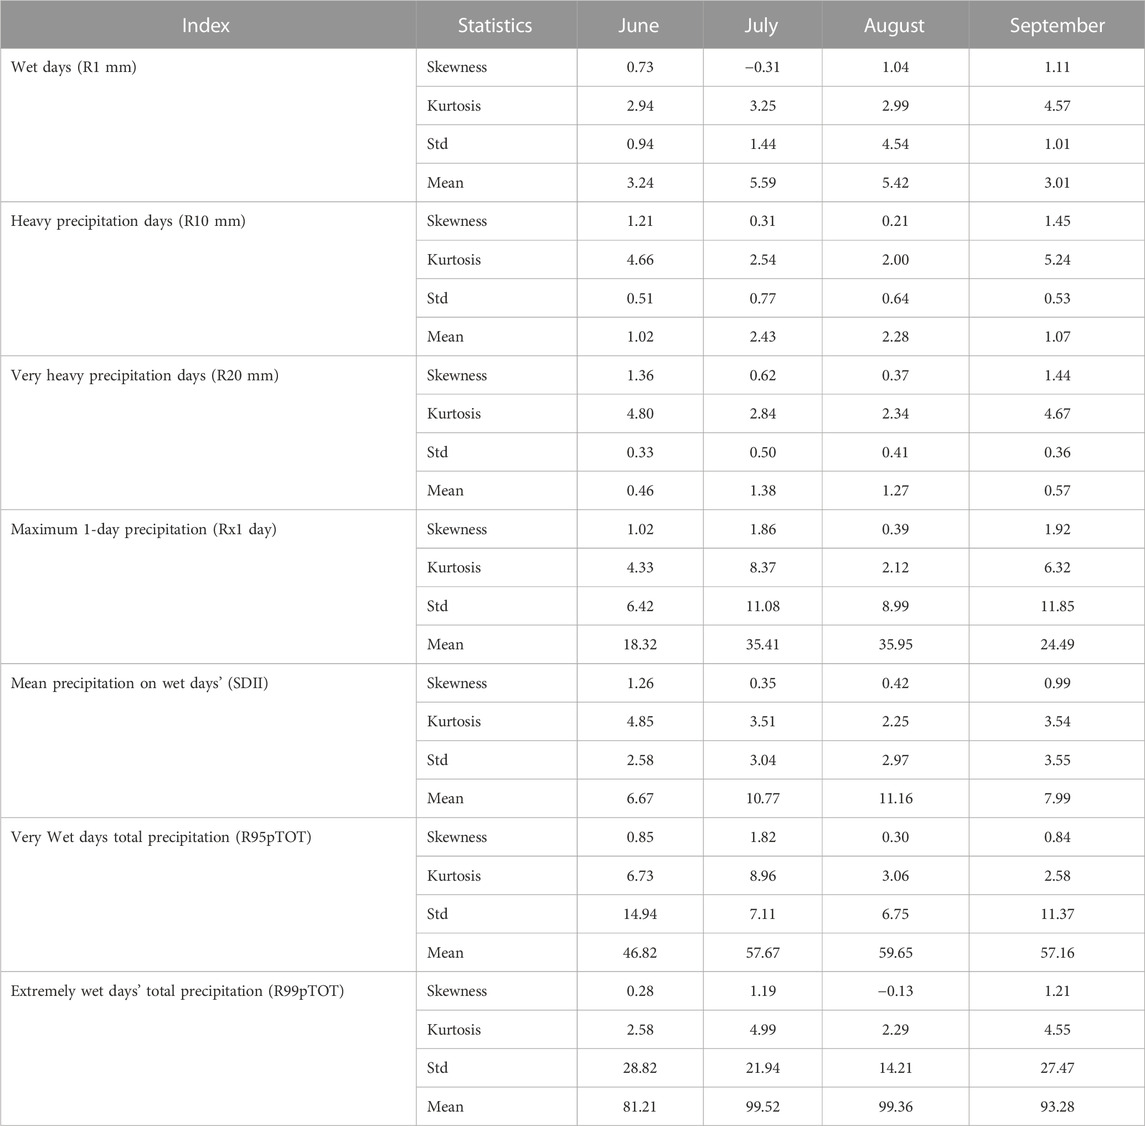
TABLE 3. Descriptive statistics showing moments of distributions for extreme precipitation indices during 1981–2018 over Pakistan.
The heavy precipitation days (R10 mm) (Figure 7B) exhibited a similar pattern to wet days (R1 mm), highlighting the high frequency (intensity) of heavy precipitation events (R10 mm). In terms of distribution statistics (Table 3), the months of June and September (July and August) showed the highest skewness and kurtosis (deviation and mean) values, affirming higher frequency (intensity) of heavy precipitation days (R10 mm) during these months. The skewness and kurtosis values for heavy precipitation days (R10 mm) were high in September (1.45 and 5.24), followed by June (1.21 and 4.66), while the higher degree of deviation and mean was evident during July (0.77 and 2.43), followed by August (0.68 and 2.28), respectively.
For very heavy precipitation days (R20 mm) (Figure 7C), the PDF followed the pattern of heavy precipitation days (R10 mm); however, slight changes are observed in the density and distribution of the selected months. June and September have the highest frequency with slight rightward movement during September, indicating frequent heavy precipitation events. The higher skewness and kurtosis during June and September infer a shift towards more extreme values and a high frequency of very heavy precipitation events (R20 mm) during these months (Table 3). On the other hand, the larger distribution towards the right side in July and August is explicitly conclusive of a relatively higher degree of change in the intensity of very heavy precipitation events (R20 mm) during these months.
The maximum 1-day precipitation (Rx1 day) is similar to other absolute indices (Figure 7D), with high density and positive distribution during the selected months. However, June and September have the highest density, while July, August, and September have more positive shifts. The PDF pattern indicates that the study region was predominated by regular daily maximum precipitation extremes (Rx1day) during June and September. The PDF pattern was confirmed by the related statistics (Table 3), showing the highest skewness, kurtosis, and standard deviation during July (1.86, 8.37, and 11.08) and September (1.92, 6.32, and 11.85). The higher degree of skewness, kurtosis, and deviation suggests asymmetrical and variable daily maximum precipitation (Rx1 day) during these months.
In mean precipitation on wet days’ (SDII) PDF (Figure 7E), the highest density was observed in June with a slight asymmetrical shift in the high precipitation distribution, suggesting a high frequency during the study period. However, positive shifts with the symmetrical pattern were found in the rest of the months, indicating high uniformity in the magnitude of wet days’ mean precipitation (SDII). Table 3 shows high skewness and kurtosis values were observed in June (1.26 and 4.85), indicating recurrent wet-day precipitation (SDII).
For very wet days’ precipitation (R95p TOT) (Figure 7F), an opposite pattern is found in the density and distribution of the selected months relative to the absolute indices. Interestingly, July and August (June and September) show a relatively significant increase in density (distribution), which contradicts the PDF patterns of absolute precipitation indices. These results suggested the frequent and intense occurrences of very wet events (R95p TOT) in Pakistan during July and June were relatively predominated by very wet day extremes (R95p TOT). In terms of PDF statistics (Table 3), the highest skewness and kurtosis values were found in July (1.82 and 8.96), which confirmed the occurrence of frequent and intense very wet extremes (R95p TOT).
The extremely wet days’ precipitation (R99p TOT) PDF followed the very wet days’ PDF pattern with slight variations in the density and distribution of the selected months (Figure 7G). The higher intensity of extremely wet days (R99p TOT) in the July and August months could be attributed to more precipitation, as these months are mid of monsoon season in Pakistan. In terms of PDF statistics (Table 3), the skewness and kurtosis values were high during July (1.19 and 4.99) and September (1.21 and 4.55), whereas the degree of deviation was high during June, followed by September and July at the rate of 28.82, 27.47, and 21.94, respectively.
In conclusion, from Figure 7, an obvious overall increase is observed in the frequency and intensity of extreme precipitation indices. The absolute indices have observed a relatively high frequency during June and September, while a strong intensity during July and September. In contrast, the percentile-based indices have shown an opposite pattern with high frequency in June and September and intensity in June and September. The high frequency of extreme precipitation indices during June and September indicates that the onset and recession of the monsoon season have been vibrant in Pakistan during the study period. Moreover, the increasing intensity of extreme precipitation indices during July and August suggests that the study region has received more precipitation during these 2 months and could be considered the peak monsoon months in Pakistan. Generally, the extreme precipitation increase in intensity is reported in the previous study over Pakistan (Bhatti et al., 2020).
This section has attempted to show a potential mechanism of the changes in the extreme precipitation indices and their association with the large-scale atmospheric phenomenon. For this purpose, we have used a two-step approach, including a long-term correlation of the extreme precipitation indices with South Asian High (SAH) meridional oscillation in the first step and a relative difference of the circulation intensity during the study period in the second step.
Figure 8 shows the correlation between the South Asian High (SAH) index and the extreme precipitation frequency and intensity during the study period. For wet days (R1 mm) precipitation, a positive correlation (>0.45) was visible in core monsoon regions and negative in the central parts of the country (Figure 8A). A consistent positive correlation in the northern and southern and a negative correlation in the central parts of the country was obvious for heavy and very heavy precipitation days (Figures 8 B, C). The relative strength of the correlation was stronger for very heavy precipitation days (>0.60) among the frequency-based indices (Figure 8C). The mean wet days’ precipitation (SDII) showed a consistent positive correlation in the north and southern parts alongside a negative correlation in the central parts of the region (Figure 8D). For maximum 1-day precipitation (Figure 8E), the strength of the correlation was positive in the north, and a rather weaker to moderate negative relationship was obvious in the rest of the country. The relatively strong relationship among the intensity of very wet days (R95p TOT) (Figure 8F) across the core monsoon regions of the country, whereas the extremely wet days (R99p TOT) precipitation (Figure 8G), was rather uniform across the eastern parts of the country from the north to southward. In conclusion, the SAH meridional oscillation across the northward and southward of the study region exhibited an erratic relationship with the frequency and intensity of the extreme. The correlation strength varies regionally among the indices, indicating that the large-scale shift toward northwestward may suppress the monsoon precipitation over Pakistan and vice versa (Wei et al., 2015).
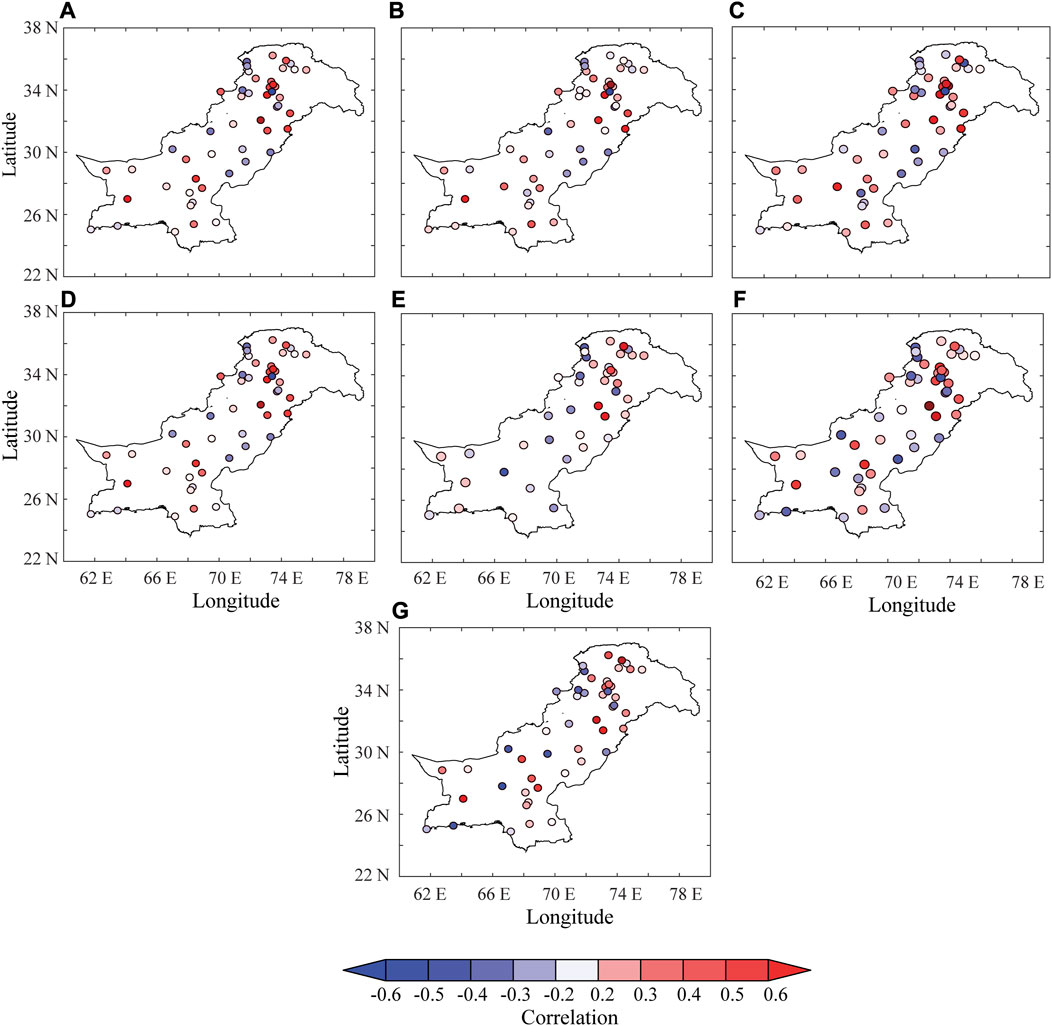
FIGURE 8. Correlation of SAH index and extreme precipitation indices of (A) wet days (R1 mm), (B) heavy precipitation days (R10 mm), (C) very heavy precipitation days (R20 mm), (D) mean precipitation of wet days (SDII), (E) maximum 1-day precipitation, (F) very wet day precipitation (R95p TOT), and (G) extremely wet days precipitation (R99p TOT) during the study period.
Figure 9 shows the relative difference of (a) 200, (b) 500, and (c) 850 hPa wind components (vectors) and stream function (shaded) for the first (1981–1990) and last decade (2009–2018). From Figure 9A, the wind components and stream function showed the relative strength of the circulations and the center of the cyclonic/anticyclonic motion. Two high-pressure systems are evident; the first is located over the Tibetan Plateau in the north of Pakistan, while the second is over northwestern Pakistan, centered over Eurasia. A low-pressure cut-off can be seen between the two pressure systems, separating them. The mid-tropospheric circulations (500 hPa) have preserved the probabilistic Rossby Wave pattern with the leading ridge and Tibetan High favoring intensified ascent over Pakistan (Figure 9B). A strong southwesterly flow (850 hPa) over the Arabian Sea (20°N, 50°E-70°E) is discernable that after entering the Bay of Bengal region forms a southeasterly flow, favoring enhanced moisture transport from the Arabian Sea and the Bay of Bengal (Figure 9C). The two pressure systems provided a frontal system where warm air masses from the Bay of Bengal and warm pool region through southwesterlies and cold Eurasian air masses merge and probably drive the extreme precipitation during the monsoon season. The mechanism shown here suggests an increase in the intensity of the circulation pattern and its associated impact on the regional precipitation extreme indices. Further detailed studies are thus needed for a more definitive mechanism assessment.
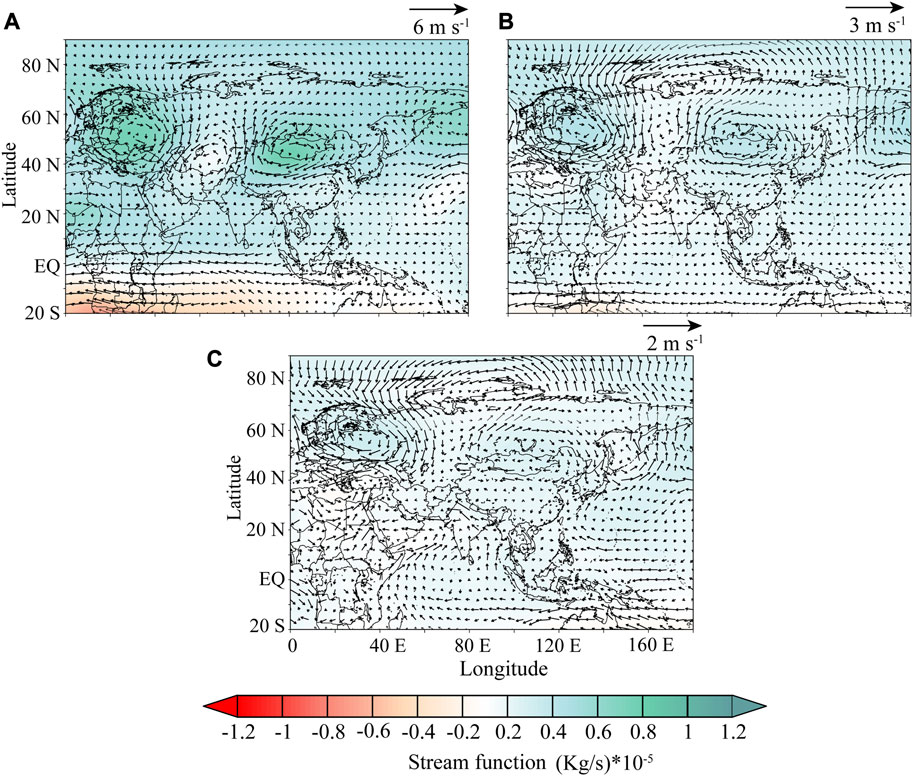
FIGURE 9. Wind components (vectors), and stream function (shaded) difference at (A) 200 hPa, (B) 500 hPa, and (C) 850 hPa.
The divergent wind and velocity potential (Figure 10A) further indicated that a relatively intensified vertical ascent in the study region has been evident in the recent decade. The divergent circulations’ center has exhibited a strong divergent motion with vectors indicating a strong heat source over the SA landmasses and the Bay of Bengal. The difference between the two periods indicates that more precipitation is received in the region than in the first phase, leading to extra latent heat release and stronger vertical ascent. The heat source of the SA monsoon is located over the Tibetan Plateau and has been extensively studied for its thermal controls over the Asian monsoon and exhibited a strong correlation with the precipitation variability over Pakistan (Ullah et al., 2021a; 2022b; 2023). The velocity potential further indicates a consistently intensified ascent of the wind, descending into the Indian Ocean, coastal regions of Somalia, and East Africa.
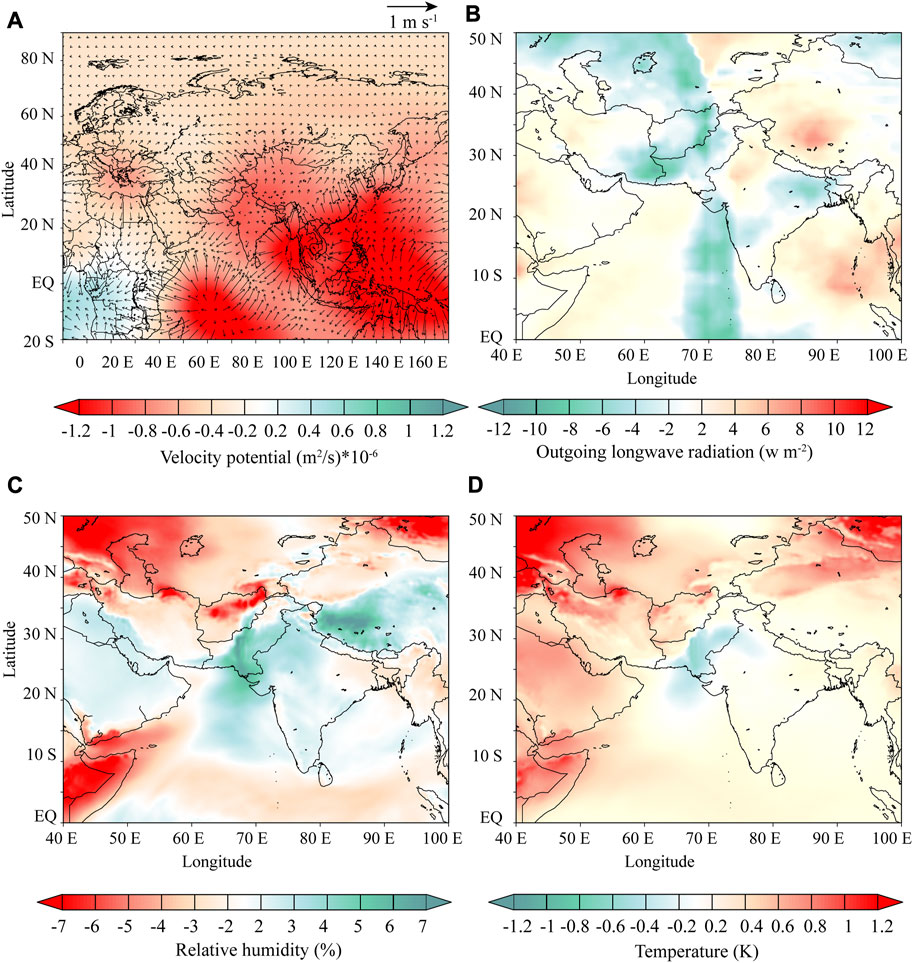
FIGURE 10. The difference in the (A) divergent circulations at 200 hPa, (B) outgoing longwave radiation, (C) relative humidity at 850 hPa, and (D) Temperature at 850 hPa. The difference is calculated by subtracting the first-decade mean (1981–1990) from the last-decade mean (2009–2018) for the respective fields.
The outgoing longwave radiation has been used as a proxy to indicate strong convective activities over the study region (Ullah et al., 2021b). The difference in the outgoing longwave radiation (Figure 10B) showed an intensification of the convective activities over Pakistan and the adjacent Indian Ocean. In addition, a decrease is evident in northwestern India, the Bay of Bengal, and the Arabian Sea region. The study regions’ intensified convection indicates increased vertical motion, condensation aloft, and enhanced precipitation extremes. The decrease (negative anomalies) in OLR indicates an increase in cloud cover due to an increase in the convection leading to extreme precipitation accompanied by other synoptic weather patterns during the monsoon (Lim et al., 2011). For relative humidity at 850 hPa (Figure 10C), an increase in the magnitude was obvious over Pakistan’s eastern and southeastern monsoon regions. The increase accounted for >8% of the mean magnitude from the mean of the first phase, inferring an increase in the region’s lower troposphere’s moisture profile. The northern parts have featured a decrease in the relative humidity’s magnitude. Such a decrease can be disregarded because of terrain-induced biases. Hence, no valid data exist at 850 hPa in those regions. The air temperature at 850 hPa over Pakistan (Figure 10D) indicated a decrease in air temperature’s absolute magnitude from the first phase. Concerning previous figures, the increase in relative humidity and strengthening of the monsoon trough over the study region indicated lower temperatures due to more water vapors in the air, causing cooling through evapotranspiration. The air temperature over the adjacent Indian Ocean was relatively higher, showing a contrast pattern. Such a pattern indicates that over the ocean increase in temperature will also accelerate the convection. The evaporated water vapors are generally transported to the continental regions, resulting in precipitation and cooling the air temperature.
In conclusion, convection and monsoon trough over the study region has intensified, indicating relatively higher precipitation in the country than in the first phase. The global warming-induced changes have shuffled the global water cycle as indicated by the IPCC that the wet regions or seasons will become wetter and warmer at the end of the century (IPCC, 2022). Similar findings are reported in the previous study on a global scale, indicating that the future precipitation in the Asian monsoon domain will be more violent (Trenberth, 2011; Greve et al., 2014; Singh et al., 2014) due to the intensification of the monsoon trough and enhanced monsoon activities over the region. The high-pressure systems’ (South Asian High) movement into the mid-latitude regions is further linked with intensified downstream precipitation patterns due to intensified wind ascent (Wei et al., 2015; Ullah et al., 2021b).
Pakistan is facing a rapid increase in extreme weather events, which resulted in significant socioeconomic and human losses (Atta-ur-Rahman and Khan, 2011; Nanditha et al., 2023). A recent massive flood in August 2022 in Pakistan triggered by increased intensity and duration of monsoon precipitation extremes (Nanditha et al., 2023) and the disastrous floods and severe damages caused by extreme monsoon precipitation over South Asia and East Asia during 2020 are prime examples (Kripalani et al., 2022). The recent floods in Pakistan have affected 33 million people, damaged 1.5 million homes, and caused $2.3 billion in crop damage (Shehzad, 2023). Therefore, the dynamic patterns of regional monsoon extremes and their variabilities need more attention from the scientific community. In response to such facts, this study aims to assess monsoon extreme precipitation spatial and temporal patterns over Pakistan from observations and reanalysis products during 1981–2018 and the associated large-scale circulation mechanism.
The findings revealed an increasing trend in wet days precipitation with a maximum tendency in the northwestern, central, and eastern monsoon-dominant parts. Two types of extreme precipitation trend patterns were obvious, including the moderate and the heavy and very heavy precipitation indices frequency and intensity. The moderate and wet days precipitation increase is centered in the western and northern parts expressing an expanding monsoon domain towards the west as previously explored from the mean spatiotemporal patterns (Jayasankar et al., 2018; Ali et al., 2021). The frequency and intensity of precipitation extremes for heavy and very heavy events increased in the monsoon core region and mixed patterns in the northwestern and southwestern parts of the country. Such an increase, especially in the country’s western and northern parts, infers a westward movement of the monsoon circulations and local precipitation recycling, which has been confirmed by previous studies as well (Hanif et al., 2013; Ali S. et al., 2020; Ullah et al., 2021b). The results also indicate a latitudinal shift in monsoon precipitation and its extremes, which could have significant implications for the northwestern parts of Pakistan. Additionally, Safdar et al. (2019) reported a southeastward shift in the geographical distribution of monsoon precipitation and its extremes during 2010–2017. The heavy and very heavy precipitation extremes intensity and frequency show an erratic to moderate increase in the eastern and central monsoon region of the country that leads to deluges and heavy flooding, as evident from the recent flooding (Atta-ur-Rahman and Shaw, 2015; Qazlbash et al., 2021; Abbas et al., 2023a; Rebi et al., 2023).
According to Abbas et al. (2023a) reported an increase in R1 mm, R10 mm, and R20 mm is evident during the summer monsoon in the eastern, western, and southeastern parts of Pakistan. Such a trend could alter the country’s water resources, crop productivity, and food security in the near future (Ali et al., 2019; Alvar-Beltrán et al., 2021). The results of increasing precipitation extremes agree with the findings of the previous studies in Pakistan (Bhatti et al., 2020; Hussain et al., 2023a), which reported an overall rise in the mean and extreme precipitation in the country. These results are also in line with studies conducted in neighboring countries, like India (Singh et al., 2019; Kripalani et al., 2022), Nepal (Sharma et al., 2023), China (Wu et al., 2019), and Southeast Asia (Cui et al., 2019; Syed et al., 2022), which revealed an increasing trend of monsoon extremes in the stated regions. The increasing tendency of monsoon precipitation extremes in Pakistan and neighboring countries could be attributed to dynamic changes in the global monsoon system, as suggested by studies (Wang et al., 2012; 2017). A similar rate increase in precipitation extremes has been projected in SA monsoon-dominated regions, including Pakistan, by recent modeling studies and is also available in the latest IPCC assessment report (IPCC, 2022; Abbas et al., 2023a). The findings of these studies suggest that South Asia is a climate change-sensitive region, and the increasing trend of observed precipitation extremes could exacerbate the frequency and intensity of hydrometeorological disasters in the region.
On the other hand, the results showed that the frequency and severity of heavy and very heavy precipitation extremes moderately decreased in the country’s northern mountainous region. These outcomes are in line with the findings of recent studies (Hussain et al., 2023a; Rebi et al., 2023), which reported a decreasing trend in precipitation in the northern mountains and the monsoon core region of Pakistan at −4.48 and −1.66 mm/decade during 1960–2016, respectively. The decrease in monsoon precipitation extremes in the northern mountainous region of Pakistan can be attributed to multiple factors. For instance, the inability of the rain gauges to capture extreme precipitation events and/or lack or poor management of precipitation data greatly affect the variability of precipitation extremes in high mountains (Ren et al., 2017; Ullah et al., 2018a). Recent studies reported the existence of uncertainty in hydrometeorological data in mountainous regions, which could lead to misinterpretation of climate extremes, including precipitation extremes (Pellicciotti et al., 2012; Álvarez-Rodríguez et al., 2017; Zhan et al., 2017; Ullah W. et al., 2019).
The temporal variability from the SeqMK of the extreme precipitation indices shows a dominant influence of the large-scale forcing such as the atmospheric forcing (Ullah et al., 2021b), surface forcing (Hussain et al., 2023a), Oceanic (Hussain et al., 2023b), and from the surrounding topography (Wang et al., 2017; Ullah et al., 2021a). The temporal evolution and mutations of the extreme precipitation indices frequency and intensity vividly show peak dry and wet years, reflecting how the regional scale drivers listed above control the changes in precipitation. The probability density function and the moment of distribution further show the influence of the mutations in changing the mean precipitation, the distribution peaks, and the right-tailed shoulders’ expansion towards more extremes during July and August. The projected changes in drivers such extremes as the ENSO, the Indian Ocean, and the Himalayan Tibetan Plateau could further intensify the severity and frequency of these mutations. Indeed other forcing, such as the solar cycle, external forcing, and volcanic forcing, are also responsible for such mutations (Dai and Wang, 2017; Wang et al., 2017). Recent studies indicated that the regional topography in the northwestern mountainous belt of SA, comprised of the Hindukush-Karakoram-Himalaya (HKH) ranges, is also a key factor in modulating the South Asian monsoon precipitation, influencing the frequency and magnitude of precipitation in South Asian countries (Boos and Kuang, 2013; Sun et al., 2017; You et al., 2017). The overall spatiotemporal variability of the precipitation extremes is in line with the findings of the previous studies (Ullah et al., 2018a; Hussain et al., 2021), suggesting that such mutations could be due to the warming and intensification of the SA monsoon circulations (Liu et al., 2007; Ullah et al., 2020; 2021b). Some modeling studies projected that anthropogenic global warming would greatly influence global monsoon regimes’ spatial and temporal dynamics in the coming decades. In a recent study, Ali et al. (2021) projected an increase in the monsoon area in the Upper Indus Basin (UIB) and a northward shift of the monsoon region, indicating frequent and intense precipitation in the northern part of the UIB under higher warming scenario. Such forcing as causal factors of the monsoon extremes need further studies to deeply understand the mechanism. The outcome of these forcing could be seen in the recent flooding and droughts in southern parts of Pakistan in 2022 that claimed capital and human lives in return (Nasir et al., 2020; Qazlbash et al., 2021).
Furthermore, the study revealed enhancement of the mid-latitude westerlies and subtropical zonal easterlies teleconnections, strengthening of the monsoon trough, and land-ocean thermal difference are the possible causes of the increasing trend in precipitation extremes over Pakistan (Figure 8; Figure 9). The correlation strength of the SAH and the extremes indices varies regionally among the indices, indicating that the large-scale shift toward northwestward may suppress the monsoon precipitation over Pakistan and vice versa (Wei et al., 2015). Similar atmospheric and oceanic patterns were reported by previous studies (Latif and Syed, 2016; Ahmed et al., 2020; Ullah et al., 2021b; Abbas et al., 2023b), indicating that the westerlies and easterlies are strengthened (suppressed) during the above (below) normal precipitation composites, while the enhanced (reduced) convective activity in the Indian Ocean acts as a key source of influenced precipitation in the region. It is essential to comprehend how oceanic and atmospheric circulation systems interact with monsoon precipitation and how they influence extreme events to build effective countermeasures to institutional attempts to advance policy solutions (Ndehedehe et al., 2019; Hussain et al., 2023a) Moreover, Hussain et al. (2023a) revealed significant coherences of the North Atlantic Oscillation (NAO) and Arctic Oscillation (AO) with monsoon precipitation in the monsoon region and central and southeastern Pakistan at various scales, which could also be the primary reason for the observed enhanced mid-latitude westerlies. Whereas, no influence of the Indian Summer Monsoon (ISM) was observed in the northern parts of Pakistan, which are located away from the monsoon core region. Some recent studies have partially attributed monsoonal variability and inconsistency to large-scale circulations in Pakistan, such as Indian Ocean Dipole (IOD) and ENSO (Safdar et al., 2019). In the UIB, Ali et al. (2021) noted increased and expanded precipitation in monsoon months (i.e., June, July, and August), which they linked to changes in wind circulation patterns in the Pakistan monsoon-dominated region.
The study further investigated the convective activity over the continental and oceanic masses and its role in monsoon precipitation extremes. The analysis revealed negative anomalies in OLR, indicating enhanced convection over Pakistan and the South Asian area in the recent decade (Figure 10). Recently, Ullah et al. (2021b) employed OLR anomalies as a proxy to pinpoint the convective activity over the continental and oceanic masses during the above- and below-normal composites and observed similar patterns. Similarly, Latif and Syed (2016) analyzed the OLR composite anomaly and saw deep convection moving from the Arabian Sea in a northward direction and from the Bay of Bengal in a northeasterly direction. The OLR anomalies intensify as the monsoon onset approaches Pakistan and flows quickly northward, combining with the other unfavorable anomaly spreading from the Bay of Bengal, bringing deluges to the northern parts of the region. Although this study tried to explore the relationship of monsoon precipitation extremes with large-scale atmospheric circulations, future studies should explore the changes in the atmospheric water contents and related factors for their quantified impacts on the precipitation extremes in Pakistan and neighboring countries. How the regional and large-scale drivers affect the extremes in a time and space domain needs more investigation.
The present study assessed the spatiotemporal variability of daily monsoon (June, July, August, and September) precipitation extremes in Pakistan from observed and reanalysis datasets. A total of seven extreme precipitation indices were used, i.e., wet days (R1 mm), heavy precipitation days (R10 mm), very heavy precipitation days (R20 mm), mean precipitation on a wet day (SDII), maximum 1-day precipitation (Rx1 day), very wet days (R95p TOT), and extremely wet days (R99p TOT). A suite of numerical and statistical computational techniques was used to infer trends in the frequency and intensity of the extreme precipitation indices. The key conclusions of the study are listed below.
• The frequency and intensity of precipitation extremes increased in the monsoon core region (i.e., eastern and northeastern parts), and a westward shift in moderate precipitation. The northern mountainous and southern regions experienced a decrease and erratic pattern in heavy and very heavy precipitation extremes.
• The mutation points in the temporal trend of precipitation extremes consistently reflected increasing (decreasing) shifts during the early 1990s and late 2010s (1997–2002). Likewise, the temporal distribution exhibited an overall increase in the frequency and intensity of extreme precipitation indices with fewer peaks and troughs, indicating the country’s flooding and droughts episodes during the study period.
• Regarding elevation, the frequency and intensity of extreme precipitation exhibited a negative relationship with altitudes, indicating that the monsoon precipitation is decreasing at higher altitudes in Pakistan.
• The PDF showed a significant increase in the frequency and intensity of precipitation during June and September, whereas a probabilistic positive shift during July and August is obvious.
• The possible impacts of the circulation include the mid-latitude teleconnections with a tropical monsoon climate, enhancing frontal weather formation. The lower tropospheric moisture contents, weakening of the monsoon trough, thermal gradient with the ocean, and convective activities suggested an increase in moisture transport to the monsoon domain in the last decade, favoring an increasing trend in extremes.
Further studies can explore the changes in the atmospheric water contents for their quantified impacts on the precipitation extremes. The approaches used in the current study are based on statistical diagnostics and trend approaches, which may be subjected to biases and deviations in results due to the choice of the datasets and scaling, which, however, could not impact the large-scale results.
The original contributions presented in the study are included in the article/Supplementary Material, further inquiries can be directed to the corresponding author.
All authors listed have made a substantial, direct, and intellectual contribution to the work and approved it for publication.
This study is financially supported by the National Natural Science Foundation of China (42275028).
We also acknowledge the Pakistan Meteorological Department for data provision, Rabdan Academy for the article processing charges (APC) payment, and ECMWF, and NCEP/NCAR for their reanalysis data.
The authors declare that the research was conducted in the absence of any commercial or financial relationships that could be construed as a potential conflict of interest.
All claims expressed in this article are solely those of the authors and do not necessarily represent those of their affiliated organizations, or those of the publisher, the editors and the reviewers. Any product that may be evaluated in this article, or claim that may be made by its manufacturer, is not guaranteed or endorsed by the publisher.
Abbas, A., Bhatti, A. S., Ullah, S., Ullah, W., Waseem, M., Zhao, C., et al. (2023a). Projection of precipitation extremes over South Asia from CMIP6 GCMs. J. Arid. Land 15, 274–296. doi:10.1007/s40333-023-0050-3
Abbas, A., Ullah, S., Ullah, W., Waseem, M., Dou, X., Zhao, C., et al. (2022). Evaluation and projection of precipitation in Pakistan using the coupled model intercomparison project phase 6 model simulations. Int. J. Climatol. 42, 6665–6684. doi:10.1002/joc.7602
Abbas, A., Ullah, S., Ullah, W., Zhao, C., Karim, A., Waseem, M., et al. (2023b). Characteristics of winter precipitation over Pakistan and possible causes during 1981–2018. Water (Basel) 15, 2420. doi:10.3390/w15132420
Abbas, A., Waseem, M., Ullah, W., Zhao, C., and Zhu, J. (2021). Spatiotemporal analysis of meteorological and hydrological droughts and their propagations. Water 13, 2237. doi:10.3390/W13162237
Abbas, F., Ahmad, A., Safeeq, M., Ali, S., Saleem, F., Hammad, H. M., et al. (2014). Changes in precipitation extremes over arid to semiarid and subhumid Punjab, Pakistan. Theor. Appl. Climatol. 116, 671–680. doi:10.1007/s00704-013-0988-8
Ahmad, I., Zhang, F., Tayyab, M., Anjum, M. N., Zaman, M., Liu, J., et al. (2018). Spatiotemporal analysis of precipitation variability in annual, seasonal and extreme values over upper Indus River basin. Atmos. Res. 213, 346–360. doi:10.1016/j.atmosres.2018.06.019
Ahmed, F., Adnan, S., and Latif, M. (2020). Impact of jet stream and associated mechanisms on winter precipitation in Pakistan. Meteorology Atmos. Phys. 132, 225–238. doi:10.1007/s00703-019-00683-8
Ahmed, K., Shahid, S., Wang, X., Nawaz, N., and Khan, N. (2019). Spatiotemporal changes in aridity of Pakistan during 1901–2016. Hydrol. Earth Syst. Sci. 23, 3081–3096. doi:10.5194/hess-23-3081-2019
Ali, G., Bao, Y., Ullah, W., Ullah, S., Guan, Q., Liu, X., et al. (2020a). Spatiotemporal trends of aerosols over urban regions in Pakistan and their possible links to meteorological parameters. Atmos. (Basel) 11, 306. doi:10.3390/atmos11030306
Ali, S. H. B., Shafqat, M. N., Eqani, S. A. M. A. S., and Shah, S. T. A. (2019). Trends of climate change in the upper Indus basin region, Pakistan: Implications for cryosphere. Environ. Monit. Assess. 191, 51. doi:10.1007/s10661-018-7184-3
Ali, S., Khalid, B., Kiani, R. S., Babar, R., Nasir, S., Rehman, N., et al. (2020b). Spatio-temporal variability of summer monsoon onset over Pakistan. Asia Pac J. Atmos. Sci. 56, 147–172. doi:10.1007/s13143-019-00130-z
Ali, S., Reboita, M. S., and Kiani, R. S. (2021). 21st century precipitation and monsoonal shift over Pakistan and Upper Indus Basin (UIB) using high-resolution projections. Sci. Total Environ. 797, 149139. doi:10.1016/j.scitotenv.2021.149139
Almazroui, M., Saeed, S., Saeed, F., Islam, M. N., and Ismail, M. (2020). Projections of precipitation and temperature over the South asian countries in CMIP6. Earth Syst. Environ. 4, 297–320. doi:10.1007/s41748-020-00157-7
Álvarez-Rodríguez, J., Llasat, M. C., and Estrela, T. (2017). Analysis of geographic and orographic influence in Spanish monthly precipitation. Int. J. Climatol. 37, 350–362. doi:10.1002/joc.5007
Amin, A., Nasim, W., Mubeen, M., Kazmi, D. H., Lin, Z., Wahid, A., et al. (2017). Comparison of future and base precipitation anomalies by SimCLIM statistical projection through ensemble approach in Pakistan. Atmos. Res. 194, 214–225. doi:10.1016/j.atmosres.2017.05.002
Arshad, M., Kächele, H., Krupnik, T. J., Amjath-Babu, T. S., Aravindakshan, S., Abbas, A., et al. (2017). Climate variability, farmland value, and farmers’ perceptions of climate change: Implications for adaptation in rural Pakistan. Int. J. Sustain. Dev. World Ecol. 24, 532–544. doi:10.1080/13504509.2016.1254689
Befort, D. J., Leckebusch, G. C., and Cubasch, U. (2016). Intraseasonal variability of the Indian summer monsoon: Wet and dry events in COSMO-CLM. Clim. Dyn. 47, 2635–2651. doi:10.1007/s00382-016-2989-7
Bhatti, A. S., Wang, G., Ullah, W., Ullah, S., Fiifi Tawia Hagan, D., Kwesi Nooni, I., et al. (2020). Trend in extreme precipitation indices based on long term in situ precipitation records over Pakistan. Water (Basel) 12, 797. doi:10.3390/w12030797
Boos, W. R., and Kuang, Z. (2013). Sensitivity of the South Asian monsoon to elevated and non-elevated heating. Sci. Rep. 3, 1192. doi:10.1038/srep01192
Cui, D., Wang, C., and Santisirisomboon, J. (2019). Characteristics of extreme precipitation over eastern Asia and its possible connections with Asian summer monsoon activity. Int. J. Climatol. 39, 711–723. doi:10.1002/joc.5837
Dahri, Z. H., Ludwig, F., Moors, E., Ahmad, B., Khan, A., and Kabat, P. (2016). An appraisal of precipitation distribution in the high-altitude catchments of the Indus basin. Sci. Total Environ. 548–549, 289–306. doi:10.1016/j.scitotenv.2016.01.001
Dee, D. P., Uppala, S. M., Simmons, A. J., Berrisford, P., Poli, P., Kobayashi, S., et al. (2011). The ERA-Interim reanalysis: Configuration and performance of the data assimilation system. Q. J. R. Meteorological Soc. 137, 553–597. doi:10.1002/qj.828
Ding, Z., Lu, R., and Wang, Y. (2019). Spatiotemporal variations in extreme precipitation and their potential driving factors in non-monsoon regions of China during 1961–2017. Environ. Res. Lett. 14, 024005. doi:10.1088/1748-9326/aaf2ec
Eckstein, D., and Kreft, S. (2020). Global climate risk index 2021. https://www.germanwatch.org/en/19777.
Fahad, S., and Wang, J. (2019). Climate change, vulnerability, and its impacts in rural Pakistan: A review. Environ. Sci. Pollut. Res. 27 (27), 1334–1338. doi:10.1007/s11356-019-06878-1
Ge, J., You, Q., and Zhang, Y. (2018). Interannual variation of the northward movement of the South asian high towards the Tibetan Plateau and its relation to the asian summer monsoon onset. Atmos. Res. 213, 381–388. doi:10.1016/j.atmosres.2018.06.026
Greve, P., Orlowsky, B., Mueller, B., She, J., Reichstein, M., and Seneviratne, S. I. (2014). Global assessment of trends in wetting and drying over land. Nat. Geosci. 7, 716–721. doi:10.1038/ngeo2247
Haider, S., and Adnan, S. (2014). Classification and assessment of aridity over Pakistan provinces (1960-2009). Int. J. Environ. 3, 24–35. doi:10.3126/ije.v3i4.11728
Hamed, K. H., and Rao, R. A. (1998). A modified Mann-Kendall trend test for autocorrelated data. J. Hydrol. (Amst) 204, 182–196. doi:10.1016/s0022-1694(97)00125-x
Hanif, M., Khan, A. H., and Adnan, S. (2013). Latitudinal precipitation characteristics and trends in Pakistan. J. Hydrol. (Amst) 492, 266–272. doi:10.1016/j.jhydrol.2013.03.040
Hersbach, H., Bell, B., Berrisford, P., Hirahara, S., Horányi, A., Muñoz-Sabater, J., et al. (2020). The ERA5 global reanalysis. Q. J. R. Meteorological Soc. 146, 1999–2049. doi:10.1002/qj.3803
Hong, C. C., Hsu, H. H., Lin, N. H., and Chiu, H. (2011). Roles of European blocking and tropical-extratropical interaction in the 2010 Pakistan flooding. Geophys Res. Lett. 38, 1–6. doi:10.1029/2011gl047583
Hunt, K. M. R., and Fletcher, J. K. (2019). The relationship between Indian monsoon rainfall and low-pressure systems. Clim. Dyn. 53, 1859–1871. doi:10.1007/s00382-019-04744-x
Hussain, A., Cao, J., Ali, S., Ullah, W., Muhammad, S., Hussain, I., et al. (2022). Variability in runoff and responses to land and oceanic parameters in the source region of the Indus River. Ecol. Indic. 140, 109014. doi:10.1016/j.ecolind.2022.109014
Hussain, A., Cao, J., Hussain, I., Begum, S., Akhtar, M., Wu, X., et al. (2021). Observed trends and variability of temperature and precipitation and their global teleconnections in the upper indus basin, Hindukush-Karakoram-Himalaya. Atmos. (Basel) 12, 973–1022. doi:10.3390/atmos12080973
Hussain, A., Hussain, I., Ali, S., Ullah, W., Khan, F., Rezaei, A., et al. (2023a). Assessment of precipitation extremes and their association with NDVI, monsoon and oceanic indices over Pakistan. Atmos. Res. 292, 106873. doi:10.1016/j.atmosres.2023.106873
Hussain, A., Hussain, I., Ali, S., Ullah, W., Khan, F., Ullah, S., et al. (2023b). Spatiotemporal temperature trends over homogenous climatic regions of Pakistan during 1961–2017. Theor. Appl. Climatol. 153, 397–415. doi:10.1007/s00704-023-04484-3
Hussain, M., Tayyab, M., Ullah, K., Ullah, S., Rahman, Z. U., Zhang, J., et al. (2023c). Development of a new integrated flood resilience model using machine learning with GIS-based multi-criteria decision analysis. Urban Clim. 50, 101589. doi:10.1016/j.uclim.2023.101589
IPCC (2022). Climate change 2022: The physical science basis. Working group-I contribution to the Sixth assessment report. Cambridge, England: Cambridge University Press.
Ishaque, W., Osman, R., Hafiza, B. S., Malghani, S., Zhao, B., Xu, M., et al. (2023). Quantifying the impacts of climate change on wheat phenology, yield, and evapotranspiration under irrigated and rainfed conditions. Agric. Water Manag. 275, 108017. doi:10.1016/j.agwat.2022.108017
Jayasankar, C. B., Rajendran, K., and Surendran, S. (2018). Monsoon climate change projection for the orographic west coast of India using high-resolution nested dynamical downscaling model. J. Geophys. Res. Atmos. 123, 7821–7838. doi:10.1029/2018jd028677
Kale, V. (2012). On the link between extreme floods and excess monsoon epochs in South Asia. Clim. Dyn. 39, 1107–1122. doi:10.1007/s00382-011-1251-6
Khan, A. A., Zhao, Y., khan, J., Rahman, G., Rafiq, M., and Moazzam, M. F. U. (2021). Spatial and temporal analysis of rainfall and drought condition in southwest xinjiang in northwest China, using various climate indices. Earth Syst. Environ. 5, 201–216. doi:10.1007/s41748-021-00226-5
Khan, I., Waqas, T., Ullah, S., and Ullah, S. (2020). Precipitation variability and its trend detection for monitoring of drought hazard in northern mountainous region of Pakistan. Arabian J. Geosciences 13, 1–18. doi:10.1007/s12517-020-05700-4
Kidd, C., Becker, A., Huffman, G. J., Muller, C. L., Joe, P., Skofronick-Jackson, G., et al. (2017). So, how much of the Earth’s surface is covered by rain gauges? Bull. Am. Meteorol. Soc. 98, 69–78. doi:10.1175/BAMS-D-14-00283.1
Kripalani, R., Ha, K.-J., Ho, C.-H., Oh, J.-H., Preethi, B., Mujumdar, M., et al. (2022). Erratic asian summer monsoon 2020: COVID-19 lockdown initiatives possible cause for these episodes? Clim. Dyn. 59, 1339–1352. doi:10.1007/s00382-021-06042-x
Latif, M., and Syed, F. S. (2016). Determination of summer monsoon onset and its related large-scale circulation characteristics over Pakistan. Theor. Appl. Climatol. 125, 509–520. doi:10.1007/s00704-015-1530-y
Lau, W. K. M., and Kim, K.-M. (2012). The 2010 Pakistan flood and Russian heat wave: Teleconnection of hydrometeorological extremes. J. Hydrometeorol. 13, 392–403. doi:10.1175/jhm-d-11-016.1
Liebmann, B., and Smith, C. A. (1996). Description of a complete (interpolated) outgoing longwave radiation dataset. Bull. Am. Meteorol. Soc. 77, 1275–1277.
Lim, E. S., Wong, C. J., Abdullah, K., and Poon, W. K. (December 2011). Relationship between outgoing longwave radiation and rainfall in South East Asia by using NOAA and TRMM satellite. in Proc. 2011 IEEE Colloquium Humanit. Sci. Eng. (IEEE), Penang, Malaysia, 785–790. doi:10.1109/CHUSER.2011.6163843
Liu, Y., Bao, Q., Duan, A., Qian, Z., and Wu, G. (2007). Recent progress in the impact of the Tibetan Plateau on climate in China. Adv. Atmos. Sci. 24, 1060–1076. doi:10.1007/s00376-007-1060-3
Lu, C., Jiang, J., Chen, R., Ullah, S., Yu, R., Lott, F. C., et al. (2021). Anthropogenic influence on 2019 may–june extremely low precipitation in southwestern China. Bull. Am. Meteorol. Soc. 102, S97–S102. doi:10.1175/bams-d-20-0128.1
Martius, O., Sodemann, H., Joos, H., Pfahl, S., Winschall, A., Croci-Maspoli, M., et al. (2013). The role of upper-level dynamics and surface processes for the Pakistan flood of July 2010. Q. J. R. Meteorological Soc. 139, 1780–1797. doi:10.1002/qj.2082
McColl, K. A., Alemohammad, S. H., Akbar, R., Konings, A. G., Yueh, S., and Entekhabi, D. (2017). The global distribution and dynamics of surface soil moisture. Nat. Geosci. 10, 100–104. doi:10.1038/ngeo2868
Mujumdar, M., Preethi, B., Sabin, T. P., Ashok, K., Saeed, S., Pai, D. S., et al. (2012). The Asian summer monsoon response to the La Ni na˜ event of 2010. Meteorol. Appl. 19, 216–225. doi:10.1002/met.1301
Nanditha, J. S., Kushwaha, A. P., Singh, R., Malik, I., Solanki, H., Chuphal, D. S., et al. (2023). The Pakistan flood of August 2022: Causes and implications. Earths Future 11. doi:10.1029/2022EF003230
Naveendrakumar, G., Vithanage, M., Kwon, H.-H., Chandrasekara, S. S. K., Iqbal, M. C. M., Pathmarajah, S., et al. (2019). South asian perspective on temperature and rainfall extremes: A review. Atmos. Res. 225, 110–120. doi:10.1016/j.atmosres.2019.03.021
Ndehedehe, C. E., Anyah, R. O., Alsdorf, D., Agutu, N. O., and Ferreira, V. G. (2019). Modelling the impacts of global multi-scale climatic drivers on hydro-climatic extremes (1901–2014) over the Congo basin. Sci. Total Environ. 651, 1569–1587. doi:10.1016/j.scitotenv.2018.09.203
Pathak, A., Ghosh, S., Kumar, P., and Murtugudde, R. (2017). Role of oceanic and terrestrial atmospheric moisture sources in intraseasonal variability of Indian summer monsoon rainfall. Sci. Rep. 7, 12729–12811. doi:10.1038/s41598-017-13115-7
Pellicciotti, F., Buergi, C., Immerzeel, W. W., Konz, M., and Shrestha, A. B. (2012). Challenges and uncertainties in hydrological modeling of remote hindu kush–karakoram–himalayan (HKH) basins: Suggestions for calibration strategies. Mt. Res. Dev. 32, 39–50. doi:10.1659/mrd-journal-d-11-00092.1
Preethi, B., Ramya, R., Patwardhan, S. K., Mujumdar, M., and Kripalani, R. H. (2019). Variability of Indian summer monsoon droughts in CMIP5 climate models. Clim. Dyn. 53, 1937–1962. doi:10.1007/s00382-019-04752-x
Raghavan, K., Sabin, T. P., Mujumdar, M., and Priya, P. (2012). Extreme monsoon precipitation events over South Asia in a warming world. Geophys. Res. Abstr. 14, 47583.
Rahman, A., and Dawood, M. (2017). Spatio-statistical analysis of temperature fluctuation using Mann–Kendall and Sen’s slope approach. Clim. Dyn. 48, 783–797. doi:10.1007/s00382-016-3110-y
Rahman, A. ur, and Khan, A. N. (2011). Analysis of flood causes and associated socioeconomic damages in the Hindukush region. Nat. Hazards 59, 1239–1260. doi:10.1007/s11069-011-9830-8
Rahman, K. U., Hussain, A., Ejaz, N., Shang, S., Balkhair, K. S., Jan, K. U. K., et al. (2023a). Analysis of production and economic losses of cash crops under variable drought: A case study from Punjab province of Pakistan. Int. J. Disaster Risk Reduct. 85, 103507. doi:10.1016/j.ijdrr.2022.103507
Rahman, Z. U., Ullah, W., Bai, S., Ullah, S., Jan, M. A., Khan, M., et al. (2023b). GIS-based flood susceptibility mapping using bivariate statistical model in Swat River Basin, Eastern Hindukush region, Pakistan. Front. Environ. Sci. 11. doi:10.3389/fenvs.2023.1178540
Rasmussen, K. L., Hill, A. J., Toma, V. E., Zuluaga, M. D., Webster, P. J., and Houze, R. A. (2015). Multiscale analysis of three consecutive years of anomalous flooding in Pakistan. Q. J. R. Meteorological Soc. 141, 1259–1276. doi:10.1002/qj.2433
Rebi, A., Hussain, A., Hussain, I., Cao, J., Ullah, W., Abbas, H., et al. (2023). Spatiotemporal precipitation trends and associated large-scale teleconnections in northern Pakistan. Atmos. (Basel) 14, 871. doi:10.3390/atmos14050871
Ren, Y. Y., Ren, G. Y., Sun, X. B., Shrestha, A. B., You, Q. L., Zhan, Y. J., et al. (2017). Observed changes in surface air temperature and precipitation in the Hindu Kush Himalayan region over the last 100-plus years. Adv. Clim. Change Res. 8, 148–156. doi:10.1016/j.accre.2017.08.001
Safdar, F., Khokhar, M. F., Arshad, M., and Adil, I. H. (2019). Climate change indicators and spatiotemporal shift in monsoon patterns in Pakistan. Adv. Meteorology 2019, 1–14. doi:10.1155/2019/8281201
Salman, S. A., Shahid, S., Ismail, T., Chung, E. S., and Al-Abadi, A. M. (2017). Long-term trends in daily temperature extremes in Iraq. Atmos. Res. 198, 97–107. doi:10.1016/j.atmosres.2017.08.011
Sen, P. Kumar. (1968). Estimates of the regression coefficient based on kendall’s tau. J. Am. Stat. Assoc. 63, 1379–1389. doi:10.1080/01621459.1968.10480934
Sharma, S., Hamal, K., Pokharel, B., Fosu, B., Wang, S.-Y. S., Gillies, R. R., et al. (2023). Atypical forcing embedded in typical forcing leading to the extreme summer 2020 precipitation in Nepal. Clim. Dyn. 61, 3845–3856. doi:10.1007/s00382-023-06777-9
Sharma, P. J., Loliyana, V. D., Timbadiya, P. V., and Patel, P. L. (2018). Spatiotemporal trends in extreme rainfall and temperature indices over Upper Tapi Basin, India. Theor. Appl. Climatol. 134, 1329–1354. doi:10.1007/s00704-017-2343-y
Shehzad, K. (2023). Extreme flood in Pakistan: Is Pakistan paying the cost of climate change? A short communication. Sci. Total Environ. 880, 162973. doi:10.1016/j.scitotenv.2023.162973
Shen, L., Wen, J., Zhang, Y., Ullah, S., Cheng, J., and Meng, X. (2022a). Changes in population exposure to extreme precipitation in the Yangtze River Delta, China. Clim. Serv. 27, 100317. doi:10.1016/j.cliser.2022.100317
Shen, L., Wen, J., Zhang, Y., Ullah, S., Meng, X., and Chen, G. (2022b). Performance evaluation of ERA5 extreme precipitation in the yangtze river delta, China. Atmos. (Basel) 13, 1416. doi:10.3390/atmos13091416
Shen, L., Zhang, Y., Ullah, S., Pepin, N., and Ma, Q. (2021). Changes in snow depth under elevation-dependent warming over the Tibetan Plateau. Atmos. Sci. Lett. 22, 1–12. doi:10.1002/asl.1041
Singh, D., Ghosh, S., Roxy, M. K., and McDermid, S. (2019). Indian summer monsoon: Extreme events, historical changes, and role of anthropogenic forcings. WIREs Clim. Change 10. doi:10.1002/wcc.571
Singh, D., Tsiang, M., Rajaratnam, B., and Diffenbaugh, N. S. (2014). Observed changes in extreme wet and dry spells during the South Asian summer monsoon season. Nat. Clim. Chang. 4, 456–461. doi:10.1038/nclimate2208
Sneyers, (1990). On the statistical analysis of series of observations. Geneva, Switzerland: World Meteorological Organization.
Sulla-Menashe, D., and Friedl, M. (2019). MCD12Q1 MODIS/Terra+Aqua land cover type yearly L3 global 500m SIN grid V006. Reston, Virginia, USA: United States Geological Survey.
Sun, X., Ren, G., Shrestha, A. B., Ren, Y., You, Q., Zhan, Y., et al. (2017). Changes in extreme temperature events over the hindu kush himalaya during 1961–2015. Adv. Clim. Change Res. 8, 157–165. doi:10.1016/j.accre.2017.07.001
Syed, A., Zhang, J., Rousta, I., Olafsson, H., Ullah, S., Moniruzzaman, M., et al. (2022). Statistical analysis of precipitation variations and its forecasting in Southeast Asia using remote sensing images. Front. Environ. Sci. 10. doi:10.3389/fenvs.2022.832427
Tapiador, F. J., Turk, F. J., Petersen, W., Hou, A. Y., García-Ortega, E., Machado, L. A. T., et al. (2012). Global precipitation measurement: Methods, datasets and applications. Atmos. Res. 104–105, 70–97. doi:10.1016/j.atmosres.2011.10.021
Tapiador, F. J., Navarro, A., Jiménez, A., Moreno, R., and García-Ortega, E. (2018). Discrepancies with satellite observations in the spatial structure of global precipitation as derived from global climate models. Q. J. R. Meteorological Soc. 144, 419–435. doi:10.1002/qj.3289
Toreti, A., Kuglitsch, F. G., Xoplaki, E., Della-Marta, P. M., Aguilar, E., Prohom, M., et al. (2011). A note on the use of the standard normal homogeneity test to detect inhomogeneities in climatic time series. Int. J. Climatol. 31, 630–632. doi:10.1002/joc.2088
Trenberth, K. E. (2011). Changes in precipitation with climate change. Clim. Res. 47, 123–138. doi:10.3354/cr00953
Turner, A. G., and Annamalai, H. (2012). Climate change and the South Asian summer monsoon. Nat. Clim. Chang. 2, 587–595. doi:10.1038/nclimate1495
Ullah, S., You, Q., Ullah, W., and Ali, A. (2018a). Observed changes in precipitation in China-Pakistan economic corridor during 1980–2016. Atmos. Res. 210, 1–14. doi:10.1016/j.atmosres.2018.04.007
Ullah, S., You, Q., Ali, A., Ullah, W., Jan, M. A., Zhang, Y., et al. (2019a). Observed changes in maximum and minimum temperatures over China- Pakistan economic corridor during 1980–2016. Atmos. Res. 216, 37–51. doi:10.1016/j.atmosres.2018.09.020
Ullah, S., You, Q., Sachindra, D. A., Nowosad, M., Ullah, W., Bhatti, A. S., et al. (2022a). Spatiotemporal changes in global aridity in terms of multiple aridity indices: An assessment based on the CRU data. Atmos. Res. 268, 105998–106014. doi:10.1016/j.atmosres.2021.105998
Ullah, S., You, Q., Ullah, W., and Ali, A. (2018b). Observed changes in precipitation in China-Pakistan economic corridor during 1980–2016. Atmos. Res. 210, 1–14. doi:10.1016/j.atmosres.2018.04.007
Ullah, S., You, Q., Ullah, W., Ali, A., Xie, W., and Xie, X. (2019b). Observed changes in temperature extremes over China-Pakistan Economic Corridor during 1980-2016. Int. J. Climatol. 39, 1457–1475. doi:10.1002/joc.5894
Ullah, S., You, Q., Ullah, W., Hagan, D. F. T., Ali, A., Ali, G., et al. (2019c). Daytime and nighttime heat wave characteristics based on multiple indices over the China–Pakistan economic corridor. Clim. Dyn. 53, 6329–6349. doi:10.1007/s00382-019-04934-7
Ullah, S., You, Q., Wang, G., Ullah, W., Sachindra, D. A., Yan, Y., et al. (2022b). Characteristics of human thermal stress in South Asia during 1981–2019. Environ. Res. Lett. 17, 104018. doi:10.1088/1748-9326/ac8fa6
Ullah, S., You, Q., Zhang, Y., Bhatti, A. S., Ullah, W., Hagan, D. F. T., et al. (2020). Evaluation of CMIP5 models and projected changes in temperatures over South Asia under global warming of 1.5 °C, 2 °C and 3 °C. Atmos. Res. 246, 1–18. doi:10.1016/j.atmosres.2020.105122
Ullah, W., Guojie, W., Gao, Z., Tawia Hagan, D. F., Bhatti, A. S., and Zhua, C. (2021a). Observed linkage between Tibetan plateau soil moisture and South Asian summer precipitation and the possible mechanism. J. Clim. 34, 361–377. doi:10.1175/JCLI-D-20-0347.1
Ullah, W., Guojie, W., Lou, D., Ullah, S., Bhatti, A. S., Ullah, S., et al. (2021b). Large-scale atmospheric circulation patterns associated with extreme monsoon precipitation in Pakistan during 1981–2018. Atmos. Res. 253, 1–6. doi:10.1016/j.carrev.2020.06.004
Ullah, W., Wang, G., Ali, G., Tawia Hagan, D., Bhatti, A., and Lou, D. (2019d). Comparing multiple precipitation products against in-situ observations over different climate regions of Pakistan. Remote Sens. (Basel) 11, 628–725. doi:10.3390/rs11060628
Ullah, W., Zhu, C., Wang, G., Hagan, D. F. T., Lou, D., Wei, J., et al. (2023). Soil moisture-constrained East Asian Monsoon meridional patterns over China from observations. NPJ Clim. Atmos. Sci. 6, 4. doi:10.1038/s41612-023-00331-4
Venkata Rao, G., Venkata Reddy, K., Srinivasan, R., Sridhar, V., Umamahesh, N. V., and Pratap, D. (2020). Spatio-temporal analysis of rainfall extremes in the flood-prone Nagavali and Vamsadhara Basins in eastern India. Weather Clim. Extrem 29, 100265. doi:10.1016/j.wace.2020.100265
Vinnarasi, R., and Dhanya, C. T. (2016). Changing characteristics of extreme wet and dry spells of Indian monsoon rainfall. J. Geophys. Res. Atmos. 121, 2146–2160. doi:10.1002/2015JD024310
Wang, P., Wang, B., and Kiefer, T. (2012). Global monsoon across timescales. Clim. Dyn. 39, 1043–1044. doi:10.1007/s00382-012-1459-0
Wang, P. X., Wang, B., Cheng, H., Fasullo, J., Guo, Z. T., Kiefer, T., et al. (2017). The global monsoon across time scales: Mechanisms and outstanding issues. Earth Sci. Rev. 174, 84–121. doi:10.1016/j.earscirev.2017.07.006
Waqas, A., and Athar, H. (2019). Spatiotemporal variability in daily observed precipitation and its relationship with snow cover of Hindukush, Karakoram and Himalaya region in northern Pakistan. Atmos. Res. 228, 196–205. doi:10.1016/j.atmosres.2019.06.002
Webster, P. J., Toma, V. E., and Kim, H. M. (2011). Were the 2010 Pakistan floods predictable? Geophys Res. Lett. 38, 1–5. doi:10.1029/2010gl046346
Wei, W., Zhang, R., Wen, M., Kim, B.-J., and Nam, J.-C. (2015). Interannual variation of the South asian high and its relation with Indian and East asian summer monsoon rainfall. J. Clim. 28, 2623–2634. doi:10.1175/JCLI-D-14-00454.1
Wei, W., Zou, S., Duan, W., Chen, Y., Li, S., and Zhou, Y. (2023). Spatiotemporal variability in extreme precipitation and associated large-scale climate mechanisms in Central Asia from 1950 to 2019. J. Hydrol. (Amst) 620, 129417. doi:10.1016/j.jhydrol.2023.129417
Wu, Y., Ji, H., Wen, J., Wu, S.-Y., Xu, M., Tagle, F., et al. (2019). The characteristics of regional heavy precipitation events over eastern monsoon China during 1960–2013. Glob. Planet Change 172, 414–427. doi:10.1016/j.gloplacha.2018.11.001
Xie, H., Ringler, C., Zhu, T., and Waqas, A. (2016). Droughts in Pakistan: A spatiotemporal variability analysis using the standardized precipitation index. Water Food Secur. Challenges Pak. 38, 620–631. doi:10.1080/02508060.2013.827889
Xie, W., Zhou, B., You, Q., Zhang, Y., and Ullah, S. (2020). Observed changes in heat waves with different severities in China during 1961–2015. Theor. Appl. Climatol. 141, 1529–1540. doi:10.1007/s00704-020-03285-2
Yamada, T. J., Takeuchi, D., Farukh, M. A., and Kitano, Y. (2016). Climatological characteristics of heavy rainfall in northern Pakistan and atmospheric blocking over western Russia. J. Clim. 29, 7743–7754. doi:10.1175/jcli-d-15-0445.1
You, Q., Ren, G., Zhang, Y., Ren, Y., Sun, X., Zhan, Y., et al. (2017). An overview of studies of observed climate change in the Hindu Kush Himalayan (HKH) region. Adv. Clim. Change Res. 8, 141–147. doi:10.1016/j.accre.2017.04.001
Yu, Y., You, Q., Zuo, Z., Zhang, Y., Cai, Z., Li, W., et al. (2023). Compound climate extremes in China: Trends, causes, and projections. Atmos. Res. 286, 106675. doi:10.1016/j.atmosres.2023.106675
Zhan, Y. J., Ren, G. Y., Shrestha, A. B., Rajbhandari, R., Ren, Y. Y., Sanjay, J., et al. (2017). Changes in extreme precipitation events over the Hindu Kush Himalayan region during 1961–2012. Adv. Clim. Change Res. 8, 166–175. doi:10.1016/j.accre.2017.08.002
Zhang, L., Zhou, T., Chen, X., Wu, P., Christidis, N., and Lott, F. C. (2020). The late spring drought of 2018 in South China. Bull. Am. Meteorol. Soc. 101, S59–S64. doi:10.1175/BAMS-D-19-0202.1
Zhang, X., Alexander, L., Hegerl, G. C., Jones, P., Tank, A. K., Peterson, T. C., et al. (2011). Indices for monitoring changes in extremes based on daily temperature and precipitation data. Wiley Interdiscip. Rev. Clim. Change 2, 851–870. doi:10.1002/wcc.147
Keywords: extreme precipitation indices, sub-seasonal precipitation extremes, westerlies teleconnections, south asian high, Pakistan
Citation: Ullah W, Karim A, Ullah S, Rehman A-U, Bibi T, Wang G, Ullah S, Bhatti AS, Ali G, Abbas A, Hagan DFT, Nooni IK, Zhu C and Hussain A (2023) An increasing trend in daily monsoon precipitation extreme indices over Pakistan and its relationship with atmospheric circulations. Front. Environ. Sci. 11:1228817. doi: 10.3389/fenvs.2023.1228817
Received: 25 May 2023; Accepted: 30 August 2023;
Published: 08 September 2023.
Edited by:
Haipeng Yu, Chinese Academy of Sciences (CAS), ChinaReviewed by:
Bushra Khalid, Chinese Academy of Sciences (CAS), ChinaCopyright © 2023 Ullah, Karim, Ullah, Rehman, Bibi, Wang, Ullah, Bhatti, Ali, Abbas, Hagan, Nooni, Zhu and Hussain. This is an open-access article distributed under the terms of the Creative Commons Attribution License (CC BY). The use, distribution or reproduction in other forums is permitted, provided the original author(s) and the copyright owner(s) are credited and that the original publication in this journal is cited, in accordance with accepted academic practice. No use, distribution or reproduction is permitted which does not comply with these terms.
*Correspondence: Guojie Wang, Z3dhbmdAbnVpc3QuZWR1LmNu
Disclaimer: All claims expressed in this article are solely those of the authors and do not necessarily represent those of their affiliated organizations, or those of the publisher, the editors and the reviewers. Any product that may be evaluated in this article or claim that may be made by its manufacturer is not guaranteed or endorsed by the publisher.
Research integrity at Frontiers
Learn more about the work of our research integrity team to safeguard the quality of each article we publish.