
94% of researchers rate our articles as excellent or good
Learn more about the work of our research integrity team to safeguard the quality of each article we publish.
Find out more
ORIGINAL RESEARCH article
Front. Environ. Sci., 22 August 2023
Sec. Social-Ecological Urban Systems
Volume 11 - 2023 | https://doi.org/10.3389/fenvs.2023.1225888
 Chen Chen
 Yufeng Xu*
Guizhou Province is located in the karst mountain regions of Southwest China, where the ecological environment is extremely fragile and particularly sensitive to human activities. Therefore, understanding the changing characteristics and driving factors of human activity in recent decades is urgent. In this study, least squares, correlation analysis, spatial autocorrelation analysis, and GeoDetector model were used. Based on a large collection of nightlight, topography, and meteorological data, combined with geographical information technology, we investigated the spatial distribution, intensity change, and degree of impact of human activity from 2000 to 2020. The results showed that during the study period, human activities intensity and range were expanding. The human activity areas expanded from 15,963 to 86,923 km2 at an increasing rate of 4,279.2 km2/a, which was 1,118.4 km2/a from 2000 to 2010 and 6,375.3 km2/a from 2010 to 2020. The human activity intensity increased from 0.009 to 0.018, with an increasing rate of 0.0006/a, which was 0.00028/a from 2000 to 2010 and 0.00073/a from 2010 to 2020. The rate of increase in the human activity intensity and the rate of expansion in the human activity range from 2010–2020 were significantly higher than that from 2000–2010, becoming more notable (p ≤ 0.01), especially after 2012. With the expansion of human activities, the center of gravity of human activity moved towards the northeast by 20.71 km. The human activities were primarily distributed in areas with the gentlest slopes (6–15°), middle and low altitudes (489–1,982 m), suitable temperatures (12.36–17.74°C), and abundant precipitation (1,001.99–1,276.99 mm). The research results using the GeoDetector model indicate that slope had the greatest impact on human activities with a q value of 0.1338; precipitation, elevation, and temperature had q values of 0.0626, 0.0253, and 0.0136, respectively. The combined impact between the precipitation and slope was the greatest with a q value of 0.1803. In Guizhou Province, under policy guidance, human activities that promoted vegetation change accounted for 79.60%. This study attempts to enhance sustainable development and provides valuable information on the environmental protection of karst mountain regions.
Increasing human activity intensity is the most significant feature of social development. It is undeniable that human activities increasingly impact the environment. Understanding the intensity and distribution of human activities, the extent of their influence, and their impacts are pressing issues that require solutions. Therefore, quantitative studies of human activities have consistently dominated related research on human activities. Previous studies mainly use statistical yearbooks, population, and land-use data on construction and cultivated land to analyze the intensity of human activities (Hao et al., 2018; Small et al., 2018; Song et al., 2018; Huang et al., 2020; Silva et al., 2020). Some researchers have attempted to analyze the impact of human activities on vegetation quality using indirect methods, such as residual analysis (Jiang et al., 2017; Zheng et al., 2019).
Human activities are spatially heterogeneous, with complex and diverse influencing factors. GeoDetectors have become crucial for detecting spatial heterogeneity and influencing factors (Xu et al., 2018) and have been used in studies on disease transmission (Xu et al., 2019; Xie et al., 2020), human tourism activities (Liu et al., 2018; Pan et al., 2021), heavy metal accumulation in urban soil (Shi et al., 2018), spatial heterogeneity of the vegetation distribution, and analyses of the driving force (Yuan, 2019; Zhu, 2020; Hong and Sun, 2021). Therefore, the spatial heterogeneity and driving forces of human activities in the study area were analyzed by using the GeoDetector model.
The advancement of remote sensing technology has facilitated research on human activities using night light data, with increasing data acquisition and research achievements. The nighttime light index (NLI) is closely related to human activities (Zhao et al., 2022), reflecting the temporal and spatial changes in populations (Kong et al., 2019), urban built-up areas (Yudhistira et al., 2019; He et al., 2020; Yang et al., 2021), urban development (Wu et al., 2019; Guo et al., 2020), energy (electricity) consumption (Xiao et al., 2018; Falchetta and Noussan, 2019), and carbon emissions (Zhao et al., 2018). Therefore, night light data were used to analyze the temporal and spatial distribution, change characteristics, and impact of human activity on vegetation quality.
Guizhou Province is a typical karst area (Li, 2019), with the most extensive karst landscape coverage in China (Wang et al., 2004). The fragility of the karst ecosystem is a serious threat to the survival of the local population and the development of the social economy (Wcang et al., 2004; Gutiérrez et al., 2014; Liao et al., 2018). Human activity is a major cause of karst ecosystem degradation (Parise and Pascali, 2003; Day, 2010; Jiang et al., 2017). Changes in vegetation quality directly reflect the environmental impact of human activities while the normalized difference vegetation index (NDVI) has been used to determine vegetation quality and evaluate desertification and land degradation (Li, 20191; Pedro et al., 2020). Guizhou is a vulnerable region for vegetation, facing ecological risks closely linked to human activities (Zhao and Hou, 2019). State and local governments have implemented projects with notable success to protect the ecological environment (Qiao et al., 2021). Therefore, the scope of human activities and their impacts on vegetation requires further investigation, particularly the influence of policy guidance.
Taking Guizhou Province as an example, this paper aims to determine the spatio-temporal heterogeneity and influencing factors on human activities. Using the normalized NLI based on the dimidiate pixel model, the degrees of the scope and human activity influence in Guizhou Province were determined using geographic information systems (GIS). Using precipitation, temperature, slope, and altitude, spatio-temporal heterogeneity and factors influencing human activities were analyzed using the GeoDetector model and spatial correlation analysis. The human activity impacts on vegetation quality were also analyzed using correlation methods. The findings can guide human activities in karst mountain regions in Southwest China. In addition, they may provide theoretical support for the development of karst mountain regions and vegetation protection.
Guizhou Province is located in the Yunnan-Guizhou Plateau (103°36′–109°35′E, 24°37′–29°13′N). There is a humid subtropical monsoon climate in this region, with an annual average temperature of 15°C and annual rainfall ranging from 600 to 1,400 mm (Zhao and Hou, 2019). This area is one of the three major karst regions in the world (Zhou et al., 2017). Mountainous areas (gradient > 25° and relative fluctuation > 200 m) account for 61.7% of the area and karst landforms account for 73% (Luo and Wang, 2019). Guizhou Province is affected by severe environmental challenges such as soil erosion and rocky desertification. Guizhou Province has implemented the Grain to Green Project, Natural Forest Conservation Program, public welfare forest protection, karst ecological restoration, and other important projects since 1999 (Qiao et al., 2020). The gross domestic product (GDP) growth rate of Guizhou has been ranked first in China for 10 consecutive years since 2012. Infrastructure construction in this area has undergone historic changes. Currently, 30 ecological civilization system reform achievements are on the national promotion list.
Night light data were obtained from the China Long Time-Series Night Light Dataset (2000–2020) from the Global Change Science Research Data Publishing System (http://www.geodoi.ac.cn). The spatial resolution of the EANTLI-like night-light dataset from 2000 to 2020 was 1 km.
NDVI data were obtained from the MOD13Q1 product data from the National Aeronautics and Space Administration (NASA) (https://ladsweb.modaps.eosdis.nasa.gov). The resolution was 250 m and the original time resolution was 16 d. Therefore, comprehensive NDVI data covering 2000–2020 were obtained using the maximum synthesis method. Python and MRT were used to preprocess the data after download. The ArcGIS platform was then used for data calculation and creating charts.
The meteorological data used in this study were obtained from the monthly average temperature (Peng, 2019) and precipitation (Peng, 2020) dataset from the National Tibetan Plateau Scientific Data Center (https://data.tpdc.ac.cn/). The selected time spanned 2001–2020 and the spatial resolution was 1 km. This dataset is based on the CRU global 0.5° climate dataset issued by the National Center for Atmospheric Sciences, United Kingdom, and the global high-resolution climate dataset published by World Climate. This dataset was generated in China using a delta spatial downscaling scheme. In addition, 496 independent meteorological observation data points were used for verification, with reliable results (Peng et al., 2017; Peng et al. 2018; Peng et al. 2019; Ding and Peng. 2020). The annual temperature was calculated as the average of the monthly temperature; precipitation was calculated as the monthly cumulative value.
Digital Elevation Model data were obtained from the Resource and Environmental Science Data Center of the Chinese Academy of Sciences (http://www.resdc.cn). This dataset was generated by collating and splicing provisional data from the most recent SRTM V4.1 data. The resolution was 90 m, the data type was img, and the projection was UTM/WGS84.
The ArcGIS platform was used for projection conversion, clipping, and operations to obtain the data for this study. In addition, the “Slope” function of the “Spatial Analyst” module in the ArcGIS platform was used to process and obtain slope and other data.
The total population (10,000 people) and urban population (10,000 people) were derived from statistical data from the Guizhou Provincial Macroeconomic Database, which can be found on the main board of the Guizhou Provincial Bureau of Statistics (http://hgk.guizhou.gov.cn). In addition, the GDP (100 million yuan), built-up area (km2), number of buses (vehicles), total number of passengers (10,000 persons), and taxis (vehicles) were obtained from the China Statistical Yearbook on the website for the National Bureau of Statistics (http://www.stats.gov.cn/tjsj./ndsj). The data were collected from 2000 to 2020.
Land use and cover change (LUCC) data were obtained from the Resource and Environmental Science Data Center of the Chinese Academy of Sciences (http://www.resdc.cn). The spatial resolution was 1 km. These data were classified using the LUCC classification system, which is widely used in China. The land use types were divided into six first-class land types: cultivated land, forestland, grassland, water area, construction land, and unused land. The land use data for 2000, 2010, and 2020 were first selected for this study. Then, the scope of this study was determined based on the administrative boundary of the study area. Finally, the ArcGIS platform was used to extract the corresponding research data for analysis and calculation. Spatial data were cropped and calculated on the ArcMap 10.2 platform using the administrative boundaries of the study area.
This study used nighttime light data to reflect human activities. First, the nighttime light index was reduced based on the administrative boundary of the study area. The image was then normalized using the pixel-dichotomy model, calculated as follows:
where Yi represents the nighttime light index (dimensionless) after normalization of the ith pixel, Li represents the nighttime light index of the ith pixel, Lmin represents the minimum nighttime light index over the study period in the study area, and Lmax represents the maximum nighttime light index in the study area.
A GeoDetector is a statistical method for analyzing the spatial heterogeneity of factors and explaining the underlying factors. It comprises a risk detector, factor detector, ecological detector, and interaction detector that can be used to quantitatively detect and identify various interactions between spatial distribution attributes and their explanatory factors (Wang and Xu. 2017). It was used to analyze the explanatory power (i.e., q value) of each driving factor on the distribution of a geographical object using quantitative detection of spatial heterogeneity. The formula for the q value is as follows:
where
The least squares method was used in this study to analyze the pixel-by-pixel change rule of images (i.e., annual change rate) based on the MATLAB platform. The calculation formula is as follows, taking the NDVI as an example:
where i represents the serial number of the year,
The F-test was used to determine the significance of the changing trend, calculated as follows:
where
The correlative analysis method was used to measure the closeness of two or more variables by analyzing them with correlation, calculated as follows:
where
The land use transfer matrix depicts the land use/cover structure and its type and direction of change. This reflects the dynamic processes that drive land use changes over time. The general formula for the land-use transfer matrix is as follows:
where Si is the land-use type area before the transfer, Sj is the land-use type area after the transfer, i = 1,2,3 … n, j = 1,2,3 … n, and n is the number of land-use types.
The global Moran index can be sued to reveal the aggregation of the spatial factor layout as a whole (Zhao et al., 2020), calculated as follows:
where n represents the number of samples,
The local Moran index, LISA, is used for local spatial autocorrelation analysis to reveal the high-high and low-low spatial concentration areas of human activities and to understand the local spatial distribution characteristics:
where the definition of each parameter in Eq. 8 is the same as that in Eq. 7.
Spatial correlation was calculated using the ArcMap 10.2 platform. The spatial rate of change and significance test were performed using the MATLAB platform. Linear correlations were analyzed using SPSS 20.0. Spatial autocorrelation analysis was performed using GeoDa.
The analysis revealed that the range and intensity of human activities extracted based on the NLI were positively correlated with the selected indicators; in particular, the urban population, GDP, built-up area (km2), number of buses (vehicles), total number of passengers (10,000 person times), and number of taxis (vehicles) were significantly positively correlated at the 0.05 level (Table 1). In summary, the NLI-derived human activity intensity and range could effectively reflect relevant human activities.
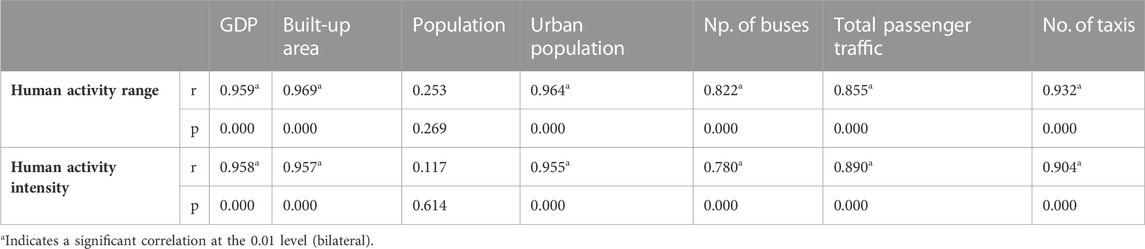
TABLE 1. Correlations between HAI-human activities index, human activity range, and factors based on night light extraction. GDP–gross domestic product.
The degree of influence of the factors related to human activities (HA) can be analyzed from space using the GeoDetector model. The analysis results showed that the q value of construction land to the spatial heterogeneity of human activity area calculated based on the NLI was 0.8347 according to land-use type data from the Chinese Academy of Sciences classification system.
Spatial analysis of the extent of the NLI revealed that in 2000, 2010, and 2020, 77.58, 84.98, and 93.76% of the built-up land area, respectively, coincided with the NLI area. However, the range of the nighttime lighting index was significantly larger than that of construction land.
This was significantly higher than that of other land-use types (note: these findings were obtained by analyzing land-use data from the Resources and Environment Center of the Chinese Academy of Sciences). These results showed that the spatial distribution of human activities reflected by the NLI could accurately reflect the spatial status of human activities.
Human activities accounted for 57.78% of the total study area from 2000 to 2020, with a significant annually increasing trend (y = 4,279.2x—2080.5, R2 = 0.8564), in particular from 2012 to 2013 (Figures 1K–O). Human activities were more extensive and intensive in the central and southwestern regions than in the eastern region. Human activities in Guizhou Province were relatively intense during this period in regions where the prefectures and municipal governments were located, in particular in the central and southwest regions, such as Guiyang, Zunyi, Anshun, Liupanshui, and Xingyi (Figure 1E). Regarding time, the intensity of human activities increased significantly (y = 0.0006x + 0.0068, R2 = 0.9043), particularly in 2012 (Figures 1L–O). Regarding space, 97.56% of the human activity area showed an increasing trend in human activity, 86.05% of the total area of human activity showed a significant increasing trend, 2.44% of the regions showed a weakening trend, and 0.84% of the regions showed a significant weakening trend. The intensity and area of human activities in Guizhou Province increased from 2000 to 2020. Human activities in Guiyang City were the most visible. In addition, human activities increased significantly at the government stations of Zunyi, Anshun, Liupanshui, Xingyi, Tongren, Qiannan, Qiandongnan, Bijie, and other prefectures and cities, and in other county areas. However, there was a notable decrease in human activity in the southwestern part of the study area (Figure 1G).
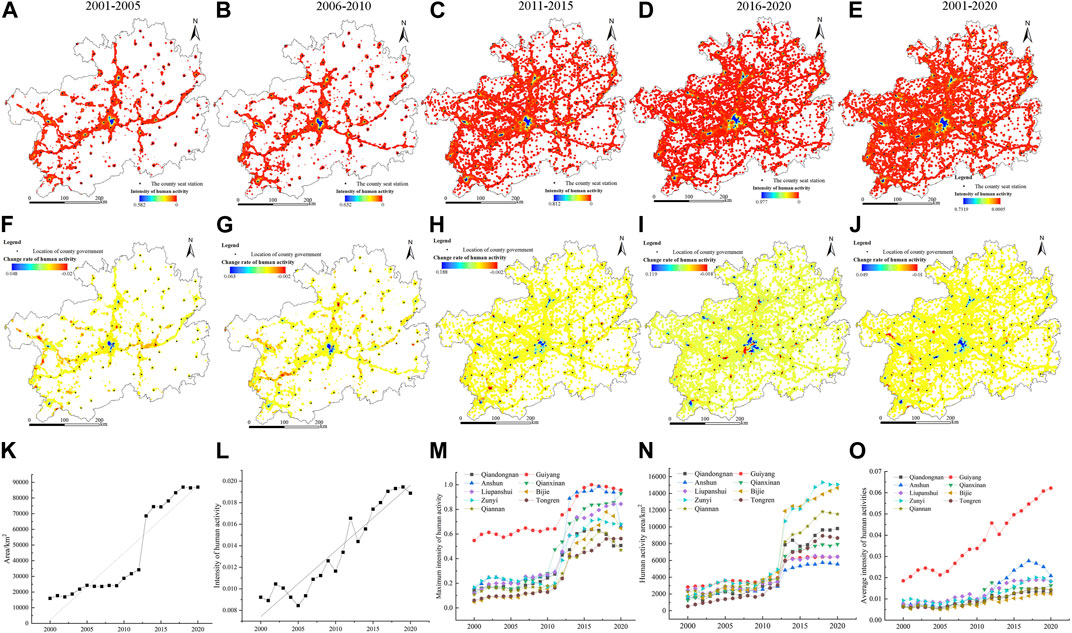
FIGURE 1. (A–E) Average values of HAI and (F–G) changes in the human activity intensity from 2001 to 2005, 2006–2010, 2010–2015, 2016–2020, and 2001–2020. (K) Area of human activities and (L) intensity of human activities from 2000 to 2020. (M) Maximum value of human activity, (N) range of human activity, and (O) average value of human activity intensity in each prefecture and city from 2000 to 2020.
Human activity accounted for 15.67% of the total study area from 2000 to 2005. The regions with increased human activity accounted for 66.34% of the total human activity area, and 35.42% of the regions showed a significant increase. Reduced human activity areas accounted for 33.66% of the total human activity area, with 12.53% showing a significant reduction. The scope of human activities was limited at this stage of the study. However, human activities increased significantly in Guiyang, Zunyi, Anshun, Liupanshui, Xingyi, and other regions. The increase in human activities was most visible in the trend of cities as the focal point, with a gradual weakening (Figures 1A,F).
From 2006 to 2010, the area of human activities accounted for 18.39% of the total study area. The overall performance in this stage was an increase in human activity, which continued to increase in intensity and scope, with the strongest intensity and scope occurring in the city. However, the southwestern region of the study area (e.g., Weining County) showed a trend of weakening human activity and a narrowing scope. Human activities in the southeastern region of the study area showed a notable trend of belt enhancement due to the construction of roads and other infrastructure (Figures 1B,G).
Human activity accounted for 44.60% of the total study area from 2011 to 2015. The area accounting for 95.49% of the total human activity area showed an increasing trend, with a significant increase in the area accounting for 67.16%. Human activities decreased in the area accounting for 4.51% of the total area of human activities, with 1.10% showing a significant decrease. The area of human activity at this stage was significantly larger than that in the previous stage. Human activities in some counties weakened due to policy adjustments and other reasons. However, overall human activities were expanding in scope and intensity. Due to road construction, human activities were more clearly distributed in strips in the southeast and northeast (Figures 1C,H).
Human activities accounted for 55.03% of the total study area from 2016 to 2020. The area accounting for 66.83% of the total human activity area increased, with 30.25% showing a significant increase. The area accounting for 33.17% of the human activity decreased, with 10.53% showing a significant decrease. Compared to the previous stage, the scope of human activities continued to increase along with the overall intensity of human activities. At this stage, the intensity of human activities in the north and east of the study area increased significantly. In contrast, some urban areas in the middle and southeast of the study area weakened due to policy changes and other human activities. In contrast, human activities in rural residential areas increased significantly, particularly in the southeast and north of the study area. The banding development of human activities caused by infrastructure construction, such as roads, remained visible, in particular in the south and east of the study area (Figures 1D,I).
We analyzed the shifts in human activities, NDVI, temperature, and precipitation gravity centers in four stages in Guizhou Province from 2000 to 2005, 2006–2010, 2011–2015, and 2016–2020, on a 5-year interval basis (Figure 2).
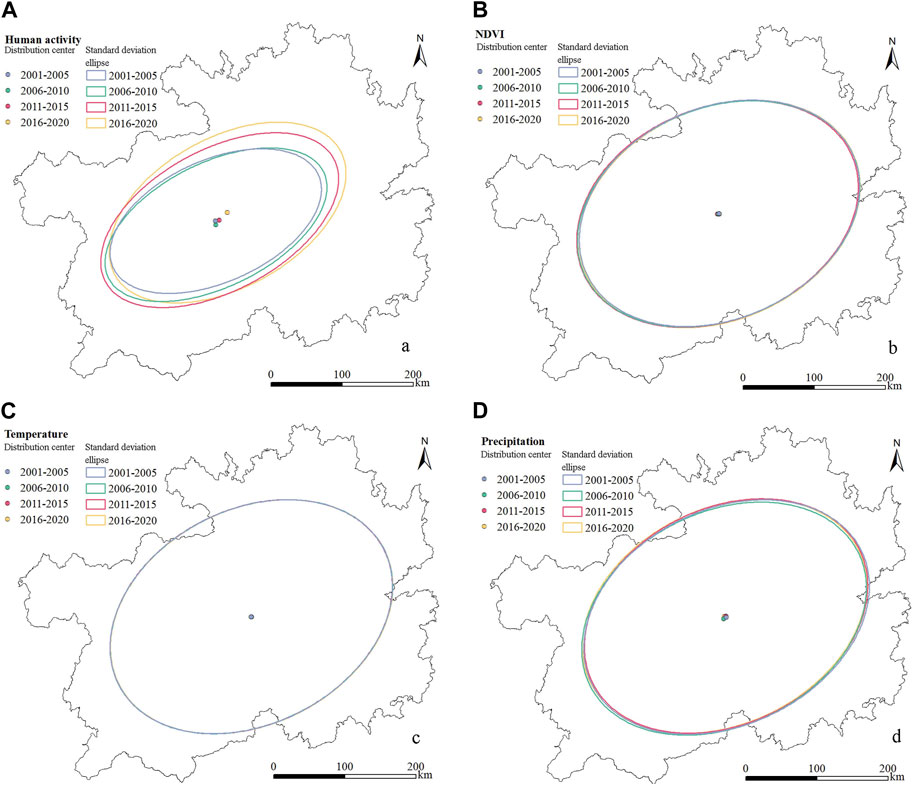
FIGURE 2. (A) Standard deviation ellipse (SDE) and focus of human activities, (B) normalized difference vegetation index (NDVI), (C) temperature, and (D) precipitation in Guizhou Province from 2001 to 2005, 2006–2010, 2011–2015, and 2016–2020.
During the study period, the concentrated area of human activity intensity moved 20.71 km to the northeast. According to the specific changes in each stage, the focus of human activities moved 5.8 km southward from 2006 to 2010 compared to 2000–2005; from 2011 to 2015, the focus of human activity intensity moved 8.92 km to the northeast compared to 2006–2010; and from 2016 to 2020, it continued to migrate to the northeast by 15.37 km compared to 2011–2015. The distribution direction of human activities in Guizhou Province did not change, indicating a northeast–southwest direction according to the SDE. The spatial distribution direction of human activities has become increasingly notable over time (Figure 2A).
Temperature and precipitation were relatively stable among the meteorological factors; the SDE and focus of each research period were consistent. The NDVI was also relatively stable, with small variations in the SDE and focus migration. The SDE direction and focus position of the temperature, precipitation, and NDVI were consistent (Figures 2B–D). In summary, except for significant spatial changes in human activities during the study period, the NDVI and temperature were relatively stable and precipitation showed minor spatial changes.
The local Moran’s index (LMI) and local indicators of spatial association (LISA) were used to show the spatial concentration distribution of human activities (Figures 2A–E) and its significance (Figures 3F,G). The global Moran’s index (GMI) was used to reveal the aggregated spatial factor layout (Figures 2K–O). An increase or decrease in the GMI indicated that the factor space was contracting or expanding, respectively.
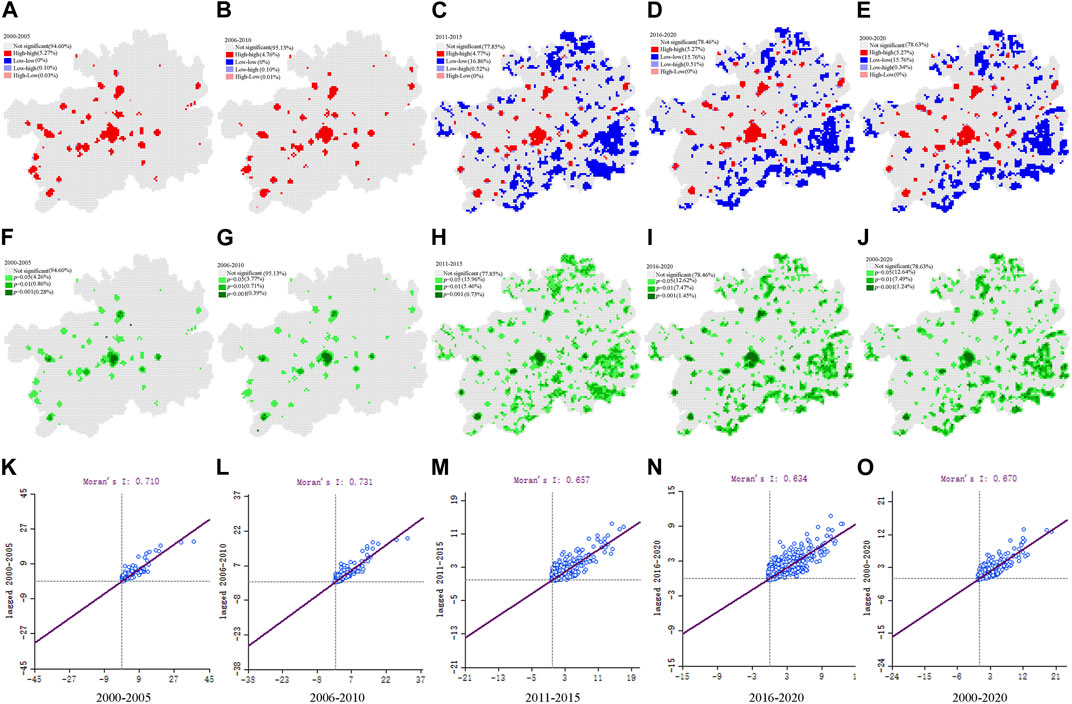
FIGURE 3. (A–E) local Moran’s index (LMI), spatial association (LISA) diagram of human activities (HA) and (F,G) its significance. (K–O) global Moran’s index (GMI) in Guizhou Province from 2000 to 2005, 2006–2010, 2011–2015, 2016–2020, and 2000–2020.
The GMI was 0.710 from 2000–2005 (Figure 3K), indicating a high degree of aggregation. According to the LMI, human activities were mainly concentrated in the middle and southwest of Guizhou (Figures 3A,F).
The GMI was 0.731 from 2006 to 2010 (Figure 3L), and the spatial concentration of human activities increased. According to the LMI, human activities were mainly concentrated in the middle and southwest of Guizhou, with an increasing trend in the northeast of Guizhou (Figures 3B,G).
The GMI was 0.657 from 2011 to 2015 (Figure 3M), indicating that the aggregation of human activities in this stage was lower than that from 2006 to 2010. However, the scope of human activities expanded significantly during this stage. According to the LMI, high-value areas of human activity were still concentrated in the middle and southwest of Guizhou while low-value areas were in the southeast and north of Guizhou at this stage, indicating that human activities in this area began to increase. However, compared to the original high-value areas of HA, HA in this area remained low (Figures 3C,H).
The GMI was 0.634 from 2016 to 2020 (Figure 3N), which was more extensive than the range of human activities in the previous stage. According to the LMI, there was a greater concentration of low-value areas in the southwest of Guizhou, with the appearance of new high-value areas (Figures 3D,I).
In summary, Moran’s index was 0.670 (Figure 3O), indicating that human activity had relatively notable aggregation from 2000 to 2020. According to the LMI, the human activity intensity and level of urban development were high in the middle, southwest, and northeast of Guizhou. Conversely, the HAI and level of urban development were relatively low in the north, west, and southeast of Guizhou. The reduction in the aggregation of HA, as indicated by the spatial change in the LMI, also indicated that the scope of HA in Guizhou expanded during the study period (Figures 3E,J).
In terms of altitude, Guizhou had low altitudes in the southeast and east, higher altitudes in the middle and west, and the highest altitudes in the southwest (Figure 4B). In terms of slope, 0°–5° slopes accounted for 27.33% of Guizhou, 6°–15° slopes accounted for 48.08%, 16°–25° slopes accounted for 19.34%, 26°–35° slopes accounted for 4.53%, 36°–45° slopes accounted for 0.65%, and > 46° slopes accounted for only 0.06%. The terrain of Guizhou was relatively smooth in the middle and rugged in the west, southwest, and south (Figure 4C).
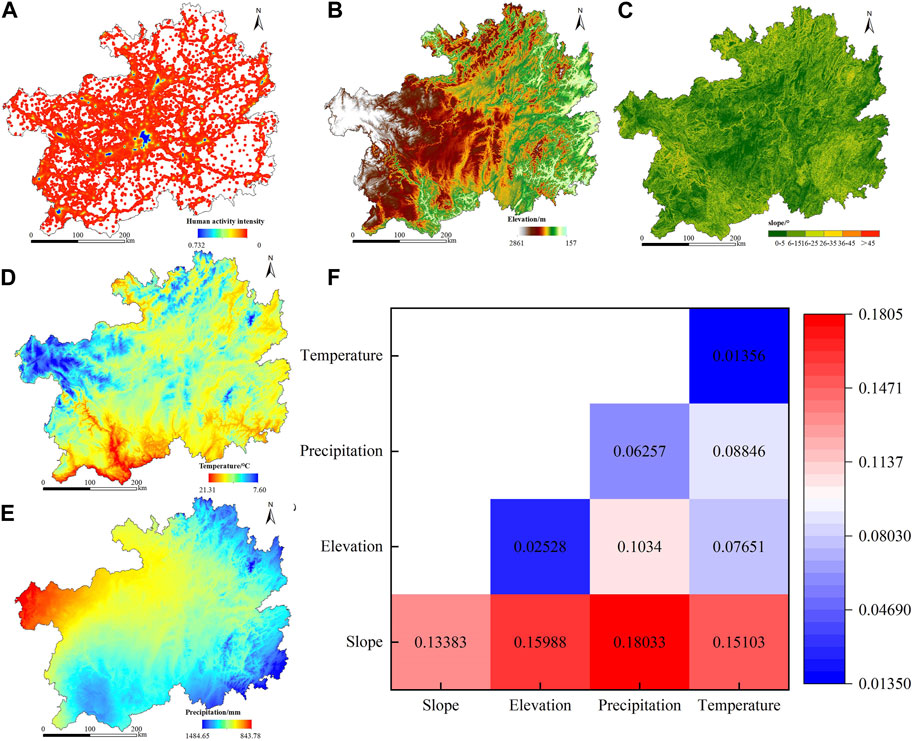
FIGURE 4. (A) Analysis of factors influencing the spatial heterogeneity of HA and the main natural factors during the study period: (B) altitude, (C) slope (D) temperature, (E) precipitation, and (F) the spatial heterogeneity of human activities in Guizhou based on geodetectors.
The annual average temperature in Guizhou was > 7°C. The regions with higher average temperatures were in the east, southeast, and northeast. The regions with lower average temperatures were in the middle. Those with the lowest temperatures were in the west (Figure 4D). Annual precipitation in the study area exceeded 800 mm, with more precipitation in the east than in the west, more in the south than in the north, and gradually decreasing from the southeast to the northwest (Figure 4E). Low temperatures and less precipitation occurred in the middle and west; whereas, higher temperatures and more precipitation occurred in the east, southeast, and northeast.
The spatial distribution effects of elevation, slope, temperature, and precipitation on the spatial heterogeneity of HA were analyzed using the GeoDetectors model. The factors influencing the spatial heterogeneity of human activity intensity in Guizhou Province were the slope, precipitation, altitude, and temperature, ranging from high to low based on the degree of impact. Furthermore, the factor works better in combination with other factors than a single factor (Figure 4F).
Terrain factors significantly impacted human activities in Guizhou Province, with slope factors having a more significant impact than altitude factors. Therefore, human activity was concentrated in low-lying areas. The analysis of concentrated human activity areas (normalized value > 0.1) revealed that human activity intensity areas were mainly distributed in areas with a gradient of 1°–21° (based on 95% of the areas with a normal distribution). Therefore, human activities were concentrated primarily in areas with the gentlest slopes (6°–15°), accounting for 51.47% of the total area of HA. The area with flat slopes (0°–5°) accounted for 39.78%, and the area with 16°–25° slopes accounted for 8.76%. Using the same method, we found that human activities were primarily distributed in areas with an altitude from 489 to 1,982 m, temperatures from 12.36°C to 17.74°C, and precipitation from 1,001.99 to 1,276.99 mm.
In summary, HA were mainly distributed in areas with gentle slopes, higher precipitation, lower altitudes, and higher temperatures in the study area. The factor works better in combination with other factors than a single factor. Slope and precipitation had the greatest impacts.
The ranges of significant positive correlations between precipitation and human activity were slightly higher than that of temperature based on spatial distribution. However, overall, precipitation and temperature significantly impacted human activities, particularly the combination of water and heat (Figures 5A,B; Table 2).
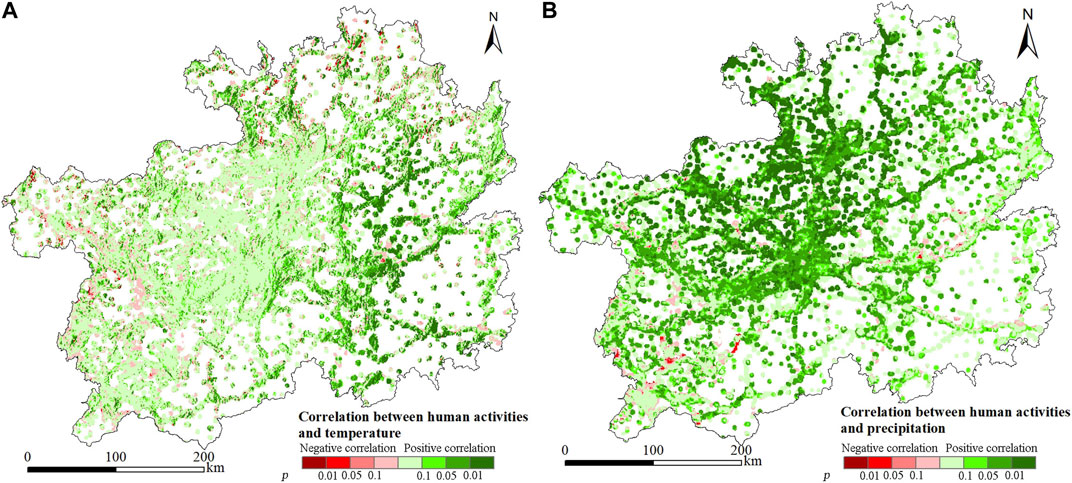
FIGURE 5. Spatial correlation between human activities and (A) temperature and (B) precipitation.
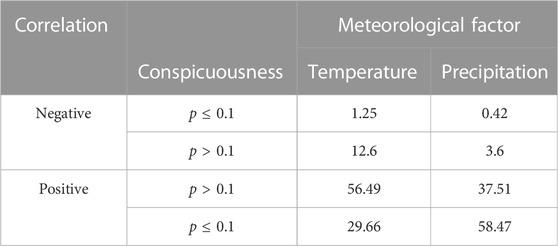
TABLE 2. Proportion of correlation between human activities (HA) and temperature and precipitation in total human activity area (%).
The NDVI value was lower in regions with high HAI and higher in areas with low HAI. The mean NDVI of the study area was 0.823 and that of the human activity area was 0.812. Low NDVI values were found in all areas with high human activity, particularly in urban areas (Figure 6A).
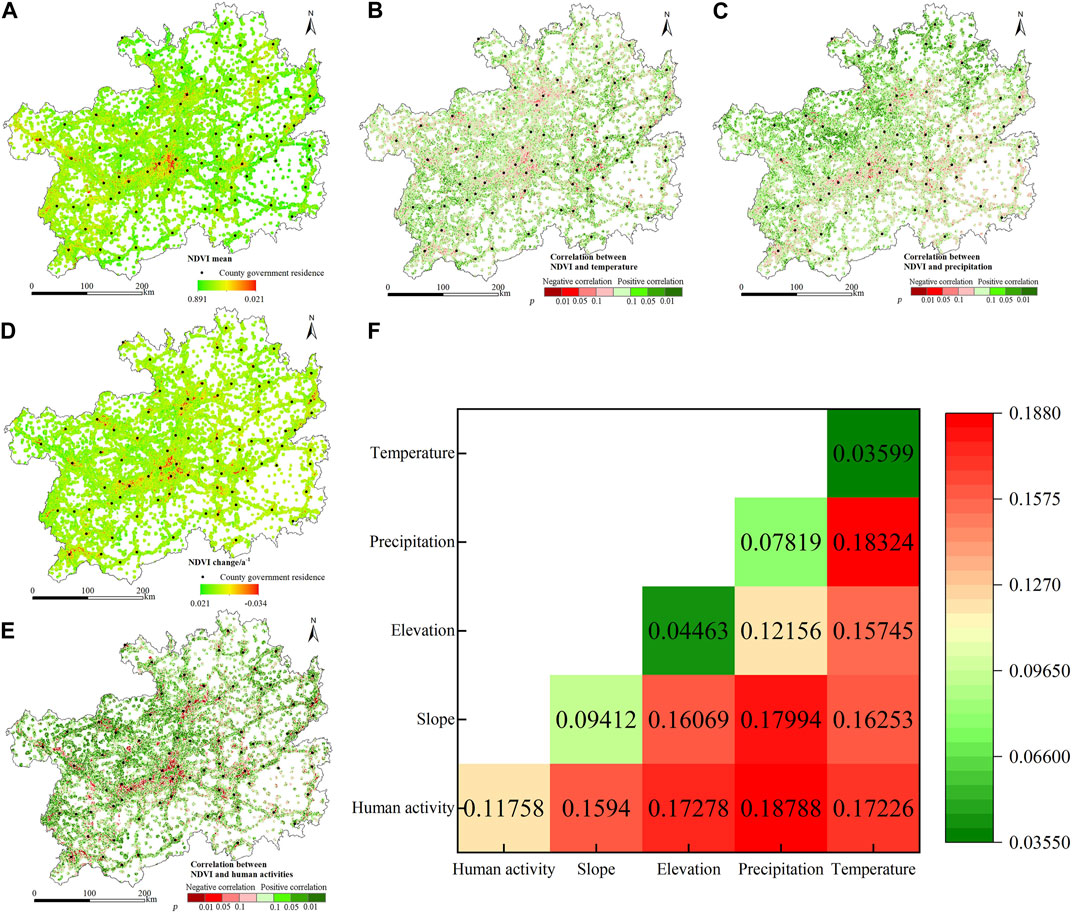
FIGURE 6. Spatial heterogeneity of the normalized difference vegetation index (NDVI) in human activity areas in Guizhou. Correlations between (A) NDVI and temperature, (B) NDVI and precipitation, (C) NDVI changes, and (D) NDVI and human activity. (E) Spatial heterogeneity of the NDVI in the study area and (F) its influencing factors based on geodetectors.
In both Guizhou Province and the human activity area, the rate of change in the NDVI showed a large area occupied by an increase and significant increase. The proportion of NDVI reduction and a significant reduction trend in the human activity area was slightly higher than in Guizhou (Figure 6D; Table 3).
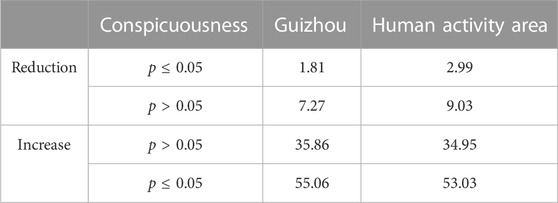
TABLE 3. Area ratio of normalized difference vegetation index (NDVI) change trend in different regions (%).
Based on the driving force analysis of the NDVI in Guizhou using the GeoDetector model, we found that human activities were the most important influencing factor of the NDVI distribution in Guizhou, followed by slope, precipitation, altitude, and temperature, which had small effects. Moreover, the effect of each factor acting in combination with other factors was greater than the effect of each factor acting in isolation. The combined effect of human activities and precipitation had the most significant impact on the spatial heterogeneity of the NDVI (Figure 6F).
Regarding the correlation between meteorological factors and NDVI, the difference in the proportion of various correlations between the NVDI and meteorological factors in anthropogenic regions and Guizhou was small. The proportion of areas showing a significant positive correlation between human activities and NDVI was significantly larger than that of meteorological factors. However, we note that the proportion of areas showing a significant negative correlation between human activities and NDVI was also greater than that of the meteorological factors (Figures 6B,C,E; Table 4).
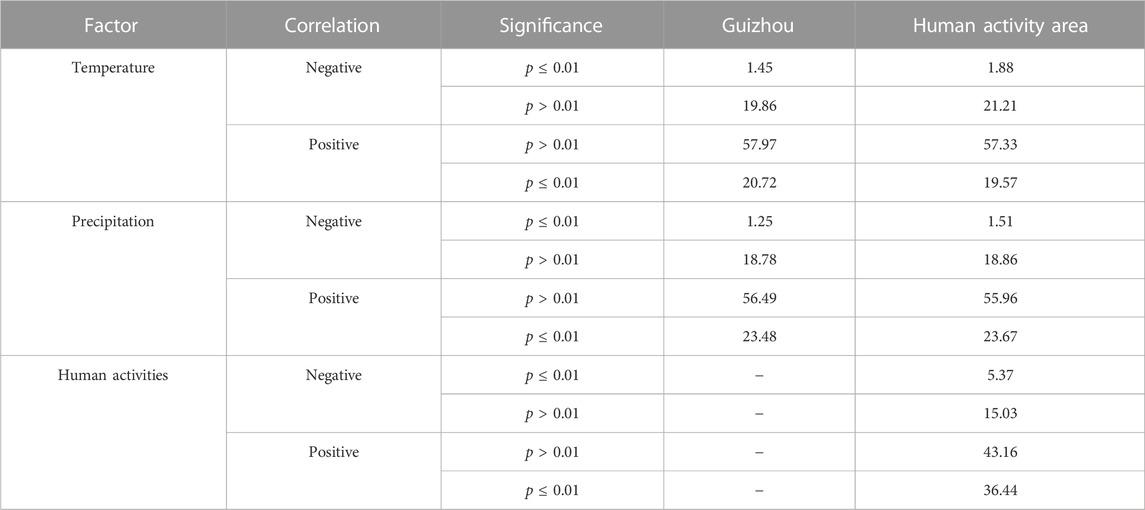
TABLE 4. Spatial analysis of the proportion of area occupied by the correlation between different factors and normalized difference vegetation index (NDVI) (%).
Human activities had a significant influence on changes in the NDVI. Human activities and NDVI in human activity areas mainly showed positive and significant positive correlations. Furthermore, the significantly negative correlation between human activities and NDVI was greater than that between natural factors and NDVI. HA generally had a significant impact on NDVI. Human activities were mostly negatively and significantly negatively correlated with the NDVI in urban areas. In contrast, human activities in mountainous areas at a certain distance from cities were mostly positively and significantly positively correlated with the NDVI (Figure 6).
Analyzing the correlation between the various land-use types and NDVI from the spatial distribution, woodland had the most significant effect on the spatial distribution of the NDVI in Guizhou Province, followed by changing areas, cropland, and built-up land. In contrast, grassland, water bodies, and unused land had less of an influence on the spatial distribution of the NDVI in the study area (Figure 7D).
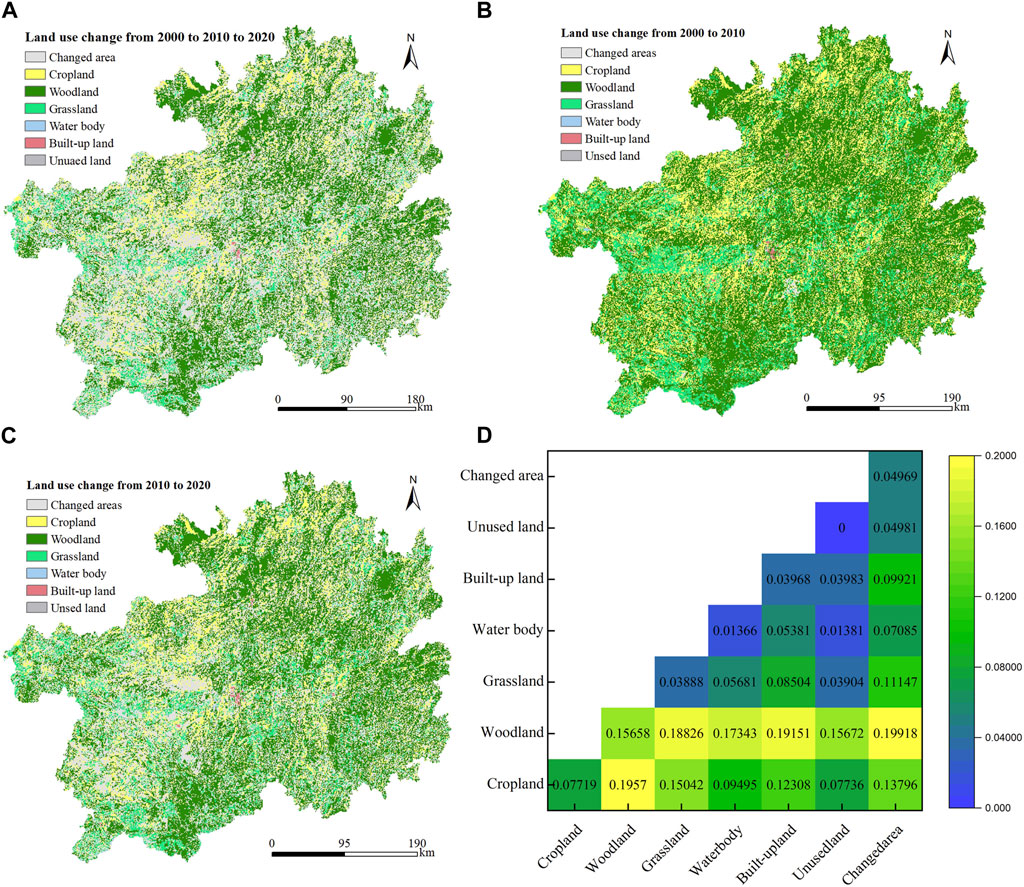
FIGURE 7. Land-use information atlas from (A) 2000–2010-2020, (B) 2000–2010, and (C) 2010–2020. (D) Impact of land use based on geodetectors on the spatial distribution heterogeneity of the normalized difference vegetation index (NDVI).
The land-use information atlas was examined from 2000 to 2020 (Figure 7A). The transferred land-use types represented 31.05% of the total area of Guizhou. The conversion of farmland to woodland from 2010 to 2020 represented 11.46% of the area of Guizhou. Cropland was converted into grassland from 2010 to 2020, representing 4.47% of the area of Guizhou. These changes were mainly due to human activities, such as converting cropland to woodland and grassland.
Land-use transfer occurred more frequently from 2010 to 2020 than from 2000 to 2010. Conversions between cropland and woodland, and between cropland and grassland, were the most frequent and notable. The areas of woodland and grassland converted to cropland were greater than that of cropland converted to woodland and grassland. Overall, human activities were the main drivers of land-use type changes in Guizhou during the study period (Figures 7B,C; Tables 5, 6).
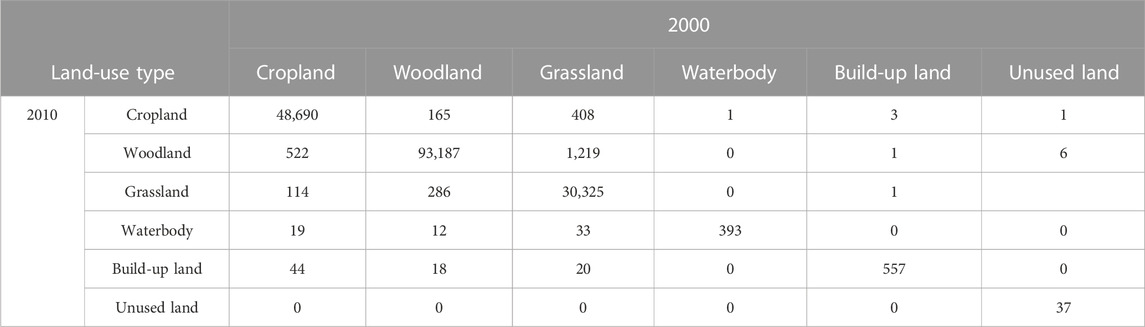
TABLE 5. Land-use transfer matrix from 2000 to 2010 (km2).
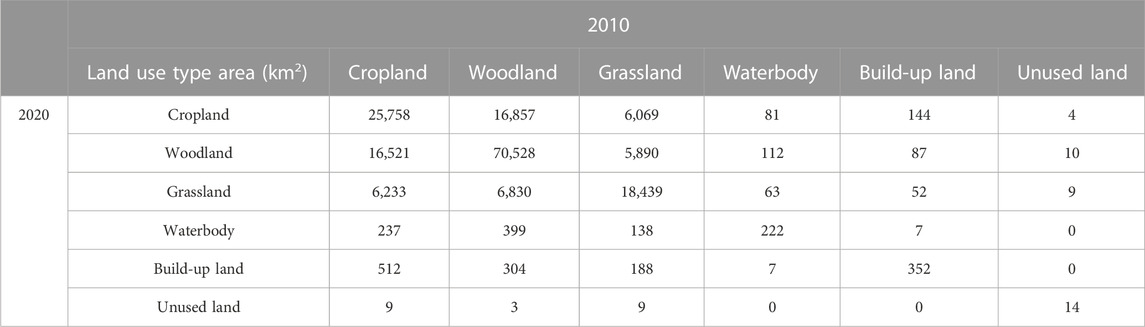
TABLE 6. Land-use transfer matrix from 2010 to 2020 (km2).
These findings revealed that forestland, followed by changing regions, had a significant impact on the spatial heterogeneity of the NDVI in the study area. The combined effect of forestland and changing regions significantly influenced the spatial heterogeneity of the NDVI. During the study period, the changing area was primarily the transformation of cultivated land, forest, and grassland, with human activities serving as the primary driving forces. Therefore, by encouraging land-use changes, human activities indirectly affected the spatial heterogeneity of vegetation NDVI in the study area.
Our analysis showed that the intensity and extent of human activity calculated based on the NLI correlated well with the selected statistics. The NLI can reflect the electricity consumption of China (Cao et al., 2014), socio-economic spatial characteristics (Li et al., 2019), and CO2 emissions dynamics (Shi et al., 2016a). It was used to estimate the Gross Domestic Product and Electric Power Consumption of China (Shi et al., 2014). In this paper, the results were consistent.
The distribution of human activity areas and built-up land was strongly consistent. Construction land had the greatest heterogeneity in the spatial distribution of human activities. Furthermore, the human activities based on the NLI showed a consistency in the distribution of the county government sites with areas with high HAI values. The NLI has been used to analyze urban expansion (Shi et al., 2016b), as an indicator for evaluating human activities (Amaral et al., 2005). It can also be used as a proxy for analyzing human activities, especially in karst desertification regions (Shi and Li, 2019). In general, the intensity of human activities calculated based on the NLI can provide a more realistic reflection of human activity intensity and its impact range in terms of space and quantity.
We also note that the impact of human activities is not only limited to construction sites but manifests in the extension of urban built-up areas at the periphery. The results of this study also showed that human activities in and around cities are significantly greater than those in towns and rural settlements, which is consistent with the actual situation.
The human activity intensity was spatially correlated with the level of urban development. Cities with early development and a high development level, such as Guiyang, Anshun, and Liupanshui, had a high human activity intensity. During the study period, there were significant trends of increasing intensity and area of human activities in Guizhou Province. In particular, the increasing trends of human activity intensity and area increased significantly after 2012. This was related to the fact that in 2012, due to the adjustment and implementation of relevant policies, the development rate increased, infrastructure construction accelerated, and the urban area of Guizhou Province increased significantly. Road mileage and the level of infrastructure construction also increased significantly during this period. Furthermore, human activities in townships and rural settlements increased significantly in 2012, which was notable in regions such as Qiannan, Qiandongnan, and Qianxinan. In addition, the center of gravity of the SDE generally shifted to the southwest during the study period, which was also proved by combining it with the trend of human activity intensity changes in sub-prefectures. The intensity of human activity aggregation decreased, i.e., the human activity areas expanded, such as Guiyang, Anshun, Liupanshui, and Zunyi, which had a high intensity of human activities and significant aggregation. In contrast, regions such as Qiannan, Qiandongnan, Qianxinan, and Tongren had a low intensity of human activities and low aggregation, but a rapid increase.
During the study period, some areas in the study area showed a decreasing trend of human activities. Spatially, the human activity intensity tended to decrease in areas with a high development level in the early stage of urban development (Xu et al., 2022). This was mainly because the cities in which development commenced early, such as Guiyang, Liupanshui, and Zunyi, and where the human development level was higher, had gradually adjusted during the development process in the past 20 years. This mainly involved a shift in the urban center of gravity and ecological protection of some areas, such as the return of cultivated land to forests.
The quantification and visualization of the intensity of human activities is an important basis for measuring and evaluating the effects of human activities on the ecological environment (Yan et al., 2022). To analyze the spatial heterogeneity of human activity distribution and change, two methods were selected in this study, the GeoDetector model, for analyzing the spatial heterogeneity of human activities, and the spatial correlation analysis, for analyzing the drivers of spatial variation in human activities.
The slope is an important factor limiting human activities in Guizhou; the explanatory power of the factors after the interaction was significantly enhanced. As a typical karst area in Guizhou Province, the terrain is rugged and complex; therefore, slope and elevation have directly affected the cost and difficulty of carrying out construction and farming activities. Both urban and rural settlements are located in areas with relatively low elevations and low and flat terrain. The surface condition of the Tibetan Plateau is mainly constrained by the intensity of human activities and is the result of the combined effect of various natural environmental factors (Yang et al., 2023).
Regarding meteorological factors, precipitation had a wider range of significant positive correlations with human activity than with temperature. Furthermore, precipitation had a more significant impact on human activities than temperature. This is because the study area is close to the Tropics, which has a high annual accumulated temperature and sufficient heat. Hence, water conditions have become a critical resource influencing human activities. The Dai nationality villages in Yunnan also have these characteristics distributed near water (Wang and Chiou, 2019). Moreover, the combination of precipitation and temperature had a more important impact on the spatial heterogeneity of human activity distribution and changes.
The quantification and visualization of the intensity of human activities is an important basis for measuring and evaluating the effects of human activities on the ecological environment (Yan et al., 2022). The results showed that the areas with positive and significant correlations were larger than that with negative correlations. The key driver of greening in southwestern China is land use change due to ecological restoration projects (Qiao et al., 2021; Wang et al., 2021; Xu et al., 2022). Since the pilot project began in 2000, Guizhou Province has completed 16.68 million mu of project construction tasks, including 6.57 million mu of reforestation on abandoned farmland and 10.12 million mu of afforestation on barren hills, involving 2.05 million farmers across the province (Opinions of the Provincial People’s Government on Improving the Policy of Returning Farmland to Forests [QFF (2007) No. 35]). The forestry ecological red line was demarcated in Guizhou Province in 2017 (QFH [2014] No. 199, the provincial government’s official reply on the implementation plan for the delineation of the forestry ecological red line in Guizhou Province). This shows that ecological protection policies limit some human activities and have promoted the local vegetation quality.
Previous studies have also shown that major ecological projects influence the regional NDVI (Zhang et al., 2019). Ecological restoration policies are the most important factor in mitigating and controlling desertification (Liu et al., 2020; Lv et al., 2020). Ecological restoration policies and economic policies directly or indirectly affect vegetation (Li et al., 2017). Since the 21st century, the management of desertification in the southwest karst region has been elevated to a national goal (Xu et al., 2022), with the aims of reducing the degree of regional desertification and increasing regional vegetation cover effectively (Li et al., 2013; Zhao and Hou, 2019). With effective policy guidance, human activities have contributed significantly to the recovery of vegetation in the southwest (Xu et al., 2022). The NLI can aid in the formulation of relevant policies and help Guizhou province to develop relevant development strategies according to local conditions (Kumar, 2018). Other studies analyzing Guizhou Province have similarly identified the need to tailor development strategies to regional realities (Cheng et al., 2022).
We note that studies have indicated that light pollution caused by human activities will have a certain impact on the vegetation surrounding the city and impede the adaptability and development of vegetation, which requires attention and further research.
In our study, we found that the range of nighttime light was larger than the range of urban built-up areas, towns, rural settlements, and roads; however, the threshold relationship between specific urban built-up areas and NLI requires further study. From the perspective of land-use types, cropland also involves human activities; however, as most cultivation related to cropland is carried out during the daytime, the NLI does not adequately reflect the extent of cropland. We note that cropland is one of the important factors influencing vegetation change. However, the enhancement of the NLI in rural settlements can undeniably indicate an increase in the number or intensity of people engaged in agriculture. There is a potential link between it and the amount of cropland. This correlation must be analyzed in more detail in future studies.
We also found that Guizhou Province, as a typical karst region, has a complex and fragmented topography with notable characteristics of an interlocking distribution of various land-use types. Due to the unique topography, many areas have formed special regional microclimates (e.g., Maotai town). The vegetation changes and influencing factors, as well as their response to human activities, differ from the general pattern; therefore, analysis through field measurement data combined with high-resolution remote sensing images will be the focus of future research.
In this study, we found that the change in human activities was not a linear decay but exhibited a similar exponential decay trend. Therefore, segmentation research of human activity intensity based on NLI calculations should be the focus of future research. We also found that Guizhou Province has a broken terrain and complex environment; its regional microenvironment has its characteristics. Future studies should analyze small areas in detail through high-resolution images.
This paper aims to study the spatial heterogeneity of human activities distribution and change, and the impact factors in the Guizhou typical karst area. This study measured and analyzed the HAI and their spatial and temporal variation in Guizhou Province using NLI data, meteorological data, and topographic data. The GeoDetector model was used to analyze the impact factors of spatial heterogeneity in HA. Correlation analyses were used to analyze HAI changes in relation to temperature and precipitation, and the impact on vegetation quality. We obtained the following conclusions.
Normalized NLI can accurately reflect the spatial distribution and changes in human activities. The spatial heterogeneity of human activities distribution and changes were obviously in Guizhou Province. Human activities intensity and range were expanding, 97.56% of the human activity area showed an increasing trend, and 86.05% showed a significant increasing trend (p ≤ 0.01). The proportion and change trend of human activities are not same in different periods. The human activity areas expanded from 15,963 km2 to 86,923 km2 with an increased rate 4,279.2 km2/a, which was 1,118.4 km2/a from 2000 to 2010 and 6,375.3 km2/a from 2010 to 2020. The intensity was increased from 0.009 to 0.018 with increase rate of 0.0006/a, which was 0.00028/a from 2000 to 2010 and 0.00073/a from 2010 to 2020. Human activities in Guizhou Province accelerated significantly after 2012, with the intensity increasing and the scope expanding significantly. Human activities were relatively intense in regions where the prefectures and municipal governments located, in particular in the central, southwest and northeast regions, such as Guiyang, Zunyi, Anshun, Liupanshui, and Xingyi. HA were mainly distributed in areas with gentle slopes (6–15°), abundant precipitation (1,002–1,277 mm), lower altitudes (489–1982 m), and suitable temperature (12–18°C) in the study area.
The slope has the greatest impact on human activities with q value of 0.1338, and precipitation, elevation and temperature with q value of 0.0626, 0.0253, and 0.0136 respectively. The combined impact between precipitation and slope was greatest with q value of 0.1803, the q value between elevation and slope, temperature and slope, elevation and precipitation was 0.1599, 0.1510, and 0.1034, while q value between, precipitation and temperature, elevation and temperature was 0.0885 and 0.0765. The combine impact between precipitation, temperature, elevation and slope were greater than the single factor impact of precipitation, temperature, and elevation. Slope and precipitation had the greatest impacts. Slope and precipitation play an important role in influencing the distributions of and changes in human activity; temperature and altitude may also affect human activity. Spatial variation in the HAI in Guizhou Province was the result of a combination of natural environmental and social factors. Human activities in karst mountain areas under policy guidance have had a significant positive effect on vegetation based on current trends. Therefore, appropriate policies are critical in promoting the development of mountainous karst regions.
There are problems that still needed more profound study, such as the threshold of human activities intensity and small-scale regions.
The original contributions presented in the study are included in the article/Supplementary Material, further inquiries can be directed to the corresponding author.
Conceptualization, CC and YX; Data curation, CC; Formal analysis, CC; Funding acquisition, YX; Investigation, CC and YX; Methodology, CC and YX; Project administration, YX; Resources, YX; Software, CC; Supervision, YX; Validation, CC and YX; Visualization, CC; Writing–original draft, CC; Writing–review and editing, YX. All authors contributed to the article and approved the submitted version.
This study was supported by the Guizhou Provincial Science and Technology Foundation (Qiankehe Jichu [2018]1145) and the Guizhou Provincial Education Department Innovation Group Major Research Project (Qianjiaohe KY ZI [2016]055).
We gratefully acknowledge RESDC and NASA for providing the original data for this study.
The authors declare that the research was conducted in the absence of any commercial or financial relationships that could be construed as a potential conflict of interest.
All claims expressed in this article are solely those of the authors and do not necessarily represent those of their affiliated organizations, or those of the publisher, the editors and the reviewers. Any product that may be evaluated in this article, or claim that may be made by its manufacturer, is not guaranteed or endorsed by the publisher.
Amaral, S., Câmara, G., Monteiro, A. M. V., Quintanilha, J. A., and Elvidge, C. D. (2005). Estimating population and energy consumption in Brazilian Amazonia using DMSP night-time satellite data. Comput. Environ. Urban Syst. 29 (2), 179–195. doi:10.1016/j.compenvurbsys.2003.09.004
Cao, X., Wang, J., Chen, J., and Shi, F. (2014). Spatialization of electricity consumption of China using saturation-corrected DMSP-OLS data. Int. J. Appl. Earth Observation Geoinformation 28, 193–200. doi:10.1016/j.jag.2013.12.004
Cheng, Z., Zhao, T., Song, T., Cui, L., and Zhou, X. (2022). Assessing the spatio-temporal pattern and development characteristics of regional ecological resources for sustainable development: A case study on Guizhou province, China. Land 11, 899. doi:10.3390/land11060899
Day, M. (2010). Challenges to sustainability in the caribbean karst. Geol. Croat. 63, 149–154. doi:10.4154/gc.2010.12
Ding, Y., and Peng, S. (2020). Spatiotemporal trends and attribution of drought across China from 1901–2100. Sustainability 12, 477. doi:10.3390/su12020477
Falchetta, G., and Noussan, M. (2019). Interannual variation in night-time light radiance predicts changes in national electricity consumption conditional on income-level and region. Energies 12, 456. doi:10.3390/en12030456
Guo, Y., Yu, W., Chen, Z., and Zou, R. (2020). Impact of high-speed rail on urban economic development: An observation from the Beijing-Guangzhou line based on night-time light images. Socio-Econ. Plann. Sci. 72, 100905. doi:10.1016/j.seps.2020.100905
Gutiérrez, F., Parise, M., De Waele, J., and Jourde, H. (2014). A review on natural and human-induced geohazards and impacts in karst. Earth. Sci. Rev. 138, 61–88. doi:10.1016/j.earscirev.2014.08.002
Hao, L., Pan, C., Fang, D., Zhang, X., Zhou, D., Liu, P., et al. (2018). Quantifying the effects of overgrazing on mountainous watershed vegetation dynamics under a changing climate. Sci. Total Environ. 639, 1408–1420. doi:10.1016/j.scitotenv.2018.05.224
He, X., Zhou, C., Zhang, J., and Yuan, X. (2020). Using wavelet transforms to fuse nighttime light data and POI big data to extract urban built-up areas. Remote. Sens. 12, 3887. doi:10.3390/rs12233887
Hong, H., and Sun, C. P. (2021). Spatiotemporal variation and influencing factors of vegetation dynamics based on geodetector: A case study of the northwestern yunnan plateau, China. Ecol. Indic. 130, 108005. doi:10.1016/j.ecolind.2021.108005
Huang, L., Ye, A., Tang, C., Duan, Q., and Zhan, Y. (2020). Impact of rural depopulation and climate change on vegetation, runoff and sediment load in the Gan River basin, China. Hydrol. Res. 51, 768–780. doi:10.2166/nh.2020.120
Jiang, L., Jiapaer, G., Bao, A., Guo, H., and Ndayisaba, F. (2017). Vegetation dynamics and responses to climate change and human activities in Central Asia. Sci. Total Enviro. 599–600, 967–980. doi:10.1016/j.scitotenv.2017.05.012
Kong, W., Cheng, J., Liu, X., Zhang, F., and Fei, T. (2019). Incorporating nocturnal uav side-view images with viirs data for accurate population estimation: A test at the urban administrative district scale. Int. J. Remote Sens. 40, 8528–8546. doi:10.1080/01431161.2019.1615653
Kumar, P., Rehman, S., Sajjad, H., Tripathy, B. R., Rani, M., and Singh, S. (2019). Analyzing trend in artificial light pollution pattern in India using NTL sensor's data. Urban Clim. 27, 272–283. doi:10.1016/j.uclim.2018.12.005
Li, S., Wang, T., and Yan, C. (2017). Assessing the role of policies on land-use/cover change from 1965 to 2015 in the Mu Us Sandy Land, northern China. Sustainability 7, 1164. doi:10.3390/su9071164
Li, X., Ma, R., Zhang, Q., Li, D., Liu, S., He, T., et al. (2019). Anisotropic characteristic of artificial light at night – systematic investigation with VIIRS DNB multi-temporal observations. Remote Sens. Environ. 233, 111357. doi:10.1016/j.rse.2019.111357
Li, X., Ren, Z., Zhang, C., Wang, H., Sun, L., and Chen, Z. J. (2013). Spatial-temporal variations of vegetation cover in chongqing city (1999-2010): Impacts of climate factors and human activities. Sci. Geogr. Sin. 33 (11), 1390–1394. doi:10.1126/science.1244040
Liao, C., Yue, Y., Wang, K., Fensholt, R., Tong, X., and Brandt, M. (2018). Ecological restoration enhances ecosystem health in the karst regions of southwest China. Ecol. Indic. 90, 416–425. doi:10.1016/j.ecolind.2018.03.036
Liu, H., Zhang, M., Lin, Z., and Xu, X. (2018). Spatial heterogeneity of the relationship between vegetation dynamics and climate change and their driving forces at multiple time scales in Southwest China. Agric. For. Meteorol. 256–257, 10–21. doi:10.1016/j.agrformet.2018.02.015
Liu, Q., Zhang, Q., Yan, Y., Zhang, X., Niu, J., and Svenning, J. S. (2020). Ecological restoration is the dominant driver of the recent reversal of desertification in the Mu Us Desert (China). J. Clean. Prod. 268, 122241–126526. doi:10.1016/j.jclepro.2020.122241
Luo, Y., and Wang, H. (2019). Modeling the impacts of agricultural management strategies on crop yields and sediment yields using APEX in Guizhou Plateau, southwest China. Agricu. Water Manag. 216, 325–338. doi:10.1016/j.agwat.2019.01.018
Lv, Y., Shi, P., Han, G., Liu, L., Guo, L., Hu, X., et al. (2020). Desertification control practices in China. Sustainability 12, 3258. doi:10.3390/su12083258
Pan, Y., Weng, G. M., Li, C. H., and Li, J. P. (2021). Coupling coordination and influencing factors among tourism carbon emission, tourism economic and tourism innovation. Int. J. Environ. Res. Public Health. 18 (4), 1601–1617. doi:10.3390/ijerph18041601
Parise, M., and Pascali, V. (2003). Surface and subsurface environmental degradation in the karst of Apulia (southern Italy). Environ. Geol. 44, 247–256. doi:10.1007/s00254-003-0773-6
Pedro, R. M., Paulo, S. L., Vincent, D., and Bergson, G. B. (2020). NDVI time series stochastic models for the forecast of vegetation dynamics over desertification hotspots. Int. J. Remote Sens. 41, 2759–2788. doi:10.1080/01431161.2019.1697008
Peng, S. (2019). 1-km monthly mean temperature dataset for China (1901–2020). China: National Tibetan Plateau Data Center.
Peng, S. (2020). 1-km monthly precipitation dataset for China (1901–2020). China: National Tibetan Plateau Data Center.
Peng, S., Ding, Y., and LiuLi, Z. (2019). 1 km monthly temperature and precipitation dataset for China from 1901 to 2017. Earth Syst. Sci. Data. 11, 1931–1946. doi:10.5194/essd-11-1931-2019
Peng, S., Ding, Y., Wen, Z., Chen, Y., Cao, Y., and Ren, J. (2017). Spatiotemporal change and trend analysis of potential evapotranspiration over the Loess Plateau of China during 2011–2100. Agric For. Meteorol. 233, 183–194. doi:10.1016/j.agrformet.2016.11.129
Peng, S., Gang, C., Cao, Y., and Chen, Y. (2018). Assessment of climate change trends over the Loess Plateau in China from 1901 to 2100. Int. J. Climatol. 38, 2250–2264. doi:10.1002/joc.5331
Qiao, Y., Jiang, Y., and Zhang, C. (2021). Contribution of karst ecological restoration engineering to vegetation greening in southwest China during recent decade. Ecol. Indic. 121, 107081. doi:10.1016/j.ecolind.2020.107081
Shi, K., Chen, Y., Yu, B., Xu, T., Chen, Z., Liu, R., et al. (2016a). Modeling spatiotemporal CO2 (carbon dioxide) emission dynamics in China from DMSP-OLS nighttime stable light data using panel data analysis. Appl. Energy 168, 523–533. doi:10.1016/j.apenergy.2015.11.055
Shi, K., Chen, Y., Yu, B., Xu, T., Li, L., Huang, C., et al. (2016b). Urban expansion and agricultural land loss in China: A multiscale perspective. Sustainability 8 (8), 790. doi:10.3390/su8080790
Shi, K., Yu, B., Huang, Y., Hu, Y., Yin, B., Chen, Z., et al. (2014). Evaluating the ability of NPP-viirs nighttime light data to estimate the gross domestic product and the electric power consumption of China at multiple scales: A comparison with DMSP-OLS data. Remote Sens. 6 (2), 1705–1724. doi:10.3390/rs6021705
Shi, T., Hu, Z., Shi, Z., Guo, L., Chen, Y., Li, Q., et al. (2018). Geo-detection of factors controlling spatial patterns of heavy metals in urban topsoil using multi-source data. Sci. Total Environ. 643, 451–459. doi:10.1016/j.scitotenv.2018.06.224
Shi, Y., and Li, L. (2019). Are karst rocky desertification areas affected by increasing human activity in southern China? An empirical analysis from nighttime light data. Int. J. Environ. Res. Public Health 16 (21), 4175. doi:10.3390/ijerph16214175
Silva, R. F. B., Millington, J., Moran, E., Batistella, M., and Liu, M. (2020). Three decades of land-use and land-cover change in mountain regions of the Brazilian Atlantic Forest. Landsc. Urban Plan. 204, 103948. doi:10.1016/j.landurbplan.2020.103948
Small, C., Sousa, D., Yetman, G., Elvidge, C., and MacManus, K. (2018). Decades of urban growth and development on the Asian megadeltas. Glob. Planet Change. 165, 62–89. doi:10.1016/j.gloplacha.2018.03.005
Song, Y., Jin, L., and Wang, H. (2018). Vegetation changes along the Qinghai-Tibet plateau engineering corridor since 2000 induced by climate change and human activities. Remote Sens. 10, 95. doi:10.3390/rs10010095
Wang, H., and Chiou, S. (2019). Study on the sustainable development of human settlement space environment in traditional villages. Sustainability 11 (15), 4186. doi:10.3390/su11154186
Wang, J., Delang, C. O., Hou, G., Gao, L., and Lu, X. (2021). Net primary production increases in the Yangtze River Basin within the latest two decades. Glob. Ecol. Conserv. 26, e01497. doi:10.1016/j.gecco.2021.e01497
Wang, J., and Xu, C. (2017). Geodetector: Principle and prospective. Act. Geol. Sin. 72, 116–134. doi:10.11821/dlxb201701010
Wu, B., Yu, B., Yao, S., Wu, Q., Chen, Z., and Wu, J. (2019). A surface network based method for studying urban hierarchies by night time light remote sensing data. Int. J. Geogr. Inf. Sci. 33 (7–8), 1377–1398. doi:10.1080/13658816.2019.1585540
Xiao, H., Ma, Z., Mi, Z., Kelsey, J., Zheng, J., Yin, W., et al. (2018). Spatio-temporal simulation of energy consumption in China's provinces based on satellite night-time light data. Appl. Energy. 231, 1070–1078. doi:10.1016/j.apenergy.2018.09.200
Xie, Z., Qin, Y., Li, Y., Shen, W., and Liu, S. (2020). Spatial and temporal differentiation of COVID-19 epidemic spread in mainland China and its influencing factors. Sci. Total Environ. 744, 140929. doi:10.1016/j.scitotenv.2020.140929
Xu, C., Zhang, X., and Xiao, G. (2019). Spatiotemporal decomposition and risk determinants of hand, foot and mouth disease in Henan, China. Sci. Total Environ. 657, 509–516. doi:10.1016/j.scitotenv.2018.12.039
Xu, Q., Dong, Y., Wang, Y., Yang, R., and Xu, C. (2018). Determinants and identification of the northern boundary of China’s tropical zone. J. Geogr. Sci. 28, 31–45. doi:10.1007/s11442-018-1457-1
Xu, Y., Huang, W., Dou, S., Guo, Z., Li, X., Zheng, Z., et al. (2022). Responding mechanism of vegetation cover to climate change and human activities in SouthwestSouthwest China from 2000 to 2020. Environ. Sci. 43 (6), 3230–3240. doi:10.13227/j.hjkx.202108107
Yan, Yiliang, Hu, Jiangling, Zhang, Fa, and Xu, Zhiming (2022). The characteristics of temporal and spatial changes in the intensity of human activities in Kashgar area from 2000 to 2018. J. Inn. Mong. Normal Univ. Nat. Sci. Ed. 51 (3), 250–257. doi:10.3969/j.issn.1001-8735.2022.03.005
Yang, G., Ma, Y., and Hu, J. (2021). A fused variable by night light images and MODIS products for improving urban built-up area extraction. Technologies 9, 40. doi:10.3390/technologies9020040
Yang, H., Xu, Y., Wang, L., and Xu, L. (2023). Spatio-temporal variation of human activity intensity and its driving factors on the Qinghai-Tibet Plateau. Acta Ecol. Sin. 43 (10), 3995–4009. doi:10.5846/stxb202211183332
Yuan, L., Chen, X., Wang, X., Xiong, Z., and Song, C. (2019). Spatial associations between NDVI and environmental factors in the heihe river basin. J. Geogr. Sci. 29, 1548–1564. doi:10.1007/s11442-019-1676-0
Yudhistira, M. H., Indriyani, W., Pratama, A. P., Sofiyandi, Y., and Kurniawan, Y. R. (2019). Transportation network and changes in urban structure: Evidence from the jakarta metropolitan area. Res. Transp. Econ. 74, 52–63. doi:10.1016/j.retrec.2018.12.003
Zhang, F., Zhang, Z., Kong, R., Chang, J., Tian, J., Zhu, B., et al. (2019). Changes in forest net primary productivity in the Yangtze River Basin and its relationship with climate change and human activities. Remote Sens. 11, 1451. doi:10.3390/rs11121451
Zhao, J., Chen, Y., Ji, G., and Wang, Z. (2018). Residential carbon dioxide emissions at the urban scale for county-level cities in China: A comparative study of nighttime light data. J. Clean. Prod. 180, 198–209. doi:10.1016/j.jclepro.2018.01.131
Zhao, L., and Hou, R. (2019). Human causes of soil loss in rural karst environments: A case study of Guizhou, China. Sci. Rep. 9, 3225. doi:10.1038/s41598-018-35808-3
Zhao, S., Wu, X., Zhou, J., and Pereira, P. (2020). Spatiotemporal tradeoffs and synergies in vegetation vitality and poverty transition in rocky desertification area. Sci. Total Environ. 752, 141770. doi:10.1016/j.scitotenv.2020.141770
Zhao, Y., Qu, Z., Zhang, Y., Ao, Y., Han, L., Kang, S., et al. (2022). Effects of human activity intensity on habitat quality based on nighttime light remote sensing: A case study of northern shaanxi, China. Sci. Total Environ. 851, 158037. doi:10.1016/j.scitotenv.2022.158037
Zheng, K., Wei, J. Z., Pei, J. Y., Cheng, H., Zhang, X. L., Huang, F. Q., et al. (2019). Impacts of climate change and human activities on grassland vegetation variation in the Chinese Loess Plateau. Sci. Total Environ. 660, 236–244. doi:10.1016/j.scitotenv.2019.01.022
Zhou, Z., Zhang, S., Xiong, K., Li, B., Tian, Z., Chen, Q., et al. (2017). The spatial distribution and factors affecting karst cave development in Guizhou Province. J. Geogr. Sci. 27, 1011–1024. doi:10.1007/s11442-017-1418-0
Keywords: vegetation index, mountainous region, GeoDetector model, influence, intensity change, deviation ellipse
Citation: Chen C and Xu Y (2023) Spatial heterogeneity of human activities and its driving factors in karst areas of Southwest China over the past 20 years. Front. Environ. Sci. 11:1225888. doi: 10.3389/fenvs.2023.1225888
Received: 20 May 2023; Accepted: 27 July 2023;
Published: 22 August 2023.
Edited by:
Gang Fu, Chinese Academy of Sciences (CAS), ChinaReviewed by:
Ben Niu, Chinese Academy of Sciences (CAS), ChinaCopyright © 2023 Chen and Xu. This is an open-access article distributed under the terms of the Creative Commons Attribution License (CC BY). The use, distribution or reproduction in other forums is permitted, provided the original author(s) and the copyright owner(s) are credited and that the original publication in this journal is cited, in accordance with accepted academic practice. No use, distribution or reproduction is permitted which does not comply with these terms.
*Correspondence: Yufeng Xu, cW5udXh5ZkAxNjMuY29t
Disclaimer: All claims expressed in this article are solely those of the authors and do not necessarily represent those of their affiliated organizations, or those of the publisher, the editors and the reviewers. Any product that may be evaluated in this article or claim that may be made by its manufacturer is not guaranteed or endorsed by the publisher.
Research integrity at Frontiers
Learn more about the work of our research integrity team to safeguard the quality of each article we publish.