 Chaochao Li
 Chenglu Li1,4
94% of researchers rate our articles as excellent or good
Learn more about the work of our research integrity team to safeguard the quality of each article we publish.
Find out more
ORIGINAL RESEARCH article
Front. Environ. Sci. , 24 August 2023
Sec. Freshwater Science
Volume 11 - 2023 | https://doi.org/10.3389/fenvs.2023.1221571
This article is part of the Research Topic Vegetation-soil-hydrology Interactions and Ecohydrological Processes View all 16 articles
Introduction: Due to climate and underlying surface changes, flash floods occur frequently in northwest China, and the extreme rainstorm weather and flash floods along the eastern foot of Helan Mountain are increasing.
Method: By constructing a hydrological model to simulate ten historical mountain flood events in the Suyukou watershed of the eastern foot of Helan Mountain, this study explores the constitutive relationship between rainfall and flood, evaluates accuracy, and analyzes errors. Six characteristic rain patterns were designed based on three parameters representing the position of rainfall peaks and the trend characteristics of rainfall, using 63 actual rainfall processes with a duration of 6 h selected from the rainfall stations of Suyukou watershed. Early warning indicators under different conditions were carried out based on the set of rain patterns.
Results: The research results indicate that eight out of the ten simulated floods have passed the qualification test and the simulation results are good. The HEC-HMS hydrological model is suitable for simulating mountain floods in small watersheds and can provide good support for the simulation and early warning of mountain flood disasters.
Discussion: Designing a rain pattern set based on actual data has put forward higher requirements for mountain flood warning and forecasting, making the warning more in line with the local actual situation and greatly improving the effectiveness of warning and forecasting.
For Flash flood refers to the phenomenon of natural disasters such as floods, landslides, and mudslides caused by sustained and high-intensity precipitation in hilly areas, influenced by natural conditions such as climate, river basins, and human activities (Cui et al., 2011). Flash flood poses a huge threat to social economy and people’s safety, often causing serious consequences such as ecological environment damage and building damage. While causing serious economic losses to the disaster area, they also pose a huge threat to the safety of mountain people (Zhang et al., 2022). The distribution of flash flood in China is relatively widespread, and the occurrence of flood season is also relatively frequent. In recent years, due to climate and underlying surface changes, the degree of global meteorological change has intensified, with frequent occurrence of heavy rainfall in mountainous areas. The frequency of flash flood has significantly increased, and the impact on economic and social development has gradually increased.
At present, flood prevention and control in China are mainly divided into two different types of work: engineering measures and non-engineering measures (Al-Suhili et al., 2019). Engineering measures usually involve measures such as regulating river channels, constructing embankments and reservoirs, and preventing flood disasters through operations such as drainage and storage; non-engineering measures mainly include early warning and forecasting systems developed by meteorological or technical departments for monitoring floods, as well as existing policies for flood control and disaster reduction. Nowadays, the engineering system for flood control and prevention in China is still constantly improving, but the situation of flood control in China is still very severe and cannot be ignored. For the frequent occurrence of complex and highly hazardous flood disasters, water conservancy experts from various regions believe that relying solely on engineering construction measures is difficult to completely solve the flood problem. If only engineering construction measures are used to cope with flood disasters, not only will the workload of engineering construction work increase, but also cause damage to the ecological environment. Moreover, the construction cost of engineering construction work is too high, and each county, district, and country cannot afford it. Therefore, early warning and forecasting systems are an important component of the flood control system and an important means to effectively reduce the number of victims and material losses related to flood control. In recent years, a large number of scholars have conducted relevant research (Mosey et al., 2019; Yoo et al., 2019; Li et al., 2023; Wang et al., 2023). Georgios et al. (2022) combined one-dimensional modeling with two-dimensional modeling using the HEC-RAS model to simulate a disastrous flash flood in the town of Mandra, in Attica, Greece, in November 2017. The study proposed an acceptable error level for calculating the predicted water depth and flood inundation range, providing a basis for modeling flood simulation and prediction. Tu et al. (2020) used eight heavy rainfall events for model calibration and validation, indicating the effectiveness of HEC-HMS in simulating small watersheds in Sichuan Province, China. And using the Pearson III formula widely used in China, the design rainfall at different frequencies was analyzed, and flood hydrographs at different frequencies were calculated to determine two key warning indicators: the flood stage for immediate evacuation and the rate of rise. This research has shown that the early issuance of warning signals is correct and can provide reference for the early warning of flash floods in the study area and other small watersheds in mountainous areas. Huang et al. (2019) proposed a flash flood warning scheme based on hydrodynamics and critical rainfall, which uses designed rainfall, considers different rainfall and initial soil conditions, and establishes a critical rainfall database for flash flood warning, demonstrating a new flash flood warning scheme. Nguyen et al. (2019) developed a flash flood warning system based on geomorphological and hydrological methods to address the frequent occurrence of flash floods during the rainy season in Hoang Su Phi, a mountainous district in Ha Giang province, Vietnam. The system classifies rainfall thresholds and provides early flash flood warnings for the area 1–6 days in advance based on different rainfall values, allowing local governments sufficient time to prevent and mitigate losses caused by flash flood. Hu (2019) proposed a flood calculation method design based on HEC-HMS distributed model in combination with the actual situation of Miaoxia basin and the calculation of rainstorm time distribution by using the short duration rainstorm formula in Zhejiang Province, and determined the flash flood warning indicators by using the water level backward flow method. This study can provide reference for the selection of flash flood warning indicators. The existing research on early warning and forecasting is mostly based on the existing rainstorm intensity formula or a single design rainfall pattern to calculate the time distribution of rainstorm, which cannot fully express the actual meteorological characteristics. The calculation results of early warning indicators are slightly single, and the early warning and forecasting results may have some deviation. This article takes the Suyukou watershed, a typical watershed in the eastern foot of Helan Mountain, as the research object. Based on the investigation of the mechanism of flash flood in the research area, a digital watershed model is constructed and historical floods are simulated. Combined with the measured rainfall in the watershed, a characteristic rainfall pattern set based on three parameters is designed to propose a design rainfall time distribution that is more in line with the local actual situation, and the flash flood warning indicators in the research area are calculated, thus providing theoretical support for the early warning and prediction of mountain flood disasters.
Located between the alluvial plain of the Yellow River in Ningxia and the alluvial fan of Helan Mountain, between 37° and 39° north latitude, the eastern foot of Helan Mountain is recognized as one of the most suitable areas for grape planting, wine brewing and high-end wine production in the world. In recent years, due to climate and underlying surface changes, extreme rainstorm weather and flood disasters along the Helan Mountain and at the eastern foot of Helan Mountain have increased (Yang et al., 2020a). For example, on 21 August 2016, a extremely heavy rainstorm exceeding the historical maximum occurred along the Helan Mountain, 239.5 mm precipitation occurred at Suyukou Ski Resort, Helan Mountain, followed by 219.1 mm precipitation in Ruqi gully, both exceeding the historical maximum since the meteorological records, and inducing a flood with a return period of more than 50 years. On 22 July 2018, extremely heavy rainstorm exceeded the historical maximum again along the Helan Mountain. The precipitation of Suyukou Ski Resort was 277.6 mm, the precipitation of Ruqi gully was 247.5 mm, and the precipitation of Helan Mountain Rock Painting was 219.6 mm. This again broke the maximum daily precipitation since the meteorological observation records were available in Ningxia, resulting in 50–200 years floods in several mountain torrents and gullies in Helan Mountain, including Dawukou gully, Ruqi gully, and Suyukou gully (Yang et al., 2020b). Frequent heavy rainfall is one of the main reasons for the occurrence of flash flood in Helan Mountain (Zhou et al., 2022).
The main mountain of the eastern foot of Helan Mountain is steep, with sparse vegetation and low coverage, gradually increasing with increasing altitude. The development of gullies is mostly elongated and parallel to the ridges. There are more than 50 large and small gullies along the eastern foot of the middle section, most of which are V-shaped. The mouth of the gullies is usually a sedimentary fan formed by early debris flows or mountain floods, and later formed by runoff erosion to form a sedimentary rock sea landform. The catchment areas of various gullies on the eastern foot of Helan Mountain range from 3–5 square kilometers to several hundred square kilometers, with 13 gullies having a catchment area greater than 50 km2 and 21 gullies having a catchment area greater than 30 km2. A few mountain flood gullies have regular running water, while other gullies are mostly dry gullies except for floods. The surface runoff occurs in the form of rainstorm flood, which is difficult to use. The three mountain torrents in the north directly flow into the Yellow River. The small floods in other channels are lost in the form of overflow on the diluvial slopes, while the large floods wash into the lower flood detention reservoirs, drainage ditches, mountain side channels, etc.
This study is aimed at Suyukou watershed, which is 13.7 km long, 50.5 km2 watershed area, 73.9‰ channel average gradient, 292.4 mm multi-year average precipitation, 1,230 mm multi-year average evaporation, and 1.534 million m3 multi-year average runoff. The watershed is prone to frequent floods and poses serious harm. There is a Suyukou Hydrological Station located in gully, which was founded in February 1971 as a central flood reporting station. There are four series of fixed rainfall stations upstream, including Linkuang, Shihuiyao, Suyukou, and Dianjiangtai. On 20 May 1998, the peak flow was 560 m3/s with a return period of over a hundred years. On 22 August 2016, the peak flow was 435 m3/s with a 50-year return period. On 22 July 2018, the peak flow was 570 m3/s with a return period of over two hundred years. Figure 1 shows the schematic diagram of the location information of the Suyukou watershed. The map was downloaded from the national standard map website with the map approval number GS (2019) 1822, then was digitized using ArcGIS.
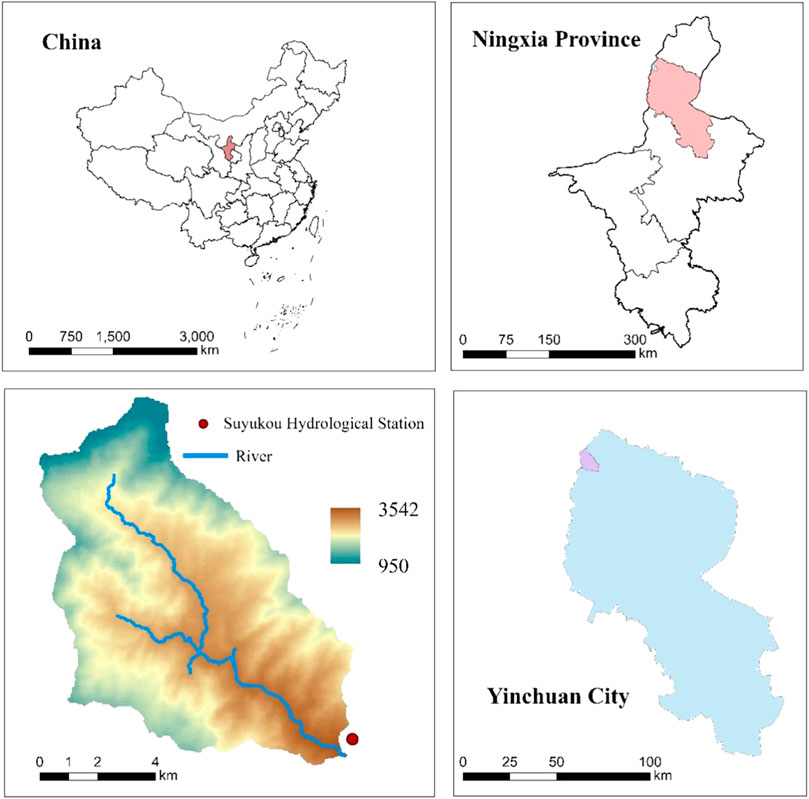
FIGURE 1. Location of Suyukou watershed.
This hydrological simulation used runoff data from Suyukou Hydrological Station from 1971 to 2018 and rainfall data from two rainfall stations in the Suyukou watershed, namely, the Linkuang and Suyukou, to process abnormal and missing data. Ten complete rainfall flood sequences and 63 typical rainfall events lasting for 6 h were sorted out, providing data support for model simulation and early warning and forecasting research.
(1) Unique landforms and geographical location
The water system in the research area runs in a northwest-southeast direction, with low vegetation coverage and very sparse vegetation, mostly shrubs, with a coverage rate of about 47%. The rock mass has been exposed for a long time, with intense tectonic activity, broken mountains, and a large amount of loose material accumulated in the channels and slopes on both sides. Most of the gullies are V-shaped, with vertical and horizontal gullies and large terrain height difference (2.08 km), which is easy to form rainstorm and flash flood, and often accompanied by landslides, debris flows and other secondary disasters.
(2) Concentrated rainstorm and heavy rainfall
The research area is located in the transitional zone between arid and semi-arid regions, deep inland, with an average annual precipitation of 200–400 mm. The distribution of rainfall within and between years is extremely uneven. The precipitation mostly occurs from May to September, accounting for more than 80% of the total precipitation of the whole year, and the precipitation from July to August accounts for more than 40%, and mostly occurs in the form of rainstorm. In each rainstorm process, the precipitation in the rainstorm center is greatly different from that in the edge area. Meanwhile, there are significant interannual differences in rainfall in the study area, the rainfall is very unstable. The uneven spatiotemporal distribution of annual and interannual precipitation not only leads to significant differences in annual runoff in the study area, but also leads to sudden floods with sudden fluctuations, resulting in serious flood disasters. Taking two major floods in recent years as examples, the runoff characteristics are analyzed: the overall flood flow in the study area is large, the flood duration is not long, but the runoff is fast, and the runoff occurs quickly after rainfall, with a fast trend of flood fluctuations.
HEC-HMS is a computer program for the hydrological modeling system developed by the Hydrological Engineering Center of the United States Army Corps of Engineers. It can simulate the rainfall runoff and flood routing processes of a watershed under natural or artificial conditions, and it is a distributed hydrological model with physical concepts. This model divides the target research watershed into several sub watersheds, calculates the runoff generation and concentration of each sub watershed separately, and then calculates it to the outlet section of the watershed.
The HEC-GeoHMS module can automatically extract parameters such as terrain and hydrological features from digital basic data, reducing manual workload (Wang and Sun, 2019; Castro and Maidment, 2020; Cheng et al., 2021; Mehlath and Lone, 2022). Extract the river network of the study area through processing such as filling in depressions, flow direction, and confluence, and draw sub watersheds. Through the calculation and analysis of the HEC-GeoHMS module, create a watershed structure map for the HEC-HMS model to use. Import the watershed model module generated by HEC-GeoHMS into the HEC-HMS model, and then generate a watershed model for the Suyukou watershed study area based on the calculation results of the module (Aksoy et al., 2016). The sub watershed and river channel attributes of the Suyukou watershed model are shown in Table 1 and Figure 2.
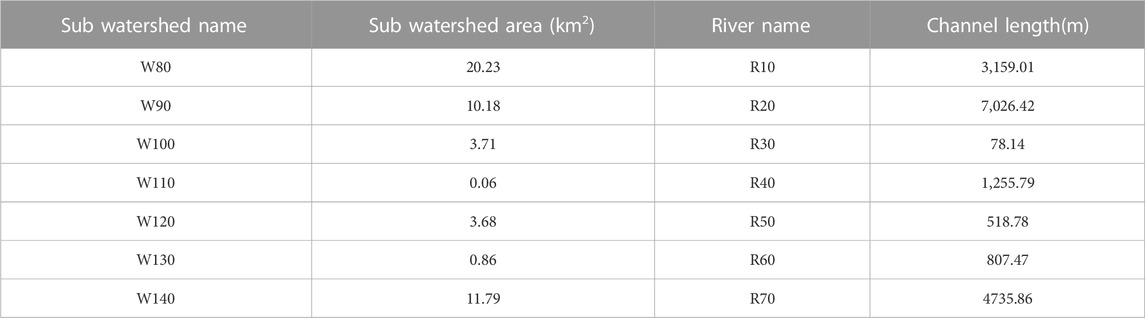
TABLE 1. Attribute table of Suyukou basin model. (A) Suyukou watershed Model, (B) Landuse Type.
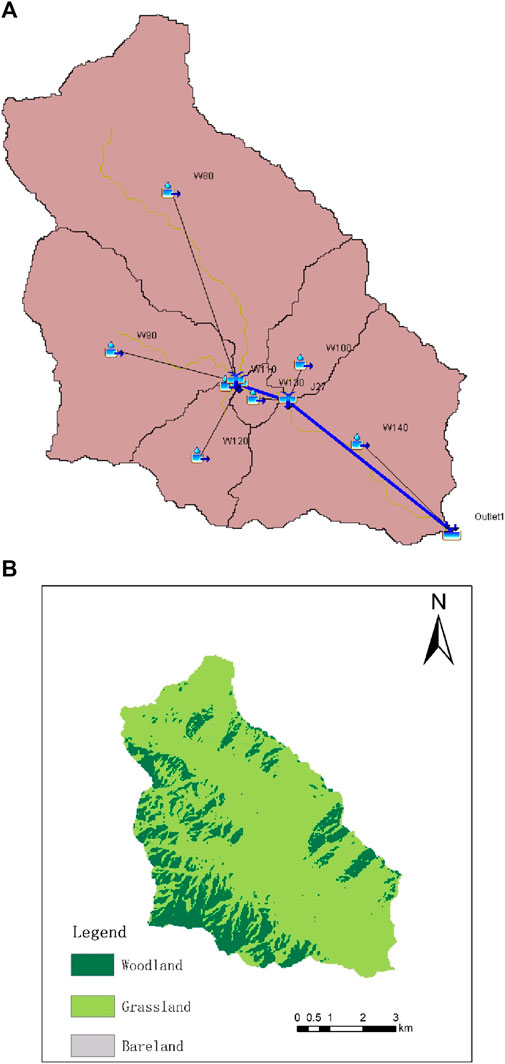
FIGURE 2. (A) Suyukou watershed Model, (B) Landuse type.
The analysis and rate determination of some parameters in the HEC-HMS model need to be supported by the land use type, for example, in the initial loss stabilization infiltration method in the flow production calculation stage, the model simulation needs to pass the land use type data and calculate the impervious area parameters and soil infiltration rate of the study area. The land use data were transformed and projected, cropped and classified using ArcGIS to obtain the land use type map of the Suyukou watershed as shown in Figure 2. The land use uses the coverage data downloaded from GlobeLand30 with 30 m spatial resolution, which currently supports downloading data for 2000, 2010 and 2020. In view of the low human activities in the eastern Helan Mountains and the little change in land use types, the land use of 2020 is uniformly used in this study.
The typical design for this rain patterns adopts hourly measured rainfall from the two rainfall stations, Linkuang and Suyukou, in the Suyukou watershed. The starting time is selected as the time when the rainfall during the rainfall process is more than or equal to 3 mm, and the ending time is selected as the time when the rainfall is less than 3 mm in a continuous 3-h period. Due to the small area of the sub watershed in the Suyukou watershed and the short duration and high intensity of rainfall during flash floods on the eastern foot of Helan Mountain, only 6-h short duration rainfall processes were selected as the research data in this study. Divide existing rainfall data based on the classification criteria for short-term rainfall events. This study screened 63 typical 6-h rainfall processes from hourly scale measured rainfall data from 4 rainfall stations.
This article will combine the two characteristic factors of rainfall peak position and rainfall process shape to construct a diverse rainfall pattern that represents the characteristics of rainfall peak position and rainfall shape. The parameter “rainfall peak location coefficient r” indicates the time of rainfall intensity peak, and the parameters “concentrated Trend Index CTI” and “deformation distance d” quantify the shape characteristics of rainfall intensity to jointly build a diversified characteristic rainfall model.
Rain peak position coefficient r refers to the ratio of the time period during which the maximum rainfall occurs per unit time during a rainfall process to the total duration of that rainfall, which is used to determine the time when the rainfall peak appears in that rainfall event. The calculation method is as follows:
In the formula: Tmax is the time/h at which the maximum rainfall occurs within a unit time period; T is the total duration of rainfall per hour.
CTI is a parameter used to describe the distribution of rainfall peaks and their adjacent time periods during rainfall events. The values of the boundary conditions
The CTI calculation formula is as follows:
In the formula: Ptr is the unit time period rainfall/mm at the peak of rain; Pt is the rainfall during the period/mm; Tr is the period during which the rain peak occurs; I is the number of adjacent time periods during peak rain periods; B is the normalized index per unit time period, i.e.,
Deformation distance d can further study the trend of increasing and decreasing precipitation intensity. This parameter refers to the jump between the cumulative precipitation at the peak and the cumulative precipitation at adjacent time points before and after the peak.
Due to the changes in the position of the rain peak during the rainfall process, it can be summarized into three situations: (a) the rain peak is located at the beginning of the rainfall; (b) the rain peak appears in the middle of the rainfall; (c) the rain peak appears at the end of the rainfall. The deformation distance d can be expressed as a piecewise function, as follows:
In the formula: Htr is the cumulative rainfall at the time of the rain peak/mm; Htr-1、Htr+1 are the cumulative rainfall/mm before and after the adjacent rain peaks; tr-1、tr+1 represent the pre and post rain peak periods/h.
Three This study analyzes the mechanism of flash floods in the Suyukou watershed by collecting historical flash flood-related data survey, collection, collation and site investigation, combining actual measured precipitation and runoff data, meteorological station distribution, digital elevation model, land use and soil type and remote sensing images in the study area. A digital watershed model based on HEC-GeoHMS is constructed to establish the relevant database, determine the rainfall weights of sub-basins and the base parameter conditions. The HEC-GeoHMS model is used to adjust the parameter rates in conjunction with historical flash flood runoff relationships, to determine the water level and flow relationships in the study area in conjunction with measured rainfall and runoff data, and to design a diverse set of rainfall types. The HEC-HMS model, the water level and flow relationship, and the design of rainfall patterns are used to determine the early warning index calculation for flash floods in the study area. The specific basic flow of the study is shown in Figure 3.
FIGURE 3. Basic flow chart.
Due to incomplete data and other reasons, this study only used two rainfall stations in the Suyukou watershed, Suyukou and Linkuang, for flood simulation. The location of rainfall stations is shown in Figure 4A.
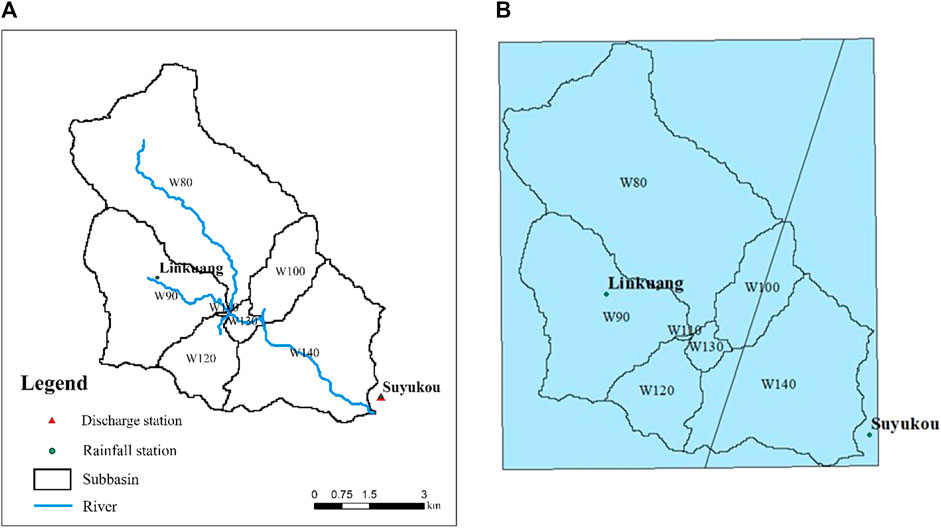
FIGURE 4. Distribution of Rainfall Stations in the Suyukou watershed. (A) Location of rainfall stations, (B) Thiessen polygon distribution.
Seven sub watersheds use two rainfall stations, namely, Linkuang and Suyukou, and the contribution weights of the rainfall stations to each sub watershed are generalized using the Thiessen polygon, as shown in Figure 4B. The weights of rainfall data used in each sub-basin are calculated from the images and entered into the basin model.
Five typical flood events with detailed data from 2016 to 2018 were selected for simulation. Due to the relatively new year and relatively complete measurement of rainfall data, the time scale of rainfall and flow data during the flood period is 10 min. Using five floods with relatively complete data from 1984 to 2012 for parameter validation, the time scale of rainfall and flow data during the validation period is 1 h. Obtain the basic situation and simulation results of five typical floods on a regular basis (Table 2; Figure 5):
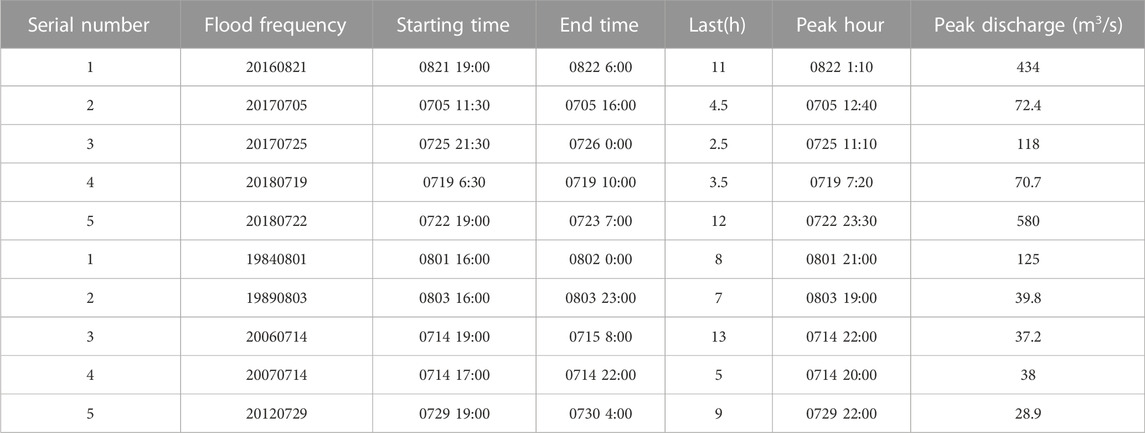
TABLE 2. Basic flood conditions.
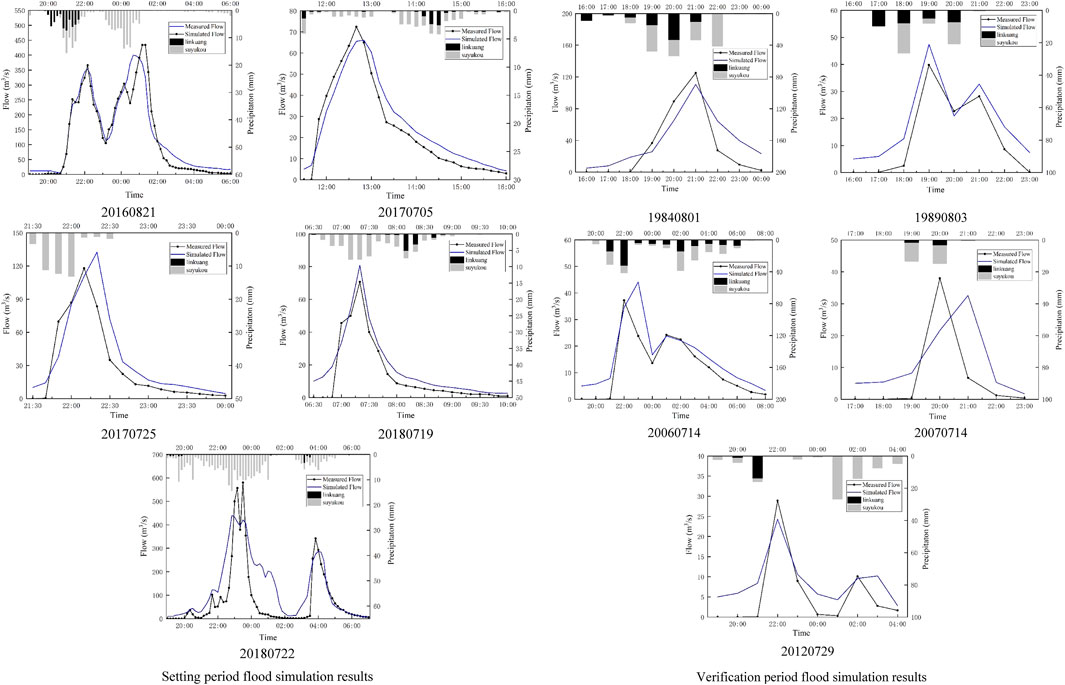
FIGURE 5. Flood simulation results.
Based on the simulation results of five regular flood processes, the parameters were calibrated and validated using floods with relatively complete data from 1984 to 2012 to obtain flood frequency information and validation results (Table 2; Figure 5).
This study selected the peak to peak time difference Δt, Relative error of flood peak REp and Nash efficiency coefficient (NSE) are three evaluation criteria to distinguish the simulation results of the model (Zhang and Tang, 2021). According to the relevant provisions of the Standard for Hydrological Information and Hydrological Forecasting of the People’s Republic of China (GB22482-2008T) and international hydrological model evaluation standards, the error of flood peak occurrence time is within 3 h, the relative error of flood peak is within 20%, which is qualified, and the Nash efficiency coefficient is greater than 0.9, which is Class A accuracy; the Nash efficiency coefficient between 0.7 and 0.9 is of second order accuracy; the Nash efficiency coefficient is of Class C accuracy between 0.5 and 0.7. The calculation expressions are (Majid and Mohammad, 2021a; Majid et al., 2021b):
In the formula: ts is the simulated flood peak time; t0 is the measured flood peak time; Δt is the time difference between peak and current.
In the formula: Qs is the simulated peak flow rate; Q0 is the measured peak flow rate; Rep is the relative error of flood peak.
In the formula:
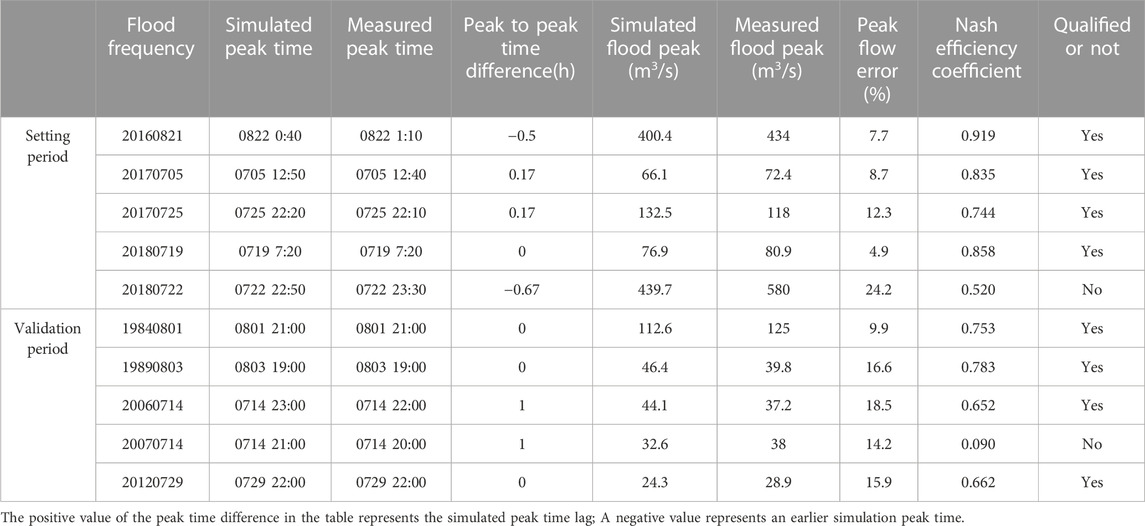
TABLE 3. Flood simulation results.
Table 3 reflects the basic situation and effectiveness of using HEC-HMS model to simulate five floods in the Suyukou watershed during the validation period and at regular intervals. It can be seen that within the designated period, a total of four out of five floods were simulated as qualified, with a qualification rate of 80%. From the perspective of peak occurrence time, the simulated peak occurrence time of the five floods is within 3 h of the measured value. The peak flow error of the 20180722 flood simulation reached 24.2%, which has a certain error compared to the qualified standard. The Nash efficiency coefficient is only 0.520, which is of Class C accuracy. Overall, it is evaluated as an unqualified flood simulation, and the reasons for the error are shown in Section 3.3. Among the other four flood events, the Nash efficiency coefficient of the 20160821 flood reached 0.919, overall achieving Class A accuracy, while the Nash efficiency coefficients of the remaining three floods were 0.835, 0.744, and 0.858, all of which were Class B accuracy. During the validation period, all five floods except for the 20070714 flood were simulated as qualified, with a qualification rate of 80%. Among them, the Nash efficiency coefficients of the 19840801 floods and the 19890803 floods reached 0.753 and 0.783, respectively, achieving Class B accuracy. The Nash efficiency coefficients for the floods of 20060714 and 20120729 were 0.652 and 0.662, respectively, achieving Class C accuracy. The peak flow rate and occurrence time error of the five floods were within a reasonable range, but the Nash efficiency coefficient of the 20070712 flood was only 0.090, indicating that the simulation results were unqualified.
As shown in Section 3.2, the simulation results have achieved a good correspondence with the measured results, but there are still some errors, which may be caused by.
(1) Insufficient data monitoring accuracy
The total area of the Suyukou watershed is 50.5 km2, and this simulation only used two rainfall stations, Linkuang and Suyukou, in the study area. Due to the remote geographical location and economic factors of the Suyukou research area, the distribution of survey stations is relatively scattered, and the distribution of survey stations is also uneven. Measurements may also have deviations (Qiu et al., 2019), which may differ from the actual flood hydrograph. In addition, due to the imperfect early monitoring system and relatively backward measuring equipment, data measurement and recording often require manual operation, and in case of a major rainstorm, there may be errors in the measurement due to the inability to obtain data in time, resulting in errors in the simulation results.
(2) The underlying surface has changed
During this study, there was a significant difference in the maximum years of simulated floods, with a maximum span of 34 years. Due to factors such as hydrological and meteorological changes in space and time, as well as human activities (Hu and Shrestha, 2020), the underlying surface conditions and specific situations at the time of each flood occurrence were actually different (Azizi et al., 2021). However, this study only used fixed and unchanged underlying surfaces to calibrate parameters, which is also the reason for the error (Mohammad, 2018).
(3) The generalized impact of rainfall data
The areal rainfall in Suyukou watershed is obtained by generalizing the rainfall weight according to the Thiessen polygon method based on the geographical location of rainfall stations, while ignoring the influence of rainstorm center on the whole rainstorm flood hydrograph. However, the rainstorm center actually has a very obvious peaking effect on the flood hydrograph, affecting the peak value and peak time in the flood simulation results, which is also the reason for the error between the measured value and the peak value.
Taking the analysis of flood simulation results from 20180722 flood as an example: It can be seen that the precipitation and flood processes in the Suyukou watershed cannot be completely matched, and the latter half of the rainfall did not produce a significant flow process. However, from 23:30 on July 22 to 1:00 on July 23, the precipitation reached 68 mm, accounting for about 1/4 of this precipitation, but the flood flow decreased rapidly. Through analysis, it was found that the possible cause of this phenomenon was the movement of the rainstorm center. The rainfall range of the rainstorm center after the movement was located at the downstream of the catchment area of the hydrological station, close to the location of the hydrological station, and had little impact on the flood process of the hydrological station, but in reality, the rainfall in the watershed is still rising. Therefore, increasing the layout of rainfall stations and improving the monitoring capacity will help to better capture the central position of rainstorm and get more accurate rain and flood forecast.
The rainfall patterns in a region are not limited to a single form. Rainfall patterns always have diversity and randomness. If only one rainfall pattern is used to predict flood occurrence in early warning and forecasting research, the characteristics of other rainfall patterns in the study area are not taken into account, and the results will be greatly different from the actual situation. Therefore, this study uses different precipitation types with different characteristics for early warning and prediction. Based on the measured precipitation data in the study area, a cumulative precipitation time history distribution function with precipitation type characteristics is constructed. The distribution curve of precipitation over time is obtained through a first-order differential distribution function to determine different precipitation types corresponding to the actual precipitation situation (Yuan et al., 2019b).
Based on the actual rainfall process of the rainfall station, 63 rainfall processes with a duration of 6 h were selected to calculate the location coefficients of each rainfall peak, and the distribution pattern of typical rainfall peak positions was analyzed. Formula (2) is used to calculate the central tendency of each rainfall, where α = 0.06, β = 0.20 is calculated by selecting the typical uniform rainfall and typical concentrated rainfall utilization Eq. 2 from the measured rainfall data in the Suyukou watershed. Calculating the deformation distance of each rainfall event with equation, which can help to analyze the shape characteristics reflected in the temporal distribution of rainfall in the Suyukou watershed, and to represent the characteristics of rainfall intensity changing over time throughout the entire rainfall event.
Based on the diversity characteristics of rainfall processes, this article proposes six representative feature rain patterns, namely, Before-Concentrated, Before-Dispersive, Middle-Concentrated, Middle-Dispersive, Behind-Concentrated and Behind-Dispersive. Due to the existence of uniform rainfall during the actual rainfall process, this is a type of rainfall where the variation of rainfall intensity over time is relatively small, and the difference in rainfall between different periods of the entire rainfall is not significant.
Through the statistics of 63 historical measured rainfall data, the frequency of different characteristic rainfall patterns in the Suyukou watershed is shown in Figure 6. The statistical results demonstrate the diversity of rainfall types in the Suyukou watershed. Among them, the rainfall events with the highest peak position occur the most, with a probability of 52.4%, with concentrated rainfall accounting for 17.5% and scattered rainfall accounting for 34.9%. The types of rainfall with a peak position in the middle and behind are slightly fewer, but their proportion in overall statistics is still relatively large. The proportion of rainfall with a peak position in the middle reaches 25.4%, while the proportion of rainfall with a peak position behind is 20.6%. Due to the relatively small occurrence of uniform rainfall, it can be ignored, and future research will no longer consider uniform rainfall patterns.
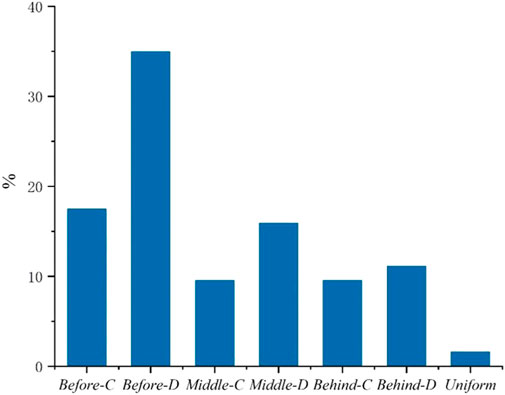
FIGURE 6. Diversity characteristics rainfall field statistics results.
Due to differences in different regions, the construction and selection of cumulative precipitation distribution function and probability density function of typical precipitation in the study area should be determined in combination with the specific catchment characteristics and soil conditions in the study area to find the distribution function that conforms to the characteristics of the actual situation in the study area. In order to better fit the cumulative distribution function and the probability density function, when adjusting the cumulative rainfall distribution over time according to rainfall patterns with different characteristics, it is usually necessary to evaluate the adjustment results through evaluation. Select four indicators Adj. R-Square, RSS, Prob > F, and DFit Status for fitting evaluation.
Nonlinear fitting was performed on the short-term cumulative rainfall duration distribution curve under six diverse rainfall characteristics in the Suyukou watershed to determine the cumulative distribution function. The results are shown in Figure 7 and Table 4.
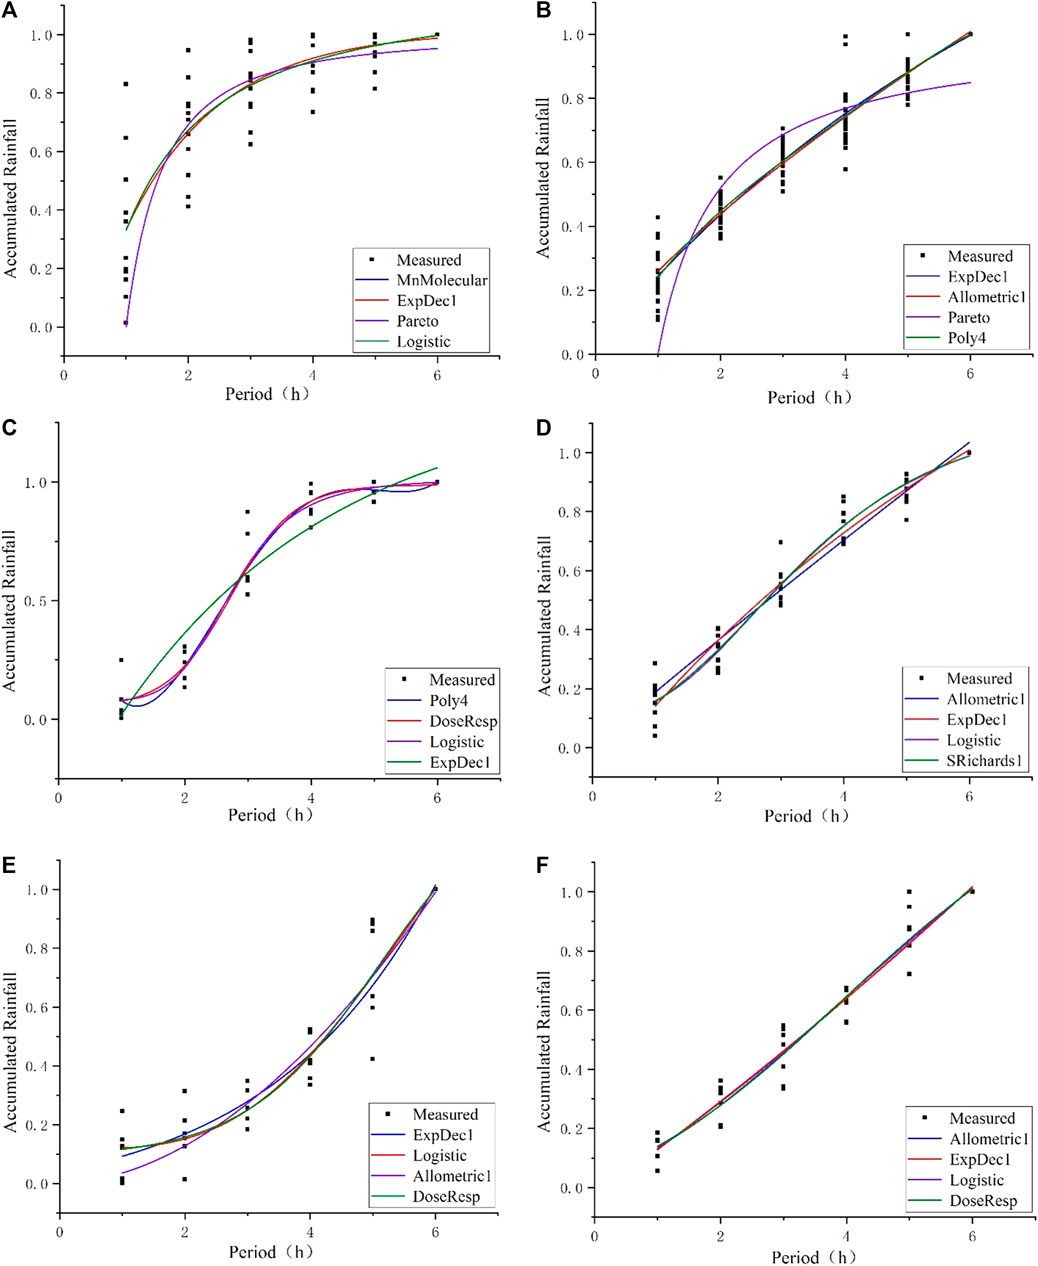
FIGURE 7. Fitting results of cumulative rainfall distribution of characteristic rainfall patterns. (A) Before-C, (B) Before-D, (C) Middle-C, (D) Middle-D, (E) Behind-C, (F) Behind-D.
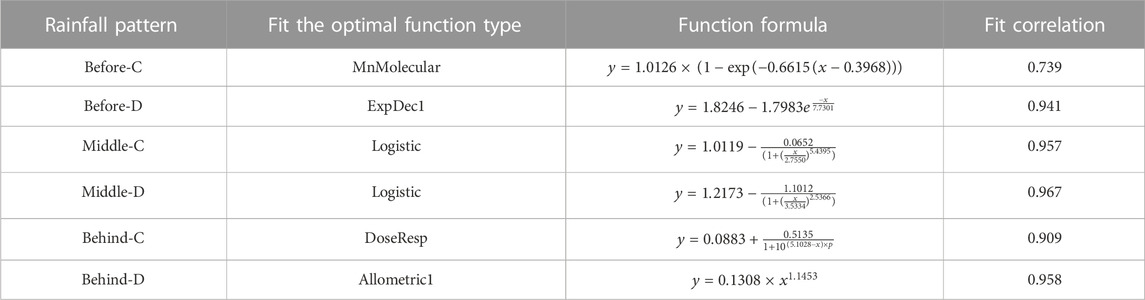
TABLE 4. Optimal fitting function equation for each rain pattern.
By performing first-order differentiation on the fitting functions of different characteristic rainfall patterns in Table 4, the distribution of descending rain time history for different characteristic rain patterns can be obtained as shown in Figure 8. The subsequent rainfall input sequence is designed according to the following allocation.

FIGURE 8. Characteristic rainfall patterns time allocation process.
In summary, when determining the relationship between rainfall and runoff, the randomness and diversity of rainfall itself cannot be ignored. The specific time distribution process of rainfall should be used to describe the rainfall process in the region. Extracting the diversity characteristics of rainfall distribution characteristics in different periods of the Suyukou watershed and classifying them, analyzing and calculating the diversity of rainfall patterns that can represent their rainfall characteristics, can improve the accuracy of the rainfall runoff relationship, and provide more accurate input conditions for determining early warning indicators in mountain flood analysis research.
In order to calculate the warning index in this study, the warning period is defined as the typical rainfall duration of the target basin. The required rainfall warning index in this study is obtained based on experimental modeling and calculation of critical rainfall at different warning periods. The critical rainfall is also related to the disaster water level of the research object, which is the minimum rainfall and rainfall intensity that can be reached or exceeded when the river section water level coincides with the disaster water level. Therefore, the warning period of the watershed should be estimated in advance. Taking the Suyukou watershed as an example, the calculation method is as follows.
(1) Determine the longest catchment period: Check the hydrological basin model, where the watershed with the farthest distance from the outlet is W80 (Figure 4A), and the catchment time to the outlet is about 6 h. Therefore, the longest catchment time for this study is determined to be 6 h.
(2) Determine the typical time period: Typically, typical time periods are determined based on various comprehensive situations in the study area. In this study, the Suyukou watershed belongs to a small watershed, so the minimum warning period is selected as 0.5 h, and other typical warning periods are selected as 1 h and 3 h, respectively. The subsequent design rainfall duration for the designated flood control section of the Suyukou wayershed is divided into four time periods: 0.5 h, 1 h, 3 h, and 6 h.
The analysis of early warning indicators requires analyzing the degree of moisture in the soil before precipitation. Before the occurrence of rainfall events, the degree of soil moisture in the watershed has a significant impact on the generation of flow. If the soil is initially very humid, it is more likely to generate flow than if a rainfall event occurs in a dry soil state. The Suyukou watershed, which was simulated in this study, is located in the arid northwest region, with floods typically occurring during the hotter seasons of July, August, and September. This article divides the soil moisture in the early stages into three types: extremely dry, relatively dry, and average. The soil moisture content is set to: 0.2Wm, 0.5Wm, 0.8Wm.
The calculation of critical flow rate generally involves analyzing the relationship between water level and flow rate. The critical flow rate, also known as the flow rate corresponding to the flood level, is very important for analyzing flood control capacity and warning indicators. It can be determined based on the water level flow relationship, that is, the critical flow rate can be derived based on the disaster water level of the research object.
Based on the disaster water level obtained from on-site survey and search, the water level flow relationship of the river is calculated, as shown in Figure 9. The catastrophic water level is 1,434.3 m, and the critical flow rate can be calculated to be 83.26 m3/s based on the water level flow curve in Figure 9.
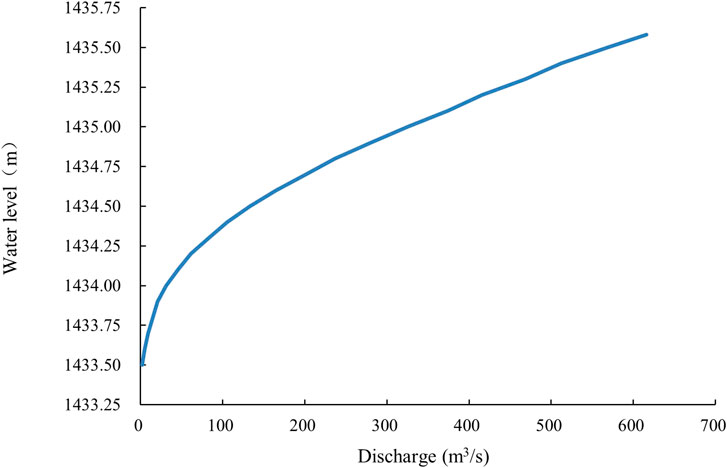
FIGURE 9. Water level discharge relationship curve.
This article uses critical flow as a warning indicator for mountain flood warning. Based on the analysis of measurement data, the critical flow rate value of the study area was calculated. On the basis of the HEC-HMS model, with initial rainfall as the model input, based on the calculated critical flow rate, a series of design rainfall based on measured data and modeling results are assumed to simulate and analyze the flood process in the study area. The flood flow simulated by the above model were compared and analyzed with the calculated critical flow of the study area If these two flows are equal, it is assumed that the rainfall is the critical rainfall in the study area.
By distributing precipitation to various characteristic precipitation types (Yuan et al., 2019a), the precipitation distribution at different time periods within different confluence times in the Suyukou watershed was calculated, which is the rainfall sequence used to input the model. Based on the debugged parameters, the HEC-HMS model was used to calculate and compare the calculated peak flow with the disaster flow, forming a flood simulation hydrograph (Shen et al., 2021), so this assumption is that the rainfall is the critical rainfall for this research object (Table 5).
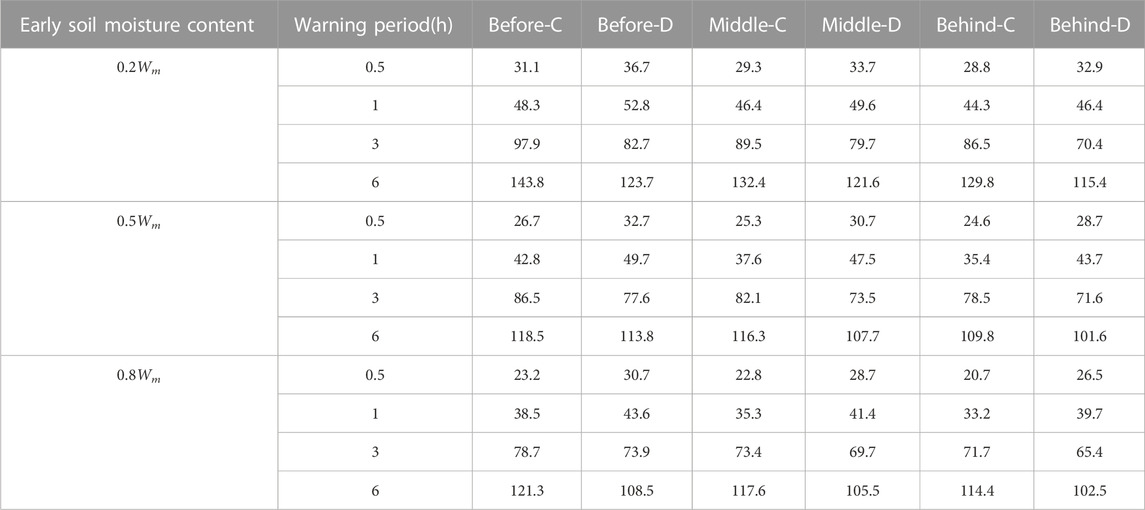
TABLE 5. Critical rainfall results under different conditions in the study area. Unit: mm.
This study used HEC-HMS to simulate the flood hydrograph of small watersheds in the northwest mountainous areas of China, and the simulation effect was good. It has great application value in the analysis of early warning indicators in hilly watersheds, but there are shortcomings in the work. The simulation accuracy can be further improved from the following aspects.
The input rainfall and runoff data of the model has a significant impact on the calculation performance of the model. Currently, only two representative stations in the Suyukou watershed have been selected for flood simulation, which poses a problem of poor representativeness of rainfall data from rainfall stations. In the future, simulation should be conducted on the premise of obtaining more rainfall station data, in terms of monitoring, the accuracy of monitoring can be improved by adding monitoring points, rainfall stations, etc.
The HEC-HMS hydrological model integrates many different hydrological models and algorithms, and only by selecting and using these methods reasonably can the model maximize its benefits. In this study, due to the limitation of data and time, the selection of hydrological model simulation method is relatively hasty, and the parameters are not determined completely through the physical properties of the study area, which cannot give full play to the maximum benefit of the hydrological model. The hydrological model with physical distribution significance should be further studied in the next study to better simulate the rainstorm and flood process.
(3) This study temporarily only used HEC-HMS hydrological model for flood process simulation. Although good simulation results were achieved, the actual physical significance of some parameters was still ignored in the calibration of some parameters. At present, although there are few mature models in China that can be used for flood simulation, there are also some that can be used in practical work. In the future, further research can be strengthened on the basis of this study, using more hydrological models to simulate the region’s hydrology, comparing the simulation results, selecting the most suitable model that can use multiple different hydrological models for the same area for modeling and simulation, and selecting the model with the best simulation results to achieve more comprehensive warning and forecasting indicators.
In this study, the innovation lies mainly in the design of the three-parameter rainfall set based on the actual conditions of the study area. In the research process of early warning indicators, different from the previous rainstorm intensity formula and the single design of rainstorm rainfall pattern, this study designed a characteristic rainfall pattern set that conforms to the actual situation of the study area based on the three parameters representing the peak rainfall and rainfall distribution, and designed rainfall time distribution based on the rainfall pattern set, providing support for accurate early warning of mountain torrents in the study area. In the design of rain pattern, the rain pattern describes the distribution process of rainstorm intensity on the time scale, which requires that both intensity variation and time variation be considered. Since the 1950s, many scholars have adopted different methods to study rainfall patterns, and have successively proposed the Chicago Rainfall Model (Keifer and Chu, 1957), Huff Rainfall Model (Huff, 1967), and P&C Rainfall Model (Pilgrim and Cordery, 1975), which have been used for the calculation of urban floods. Chen et al. (2023) used a hydrological and hydrodynamic model to simulate design rainfall based on the Chicago rain pattern at different return periods and rainfall peaks, analyzing the total amount of water accumulation and inundation range. With the deepening of research, rainfall patterns are gradually being applied to flash flood warning. At present, the traditional rain fall pattern (TRP) is often used to calculate the critical rainfall of a watershed. TRP is a simplified single rainfall model, which is usually determined according to the typical rainfall process in the rainstorm manual in the region. For example, the TRP in Henan Province rainstorm handbook is the typical 24 h rainfall process of “75.8” food (i.e., a terrible flood occurred in August 1975). However, due to the randomness of rainfall, a single rainfall pattern during the flood season may lead to inaccurate design floods or hydrological simulations, affecting the accuracy of critical rainfall. Therefore, in disaster warning, it is necessary to determine the appropriate rainfall pattern by considering the rainfall characteristics of small watersheds. After collecting rainfall data from Ukraine, former Soviet scholars such as Bao Gaomazova roughly divided rain patterns into seven types. By calculating the proportional relationship between rainfall at each time period and total rainfall and comparing the similarity of the seven typical rain patterns, they determined the type of rain pattern. This method is called fuzzy recognition method. Sun et al. (2019) used the fuzzy recognition method to analyze the short duration rainstorm in Nanjing in recent 25 years, identify the rain pattern of each rainstorm sample, analyze the composition structure of the rain pattern of each rainstorm sample, and explore the distribution law of the rain peak from the number and coefficient of the rain peak. Based on the distribution characteristics of actual rainfall, this study uses three characteristic parameters to describe the time distribution of rainfall process under different rainfall peak locations and rainfall trends, selects an appropriate cumulative distribution function, and uses probability density function to characterize the characteristic rainfall model. Compared to single design rain patterns and fixed rain patterns, using characteristic parameters to classify rain patterns is more flexible, and the determined set of rain patterns is more in line with local actual conditions, which has good applicability and is worth promoting.
In this paper, Suyukou watershed, a typical watershed in the eastern foot of Helan Mountain, is taken as the main research object. HEC-HMS model is used to simulate the flood process in the watershed. The model parameters are optimized and calibrated through five floods with newer years and more complete data. The rationality of model parameters is verified with five data validation of floods with longer years, and good simulation results are obtained. The main conclusions are as follows.
(1) The HEC-GeoHMS extension module of ArcGIS is used to generate a digital water system map of the Suyukou watershed through a digital elevation model and establish a watershed model. Using the constructed hydrological model, using rainfall data from two rainfall stations, Linkuang and Suyukou, and runoff data from Suyukou hydrological station, five floods were selected for parameter calibration analysis. The model simulation results were validated using five floods. The results showed that 8 out of 10 typical floods passed the qualification test, with a qualification rate of 80%. The simulation results are good. This indicates that HEC-HMS has good applicability in small watersheds in mountainous areas, and has guiding significance for model simulation of small watersheds in mountainous areas. It can provide a foundation for flood warning and prediction in mountainous areas and can be widely used.
(2) A characteristic rain pattern set is designed based on three parameters that represent the position of rain peaks and the trend of rainfall, and a cumulative precipitation time history distribution function with precipitation type characteristics was constructed by conbining with the actual measured rainfall data in the research area. Through first-order differentiation, obtain the distribution curve of precipitation over time, and determine the rainfall set corresponding to the actual rainfall situation. Based on the characteristic parameter design, the characteristic rain pattern set adapted to the measured rainstorm in the Suyukou wateshed found that the rainfall frequency in front of the peak position appeared most, accounting for 52.4% of the total rainfall frequency, of which the concentrated rainfall accounted for 17.5% and the dispersed rainfall accounted for 34.9%. Rainfall with a peak at the center and a peak at the back account for 25.4% and 20.6%, respectively. The frequency of scattered rainfall in different peak positions is higher than that of centralized rainfall. Compared with a single designed rain pattern, rain patterns based on actual rainfall characteristics can more fully represent the actual situation of the research area and provide more accurate input conditions for the determination of early warning and forecasting.
(3) The measured cross-sectional map of the research area was obtained through on-site investigation and establish a water level discharge relationship curve. Then, based on on-site investigation and relevant staff experience, obtain water level warning indicators and calculate the critical flow rate. Design rainfall time history allocation under different characteristic rainfall patterns as input conditions for the model, determine different warning periods based on the study area’s convergence time, and combine three soil moisture content models. Apply model trial calculation method to continuously calculate the critical rainfall of the research object under different soil states, rainfall duration, and characteristic rainfall patterns as warning indicators. It can be seen that there are significant differences in the warning indicators under different rain patterns; the longer the warning time, the higher the warning indicators; the lower the soil moisture content, the higher the warning indicators. The results provide theoretical support for the Suyukou watershed flash flood warning and forecasting system.
The original contributions presented in the study are included in the article/supplementary material, further inquiries can be directed to the corresponding author.
CcL: Project administration, conceptualization, methodology. CgL: Software, formal analysis, writing—original draft. SB: Investigation, supervision. ML: Writing—review and editing. All authors contributed to the article and approved the submitted version.
The work described in this publication was supported by 1) The National Key Research and Development Program of China (No. 2022YFC3002902). 2) Natural science foundation of Ningxia Hui Autonomous Region (No. 2023AAC03034). 3) The National Natural Science Foundation of China Yellow River Water Science Research Joint Fund Project (No. U2243601-02). 4) The University First Class Discipline Construction Project of Ningxia, China (NXYLXK 2021A03).
This is a short text to acknowledge the contributions of specific colleagues, institutions, or agencies that aided the efforts of the authors.
The authors declare that the research was conducted in the absence of any commercial or financial relationships that could be construed as a potential conflict of interest.
All claims expressed in this article are solely those of the authors and do not necessarily represent those of their affiliated organizations, or those of the publisher, the editors and the reviewers. Any product that may be evaluated in this article, or claim that may be made by its manufacturer, is not guaranteed or endorsed by the publisher.
Aksoy, H., Kirca, V. S. O., Burgan, H. I., and Kellecioglu, D. (2016). Hydrological and hydraulic models for determination of flood-prone and flood inundation areas. Proc. IAHS. 373, 137–141. doi:10.5194/piahs-373-137-2016
Al-Suhili, R., Cullen, C., and Khanbilvardi, R. (2019). An urban flash flood alert tool for megacities—application for manhattan, New York city, USA. Hydrology 6 (2), 56. doi:10.3390/hydrology6020056
Azizi, S., Ilderomi, A. R., and Noori, H. (2021). Investigating the effects of land use change on flood hydrograph using HEC-HMS hydrologic model (case study: Ekbatan Dam). Nat. Hazards 109 (1), 145–160. doi:10.1007/s11069-021-04830-6
Castro, C. V., and Maidment, D. R. (2020). GIS preprocessing for rapid initialization of HEC-HMS hydrological basin models using web-based data services. Environ. Model. Softw. 130, 104732. doi:10.1016/j.envsoft.2020.104732
Chen, J., Li, Y., and Zhang, C. (2023). The effect of design rainfall patterns on urban flooding based on the Chicago method. Int. J. Environ. Res. Public Health 20, 4245. doi:10.3390/ijerph20054245
Cheng, X., Ma, X., Wang, W., Xiao, Y., Wang, Q., and Liu, X. (2021). Application of HEC-HMS parameter regionalization in small watershed of hilly area. Water Resour. Manag. 35, 1961–1976. doi:10.1007/s11269-021-02823-5
Cui, Y., Kong, J., and Tian, S. (2011). The critical role for heavy rainfall in the evolution of the mountain hazards chains. Mt. Res. 29, 87–94+8. doi:10.1007/s12182-011-0118-0
Georgios, M., Elpida, P., Vasiliki, S., Evangelos, B., Michalis, D., Efthymios, L., et al. (2022). Optimizing the performance of coupled 1D/2D hydrodynamic models for early warning of flash floods. Water 14, 2356. doi:10.3390/w14152356
Hu, S., and Shrestha, P. (2020). Examine the impact of land use and land cover changes on peak discharges of a watershed in the midwestern United States using the HEC-HMS model. Pap. Appl. Geogr. 6, 101–118. doi:10.1080/23754931.2020.1732447
Hu, Y. B. (2019). Determination of mountain flood warning index based on distributed hydrological model. IOP Conf. Ser. Earth Environ. Sci. 267, 032050. doi:10.1088/1755-1315/267/3/032050
Huang, W., Cao, Z., Huang, M., Duan, W., Ni, Y., and Yang, W. (2019). A new flash flood warning scheme based on hydrodynamic modelling. Water 11, 1221. doi:10.3390/w11061221
Huff, F. A. (1967). Time distribution of rainfall in heavy storms. Water Resour. Res. 3, 1007–1019. doi:10.1029/wr003i004p01007
Keifer, C. J., and Chu, H. H. (1957). Synthetic storm pattern for drainage design. J. Hydraulics Div. 83, 104. doi:10.1061/jyceaj.0000104
Li, C., Wang, M., Chen, F., Coulthard, T. J., and Wang, L. (2023). Integrating the SLIDE model within CAESAR-Lisflood: Modeling the ‘rainfall-landslide-flash flood’ disaster chain mechanism under landscape evolution in a mountainous area. Catena 227, 107124. doi:10.1016/j.catena.2023.107124
Majid, N., and Mohammad, Z. (2021a). Application of MGGP, ANN, MHBMO, GRG, and linear regression for developing daily sediment rating curves. Math. Problems Eng. 2021, 13. doi:10.1155/2021/8574063
Majid, N., and Mohammad, Z. (2021b). Assessment of artificial intelligence models for developing single-value and loop rating curves. Complexity 2021, 21. doi:10.1155/2021/6627011
Mehlath, S., and Lone, L. M. (2022). Flood modeling and simulation using HEC-HMS/HEC-GeoHMS and GIS tools for river sindh-NW himalayas. KN - J. Cartogr. Geogr. Inf. 72, 325–333. doi:10.1007/s42489-022-00116-4
Mohammad, Z. (2018). Comparative analysis of the novel infiltration model with other infiltration models. Water Environ. J. 33 (4), 620–631. doi:10.1111/wej.12435
Mosey, H. I. R., Pandara, D. P., Bobanto, M. D., and Sangian, H. S. (2019). A simple low-cost video-based surveillance system for a flash flood warning system. IOP Conf. Ser. Mater. Sci. Eng. 567, 012043. doi:10.1088/1757-899x/567/1/012043
Nguyen, T. N., Pham, C. X., Nguyen, H. Q., and Dang, T. N. B. (2019). Establishing an early warning system for flash floods in Hoang Su Phi district, ha Giang province, vietnam. Singap. J. Trop. Geogr. 40, 312–333. doi:10.1111/sjtg.12276
Pilgrim, D. H., and Cordery, I. (1975). Rainfall temporal patterns for design floods. J. Hydraulics Div. 101, 81–95. doi:10.1061/jyceaj.0004197
Qiu, Z., Su, E., Yao, C., and Wang, L. (2019). Impact of rain gauge network intensity on flood simulation and model parameters. Water Power 45, 20–24.
Shen, Z., Ding, Y., and Kong, Q. (2021). Application study of coupling rainfall-runoff modeling and floodplain inundation mapping. J. Geo-information Sci. 23, 1473–1483. doi:10.12082/dqxxkx.2021.200621
Sun, Z., Bao, Z., Shu, Z., Liu, Y., Liu, Y., and Wang, G. (2019). Patterns characteristics of short duration rainstorms in nanjing city over recent 25 years. J. China Hydrology 39, 78–83. doi:10.19797/j.cnki.1000-0852.20180191
Tu, H., Wang, X., Zhang, W., Peng, H., Ke, Q., and Chen, X. (2020). Flash flood early warning coupled with hydrological simulation and the rising rate of the flood stage in a mountainous small watershed in sichuan province, China. Water 12, 255. doi:10.3390/w12010255
Wang, L., and Sun, W. (2019). Research on HEC-HMS and vflo rainfall characteristics simulation and comparative based on dem data: A case of miyun district, beijing. Acta Sci. Circumstantiae 39, 3559–3564. doi:10.13671/j.hjkxxb.2019.0275
Wang, X., Chen, R., Li, K., Yang, Y., Liu, J., Liu, Z., et al. (2023). Trends and variability in flood magnitude: A case study of the floods in the qilian mountains, northwest China. Atmosphere 14, 557. doi:10.3390/atmos14030557
Yang, K., Ji, X., Mao, L., Zhang, C., Yang, J., and Zhang, S. (2020a). Cell polarity: Regulators and mechanisms in plants. J. Nat. Disasters 29, 132–147. doi:10.13577/j.jnd.2020.0114
Yang, K., Ji, X., Mao, L., and Zhang, S. (2020b). Numerical simulation and comparative analysis of topographic effects on two extraordinary severe flood rainstirms in Helan Mountain. J. Arid Meteorology 38, 581–590. doi:10.11755/j.issn.1006-7639(2020)-04-0581
Yoo, C., Lee, J., Chang, K., and Yang, D. (2019). Sensitivity evaluation of the flash flood warning system introduced to ungauged small mountainous basins in Korea. J. Mt. Sci. 16, 971–990. doi:10.1007/s11629-018-4984-4
Yuan, W., Song, H., and Liu, M. (2019a). An early warning model for flash floods based on random rainfall patterns. Adv. Water Sci. 30, 515–527. doi:10.14042/j.cnki.32.1309.2019.04.007
Yuan, W., Song, H., and Liu, M. (2019b). Study on critical rainfall threshold space of flash flood based on rainfall population. Water Resour. Hydropower Eng. 50, 70–79. doi:10.13928/j.cnki.wrahe.2019.07.009
Zhang, W., Liu, Y., Zhang, X., Tang, W., and Song, S. (2022). Flood routing simulation and analysis of lian'anwei flood protection zone. Water Resour. Prot. 38, 1–6. doi:10.3880/j.issn.1004-6933.2022.02.001
Zhang, Z., and Tang, Y. (2021). Simulation accuracy analysis of HEC-HMS distributed hydrological model under different objective functions. World Sci. Res. J. 7, 13. doi:10.6911/WSRJ.202105_7(5).0017
Keywords: HEC-HMS hydrological model, hydrological processes, different rainfall patterns, soil water content, Suyukou watershed
Citation: Li C, Li C, Bao S and Li M (2023) Influence of different rainfall patterns and soil water content on hydrological processes in small watersheds. Front. Environ. Sci. 11:1221571. doi: 10.3389/fenvs.2023.1221571
Received: 12 May 2023; Accepted: 27 July 2023;
Published: 24 August 2023.
Edited by:
Jing Zhang, North China University of Water Conservancy and Electric Power, ChinaReviewed by:
Halil Ibrahim Burgan, Akdeniz University, TürkiyeCopyright © 2023 Li, Li, Bao and Li. This is an open-access article distributed under the terms of the Creative Commons Attribution License (CC BY). The use, distribution or reproduction in other forums is permitted, provided the original author(s) and the copyright owner(s) are credited and that the original publication in this journal is cited, in accordance with accepted academic practice. No use, distribution or reproduction is permitted which does not comply with these terms.
*Correspondence: Chaochao Li, bGljaGFvY2hhb0BueHUuZWR1LmNu
Disclaimer: All claims expressed in this article are solely those of the authors and do not necessarily represent those of their affiliated organizations, or those of the publisher, the editors and the reviewers. Any product that may be evaluated in this article or claim that may be made by its manufacturer is not guaranteed or endorsed by the publisher.
Research integrity at Frontiers
Learn more about the work of our research integrity team to safeguard the quality of each article we publish.