 Li Zhang
 Qian Xu3*
 Biyun Guo
- 1State Key Laboratory of Plateau Ecology and Agriculture, Qinghai University, Xining, China
- 2School of Water Resources and Hydropower Engineering, North China Electric Power University, Beijing, China
- 3Space Intelligence and Informatics Research Center, Research Institute of Tsinghua University in Shenzhen, Shenzhen, China
- 4State Key Laboratory of Hydroscience and Engineering, Tsinghua University, Beijing, China
- 5College of Transportation and Environment, Shenzhen Institute of Information Technology, Shenzhen, China
- 6State Key Laboratory of Simulation and Regulation of Water Cycle in River Basin, China Institute of Water Resources and Hydropower Research, Beijing, China
- 7Marine Science and Technology College, Zhejiang Ocean University, Zhoushan, China
To improve understanding of rainfall-runoff processes and the fundamental hydrological mechanisms, rainfall and runoff data during six hydrological years (2007/06–2012/06) were collected in a small headwater catchment at the Kadoorie Agricultural Research Centre (KARC) in Shek Kong, Yuen Long District, New Territories, Hong Kong. Totally, 28 storms were selected; using the one parameter filter method, the direct and baseflow hydrographs were obtained. Their runoff coefficients (which are the ratios of direct runoff volumes to the total rainfall volumes) were computed and the values were very low (mean value is less than 2%). At the event scale, the results revealed that the runoff coefficient which represents the catchment response was highly correlated with rainfall depth, maximum 15-min rainfall intensity and initial discharge. Linear relationships were found and two variables (rainfall depth and initial discharge) gave a better result to predict runoff coefficient indicating that hydrological response depended both on rainfall depth and initial discharge. The principal component analysis and cluster method were used to discriminate types of hydrological responses. Three types of characteristics of hydrological behavior were identified. The different types of hydrological responses show similar characteristics such as the quick rise and the prolonged recession. This study highlights the importance of interflow in the rainfall-runoff process and provides insight into the relationship between rainfall and runoff. The findings have significant implications for water resources management and will help inform decision-making processes.
1 Introduction
One of the goals of catchment hydrology is quantifying the basin responses to rainstorms in terms of timing and volume of flood production (Penna et al., 2011). The relationship between rainfall and runoff plays a key role in the planning, design, operation and maintenance of water sources in a catchment (Sen, 2008). Furthermore, extreme events, such as floods and droughts, are becoming more frequent and more intense worldwide suffering from the effects of climate change (Rubinato et al., 2020; Pu et al., 2022). And understanding the runoff generation processes is important for the prediction of floods. Some studies indicated that runoff generation processes depend on the antecedent catchment conditions and rainfall volume (Latron and Gallart, 2008; Palleiro et al., 2014). Many studies revealed that the rainfall and runoff response is a nonlinear process (Latron and Gallart, 2008; Penna et al., 2011). Different antecedent catchment conditions (soil moisture, antecedent rainfall, and initial discharge or ground water level) are the primary reason cause of the nonlinear response.
Runoff coefficient is an important parameter describing basin response and is used widely. Event-based runoff coefficients are determined using the ratio of direct runoff over total rainfall (McNamara et al., 1998; Sidle et al., 2000; Bowden et al., 2001; Schellekens et al., 2004). Runoff coefficients are useful for comparison with other catchments which help us to understand how different rainfall runoff response processes are.
The direct flow is primarily the direct response of a rainfall event and includes the overland flow and the lateral flow in the soil profile also known as interflow. The baseflow is a component of the stream flow that is discharged from the natural storage of aquifers. Direct runoff and Baseflow measurement respective are not easy and special equipment is needed and usually the cost is very high (Gonzales et al., 2009). Therefore, baseflow separation techniques are considerable utilities because of the easy access and potential contribution to the understanding of flow components, mathematical rainfall runoff models and water resources planning and management (Hall, 1968; Tallaksen, 1995). To obtain the volume of surface runoff, the use of an appropriate baseflow separation method is essential. Baseflow separations have been widely studied and applied in many catchments (Hall, 1968; Tallaksen, 1995; Gonzales et al., 2009). A reliable hydrograph separation method is essential for separating baseflow from total runoff to yield direct runoff (Chow et al., 1988). Separating hydrographs to classify and quantify direct runoff and baseflow and setting the beginning and end of storm rainfall is very difficult (Hewlett et al., 1977). Generally, there are two types of hydrograph separation method: graphical and filter separation methods (Smakhtin, 2001). The sensitivity analysis shows that the required baseflow separation coefficient could be estimated using 3 to 5 rainfall streamflow events from the study catchment (Tularam and Ilahee, 2007; Tularam and Ilahee, 2008). Estimation of direct runoff volume and peak runoff rates for small rural catchments poses a problem in view of the limited gauged data available. This requires some base data for model calibration and validation. The variability of runoff generation processes within a mountain catchment and the variability from event to event is an intriguing aspect (Kirnbauer et al., 2005). One means of addressing the complexity and variety of processes is to isolate dominant processes. In most flood estimations, the simplified lumped conceptual loss models are generally used because of their simplicity and ability to approximate catchment runoff behavior (Hill et al., 1996).
In Hong Kong, only a few studies have been conducted to understand the hydrological response. While numerous flash floods are reported almost every year; for example, a flash flood occurred on 14 April 2000 due to rainfall with a depth of 500 mm, and some villages were submerged by about 1 m deep water (Report for 33rd Session, 2000). Therefore, flash floods are still one of the particularly complicated serious natural disasters, and an important threat to human lives and societal properties in Hong Kong. While the impacts of flash floods in Hong Kong are huge, understanding of the features of a local flash flood is still lacking. One reason for this is the lack of available fine temporal resolution of rainfall records and streamflow observations. The importance and limitations of understanding flash flood features in Hong Kong and worldwide, in general, motivate the present study.
The study of a small experimental catchment where rainfall and runoff data were collected is useful for better understanding the fundamental hydrological mechanisms occurring at the headwater scale. The main purpose of this study is to: 1) investigate rainfall and runoff relationships, 2) discriminate types of hydrological responses and identify the rainfall variables that explain best the differences in the types of hydrological responses.
2 Study area
The study headwater catchment is located in the Kadoorie Agricultural Research Centre (KARC) at Shek Kong of Yuen Long District, New Territories, Hong Kong (22°25′N, 114°07′E) shown in Figure 1A (Li, 2009; Xu, 2013a; Xu, 2013b). The study area covers a total area of 82,737 m2 with an altitude ranging from 209 m to 550 m (mean elevation = 362 m) shown in Figure 1B. Slopes vary between 0° and 71.6°, with a mean value of 35.1°. The average main channel slope is around 30°. The length of the main channel is around 550 m. The region is characterized by a sub-tropical climate with tending towards for nearly half the year. The reports indicated from the observation of HKO (Hong Kong Observatory) that the rainy season in Hong Kong is from April to September, received about 76.55% of the annual rainfall and the yearly average precipitation value from 1971 to 2000 is about 2,400 mm. The reference evapotranspiration rate varies from about 67.6 mm/month in February to 155.5 mm/month in July. The whole catchment is covered by vegetation and the vegetation is broadleaf woodland and shrubland. The soil in this basin is sandy silt and clayey sand with medium permeability.
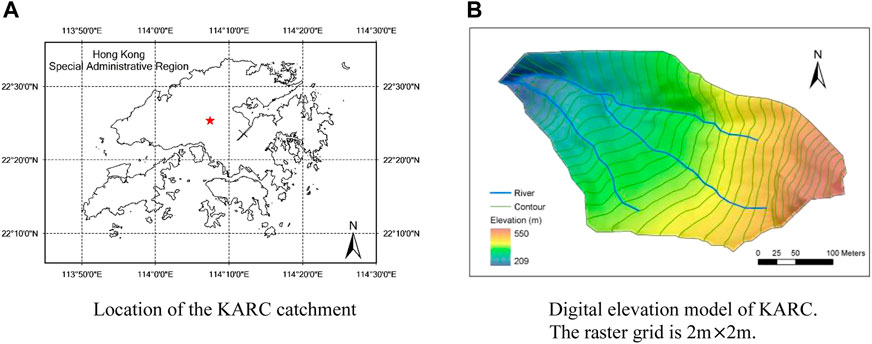
FIGURE 1. Study area and its DEM. (A) Location of the KARC catchment (B) Digital elevation model of KARC.
3 Data and methods
3.1 Rainfall-runoff data
Instrumentation was installed in the year of 2007 to record rainfall and runoff data. Rainfall was measured by tipping bucket rain gauge which was connected to a data logger (Casella CEL) with a 0.5 mm/tip and a temporal resolution of 1-min, and the water level was generally recorded by an electronic Stevens data logger which was installed at the 50° V-notch weir in the catchment (Figure 2). The time interval of the water level also was 1 minute. A stage-discharge relationship has been obtained by the principles of hydraulics. Stage-discharge relation was developed from a set of volumetric gauging measurements of the discharge and water levels. The following equation was used in this study (Fok, 2002)
where Qt is the discharge at time t with the unit of L/s, and Ht represents the water level at time t recorded at the 50° V-notch weir in the unit of cm.
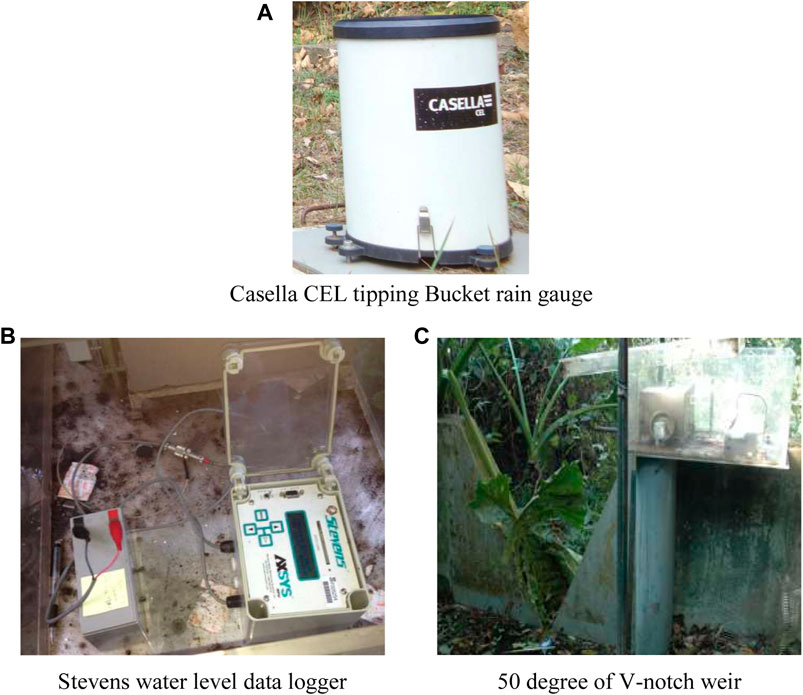
FIGURE 2. Rain gauge and water level recorder at the weir. (A) Casella CEL tipping Bucket rain gauge (B) Stevens water level data logger (C) 50 degree of V-notch weir.
28 runoff-generating events from 2007–2012 were selected based on minutely rainfall and water level data. Rainfall events were defined as a period for which the cumulative rainfall was at least 1 mm and which were separated by at least 6 h without rainfall. Runoff events were identified as the ratio of direct runoff to baseflow at the peak time needing to be larger than 0.5 (Norbiato et al., 2009). Further, runoff events with successive flow peaks were not considered. For each event, several variables were selected and grouped as explanatory variables and response variables from the hyetograph and hydrograph (Table 1). Depth of rainfall event (P, mm), duration of rainfall event (Tr, minute), mean rainfall intensity (Iavg, mm/min), maximum rainfall intensity (Imax, mm/15 min), antecedent rainfall index (API, mm) (Gregory and Walling, 1973), initial discharge (Q0, m3/min), time to peak discharge (Tq, minute), duration of direct runoff (Te, minute), peak discharge (Qp, m3/min), discharge increase (∆Q = Qp−Q0, m3/min), direct runoff (Qd, mm), runoff coefficient (C, %).
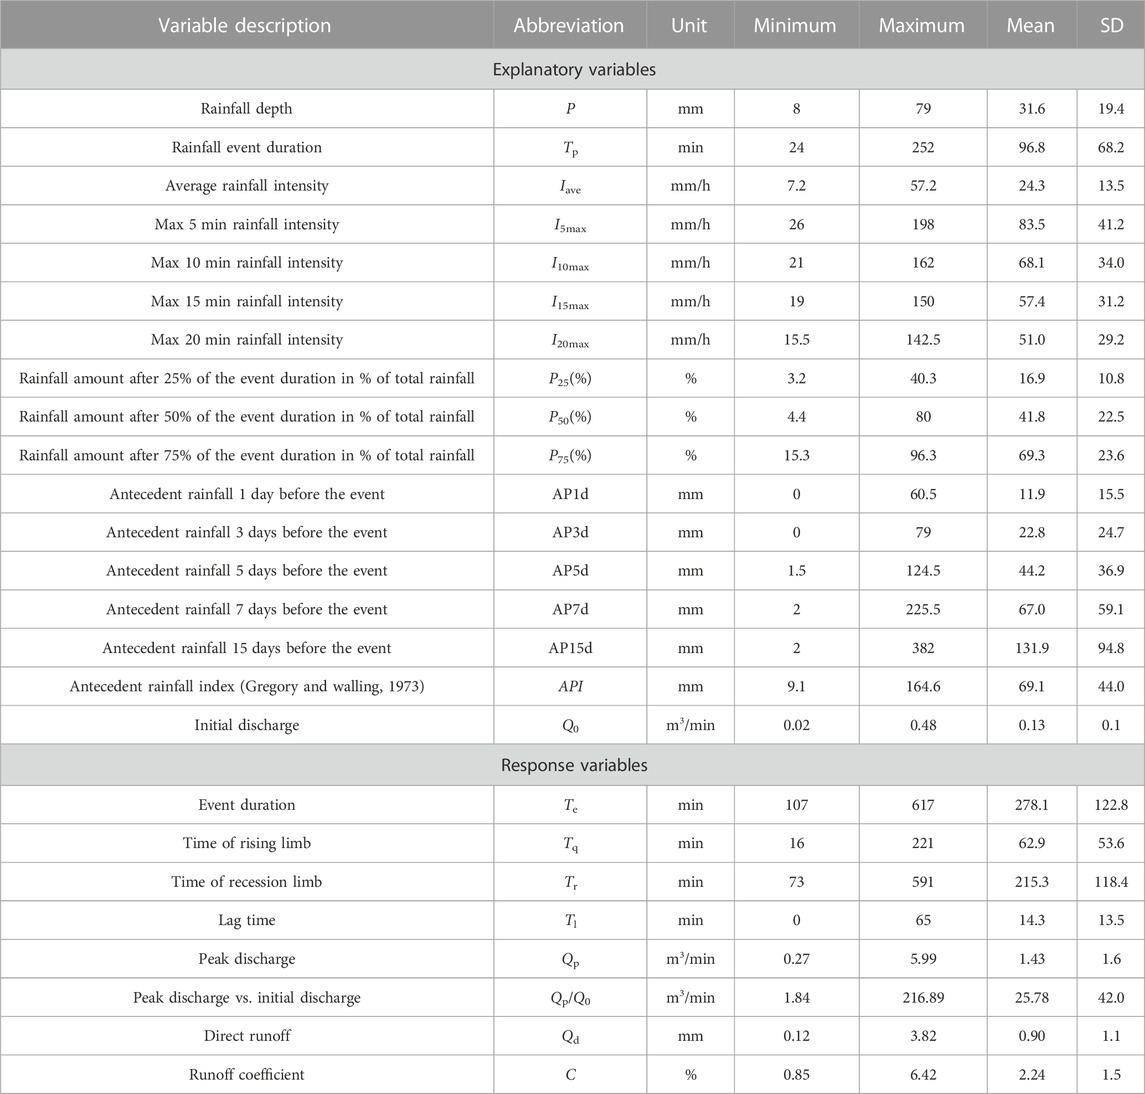
TABLE 1. Characteristics of the 28 rainfall-runoff events at KARC catchment.
3.2 Baseflow separation and runoff coefficient
In order to determine the contribution from direct runoff in a watershed to the streams in the watershed, it is necessary to separate the baseflow from total runoff data. A variety of techniques have been suggested for separating baseflow and direct runoff. The one parameter filter method: Nathan and Mcmahon (1990) developed a digital filter algorithm to separate direct runoff and baseflow from total runoff. The digital filter is based on the principle used in signal processing by regarding baseflow and direct runoff as low and high frequency signals, respectively. The digital filter can be expressed mathematically as follows
where Qd,t and Qt are the direct runoff and total stream flow, respectively, at a time interval t, and the parameter k is the recession constant during periods of no direct runoff with values between 0 and 1.
Stream flow recession can be described by various recession equations and the most used equation for baseflow is
where Qt is the discharge at time t, Q0 is the initial discharge and k is the recession constant for the selected time units. Plotting discharge ratio values (Q0/Q) on the semi-logarithmic plot (Hino and Hasebe, 1984), the slope of the recession curve was used to get the constant k. k values were estimated for a set of recession curves and were averaged to yield a representative value of k for the study site.
Event-based runoff coefficients were determined using the ratio of direct runoff volume over total rainfall (McNamara et al., 1998; Sidle et al., 2000; Bowden et al., 2001; Schellekens et al., 2004) and the equation is
where C is the runoff coefficient, Qd is the direct runoff (mm), and P is the rainfall depth (mm).
3.3 Statistical methods
Person correlation was applied to analyze the relationship between rainfall and runoff variables. Then linear regression method was used to develop the empirical equation of runoff coefficient. The runoff coefficients are constrained to the range from 0 to 1, while the range of logit transformation of runoff coefficient values is [−∞, ∞]. The logit transformation is described by the following equation:
According to the significance of predictor variables and the model’s goodness of fit described by R2, a stepwise linear regression method was used and the best model was chosen.
Principal component analysis (PCA) was applied to search for combinations of runoff variables. PCA involves a mathematical procedure that transforms a number of (possibly) correlated variables into a (smaller) number of uncorrelated variables called principal components. The first principal component accounts for as much of the variability in the data as possible, and each succeeding component accounts for as much of the remaining variability as possible (Legendre and Legendre, 1998). PCA is particularly suitable for discriminating several types of hydrologic responses which involves searching for combinations of response variables (Ali et al., 2010).
A hierarchical cluster algorithm was used to discriminate the types of events taking into account the results of PCA.
Person correlation, PCA and hierarchical cluster algorithm were undertaken with SPSS, a statistical software package.
4 Results
4.1 Rainfall-runoff relationship
The k values were found to be 0.998 for a 1-min time interval. This k value was used in the one parameter filter method to separate the baseflow. The main characteristics of rainfall and runoff of 28 events were listed in Table 1. The mean rainfall depth for 28 events was 31.6 mm, ranging from 8 to 79 mm. The average rainfall intensity varied between 0.12 and 0.95 mm/min and a maximum of 15 min rainfall intensity ranged from 4.8 to 37.5 mm/15 min. According to the Hong Kong Observatory (2009), there are three levels of heavy storm warnings, Amber (>30 mm/h), Red (>50 mm/h) and Black (>70 mm/h). In all 28 events, 9 events are amber storms, 1 out of 28 rainfall events are red storms, and there are no black storms. The antecedent precipitation index was strongly variable, ranging between 9.1 and 164.6 mm. Initial discharge varied between 0.02 and 0.48 m3/min and peak discharge ranged from 0.27 to 5.99 m3/min. Direct runoff ranged from 0.12 to 3.82 mm (mean = 0.9 mm), while average runoff coefficients were low, less than 3%. Similar with low runoff coefficient values were found by Palleiro et al. (2014) who analyzed the hydrological response in a humid agroforestry catchment at different time scales. Rainfall duration ranged from 24 to 662 min with a mean value of 108 min. Time from the initial discharge to peak discharge ranged between 16 and 221 min, while runoff recession duration ranged between 73 and 591 min, with recession limb usually of longer duration than rising limb. Analysis of the hydrographs of the 28 rainfall-runoff events also showed that the stream runoff responds rapidly to rainfall.
The relationship between rainfall and direct runoff was shown in Figure 3. From Figure 3, rainfall depth and direct runoff were found to be strongly correlated at the event scale (R2 = 0.85), despite a little of degree scattering. It also can be seen from this figure that for small rainfall events (p < 25 mm), runoff response was limited and runoff was less than 0.5 mm. The threshold of 25 mm is not clearly defined, as shown by the relatively high degree of scattering for events with between 25 and 40 mm of rainfall. Latron and Gallart (2008) also found two different types of relationships like our study and the threshold was 20 mm. Nadal-Romero and Regues (2010) in his study for a small catchment with badland areas in the central Spanish Pyrenees described a similar result and the threshold was 10 mm.
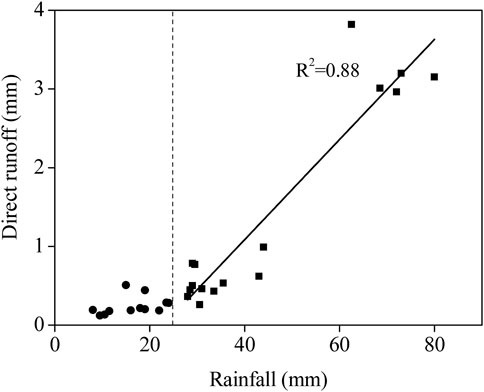
FIGURE 3. Relationship between rainfall depth and direct runoff. A linear regression between rainfall and direct runoff is list.
To analyze in detail the influence of the different variables on the magnitude of the hydrological response, person correlation relationships between rainfall and runoff variables derived from 28 events were performed. As Table 2 showed, the response variables, Qp, ∆Q, Qd and C, were well correlated with total rainfall depth, maximum 15 min rainfall intensity and also correlated with average rainfall intensity. However, the runoff coefficient was also correlated with initial discharge. No significant correlation was observed between runoff coefficient or peak discharge and duration of rainfall event and API indicating that they do not affect the hydrological response.
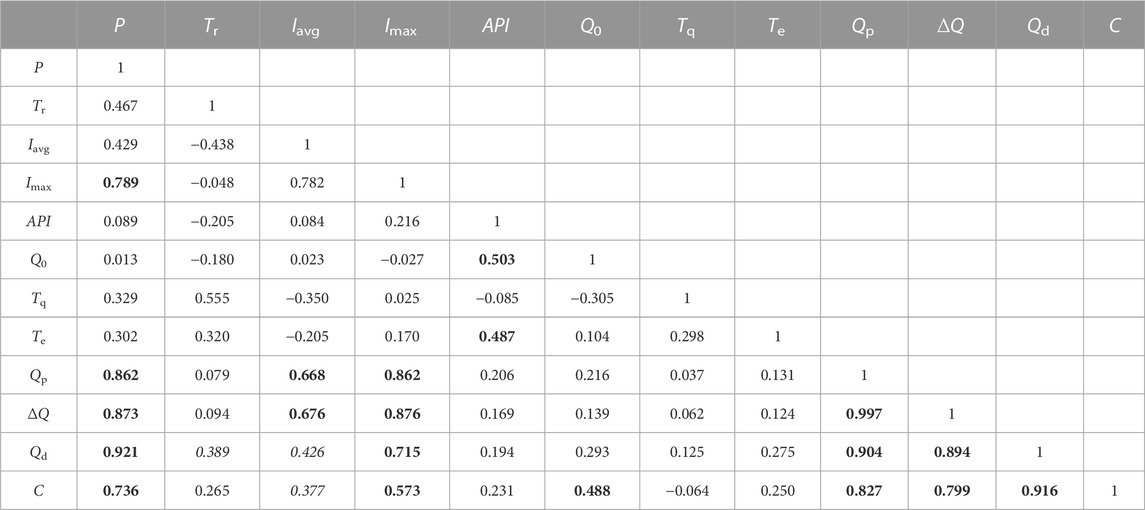
TABLE 2. Person correlation matrix between the selected variables. Coefficients in bold are significant at the 0.01 level and coefficients in italics at the 0.05 level.
Runoff coefficient is an important parameter describing basin response and is used widely to analyze the hydrological response to a single rainfall event. For the study period, the runoff coefficient varied between 0.85% and 6.11%, with a mean value of 1.34%. The relationships between runoff coefficient and rainfall, duration of rainfall, maximum 15 min rainfall intensity, initial discharge and API were presented in Figure 4. From Figure 4, a linear fit of runoff coefficient on rainfall depth was statistically significant and explained 55% of the variance. The runoff coefficients increase with increasing rainfall depths. Nevertheless, some scatter in the runoff coefficient values indicated that the relationship between rainfall and runoff coefficient values was not straightforward. For example, similar rainfall depth around 30 mm led to runoff coefficients that range from 0.85% to 2.61%. On the other hand, similar runoff coefficients values around 1.3% related to rainfall depths varied from 9.5 mm to 33.5 mm. This result showed some not-linearity in the rainfall-runoff relationship in the KARC catchment and showed the influence of some other factors on hydrological response. In the same way, the runoff coefficient increase with a maximum of 15 min rainfall intensity, In view of these results, we used a linear regression model to estimate the relationship between the runoff coefficient and the different predictor variables describing rainfall characteristics and antecedent conditions. The input data originate from all events. The following equation with P (total precipitation in mm), Q0 (initial discharge in m3/min) and Imax (maximum 15 min rainfall intensity) shows the result, where R2 = 0.68. This is obviously higher than that obtained by a simple relationship (P-C: R2 = 0.55).
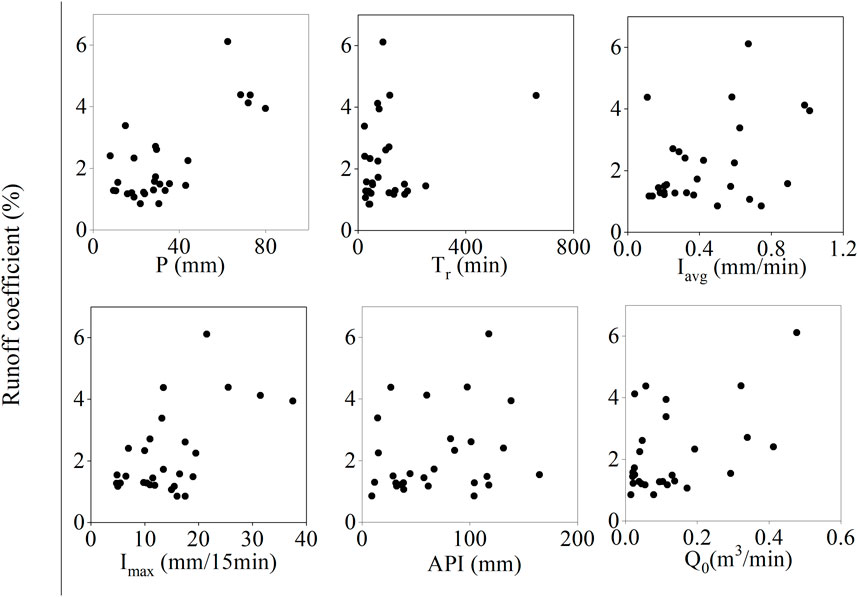
FIGURE 4. Relationships between runoff coefficient and rainfall depth, duration of rainfall, rainfall intensity, maximum 15 min rainfall intensity, API and initial discharge.
4.2 Hydrological response types
Runoff variables are not completely independent, but there are some relationships, so the PCA algorithm was first used to study the rainfall and runoff variables (P, Tr, Iavg, Imax, API, Q0, Tq, Te, Qp, ∆Q, Qd and C) listed in Table 1. The PCA of hydrograph features of the total events revealed that 82.4% of the variance was captured by the first three PC axes. PC axis 1 is associated with rainfall depth, peak discharge, discharge increase, direct runoff, the runoff coefficient and maximum 15 min rainfall intensity (loading of more than 0.8), while PC axis 2 is contributed by the duration of rainfall and time to peak discharge (loading of more than 0.8). PC axis 3 is associated with soil initial conditions (API and initial discharge). As illustrated in Table 3 the variables retained and positively correlated in the PC axis 1, ranked according to their importance as expressed by the eigenvector value, are peak discharge, discharge increase, direct runoff, rainfall depth, maximum 15 min rainfall intensity and runoff coefficient. PC axis 2 is positively correlated to the duration of rainfall depth and the time to peak discharge. PC axis 3 also is positively correlated to the soil initial conditions. Principal component 1 seems to reflect characteristics of rainfall and runoff magnitude. Principal component 2 is rather related to rainfall and runoff time. Principal component 3 represents the antecedent soil conditions. These three principal components basically reflect the characteristics of rainfall and runoff. Response types in the KARC catchment are highly variable along the PC axis 1 rather than along the PC axis 2 or PC axis 3.
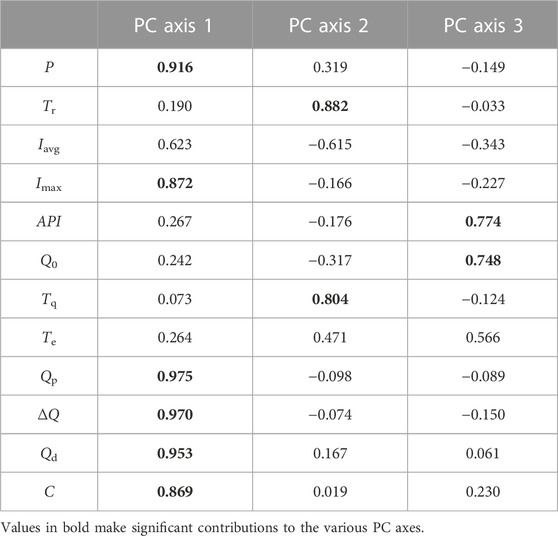
TABLE 3. Loading of each runoff variable on 3 principal components.
Table 4 showed the scores of each event on three principal components (F1, F2 and F3). F1, F2 and F3 can be used to replace the original twelve rainfall and runoff variables as new variables. Based on the results of Table 4 and using new variables (F1, F2 and F3), the hierarchical cluster method was used to discriminate types of hydrological responses. Figure 5 depicted the result of clustering for 28 events. This figure revealed that the hydrological events can be grouped into three clusters. Hydrological events characteristics of three types were shown in Table 5.
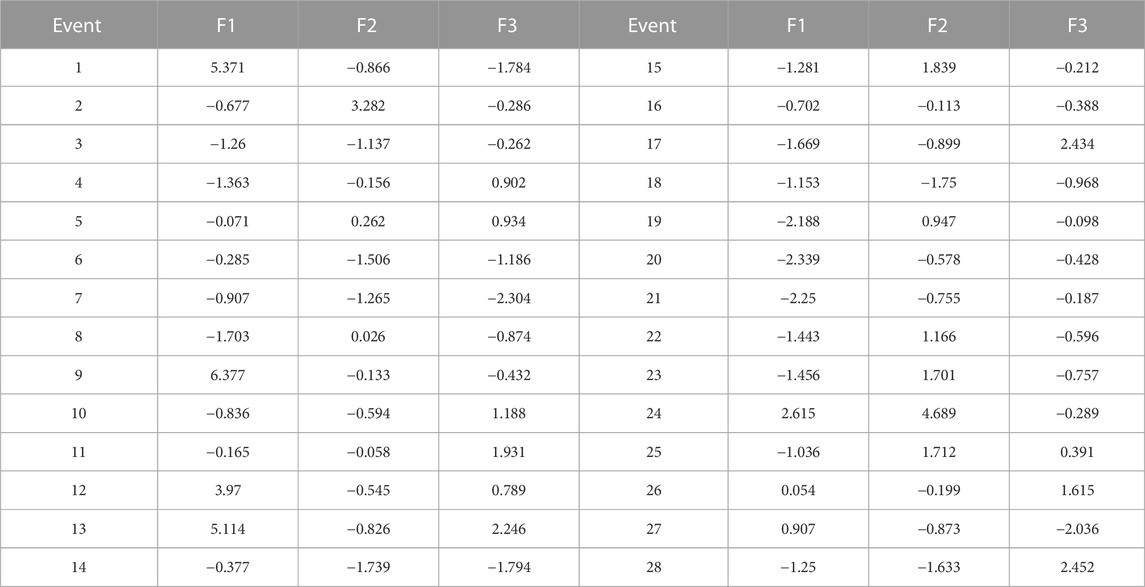
TABLE 4. Score of each event on three principal components.
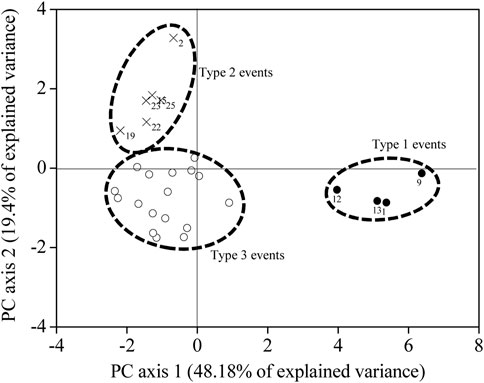
FIGURE 5. PCA distance biplot and hydrological events cluster. Numbers from 1 to 28 represent names of events.
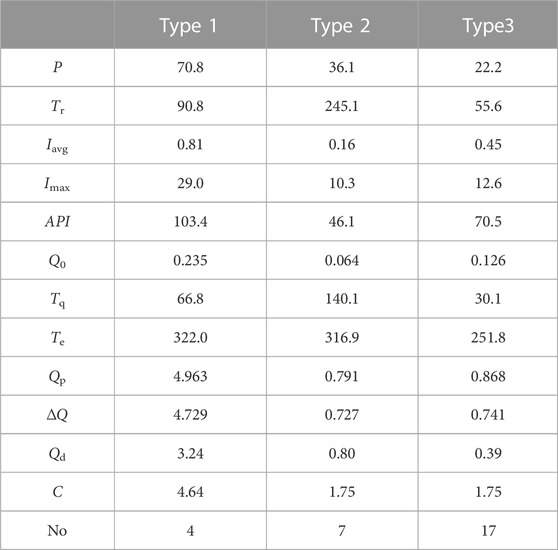
TABLE 5. Characteristics of different rainfall-runoff event types found in the KARC.
Events of type 1 were generated by the largest rainfall amounts and with the wettest antecedent conditions (API mean = 103.4 mm and mean initial discharge = 0.235 m3/min), which resulted in a higher peak discharge, direct runoff and runoff coefficient. Figure 6A showed an example of this type. This event occurred on 3 June 2009, with a rainfall depth of 80 mm, maximum rainfall intensity of 37.5 mm/15 min and relatively wet antecedent conditions (API = 138.3 mm and Q0 = 0.113 m3/min). Runoff coefficient and peak discharge also were relatively high.
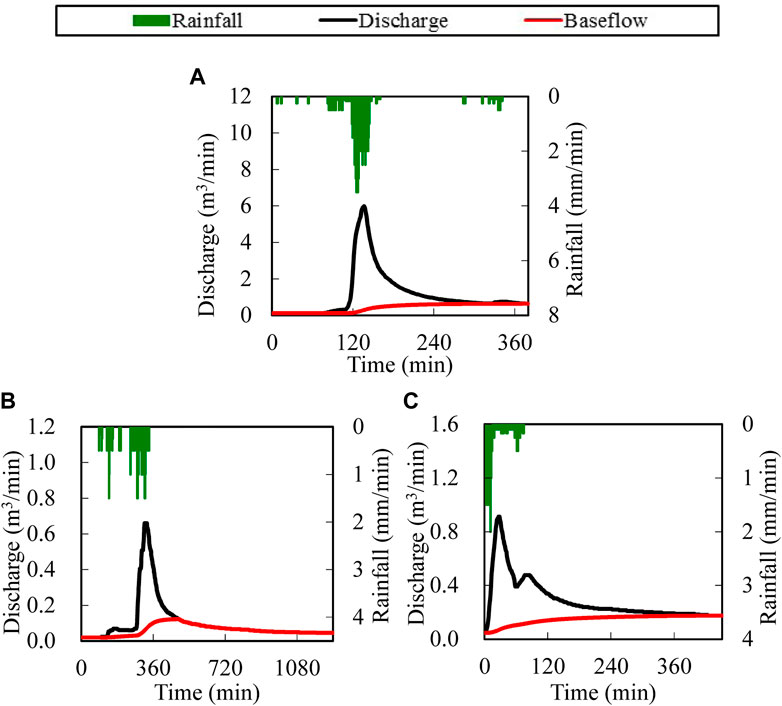
FIGURE 6. Typical hydrology and hyetograph for three selected events (A–C) associated with each type.
Events covered by type 2 were generated by smaller rainfall and with the driest antecedent conditions (API mean = 46.1 mm and mean initial discharge = 0.064 m3/min) which resulted in the lowest peak discharge (mean 0.791 m3/min). One significant feature of this type of event is more longer duration of rainfall or smaller average rainfall intensity than the other two types of events. Figure 6B showed an example of this type. The event of 24 May 2008 was characterized by low rainfall depth (43 mm), long duration (252 min), low average rainfall intensity (0.14 mm/min) and dry antecedent conditions (API = 57.6 mm; initial discharge = 0.02 m3/min).
Events of type 3 were generated by the smallest rainfall amounts and with wetter antecedent conditions (API mean = 70.5 mm and mean initial discharge = 0.126 m3/min), which resulted in almost the same peak increase and runoff coefficient as type 2, but lower direct runoff. Type 2 and type 3 of events showed the non-linear effect of rainfall depth on runoff coefficient and the importance of antecedent conditions of the catchment on the hydrological response: the different rainfall depths can produce the same runoff coefficient when initial conditions are different. Analyzing the reason for the smallest peak discharge of type 2, the long rainfall duration for this type which provided more time for catchment storage and weakened the peak discharge gave a better explanation. Figure 6C showed a characteristic hydrograph of type 3; an example is an event occurring on 3 June 2008, with rainfall depth of 29.5 mm after a relatively dry period (API = 101.2 mm; initial discharge = 0.047 m3/min); but the runoff coefficient and peak discharge were higher than the example event of type 2.
4.3 Time of concentration and lag time
Time of concentration (Tc) and lag time (TL) are the most frequently used time parameters, which are usually estimated by empirically and hydraulically-based methods. Time parameters can help us to better understand the dominant processes and provides an implication on how rapidly rainfall is converted to runoff at the KARC catchment. Time of concentration (Tc) is the travel time of overland flow from the most remote point to the outlet of catchment and it is a function of the topography, geology and land use of a catchment. In Hong Kong, the Bransby-Williams equation is commonly used to estimate the time of concentration of a catchment. The Bransby-Williams equation is given as follows:
where L is the length of the flow path (m), H is the average slope of the channel (m/100 m), A is the catchment area (m2), Tc is the time of concentration (min). Using this equation, the time of concentration of the study catchment is around 13 min. Therefore, the temporal resolution used should be shorter than 13 min (Latron and Gallart, 2008) Analysis of the hydrographs of the 28 rainfall-runoff events showed that the stream runoff responded rapidly to rainfall. Lag time of those 28 events, defined as the time from the center of the rainfall event to the peak discharge, ranged from 0 to 65 min; the lag time for 15 of the 28 events is between 7 and 15 min. To view the runoff response to rainfall, Figure 7 showed the relationship between the response time and its corresponding runoff coefficient. The analysis of Figure 7 revealed that there is no clear relationship between response time and the corresponding runoff coefficient, indicating that these two variables are not strongly correlated. The scatter plot in Figure 7 showed a wide distribution of data points. There is no apparent clustering or alignment of points that would suggest a systematic relationship between the two variables. This lack of correlation suggested that factors other than response time contribute to the variability in the runoff coefficient.
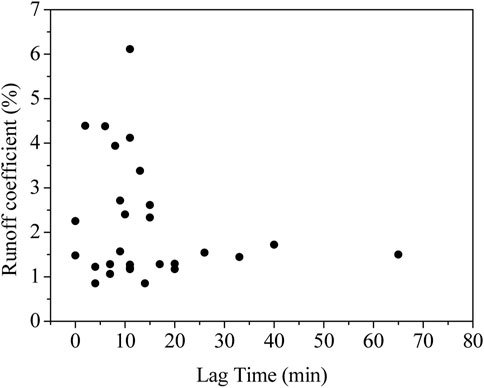
FIGURE 7. Relationship between the runoff coefficient and the lag time for three types events.
5 Discussion
Using limited data on water level and rainfall data, this study highlights some general characteristics of the hydrological response of a small hillslope catchment, through the analysis of event scale relationships. Water level observations at the KARC field site revealed a fast peak discharge reaction to rainfall events. Rainfall runoff data from the KARC catchment revealed the clear nonlinearity of the hydrological response. The two types of behavior illustrated by Figure 3 (with a low runoff response for rainfall events of less than 25 mm and an increased response for larger events) indicate the existence of a threshold in the rainfall–runoff relationship. These results are similar to those reported by (Latron and Gallart, 2008; Nadal-Romero and Regues, 2010). Latron and Gallart (2008) found two different types of relationships like our study and the threshold was 20 mm. Nadal-Romero and Regues (2010) in his study for a small catchment with badland areas in the central Spanish Pyrenees described a similar result and the threshold was 10 mm.
The hydrograph separation is very useful for flood prediction. Unfortunately, the measurements of baseflow are usually not available for most catchments. Therefore, it is difficult to get the volume of the baseflow. To evaluate the baseflow, a reliable baseflow separation method is important. In this study, three different separation methods were applied. Two graphical methods are simple and more suitable for a single peak hydrograph. So in the following study, we used the filter method to separate hydrographs. One important parameter of this method is the recession constant. Plotting the individual recession on the semi-logarithmic scale usually does not give a straight line but a curved line. This phenomenon occurs owing to the fact that the recession comes from different flow components, namely, surface flow, inter flow and baseflow with different lag characteristics (Sujono et al., 2004). The recession constant k for all 28 rainfall runoff events studied in the KARC catchment is not constant. k values were estimated for a set of recession curves and were averaged to yield a representative value k for the study site. In practice, however, it is difficult to select the point of direct runoff end.
Our study of runoff coefficients at the event scale revealed that no single variable can explain the response of KARC. Although the rainfall depth is strongly correlated with the runoff coefficient, maximum of 15 min rainfall intensity can influence the response of runoff. The initial soil conditions (initial discharge or soil moisture) also showed a correlation with the runoff coefficient, but this correlation is less than the rainfall depth. The absence of a strong relationship between rainfall depth and the runoff coefficient has also been reported for many catchments (Latron and Gallart, 2008; Nadal-Romero and Regues, 2010; Palleiro et al., 2014). Initial discharge which is indicative of the wetness of the catchment shows a weak correlation with the runoff coefficient in the KARC catchment (Table 2). Meanwhile, a useful empirical relationship was developed for the study site to estimate the runoff coefficient.
In contrast to the results obtained for runoff coefficients, peak discharge was significantly correlated to rainfall depth, maximum 15 min rainfall intensity and average rainfall intensity (Table 2). Within the KARC catchment, a maximum of 15 min rainfall intensity plays a key role and was critical in controlling the intensity of response, also had a strong influence on the volume of the hydrological response. The combination of the PCA algorithm and cluster technique used in this paper confirms that hydrological response types can be discriminated against on the variables of rainfall and runoff features. These features explain the variation among the study catchment multiple runoff response to rainfall inputs. Palleiro et al. (2014) in their study, all events also were classification into three types using cluster analysis. In our study, PCA first was used to transforms all rainfall and runoff correlated variables into a smaller number of uncorrelated variables. Then the scores of each event on three principal components were calculated. Finally, based on this result Hierarchical cluster algorithm was used to discriminate the types of events. The aim is to remove needless variables and make the calculation more simplified. Our results suggest total event volume, duration of the rainfall and initial discharge are the most important variables to discriminate the response types. From these results, it showed that initial conditions are not found to closely drive runoff response while runoff volumes are controlled by event rainfall.
6 Conclusion
By using limited data on water level and rainfall data, this study reveals some characteristics of the rainfall-runoff of the KARC headwater catchment. In the KARC catchment, more detailed results were obtained through the analysis of 28 events.
Catchment response to rainfall is very fast, typically the runoff increases within 10 min from the beginning of rainfall and maximum discharge occurs within 60 min from rainfall onset.
Using event scale information and person method, initial discharge, maximum 15 min rainfall intensity and total rainfall depth were main factors affecting runoff coefficients. The result of linear regression showed that predicting the runoff coefficient was better when only considering the total rainfall and initial discharge.
Three types of events were found in the study catchment concerning the three principal components (rainfall and runoff magnitude, time and antecedent conditions). Type 1 only comprised 14% of the events, all of them of the largest peak discharge, which were formed with the largest rainfall (mean = 70.8 mm) and the wettest antecedent conditions (mean API = 103.4 mm, mean Q0 = 0.235 m3/min). Type 2 (25% of the events) corresponded to events of higher magnitude than events of type 3 and the driest antecedent conditions (mean API = 46.1 mm, mean Q0 = 0.064 m3/min). Finally, 61% of the events were included in type 3, which was characterized by moderate antecedent conditions (mean API = 70.5 mm, mean Q0 = 0.126 m3/min) and the smallest rainfall depth (mean = 22.2 mm).
From the observation of the hydrographs, it can be noted that, in general, they were characterized by a quick rise and a prolonged recession, which could indicate an important contribution of interflow.
Data availability statement
The original contributions presented in the study are included in the article/supplementary material, further inquiries can be directed to the corresponding author.
Author contributions
QX, the corresponding author, and LZ organized the manuscript. KW and ZL did the derivations and provided the data. XL, BG, and GC collected the data and plot figures. QX and LZ processed the data and revised the manuscript. All authors contributed to the article and approved the submitted version.
Funding
This research was funded by the Open Project of State Key Laboratory of Plateau Ecology and Agriculture (2021-KF-10, 2023-KF-02), National Natural Science Foundation of China (52109092), the Fundamental Research Funds for the Central Universities (2023MS070), the Open Research Fund Program of State Key Laboratory of Hydroscience and Engineering (sklhse-2022-A-02; sklhse-2021-A-02), the Science and Technology Project of Shenzhen Institute of Information Technology (SZIIT2022KJ011), Basic Research Project of Qinghai Province (2022-ZJ-933Q).
Conflict of interest
The authors declare that the research was conducted in the absence of any commercial or financial relationships that could be construed as a potential conflict of interest.
Publisher’s note
All claims expressed in this article are solely those of the authors and do not necessarily represent those of their affiliated organizations, or those of the publisher, the editors and the reviewers. Any product that may be evaluated in this article, or claim that may be made by its manufacturer, is not guaranteed or endorsed by the publisher.
References
Ali, G. A., Roy, A. G., Turmel, M. C., and Courchesne, F. (2010). Multivariate analysis as a tool to infer hydrologic response types and controlling variables in a humid temperate catchment. Hydrol. Process. 24, 2912–2923. doi:10.1002/hyp.7705
Bowden, W. B., Fahey, B. D., Ekanayake, J., and Murray, D. L. (2001). Hillslope and wetland hydrodynamics in a tussock grassland, South Island, New Zealand. Hydrol. Process. 15, 1707–1730. doi:10.1002/hyp.235
Chow, V. T., Maidment, D. R., and Mays, L. W. (1988). Applied hydrology. New York, NY, USA: McGraw-Hill.
Fok, L. (2002). Sediment and solute loads in a small Hong Kong stream. Hong Kong, China: MPhil. Thesis. The University of Hong Kong.
Gonzales, A. L., Nonner, J., Heijkers, J., and Uhlenbrook, S. (2009). Comparison of different base flow separation methods in a lowland catchment. Hydrology Earth Syst. Sci. 13, 2055–2068. doi:10.5194/hess-13-2055-2009
Gregory, K. J., and Walling, D. E. (1973). Drainage basin form and processes: A geomorphological approach. London, UK: Edwards Arnold.
Hall, F. R. (1968). Base-flow recessions-a review. Water Resour. Res. 4, 973–983. doi:10.1029/WR004i005p00973
Hewlett, J. D., Fortson, J. C., and Cunningham, G. B. (1977). The effect of rainfall intensity on storm flow and peak discharge from forest land. Water Resour. Res. 13, 259–266. doi:10.1029/WR013i002p00259
Hill, P. I., Maheepala, U., Mein, R. G., and Weinmann, P. E. (1996). Empirical analysis of data to derive losses for design flood estimation in South-Eastern Australia. Report 96 (5).
Hino, M., and Hasebe, M. (1984). Identification and prediction of nonlinear hydrologic systems by the filter-separation autoregressive (AR) method: Extension to hourly hydrologic data. J. Hydrology 68, 181–210. doi:10.1016/0022-1694(84)90211-7
Kirnbauer, R., Blöschl, G., Haas, P., Müller, G., and Merz, B. (2005). “Identifying space-time patterns of runoff generation: A case study from the löhnersbach catchment, Austrian alps,” in Global change and mountain regions- A state of knowledge overview. Editors HuberUM, and ReasonerMA (Berlin, Germany: Springer).
Kong, Hong (2009). Tropical cyclone warnings. http://www.hko.gov.hk/informtc/tcWarning.htm.
Latron, J., and Gallart, F. (2008). Runoff generation processes in a small Mediterranean research catchment (Vallcebre, Eastern Pyrenees). J. Hydrology 358, 206–220. doi:10.1016/j.jhydrol.2008.06.014
Legendre, P., and Legendre, L. (1998). Numerical Ecology. 2nd. Amsterdam, Netherlands: Elsevier Science BV.
Li, Y. Q. (2009). “Monitoring, analyzing and modeling hydrological processes over a headwater catchment in Hong Kong,”. MPhil Thesis (Hong Kong, China: The University of Hong Kong).
McNamara, J., Kane, D., and Hinzman, L. (1998). An analysis of streamflow hydrology in the kuparuk river basin, arctic Alaska: A nested watershed approach. J. Hydrology 206, 39–57. doi:10.1016/S0022-1694(98)00083-3
Nadal-Romero, E., Latron, J., Lana-Renault, N., Serrano-Muela, P., Marti-Bono, C., and Regues, D. (2008). Temporal variability in hydrological response within a small catchment with badland areas, central Pyrenees. Hydrological Sci. J. 53, 629–639. doi:10.1623/hysj.53.3.629
Nathan, R. J., and McMahon, T. A. (1990). Evaluation of automated techniques for base flow and recession analyses. Water Resour. Res. 26, 1465–1473. doi:10.1029/WR026i007p01465
Norbiato, D., Borga, M., Merz, R., Blöschl, G., and Carton, A. (2009). Controls on event runoff coefficients in the eastern Italian Alps. J. Hydrology 375, 312–325. doi:10.1016/j.jhydrol.2009.06.044
Palleiro, L., Rodríguez-Blanco, M. L., Taboada-Castro, M. M., and Taboada-Castro, M. T. (2013). Hydrological response of a humid agroforestry catchment at different time scales. Hydrol. Process. 28, 1677–1688. doi:10.1002/hyp.9714
Penna, D., Mantese, N., Gobbi, A., and Borga, M. (2011). Runoff response at different spatial scales: Moving from small experimental areas to mesoscale catchments. Aust. J. Agric. Res. 62, 1–4.
Pu, J. H., Pandey, M., Li, J. Y., Satyanaga, A., Kundu, S., and Hanmaiahgari, P. R. (2022). Editorial: The urban fluvial and hydro-environment system. Front. Environ. Sci. 10, 1075282. doi:10.3389/fenvs.2022.1075282
Rubinato, M., Luo, M., Zheng, X., Pu, J. H., and Shao, S. (2020). Advances in modelling and prediction on the impact of human activities and extreme events on environments. Water 2020 (6), 1768. doi:10.3390/w12061768
Schellekens, J., Scatena, F., Bruijnzeel, L., van Dijk, A., Groen, M., and van Hogezand, R. (2004). Stormflow generation in a small rainforest catchment in the Luquillo Experimental Forest, Puerto Rico. Hydrol. Process. 18, 505–530. doi:10.1002/hyp.1335
Sen, Z. (2008). Instantaneous runoff coefficient variation and peak discharge estimation model. J. Hydrologic Eng. 13, 270–277. doi:10.1061/(asce)1084-0699(2008)13:4(270)
Sidle, R. C., Tsuboyama, Y., Noguchi, S., Hosoda, I., Fujied, M., and Shimizu, T. (2000). Stormflow generation in steep forested headwaters: A linked hydrogeomorphic paradigm. Hydrol. Process. 14, 369–385. doi:10.1002/(sici)1099-1085(20000228)14:3<369::aid-hyp943>3.0.co;2-p
Smakhtin, V. U. (2001). Low flow hydrology: A review. J. Hydrology 240, 147–186. doi:10.1016/S0022-1694(00)00340-1
Sujono, J., Shikasho, S., and Hiramatsu, K. (2004). A comparison of techniques for hydrograph recession analysis. Hydrol. Process. 18, 403–413. doi:10.1002/hyp.1247
Tallaksen, L. M. (1995). A review of baseflow recession analysis. J. Hydrology 165, 349–370. doi:10.1016/0022-1694(94)02540-R
Tularam, G. U., and Ilahee, M. (2007). Base flow separation using exponential smoothing and its impact on continuous loss estimates. Virginia Beach, VA, USA: International Congress on Modelling and Simulation MODSIM07.
Tularam, G. U., and Ilahee, M. (2008). Exponential smoothing method of base flow separation and its impact on continuous loss estimates. Am. J. Environ. Sci. 4, 136–144. doi:10.3844/ajessp.2008.136.144
Xu, Q., Chen, J., Sun, L. Q., and Peart, M. (2013b). Observation and analysis hydrological processes in a headwater catchment in Hong Kong. Chengdu, China: The 35th IAHR World Congress.
Keywords: rainfall-runoff, runoff coefficient, regression, PCA, cluster
Citation: Zhang L, Xu Q, Wang K, Chen G, Luo Z, Li X and Guo B (2023) Event-scaled hydrological response of a headwater catchment in Hong Kong. Front. Environ. Sci. 11:1218239. doi: 10.3389/fenvs.2023.1218239
Received: 06 May 2023; Accepted: 02 June 2023;
Published: 07 July 2023.
Edited by:
Jaan H. Pu, University of Bradford, United KingdomReviewed by:
Li Jian, China University of Geosciences Wuhan, ChinaWenjie Li, Chongqing Jiaotong University, China
Copyright © 2023 Zhang, Xu, Wang, Chen, Luo, Li and Guo. This is an open-access article distributed under the terms of the Creative Commons Attribution License (CC BY). The use, distribution or reproduction in other forums is permitted, provided the original author(s) and the copyright owner(s) are credited and that the original publication in this journal is cited, in accordance with accepted academic practice. No use, distribution or reproduction is permitted which does not comply with these terms.
*Correspondence: Qian Xu, eHVxaWFuXzEwMEAxNjMuY29t