 Genghao Cui
 Huizhen Mao
 Xin Dong3
 Lin Shao
- 1Automation and Electrical Engineering School, Linyi University, Linyi, Shandong, China
- 2Business School, Guilin University of Electronic Technology, Guilin, Guangxi, China
- 3Department of Economics and Management, Qilu University of Technology (Shandong Academy of Sciences), Jinan, Shandong, China
Green finance is considered an effective way to promote economic development and environmental protection. The Chinese government has formulated the green financial reform and innovation policy to change the energy consumption structure (ECS) and achieved the goal of economic development and environmental protection. This paper considers the pilot zones for green finance reform and innovation (PZGFRI) set up in 2017 as a quasi-natural experiment, and we adopt the synthetic control method (SCM) to evaluate the possible policy effects of the PZGFRI on the ECS based on panel data from 30 provincial-level administrative regions from 2013 to 2019. The empirical results reveal that the PZGFRI setup plays a key role in influencing the ECS. The PZGFRI policy significantly optimizes the ECS in both Zhejiang Province and Guizhou Province, and the investigative result of Guizhou Province is better than that of Zhejiang Province. Meanwhile, the placebo test and robustness tests are still valid. This study contributes to a better understanding of the effectiveness of China’s PZGGRI policy on the ECS and also provides a reference for the country’s green finance to promote the adjustment of the ECS.
1 Introduction
Green financial policies have become an important tool to accelerate innovation in the green financial system and promote environmental protection and governance. In order to enhance the role of finance in improving the ecological environment and achieving the efficient use of resources, the green finance sector carries out investment and financing activities in project areas such as energy-saving products, clean energy, and green buildings.
China is the world’s largest energy consumer, accounting for 26% of the global energy consumption in 2020 (Sun and Chen, 2022). Consequently, China puts great emphasis on environmental protection and pollution control. Therefore, it is necessary for China to adjust its current coal-based energy consumption structure (ECS) to decrease the proportion of fossil fuel energy consumption and increase the percentage of clean energy consumption. The final goal is to optimize the current ECS, reduce pollution emissions, and improve environmental quality. Unfortunately, the traditional ECS has hardly changed, and coal and fossil fuel energy consumption is still dominant.
In recent years, green finance has been proven to contribute to adjusting and solving the ECS to promote environmental protection and economic development (Lee and Lee, 2022; Hu and Zhang, 2023), thereby ensuring high-quality transformation (Lamperti et al., 2021). Compared to Western nations, green finance in China started later but developed rapidly. Between 2017 and 2022, the Chinese government built pilot zones for green financial reform and innovation (PZGFRI) in Zhejiang, Guangdong, Guizhou, Xinjiang, and Jiangxi Provinces. The eighth PZGFRI was set up in Chongqing more recently. All these PZGFRI play an important role in optimizing the ECS and promoting sustainable development in the environment. This context creates a unique opportunity to study the effectiveness of PZGFRI on the ECSs in emerging markets, such as China.
Many studies have investigated the importance of PZGFRI in improving environmental protection and decreasing air pollution; however, empirical evidence on the impact of the PZGFRI on the ECS in China remains scarce. Many previous studies have corroborated the relationships between the PZGFRI and environmental effects (Huang and Zhang, 2021), energy consumption intensity (Su et al., 2022), enterprise development (Yu et al., 2023), green innovation effect (Liu and Wang, 2023; Tang et al., 2023), air pollution (Zhang et al., 2022) and urban green development (Zhang et al., 2023). According to the above-mentioned literature, few studies have focused on the impact of the PZGFRI on the ECS. Therefore, the main objective of this study is to scrutinize the possible impact of the PZGFRI on the ECS by utilizing panel data, including economic information from 30 provinces from 2013 to 2019, assuming the pilot zone set up since 2017 as a representative case.
This study was also motivated by literature exploring the correlation between green finance and the ECS using the Generalized Method of Moment (GMM) model (Gu et al., 2023) and threshold effect model (Wang et al., 2019; Sun and Chen, 2022). However, even though this study extends the range of investigations of recent literature, its scope differs in the following aspects: it is different from previous studies in that our study utilized the synthetic control method (SCM) to address this issue. Additionally, the empirical results indicate that the green finance pilot policy poses a significant impact on the change of the ECS; in particular, the PZGFRI policy can significantly optimize the ECS between Zhejiang and Guizhou Provinces, while the policy effect in Guizhou Province is stronger than that in Zhejiang Province. This paper provides new empirical evidence and enriches the related literature. These findings also provide useful policy implications for understanding the role of the PZGFRI in ECS optimization in China.
The marginal contributions of this study are as follows: First, this article examines the policy effects of PZGFRI on the ECS and enrichens relevant experimental studies on PZGFRI; second, to avoid subjective selection to construct a control unit, the SCM is used instead of the difference-in-differences (DID) method to exploit the possible impact of the PZGFRI on the ECS; third, this article is helpful in providing a reference for China’s green finance to promote the adjustment of the ECS.
The remainder of this article is organized as follows: Section 2 introduces the PZGFRI evolution in China. Section 3 provides a literature review. Section 4 presents the research design. Section 5 reports the empirical results. Section 6 provides the robustness checks. Section 7 provides the conclusions and policy implications.
2 Pilot zone for green finance reform and innovation in China
The Chinese government has positively balanced the relationship between industrial development and environmental protection in recent years and has made great efforts to lessen the indirect impact of environmental pollution on the sustainable green economy (Lamperti et al., 2021). Therefore, reducing high-pollution industries and changing energy structures are of strategic significance. Government awareness regarding green finance is a viable way to alleviate energy consumption pressure and accelerate ecological and environmental improvement, thereby providing a convenient and efficient financing channel for addressing the ECS problem in China.
In 2017, the State Council in China began to build PZGFRI in five provinces—Guangdong, Zhejiang, Jiangxi, Guizhou, and Xinjiang—to investigate the green finance experience. In these pilot zones, five major reform pilot missions were implemented, and its detailed tasks seek that 1) Pilot zones fully support financial institutions to build green financial departments or green sub-branches; 2) the financial institutions in the pilot zones totally promote the development of green credit. The average annual rate of green credit is up to 21% in the pilot zones, which exceeds that of the whole country; 3) the pilot zones try to explore the establishment of environmental rights and interests trading markets; 4) the governments in pilot zones provide convenient government service channels with priority for green projects; 5) the institutions in the pilot zones construct financial risk prevention mechanisms. Since the establishment of the PZGFRI, a large number of policies, measures, and designed incentive mechanisms have been proposed to promote green finance development. Each pilot zone has special features regarding the economic structure, environmental protection, natural resources, and other aspects and executes its own unique pilot policy. In view of this, the central and local governments can implement different green finance policy orientations in different pilot zones. For instance, in cooperation with the Guangdong–Hong Kong–Macao Greater Bay Area, Guangdong promoted the new energy industry through green bond finance. In Zhejiang, banking financial institutions issued special financial products to construct a diversified green financial service system, which accelerated the transformation and upgrading of the traditional chemical industry. Jiangxi established a comprehensive green financial system and offered energy savings, emission reductions, and clean energy through green credit. Guizhou’s pilot policy successfully promoted local economic transition. Relying on the advantages of big data technology, many cities and areas in Guizhou alleviated and eliminated poverty through a green finance policy, and in Xinjiang, a green project database management system was established to support the development of modern agriculture and clean energy using green insurance.
Figure 1 shows the regional distribution of the five pilot provinces in China. The geographical differences between these five provinces are easily distinguishable. In the five pilot provinces, pilot cities/districts were selected. Guangzhou was selected as the pilot city in Guangdong Province; Huzhou and Quzhou were selected as the pilot cities in Zhejiang Province; Jiangxi Province selected Ganjiang’s new district; Guizhou Province selected Guian’s new district; and the Xinjiang Autonomous Region selected Hami, Changji, and Karamay.
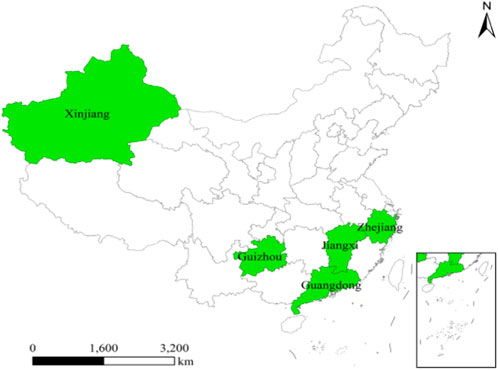
FIGURE 1. The five pilot zones in this study.
3 Literature review
In the following section, we enhance our understanding of the PZGFRI in China by extending, integrating, and enriching several lines of work, including green finance policy and the ECS.
3.1 Green finance policy
Green finance is the product of financial innovation and a low-carbon economy that relies on financial instruments to achieve ecological and environmental protection (Cowan E, 1998; Salazar, 1998). Some viewpoints have indicated that the essence of green finance is the optimization and improvement of relevant financial products through the many financial solutions to guide firms toward an energy-saving and sustainable development model (Sonia L., 2007). Eventually, economic development and environmental protection reach a balanced state. Other researchers believe that green finance emerges from the realization that the development of finance needs to be linked to the environmental and climate risks faced by the real economy (Xu et al., 2023). Some earlier opinions concluded that the current mainstream green finance research places more emphasis on the short- and long-term impacts of sustainable financial practices focusing on environmental protection (Ma et al., 2023). They also concluded that green finance policies can improve corporate green innovation by guiding banks and financial institutions to use various factors, such as pollutant emissions and environmental pollution, as criteria for credit allocation (Wang, 2023).
The establishment of the PZGFRI marks a new stage of development in China’s green finance, beginning with a combined model of top-down design and bottom-up regional exploration (Irfan et al., 2022). Financial reforms, which indirectly influence the environment through technological innovation (Dehdar et al., 2022) by promoting economic and financial agglomeration, are new tools for the current governance of the environment (Zhang and Chen, 2023). Empirical evidence has elucidated the impact of the PZGFRI implementation on green innovation activities and found that the policy boosted the quantity and quality of corporate green innovation by promoting R&D investments and credit size, which in turn improved the quantity and quality of corporate green innovation (Zhang and Li, 2022). However, others have also found that the PZGFRI implementation effectively reduces the debt financing cost of heavy polluters, while a mechanism analysis indicated that the policy encourages heavy polluters to assume social responsibility and establish a good corporate image to obtain lower debt financing rather than promoting an innovation compensation effect (Shi et al., 2022).
3.2 ECS
Some findings have primarily indicated the ECS in terms of economic growth, urbanization, technological progress, and industrial structure (Koengkan and Fuinhas, 2020). Energy consumption is the driving force of economic growth, and economic development generates a large amount of energy demand (Koengkan et al., 2020). Many researchers have also found a causal relationship between economic growth and energy consumption (Jahangir Alam et al., 2012; Dogan and Turkekul, 2015; Saidi and Hammami, 2015; Dehdar et al., 2022). Native literature has attempted to explain the relationship between energy consumption and urbanization in China (Wu et al., 2019). Using a dynamic threshold panel model, these researchers empirically found that the relationship between energy consumption and urbanization is non-linear, with energy consumption having a facilitating effect on Chinese cities at this stage; however, the facilitating effect decreases when energy intensity and the consumption scale increases. Other studies found that the technology level is positively correlated with energy consumption (Ferreira Neto et al., 2014). An optimization model based on the input–output model was developed to assess the impact of the industrial structure on energy consumption and carbon emissions and revealed that industrial restructuring had sizable energy-saving and carbon-reducing effects (Mi et al., 2015).
3.3 Impact of green finance policy on the ECS
There has been relatively little discussion on green finance policies and the ECS. Green finance development has a positive effect on the ECS transformation, which is revealed through the construction of the intermediary effect and threshold effect models (X. Gu et al., 2023). Using panel data from 30 provinces in China (except the Tibet Autonomous Region) from 2007 to 2020 to analyze the relationship between green finance development and energy consumption restructuring through a sys-GMM model, it was found that improvement in green finance development will effectively promote energy consumption restructuring (Sun and Chen, 2022). A difference-in-differences model was utilized to explore the effect of the green finance pilot zone policy on the energy consumption intensity of Chinese A-share listed firms, and it was found that the policy can reduce the energy consumption of firms (Su et al., 2022).
Based on the practical level of emphasis on green finance in China, empirical evidence on the impact of the PZGFRI on the ECS remains limited. Therefore, with this study, we further explore this impact through the SCM.
4 Research design
4.1 Selection of variables and data sources
The variables used in this study have been grouped into explanatory and control variables. Summary statistics of these variables are presented, referring to earlier studies (X. Gu et al., 2023; Sun and Chen, 2022; S. Wang et al., 2019).
4.1.1 Kernel explanatory variable
The ECS mainly reflects the proportional relationship between clean energy consumption (such as natural gas and wind power) and total energy consumption (including coal and petroleum). Referring to prior research (X. Gu et al., 2023; Sun and Chen, 2022; S. Wang et al., 2019), this study uses the ratio of natural gas consumption to coal consumption as a proxy variable to represent the ECS level in each province, which reflects the impact of the PZGFRI.
4.1.2 Control variable
Based on the existing literature (Chen et al., 2019; Sun and Chen, 2022; S; Wang et al., 2019), the control variables include the economic development level (PGDP—per capita GDP) (PGDP) (Sun and Chen, 2022; S. Wang et al., 2019), urbanization level (U) (Chen et al., 2019; Sun and Chen, 2022), energy price (EP) (Sun and Chen, 2022), innovation ability (PAT) (Ferreira Neto et al., 2014; W. Gu et al., 2019; B. Wang and Wang, 2018), and industrial structure (IOS) (Sun and Chen, 2022), whose definitions are given in Table 1.
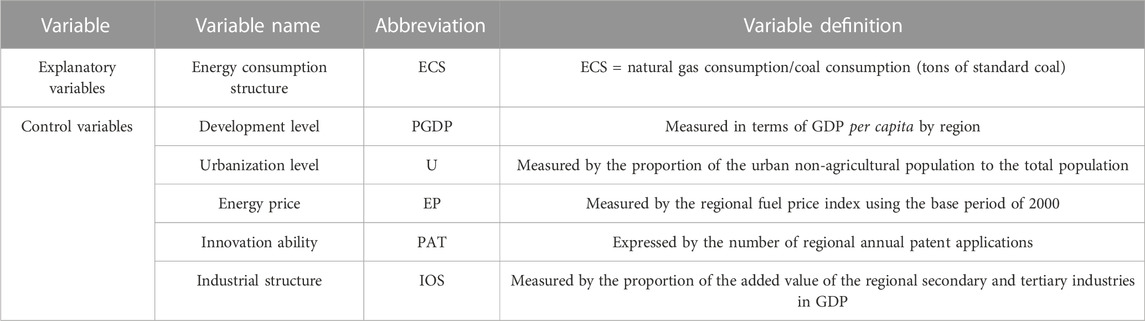
TABLE 1. Definitions of variables.
This study focuses on the years between 2013 and 2019, with the PZGFRI being issued in 2017, which allows for the effective analysis of the changes in the annual ECS before and after the province joined the PZGFRI. The main reason why this time period has been chosen is to consider the “Green credit policy”, which was issued in 2012, and because a new pilot zone in Lanzhou province was built after 2019. There is little information from the Lanzhou new district, and it is scarcely used by our study. Tibet has been excluded from the analysis owing to insufficient data. The study focuses on a total of 210 samples from 30 provinces (autonomous regions) and municipalities within the 7-year period. Data sources mainly comprise the “China Energy Statistical Yearbook”, provincial or municipal statistical yearbooks, wind financial platform, and national economy and social development statistical bulletins from various regions.
4.2 Synthetic control method
4.2.1 Background analysis using the SCM
The synthetic control method (SCM) can be used to understand the weight of each unaffected area in a control group, and it can construct a “counterfactual” control group of each policy intervention object with a weighted average of several control groups, as previously used in evaluating smoking policy in California (Abadie et al., 2010), Cuban immigration in Florida, and the integration of East and West Germany (1990 German reunification) (Abadie et al., 2015).
Earlier literature mainly utilized the DID method (Su et al., 2022; Zhang et al., 2022; Yu et al., 2023), PSM method (Huang and Zhang, 2021), and SCM (Tang et al., 2023) to estimate the influence of green financial policy. However, if the identifying assumptions in the DID method, including the parallel trends assumption, are not supported by the data, the DID method is inappropriate for evaluating policy effects. Additionally, the PSM method is also inapplicable if the number of treatment units is small, which creates sample loss and affects the analysis results.
The State Council decided to establish the PZGFRI in 2017, which positively impacted financial products, environmental index assessments, and capital market development in the pilot areas. Moreover, the policy itself has certain exogenous characteristics that meet the exogenous conditions in the SCM. In addition, because of the limited number of samples in the treatment unit, the parallel assumption may not be satisfied if a differential analysis method is used. Hence, the SCM is more suitable for this analysis. Therefore, this study uses an analytical method (A. Abadie et al., 2010), chooses the first five provinces that joined the PZGFRI as the treatment unit and the other provinces (except the Tibet Autonomous Region) as the control unit, and excludes the other four treatment units when each synthesis control unit is generated to analyze the impact of the PZGFRI on the ECS in the five selected provinces.
4.2.2 Basic concept of the SCM
The SCM can be utilized to structure the weight of each unaffected area in the control unit. Unaffected areas contribute to a “counterfactual” event based on the similarity of their data features, and the similarity between the control and treatment units is judged using predictive variables before the event occurs; that is, synthesizing control objects that are not subject to policy intervention (Abadie and Gardeazabal, 2003; Li et al., 2020; Song et al., 2022; Wen et al., 2023). In addition, compared with the PSM and DID methods, the SCM can overcome the endogeneity problems caused by selection bias and other factors that occur when selecting the control unit.
It is assumed that the ECS in K+1 provinces during period t∈[1,T_0] can be observed, assuming that the first province i (where i = 1) is taken as the treatment unit of the PZGFRI impact, and the other provinces k (where i > 1) unaffected by PZGFRI constraints are defined as the control unit.
where
Simultaneously, the weight vectors of all the unaffected provinces in the control unit must be synthesized for the
It is assumed that in the previous year of
According to Abadie et al. (2010), if there is a non-singular matrix
If the two sides of Eq. 4 approach 0, the ECS of the provinces in the treatment unit can be fitted with the ECS of the provinces in the control unit during period t (t
Based on the above analysis, we solve the following equation:
where
According to the proof, the estimated effect of the green finance reform and innovation pilot policy during period t on the ECS is
4.3 Methods
The following methodology has been employed to carry out this empirical research (as illustrated in Figure 2 below) (Koengkan et al., 2020).
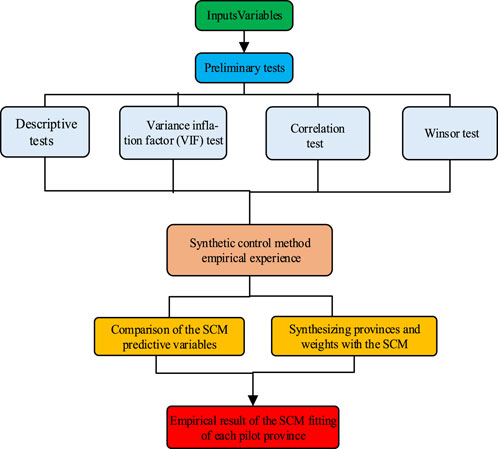
FIGURE 2. Methodology strategy (the authors created this figure).
4.3.1 Preliminary tests
Before conducting the main regression, several preliminary tests need to be executed, including descriptive statistics test, the variance inflation factor (VIF) test, correlation test, and Winsor test. The program of the detailed test will be provided in Section 5.
4.3.2 SCM empirical experience
After the preliminary test, this article uses the SCM to perform the empirical research. A detailed illustration of the SCM has been provided in Section 4.2.
This study uses the econometric software Stata 16.0, and the Stata commands include sum, winsor, pwcorr, vif, synth with option constant reg, and rmspe. These commands have been used to realize the preliminary tests and the model estimations.
5 Empirical results
5.1 Preliminary test
Descriptive statistics for the variables are shown in Table 2. Based on the indicator statistics, the ECS ranges from 0.0081 to 19.2919, with an average value of 0.3634, indicating that there is higher ECS variability during the sample period. The average PGDP is 55,761 yuan, and there is also a regional gap issue, which is in line with the findings of Tang et al. (2023). In terms of the other variables, the gap between the different regions is more obvious. Table 3 provides the correlation matrix among all key variables in the synthetic control analysis. No other correlation coefficient has an absolute value higher than 0.7, which implies that there is unlikely to be a multicollinearity issue. The diagnosis of multicollinearity implies that the estimated values of variance inflation factors (VIFs) for all explanatory variables (as shown in the last column of Table 3) are also below the threshold of 10. This evidence shows that no multicollinearity issue exists. At last, we winsorize all variables at the 1st and 99th percentile levels.
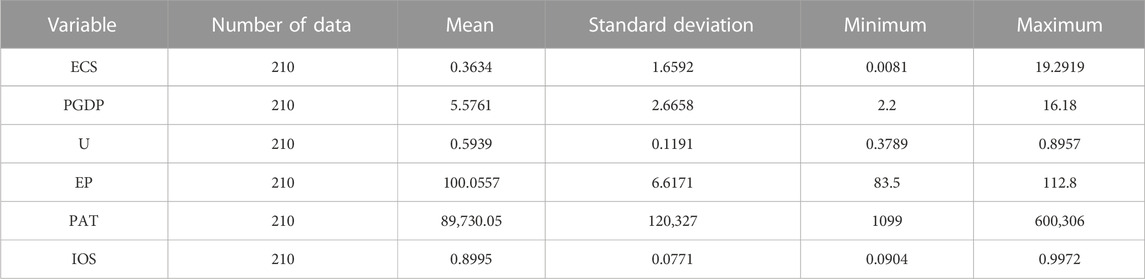
TABLE 2. Descriptive statistics of the main variables.
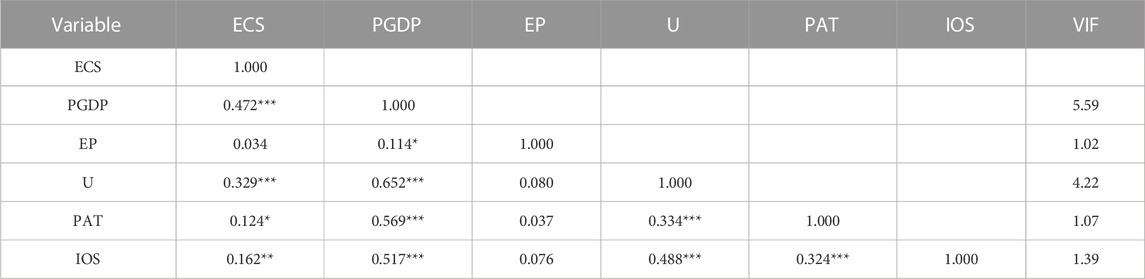
TABLE 3. Correlation test of the main variables.
5.2 Synthetic control results
5.2.1 Comparison of the SCM predictive variables
This study uses data on the PGDP, urbanization level, energy price, innovation capability, industrial structure in 2016, and ECS level in 2013, 2014, and 2016 as matching variables. A difference test has been conducted for the predictor variables. The differences in the predictor variables are shown in Table 4.
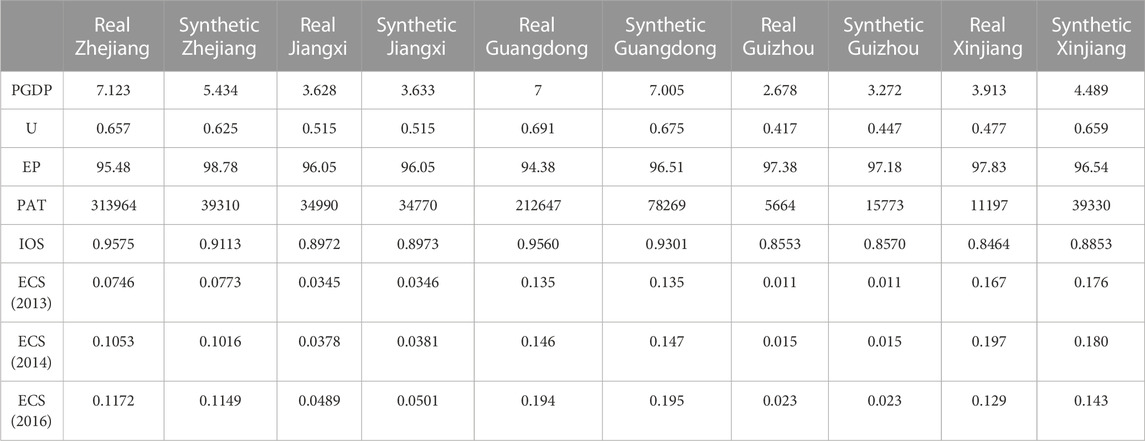
TABLE 4. Comparison of the predictive variables.
Table 4 reveals a small difference in the predictor variables between the five pilot cities and the synthesis cities. For instance, Guangdong Province exhibits a large difference in the balance of the innovation capability index compared to those of the other provinces, mainly because of its strong innovation capability. Simultaneously, there is a good matching result between the five provinces and the synthetic provinces regarding the ECS index, indicating that the characteristics of the treatment and control units are similar and parallel, and using the SCM could eliminate the inherent differences of the economic variables between the provinces.
5.2.2 Synthesizing provinces and weights with the SCM
The weight matrix of the treatment unit has been resolved using the STATA 16 software. The weights of the different provinces have been determined using the SCM. Table 5 shows that the five provinces in the treatment unit and the synthesized provinces have certain similarities regarding the economic development indicators and geographical locations. For example, Guizhou Province is synthesized by Yunnan, Neimenggu, Guangxi, Hubei, and Liaoning. Among these five provinces, Yunnan and Liaoning have the greatest and smallest weights, respectively (0.790 and 0.026, respectively), indicating that the highest similarity is between Yunnan and Guizhou in terms of ECS; however, little similarity exists between Liaoning and Guizhou. Furthermore, Guizhou is located in the southwestern region, which is close to Yunnan (weight of 0.790) in terms of a similar economic environment. Guangdong mainly matches with Fujian (weight of 0.603), having a high level of economic development. Zhejiang is chiefly matched by Hebei (weight of 0.616) and Shanghai (weight of 0.247), which are geographically adjacent, and it is reasonable to choose them as matching provinces. Xinjiang is located in Northwest China, where the level of regional economic development has a certain gap with respect to that of Mainland China. The economic development is similar to that of Hainan (weight of 0.124) and Liaoning (weight of 0.876).
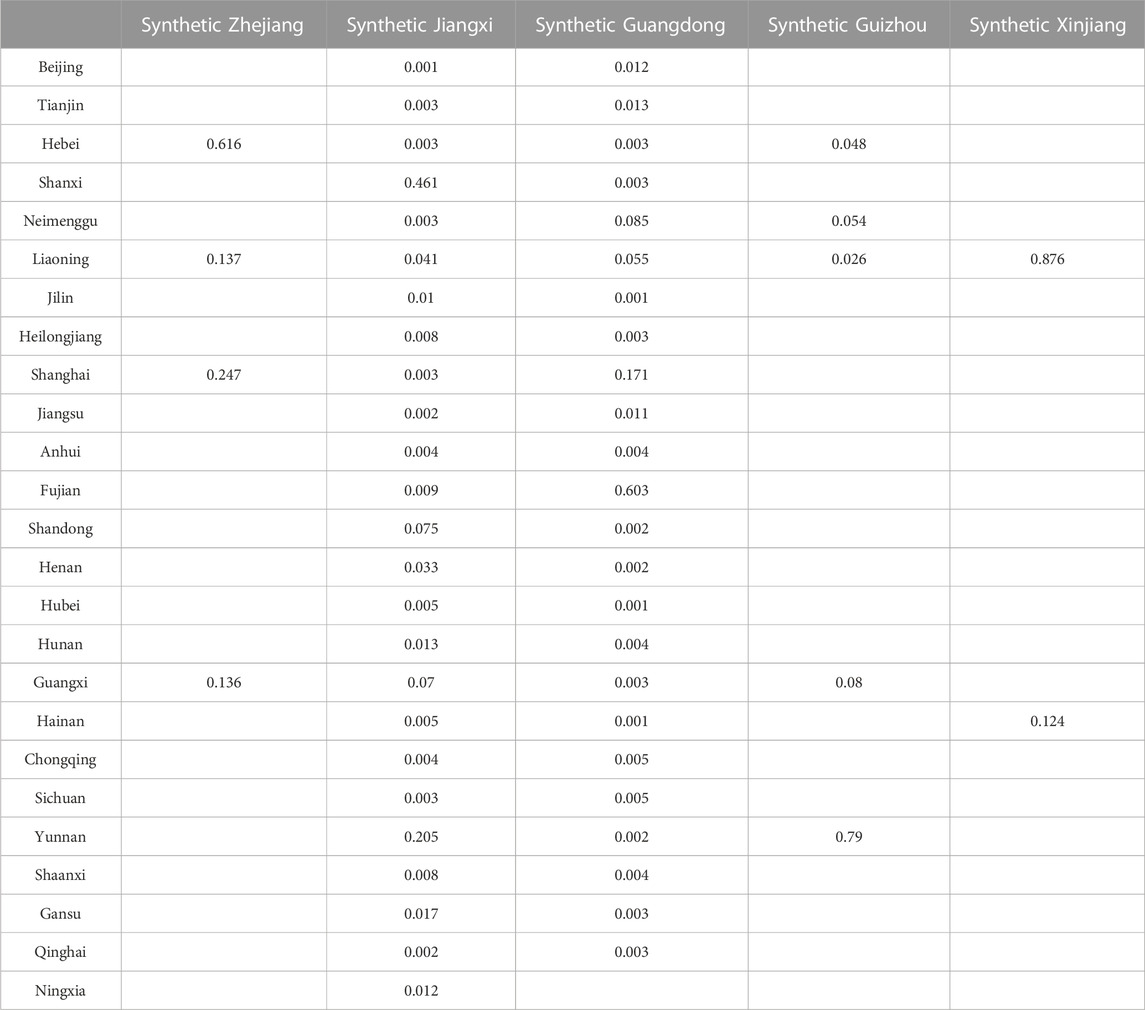
TABLE 5. Synthesized provinces and weights.
5.2.3 Empirical results of the SCM fitting of each pilot province
Figures 3–7 show the comparison of the ECSs of the real and synthetic in each pilot province from 2013 to 2019. Among these five figures, Figures 3A–7A illustrate the ECSs trend of the real and synthetic in each pilot province. Figures 3B–7B reveal the difference (gap) in the ECS between the synthetic and real pilot province. In Figures 3A–7A, the solid curve represents the ECS of the pilot province, the dotted curve represents the ECS of the synthetic province, and the vertical dotted line represents the implementation period of the pilot policy. The left side of the dotted curve on the time axis is the period before the implementation of the PZGFRI (in 2017). The right side is the period after the implementation of the pilot policy. On the right side, if the position of the solid line is higher than that of the dotted line, this illuminates that the optimized effect of the ECS in the pilot province becomes stronger. On the contrary, the optimized effect is weak.
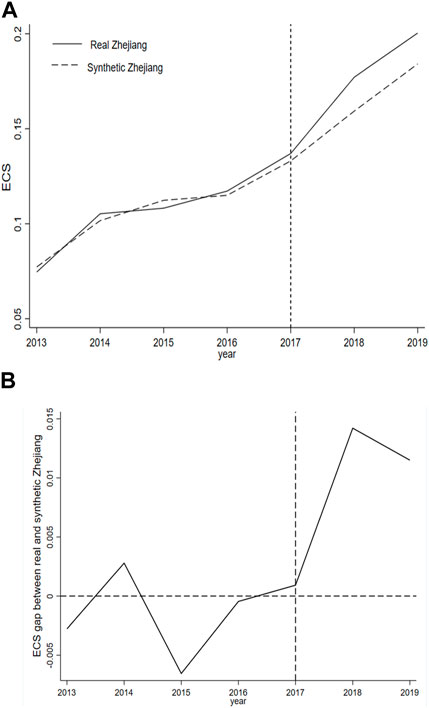
FIGURE 3. Comparison of the ECSs of the real and synthetic in Zhejiang.
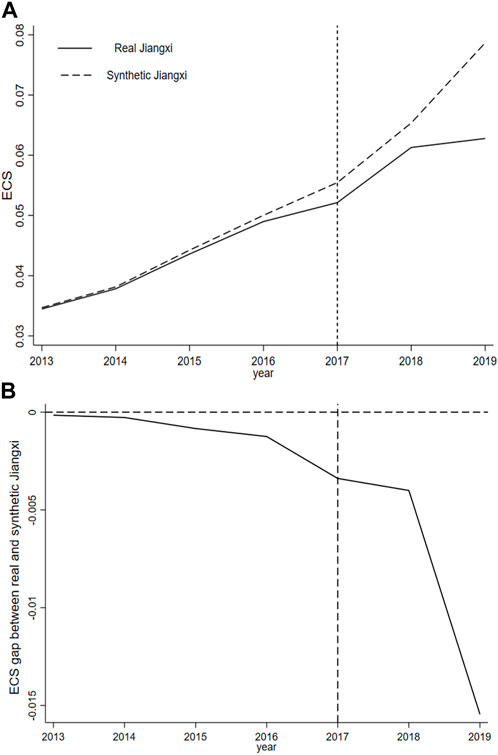
FIGURE 4. Comparison of the ECSs of the real and synthetic in Jiangxi.

FIGURE 5. Comparison of ECSs of the real and synthetic in Guangdong.
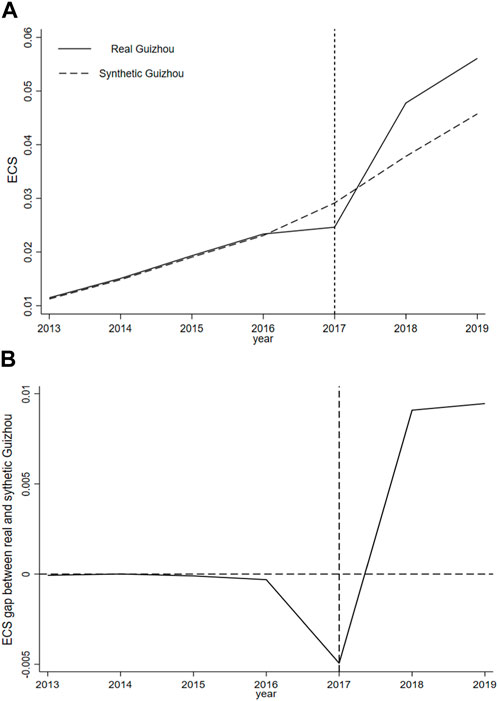
FIGURE 6. Comparison of the ECSs of the real and synthetic in Guizhou.
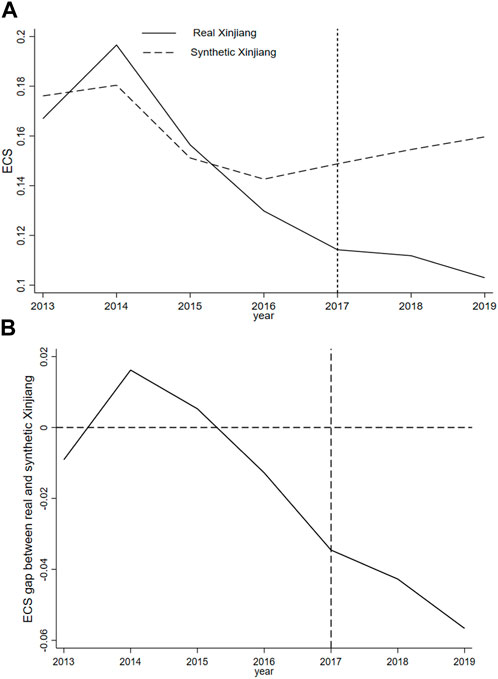
FIGURE 7. Comparison of the ECSs of the real and synthetic in Xinjiang.
In Figures 3B–7B, the solid curve represents the gap in ECS between the synthetic and real pilot provinces. The horizontal dotted line is a zero value of axis, which represents the difference in the ECS. The vertical dotted line represents the implementation period of the pilot policy. Figures 3B–7B can distinctly describe the policy effect of the PZGFRI on the ECS in the five pilot zones. If the value of the gap in the ECS is positive, this illustrates that the ECS in this pilot province becomes optimized significantly. Reversely, if the value of the gap in the ECS is negative, this means that the optimization of the ECS in this pilot province is weak.
On the whole, according to the graphic illustrations from Figures 3A–7A, the synthetic control analysis supported by the SCM shows that the real ECSs of Zhejiang, Jiangxi, Guangdong, and Guizhou are similar to their respective synthetic ECSs, which indicates that there was no significant difference between the ECSs of the pilot provinces and the ECSs of their synthetic provinces before the PZGFRI policy performs. In contrast, there is a pronounced difference between the ECS of Xinjiang and that of its synthetic province. The possible main reason for this is that Xinjiang has rich energy resources and, therefore, more choices regarding energy consumption goods, and it is difficult to fit the predictor variables of other provinces. Since the PZGFRI policy was implemented in 2017, the policy effects in the five different pilot provinces show diversity. We will discuss this diversity later in detail.
In terms of policy effect, according to the graphic illustrations from Figures 3B–7B, the PZGFRI policy creates an obvious optimization effect on the ECSs in both Zhejiang and Guizhou, with the policy effect of Guizhou being better than that of Zhejiang, indicating that the proposed influence of the PZGFRI policy on the ECS is valid. However, we have also found that several provinces, such as Jiangxi, Guangdong, and Xinjiang, have failed to optimize their ECSs significantly since the policy implementation in 2017.
Now, we concretely analyze the different policy effects shown in Figures 3–7. Figure 3A shows the ECS indicator of Zhejiang rising rapidly after the policy implementation in 2017, whereas the ECS indicator of the synthetic Zhejiang increases slowly. The ECS indicator of Zhejiang being higher than that of the synthetic Zhejiang indicates that the PZGFRI policy implementation played a key role in the ECS optimization in Zhejiang. We also can find in Figure 3B that the gap in the ECS after 2017 is positive, the highest point of the gap happens in 2018, and then it decreases slowly.
Similarly, in Figure 6A, the ECS indicator of Guizhou shows an obvious upward trend since the policy implementation in 2017, with the ECS gap between Guizhou and the synthetic Guizhou gradually increasing from Figure 6B, implying that the policy implementation has been valid since 2017, and the ECS of Guizhou has been significantly optimized. Different from the ECS gap in Zhejiang province, the gap in ECS in Guizhou province shows an upward trend from 2017 to 2019, which reaches the peak in 2019. In this case, we can determine that the value of ECS gap in Guizhou province exceeds that in Zhejiang province according to the value of the ordinate axis; in this case, the policy effect of Guizhou is better than that of Zhejiang.
Figure 4A indicates that before the PZGFRI policy implementation, the difference between the ECS indicator of Jiangxi and that of the synthetic Jiangxi is not significant, with the latter successfully fitting the ECS trend of Jiangxi. Although there is a brief increase after the PZGFRI implementation, the optimization effect does not continuously improve. The main reason for this is that natural resources in Jiangxi are insufficient, and energy production is mainly dominated by coal resources. More than 90% of the coal demand and nearly 100% of the natural gas demand depend on energy input from other provinces, meaning that energy consumption in Jiangxi is seriously influenced by the energy market, and the PZGFRI policy has little effect on the ECS in Jiangxi. We also can see from Figure 4B that the ECS gap is negative after 2017, and especially after 2018, the ECS gap drops dramatically, which means that the optimized effect of the ECS in Jiangxi Province does not achieve the intended goal.
Figure 5A shows that the ECS gap between Guangdong and the synthetic Guangdong is small on the left side of the vertical dotted line. However, the ECS indicators of Guangdong and the synthetic Guangdong show upward trends on the right side of the vertical dotted line. This gap gradually increases, indicating that the impact of the PZGFRI policy on the ECS in Guangdong is weaker. A possible reason for this is related to the ECS of Guangzhou, whose ECS is mostly going to be dominated by coal and oil in the future. In Figure 5B, the ECS gap is negative and drops dramatically after 2017, which illustrates that the policy effect is not obvious.
Figure 7A shows that the PZGFRI policy has had little influence on the ECS in Xinjiang, where the declining trend of the ECS indicator remains unaffected. Natural resources in Xinjiang, such as coal, oil, and natural gas, are abundant; however, coal consumption remains dominant because of its large reserves, shallow burial, good mining conditions, and low development cost. Figure 7B also indicates that the ECS gap is negative. In summary, as demonstrated in Figures 4B, 5B, 7B, the impacts of the PZGFRI policy on the ECSs in Jiangxi, Guangdong, and Xinjiang are weak.
6 Robustness test
6.1 Placebo Test-RMSPE test
Placebo studies can be utilized to confirm if the differences in the ECS between real and synthetic provinces were caused by the PZGFRI policy rather than other elements, that is, whether the authentic estimation was statistically notable.
This paper follows the practices of Abadie et al. (A. Abadie et al., 2010); we assume that the control unit (non-pilot provinces) was also affected by and evaluated with the PZGFRI policy and used the SCM to construct the synthetic control units of each non-pilot province. Then, we compare the differences of the policy impact of the PZGFRI on the ECS from the placebo study with the differences from the empirical analysis. If the differences between the pilot provinces in the empirical analysis far exceed the differences in the placebo study, then the PZGFRI policy effect is credible and significant.
According to the practice of Abadie et al. (A. Abadie et al., 2010), if the Root Mean Square Prediction Error (RMSPE) value in the synthetic province is bigger before the PZGFRI policy implementation, the effect of the PZGFRI policy can be considered invalid.
Based on the above analysis, we conduct a placebo test for Zhejiang, Guizhou, Jiangxi, Guangdong, and Xinjiang; meanwhile, the provinces whose RMSPE values were greater than five times those of the pilot provinces before policy implementation are excluded from the placebo test. Thus, 12 provinces are removed from the Zhejiang control unit (Guizhou, Jiangxi, Xinjiang, Guangdong, Beijing, Qinghai, Jiangsu, Hebei, Liaoning, Jilin, Tianjin, and Hainan), 12 provinces removed from the Guizhou control unit (Zhejiang, Jiangxi, Guangdong, Xinjiang, Beijing, Hebei, Liaoning, Jiangsu, Jilin, Hubei, Chongqing, and Sichuan), 12 provinces removed from the Jiangxi control unit (Zhejiang, Guizhou, Guangdong, Xinjiang, Beijing, Tianjin, Hainan, Shanghai, Henan, Sichuan, Ningxia, and Qinghai), 11 provinces removed from the Guangdong control unit (Zhejiang, Jiangxi, Guizhou, Xinjiang, Beijing, Tianjin, Hainan, Sichuan, Qinghai, Ningxia, and Fujian), and 10 provinces removed from the Xinjiang control unit (Zhejiang, Guangxi, Guizhou, Jiangxi, Hainan, Beijing, Tianjin, Qinghai, Ningxia, and Sichuan).
Figures 8A–E show the changes in the mean values of RMSPE between the pilot provinces and the synthetic provinces. The black solid line represents the estimated difference of the ECS between the pilot provinces and the synthetic provinces, the dotted gray line represents the difference of the ECS between the non-pilot province and their synthetic provinces, and the red dotted line represents the implementation period of the PZGFRI policy. Before 2017, the fluctuation of the ECS gap between the pilot provinces and other provinces was not very large, except in Xinjiang province, which illustrates that the ECS gap between the pilot provinces and other provinces is little. However, after 2017, the fluctuation of the ECS gap shows a significant increase between Zhejiang province and Guizhou Province, which indicates that the PZGFRI policy optimized the ECSs of Zhejiang and Guizhou. Their placebo studies included 18 (30-12) provinces, and the estimated probability of the results can be considered to be only 1/18 (i.e., 5.5%), which is statistically significant. Therefore, the effect of the PZGFRI policy on the ECS optimization in Zhejiang and Guizhou is significant at the 10% statistical level.
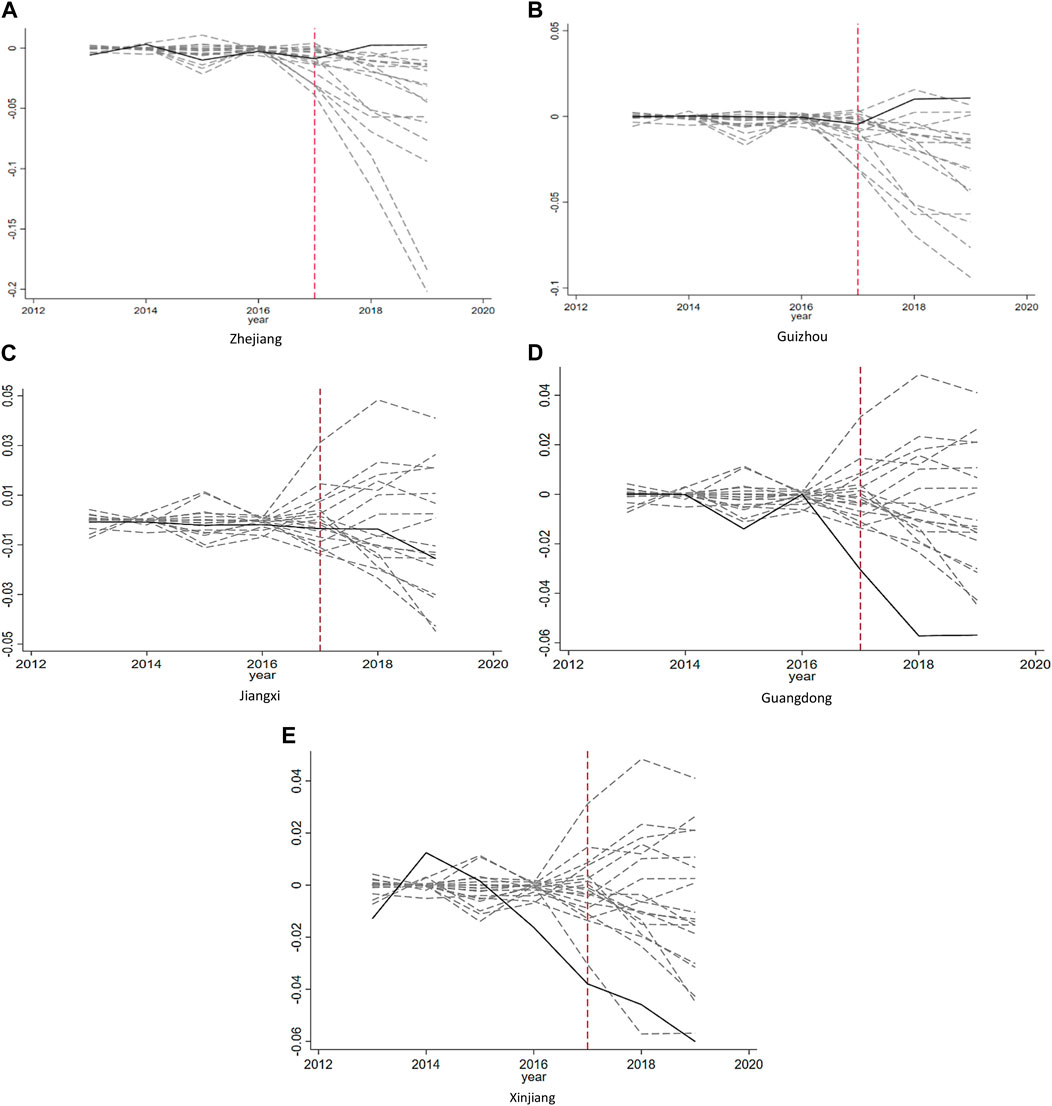
FIGURE 8. Gap of the ECS level in the five pilot provinces [(A) Zhejiang, (B) Guizhou, (C) Jiangxi, (D) Guangdong, and (E) Xinjiang] and placebo gap in the control provinces from 2013 to 2019.
6.2 Robustness test- regional robustness test
The robustness of the policy effect is examined for the region where the PZGFRI policy has been implemented. The method is as follows: The provinces with the largest synthetic weight in the control unit are selected as the virtual treatment unit, the real treatment unit is selected as the virtual control unit, and a counterfactual test is conducted. Zhejiang, Guizhou, Jiangxi, Guangdong, and Xinjiang have been selected for the analysis. The maximum synthetic weight in Zhejiang is Hebei, the maximum synthetic weight in Guizhou is Yunnan, the maximum weight in Jiangxi is Shanxi, the maximum synthetic weight in Guangdong is Fujian, and the maximum synthetic weight in Xinjiang is Liaoning.
The detailed results are presented in Figures 9A–E. Where the solid curve is the ECS of the real province, the dotted curve is the ECS of the synthetic province, and the vertical dotted line represents the implementation period of the pilot policy. The left side of the dotted curve on the time axis is the period before the implementation of the PZGFRI (in 2017). The right side is the period after the implementation of the pilot policy.
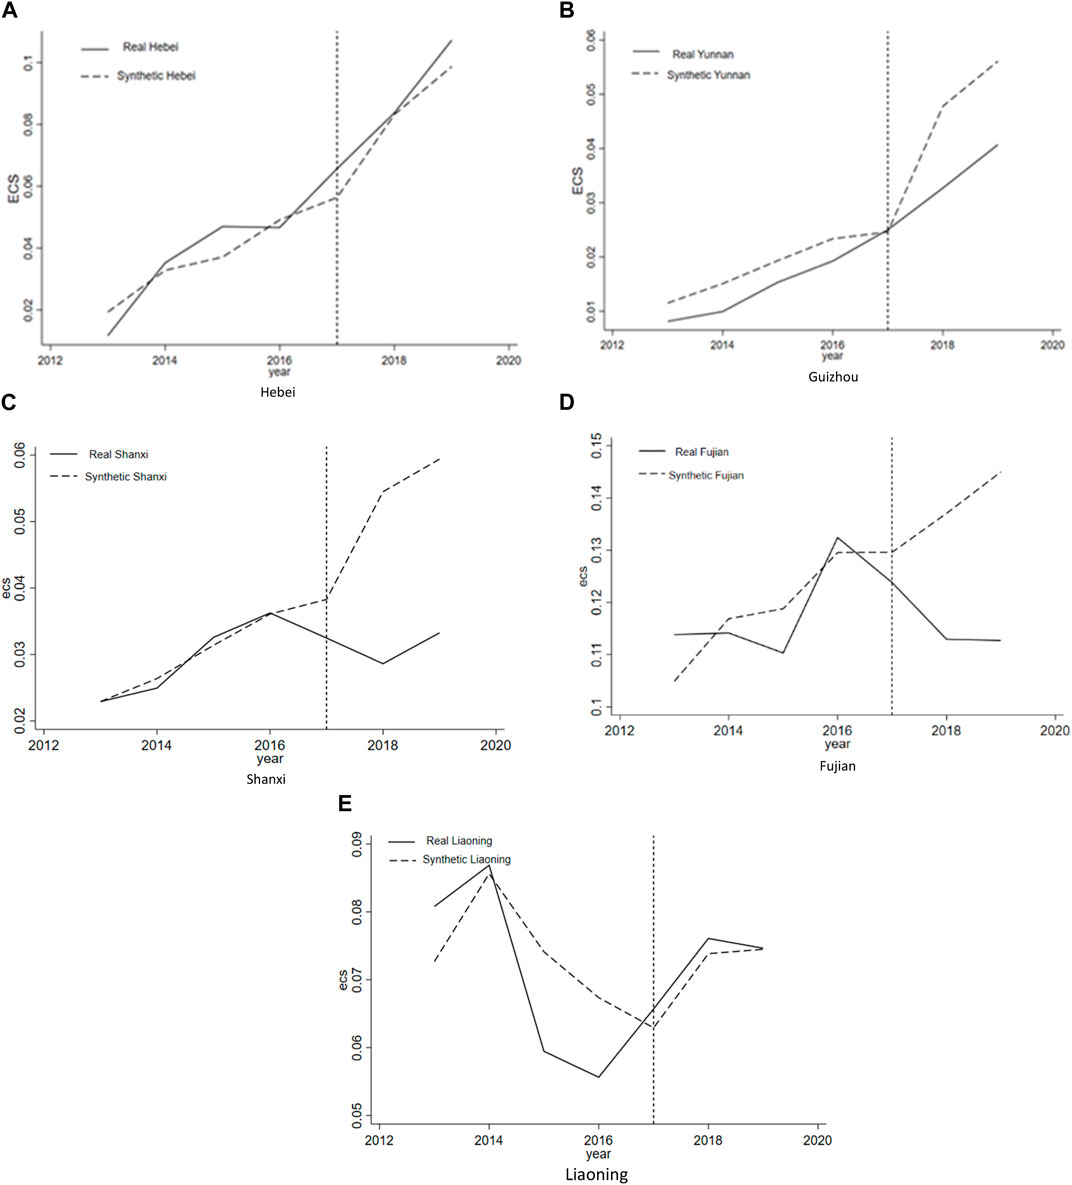
FIGURE 9. Comparison the ECS between real and synthetic in the provinces [(A) Hebei, (B) Guizhou, (C) Shanxi, (D) Fujian, and (E) Liaoning) from 2013 to 2019. Will Green Financial Policy Influence the Energy Consumption Structure? Evidence from the Pilot Zones for Green Finance Reform and Innovation in China.
After 2017, the change in the ECS along the synthetic object in Hebei did not show the same rapid increase as that in Zhejiang. The change in the ECS in Yunnan was always slower than that in the synthetic province, and the ECS gap gradually increased. The test has once again proved that the PZGFRI policy is an important reason for the ECS optimization in Zhejiang and Guizhou.
7 Conclusion, policy suggestions, and future directions
7.1 Conclusion
In 2017, the State Council in China began to build PZGFRI in five provinces—Guangdong, Zhejiang, Jiangxi, Guizhou, and Xinjiang—to investigate the green finance experience. The PZGFRI policy is helpful for realizing a low-carbon economy and environmental protection. This research utilizes the SCM to evaluate the PZGFRI policy effect on the ECS using panel data from 30 province-level administrative regions in China (except the Tibet Autonomous Region) from 2013 to 2019. The corresponding research findings in this study indicate the following: 1) The PZGFRI establishment can significantly influence the ECS, and the results of policy effect test indicate that the policy effect persists over time. These findings still hold under a series of tests, including the placebo test and robustness tests; 2) the PZGFRI significantly affected the ECSs of both Zhejiang and Guizhou Provinces, which indicates that the investigation result is better in Guizhou Province than in Zhejiang province. Compared with the published research, our results are in line with the earlier views, namely, that the PZGFRI has significantly improved the development level of green finance in China. It is also found that the PZGFRI has different effects on the ECS in different regions.
Reversely, In Jiangxi, energy production is mainly dominated by coal resources. More than 90% of the coal demand and nearly 100% of the natural gas demand depend on energy input from other provinces, meaning that energy consumption in Jiangxi is seriously influenced by the energy market, and the PZGFRI policy has little effect on the ECS in Jiangxi.
7.2 Policy suggestions
This study proposes an empirical test for the PZGFRI and the related ECS optimization, which makes a significant contribution to the development of the PZGFRI in China. Each pilot zone has its own unique characteristics in terms of the economy, environment, resources, and other aspects. The PZGFRI support effective methods to address the challenges related to the ECS. Based on the aforementioned conclusions, the following suggestions can be made: First, the PZGFRI scope should gradually be expanded to eventually cover the entire country. Additionally, the government should encourage financial institutions to cooperate as they can provide significant financial support for addressing regional disparities. Second, variants of this policy should be implemented in different regions. For example, in the Xinjiang Autonomous Region, the PZGFRI effect on the ECS is poor compared to those in other eastern regions. In this case, it is crucial to maintain the current ECS and accelerate the green transformation of industrial structures in the future.
7.3 Future directions
Finally, although this article fills the possible gap in the extant research on the effect of the PZGFRI on the ECS in China, some potential questions remain unanswered and should be specified, offering other directions for future research. First, the limitation arises from the period collection. The last year in the sample is 2019; however, in 2020, a new pilot zone was built in Lanzhou new district in Gansu province. In this case, the information available is not sufficient, which might affect the estimated quality. To obtain a more complete evaluation on the PZGFRI, it would also be interesting to explore the possible empirical evidence from after 2019. Second, another possible shortcoming is the measurement of the ECS. Other studies use the ratio of natural gas consumption to total consumption as a proxy variable to represent the ECS. Thereby, the estimating results might be different if we use a new ECS proxy variable. Third, this paper makes a comprehensive evaluation of the PZGFRI from the macrocosmic perspective; however, the study does not consider the heterogeneity test. Future research might consider the different policy impact on firms with property rights from the microcosmic perspective, More and more new pilot zones will be built in the future, and how to evaluate the policy impact of the PZGFRI has become a new topic of academic research in recent years. Future research could further consider this issue to enrich the literature on green finance policy.
Data availability statement
The original contributions presented in the study are included in the article/Supplementary material, further inquiries can be directed to the corresponding author.
Author contributions
Specifically, GC and XD con-ceived this study, collected, and processed data. HM and MW analyzed the data and wrote the first draft. LS reviewed and edited the writing. All authors contributed to the article and approved the submitted version.
Conflict of interest
The authors declare that the research was conducted in the absence of any commercial or financial relationships that could be construed as a potential conflict of interest.
Publisher’s note
All claims expressed in this article are solely those of the authors and do not necessarily represent those of their affiliated organizations, or those of the publisher, the editors and the reviewers. Any product that may be evaluated in this article, or claim that may be made by its manufacturer, is not guaranteed or endorsed by the publisher.
Abbreviations
ECS, Energy consumption structure; EP, Energy price; GMM, Generalized method of moment; IOS, Industrial structure; PAT, Innovation ability; PGDP, Per capita GDP; PZGFRI, Pilot zones for green finance reform and innovation; R&D, Research and experimental development; SCM, Synthetic control method; U, Urbanization level.
References
Abadie, A., Diamond, A., and Hainmueller, J. (2015). Comparative politics and the synthetic control method. Am. J. Political Sci. 59 (2), 495–510. doi:10.1111/ajps.12116
Abadie, A., Diamond, A., and Hainmueller, J. (2010). Synthetic control methods for comparative case studies: Estimating the effect of California’s tobacco control program. J. Am. Stat. Assoc. 105 (490), 493–505. doi:10.1198/jasa.2009.ap08746
Abadie, A. G., and Gardeazabal, J. (2003). The economic costs of conflict: A case study of the Basque country. Am. Econ. Rev. 93 (1), 113–132. doi:10.1257/000282803321455188
Chen, S., Jin, H., and Lu, Y. (2019). Impact of urbanization on CO2 emissions and energy consumption structure: A panel data analysis for Chinese prefecture-level cities. Struct. Change Econ. Dyn. 49, 107–119. doi:10.1016/j.strueco.2018.08.009
Dehdar, F., Silva, N., Fuinhas, J. A., Koengkan, M., and Nazeer, N. (2022). The impact of technology and government policies on OECD carbon dioxide emissions. Energies 15 (22), 8486. doi:10.3390/en15228486
Dogan, E., and Turkekul, B. (2015). CO2 emissions, real output, energy consumption, trade, urbanization and financial development: Testing the EKC hypothesis for the USA. Environ. Sci. Pollut. Res. 23 (2), 1203–1213. doi:10.1007/s11356-015-5323-8
Ferreira Neto, A. B., Perobelli, F. S., and Bastos, S. Q. A. (2014). Comparing energy use structures: An input–output decomposition analysis of large economies. Energy Econ. 43, 102–113. doi:10.1016/j.eneco.2014.02.001
Gu, W., Zhao, X., Yan, X., Wang, C., and Li, Q. (2019). Energy technological progress, energy consumption, and CO2 emissions: Empirical evidence from China. J. Clean. Prod. 236, 117666. doi:10.1016/j.jclepro.2019.117666
Gu, X., Qin, L., and Zhang, M. (2023). The impact of green finance on the transformation of energy consumption structure: Evidence based on China. Front. Earth Sci. 10. doi:10.3389/feart.2022.1097346
Hu, J., and Zhang, H. (2023). Has green finance optimized the industrial structure in China? Environ. Sci. Pollut. Res. Int. 30 (12), 32926–32941. doi:10.1007/s11356-022-24514-3
Huang, H., and Zhang, J. (2021). Research on the environmental effect of green finance policy based on the analysis of pilot zones for green finance reform and innovations. Sustainability 13 (7), 3754. doi:10.3390/su13073754
Irfan, M., Razzaq, A., Sharif, A., and Yang, X. (2022). Influence mechanism between green finance and green innovation: Exploring regional policy intervention effects in China. Technol. Forecast. Soc. Change 182, 121882. doi:10.1016/j.techfore.2022.121882
Jahangir Alam, M., Ara Begum, I., Buysse, J., and Van Huylenbroeck, G. (2012). Energy consumption, carbon emissions and economic growth nexus in Bangladesh: Cointegration and dynamic causality analysis. Energy Policy 45, 217–225. doi:10.1016/j.enpol.2012.02.022
Koengkan, M., Fuinhas, J. A., and Santiago, R. (2020). The relationship between CO2 emissions, renewable and non-renewable energy consumption, economic growth, and urbanisation in the Southern Common Market. J. Environ. Econ. Policy 9 (4), 383–401. doi:10.1080/21606544.2019.1702902
Koengkan, M., and Fuinhas, J. A. (2020). The interactions between renewable energy consumption and economic growth in the Mercosur countries. Int. J. Sustain. Energy 39 (6), 594–614. doi:10.1080/14786451.2020.1732978
Lamperti, F., Bosetti, V., Roventini, A., Tavoni, M., and Treibich, T. (2021). Three green financial policies to address climate risks. J. Financial Stab. 54, 100875. doi:10.1016/j.jfs.2021.100875
Lee, C.-C., and Lee, C.-C. (2022). How does green finance affect green total factor productivity? Evidence from China. Energy Econ. 107, 105863. doi:10.1016/j.eneco.2022.105863
Li, X., Wu, Z., and Zhao, X. (2020). Economic effect and its disparity of high speed rail in China: A study of mechanism based on synthesis control method. Transp. Policy 99, 262–274. doi:10.1016/j.tranpol.2020.09.003
Liu, S., and Wang, Y. (2023). Green innovation effect of pilot zones for green finance reform: Evidence of quasi natural experiment. Technol. Forecast. Soc. Change 186, 122079. doi:10.1016/j.techfore.2022.122079
Ma, M., Zhu, X., Liu, M., and Huang, X. (2023). Combining the role of green finance and environmental sustainability on green economic growth: Evidence from G-20 economies. Renew. Energy 207, 128–136. doi:10.1016/j.renene.2023.02.046
Mi, Z.-F., Pan, S.-Y., Yu, H., and Wei, Y.-M. (2015). Potential impacts of industrial structure on energy consumption and CO2 emission: A case study of beijing. J. Clean. Prod. 103, 455–462. doi:10.1016/j.jclepro.2014.06.011
Saidi, K., and Hammami, S. (2015). Economic growth, energy consumption and carbone dioxide emissions: Recent evidence from panel data analysis for 58 countries. Qual. Quantity 50 (1), 361–383. doi:10.1007/s11135-014-0153-1
Shi, J., Yu, C., Li, Y., and Wang, T. (2022). Does green financial policy affect debt-financing cost of heavy-polluting enterprises? An empirical evidence based on Chinese pilot zones for green finance reform and innovations. Technol. Forecast. Soc. Change 179, 121678. doi:10.1016/j.techfore.2022.121678
Song, Y., Zhang, B., Wang, J., and Kwek, K. (2022). The impact of climate change on China's agricultural green total factor productivity. Technol. Forecast. Soc. Change 185, 122054. doi:10.1016/j.techfore.2022.122054
Sonia, L., R. R. W. (2007). Environmental finance:a guide to environmental risk assessment and financial product. Wiley&Sons. Inc.
Su, Z., Guo, Q., and Lee, H.-T. (2022). Green finance policy and enterprise energy consumption intensity: Evidence from a quasi-natural experiment in China. Energy Econ. 115, 106374. doi:10.1016/j.eneco.2022.106374
Sun, H., and Chen, F. (2022). The impact of green finance on China's regional energy consumption structure based on system GMM. Resour. Policy 76, 102588. doi:10.1016/j.resourpol.2022.102588
Tang, D., Fu, B., and Boamah, V. (2023). Implementation effect of China’s green finance pilot policy based on synthetic control method: A green innovation perspective. Environ. Sci. Pollut. Res. 30 (18), 51711–51725. doi:10.1007/s11356-023-25977-8
Wang, B., and Wang, Z. (2018). Heterogeneity evaluation of China's provincial energy technology based on large-scale technical text data mining. J. Clean. Prod. 202, 946–958. doi:10.1016/j.jclepro.2018.07.301
Wang, M. L. (2023). Effects of the green finance policy on the green innovation efficiency of the manufacturing industry: A difference-in-difference model. Technol. Forecast. Soc. Change 189, 122333. doi:10.1016/j.techfore.2023.122333
Wang, S., Li, C., and Zhou, H. (2019). Impact of China's economic growth and energy consumption structure on atmospheric pollutants: Based on a panel threshold model. J. Clean. Prod. 236, 117694. doi:10.1016/j.jclepro.2019.117694
Wen, Y., Xiao, J., and Peng, J. (2023). The effects of the “Zero Routine Flaring by 2030” initiative: International comparisons based on generalized synthetic control method. Environ. Impact Assess. Rev. 100, 107095. doi:10.1016/j.eiar.2023.107095
Wu, H., Hao, Y., and Weng, J.-H. (2019). How does energy consumption affect China's urbanization? New evidence from dynamic threshold panel models. Energy Policy 127, 24–38. doi:10.1016/j.enpol.2018.11.057
Xu, A., Zhu, Y., and Wang, W. (2023). Micro green technology innovation effects of green finance pilot policy—from the perspectives of action points and green value. J. Bus. Res. 159, 113724. doi:10.1016/j.jbusres.2023.113724
Yu, H., Zhao, Y., Qiao, G., and Ahmad, M. (2023). Can green financial reform policies promote enterprise development? Empirical evidence from China. Sustainability 15 (3), 2692. doi:10.3390/su15032692
Zhang, A., Wang, S., and Liu, B. (2022). How to control air pollution with economic means? Exploration of China's green finance policy. J. Clean. Prod. 353, 131664. doi:10.1016/j.jclepro.2022.131664
Zhang, H., and Chen, Z. (2023). Financial reform and haze pollution: A quasi-natural experiment of the financial reform pilot zones in China. J. Environ. Manag. 330, 117196. doi:10.1016/j.jenvman.2022.117196
Zhang, H., Wang, Y., Li, R., Si, H., and Liu, W. (2023). Can green finance promote urban green development? Evidence from green finance reform and innovation pilot zone in China. Environ. Sci. Pollut. Res. Int. 30 (5), 12041–12058. doi:10.1007/s11356-022-22886-0
Keywords: green finance policy, synthetic control method, energy consumption structure, reform, innovation, China
Citation: Cui G, Mao H, Dong X, Shao L and Wang M (2023) Will green financial policy influence energy consumption structure? Evidence from pilot zones for green finance reform and innovation in China. Front. Environ. Sci. 11:1216110. doi: 10.3389/fenvs.2023.1216110
Received: 09 May 2023; Accepted: 12 July 2023;
Published: 26 July 2023.
Edited by:
Faik Bilgili, Erciyes University, TürkiyeReviewed by:
Matheus Koengkan, University of Aveiro, PortugalMofakhar Hussain, University of Toronto, Canada
Tatiana Danescu, George Emil Palade University of Medicine, Pharmacy, Sciences and Technology of Târgu Mureş, Romania
Copyright © 2023 Cui, Mao, Dong, Shao and Wang. This is an open-access article distributed under the terms of the Creative Commons Attribution License (CC BY). The use, distribution or reproduction in other forums is permitted, provided the original author(s) and the copyright owner(s) are credited and that the original publication in this journal is cited, in accordance with accepted academic practice. No use, distribution or reproduction is permitted which does not comply with these terms.
*Correspondence: Lin Shao, c2hhb2xpbndlaWhhaUAxNjMuY29t