
95% of researchers rate our articles as excellent or good
Learn more about the work of our research integrity team to safeguard the quality of each article we publish.
Find out more
REVIEW article
Front. Environ. Sci. , 29 August 2023
Sec. Drylands
Volume 11 - 2023 | https://doi.org/10.3389/fenvs.2023.1215890
This article is part of the Research Topic Wind-Blown Sand and Water Sediment Processes and Disaster Control Strategies in Cold and Arid Regions View all 6 articles
 Xiangying Luo1,2
 Jinrong Li2*
 Guodong Tang2Yingkun Li1,2Ru Wang1,2Zhaoen Han1,2Jiaxin Feng1Tingjie Ren1
This study investigates the impacts of height (H) and porosity (P) on the structural properties of wind-driven sand flux in vertical sunflower straw sand-obstacles. We conducted an experiment on sand transport within barriers of various configurations within a 1 m proximity to the surface. In tandem, we monitored wind velocity and direction within the barriers, analyzed total sand transport rate, sand-blocking effects, and cumulative sediment transport rate heights for various parameter configurations, and devised a best sand transport flux model for use within the sand-obstacle. The efficacy of vertical sunflower stalk sand-obstacles in mitigating sand movement has been demonstrated to fall within the range of 37.26%–92.31%. This study reveals a significant correlation between barrier height and porosity in achieving this effect (p < 0.05). High and densely configured sand-obstacles lead to an accumulation of intercepted sand material in front of the front row of the sand-obstacle. In contrast, low and sparsely arranged sand-obstacles exhibit a delayed state of sand material accumulation. Furthermore, with an increase in the height of the obstacle and a decrease in porosity, there is a diminishing trend in the sand transport rate within the obstacle. Concurrently, the height of sand transport within the barrier exhibits an upward trend. A three-parameter exponential function has been employed to more precisely simulate the wind-sand flow structure characteristics within a 1-m height range of the barrier. These research findings contribute to an enhanced understanding of the impact of different vertical sand-obstacle configurations on near-surface wind-driven sand transport patterns in active desert areas. Moreover, they furnish both theoretical underpinnings and practical guidance for the scientific configuration of vertical sand-obstacles.
Influenced by harsh climatic conditions, including drought, high temperatures, windy weather, and minimal precipitation, the Ulan Buh Desert has become a hotspot for intensive sand movement. The region, a significant sediment source for the Ningxia-Inner Mongolia Reach of the Yellow River (LI et al., 2016), adversely impacts local ecology and commerce. Moreover, the Ulan Buh Desert forms a crucial part of the agro-pastoral interlacing zone in the middle reaches of the Yellow River (WANG and CHUN, 2022). Nestled within the Hetao Plain, this area, with its ample sunlight and effective irrigation and drainage systems, serves as an ideal environment for agricultural production. The research area, situated within an agricultural region abundant with crops, especially sunflower and maize, yields plentiful straw resources (HE, 2001). However, these resources often remain underutilized, with farmers discarding these “crop wastes” or using them for fuel, contributing to resource wastage and environmental pollution. Research reveals that crop straws, particularly sunflower straws, rich in pectin and cellulose, enhance the resilience and longevity of sand-obstacles (ZHAO et al., 2011). Utilizing straw to create sand-obstacles can reduce pollution from burning and achieve the purposes of waste recycling, controlling sand-laden wind, and fertilizing soil; it is, therefore, an ideal raw material for sand-obstacle construction.
Straw sand-obstacles have seen wide application in Chinese desert areas (DONG, 2005) and present promising development prospects (CHANG et al., 2000; Qiu et al., 2004; Zhang et al., 2016; LU, 2020). Recent studies show that straw sand-obstacles can modify the spatial structure of the underlying surface and increase near-surface roughness. This approach subsequently provides significant protective effects. (HAN Xueying et al., 2021). The protective efficacy of sand-obstacles made from different crop straws, such as reeds, sunflowers, and corn, will exhibit variations (WANG et al., 2013). Similarly, disparities in protective effects may also arise from differing structural types and configurations (Rui et al., 2010; LIU et al., 2016). Despite extensive research on straw sand-obstacles, their impact on near-surface sand transport characteristics under different barrier heights and porosity configurations remains less explored (CHANG et al., 2000; Qiu et al., 2004; Rui et al., 2010; WANG et al., 2013; LIU et al., 2016; Zhang et al., 2016; LU, 2020; HAN Xueying et al., 2021). Prior studies suggest that a two-parameter exponential function can represent the wind-blown sand flow structure within straw sand-obstacles (Rui et al., 2010; WANG et al., 2013; LIU et al., 2016; Zhang et al., 2016; HAN Xueying et al., 2021). Existing research indicates that the dual-parameter exponential function can most accurately represent the structure of wind-borne sand flow near surface of quicksand area (KANG et al., 2017). The presence of a barrier can alter wind energy, particle size distribution, creeping, saltation, and suspended sand transport content, consequently modifying the wind-blown sand flow structure through the barrier (ZHANG et al., 2002; ZHOU et al., 2014; Liu and Bo, 2019). Therefore, to more precisely characterize the sand transport patterns and wind-borne sand flow structures within vertical straw sand-obstacles, further exploration of the sand flux model is warranted.
This study aims to explore the wind-blown sand transport and surface erosion/deposition characteristics within differently configured vertical sunflower straw sand-obstacles (i.e., barrier height—H, porosity—P), composed of sunflower straw, a prevalent agricultural waste in the region. The paper elucidates the mechanism underlying the effects of height and porosity of vertical sunflower stalk band-shaped sand-obstacles on the patterns of near-surface sand transport. It also establishes the optimal sand transport flux models within the structure of sand-laden wind in the barriers. The purpose is to unveil the patterns of near-surface sand material movement within differently configured vertical sunflower stalk sand-obstacles. This research aims to provide theoretical support and practical guidance for regional sand prevention and control engineering measures, realizing a win-win situation between agricultural waste resource utilization and desertification control.
The study site is located on the northeastern fringes of the Ulan Buh Desert, approximately 21 km upstream of the reservoir area on the left bank of the Sanshenggong Conservancy Hub of the Yellow River. More precisely, it is within the Liuguai Shatou Wind-blown Sand Observatory (40°14′12″, 106°50′25″) in the Alashan Left Banner of the Alashan League, a part of the Inner Mongolia Autonomous Region, as depicted in Figure 1. The area experiences a mid-temperate continental monsoon climate characterized by abundant heat and scarce rainfall, with an average annual temperature of 7°C–8°C and precipitation of approximately 140.3 mm. The region experiences an annual evaporation of 2,380.6 mm and receives about 3,200 h of sunlight per year. The local sand-laden wind velocity typically ranges between 5 m/s and 10 m/s (Figure 2), with an average wind velocity of 4.8 m/s and more than 200 instances of wind velocity surpassing 5 m/s annually. Apart from July and October, the dominant wind direction for the rest of the year is from the west, northwest, and southwest (Figure 2). During spring and winter, when sand movement is potent, the wind direction is primarily from the west and northwest (Figure 2). The average number of windy days per year ranges from 10 to 32 days, while the average number of sand-laden wind days is between 75 and 79 days. The terrain is predominantly characterized by a chain of crescent-shaped sand dunes oriented northwest-southeast.
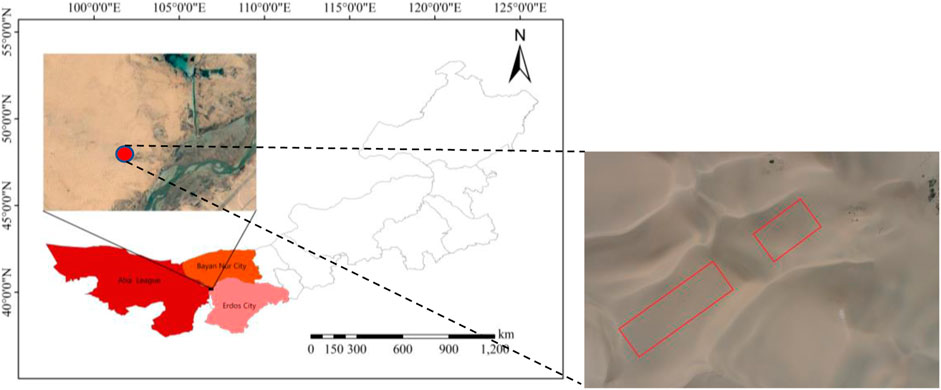
FIGURE 1. Diagram illustrating the research area location.
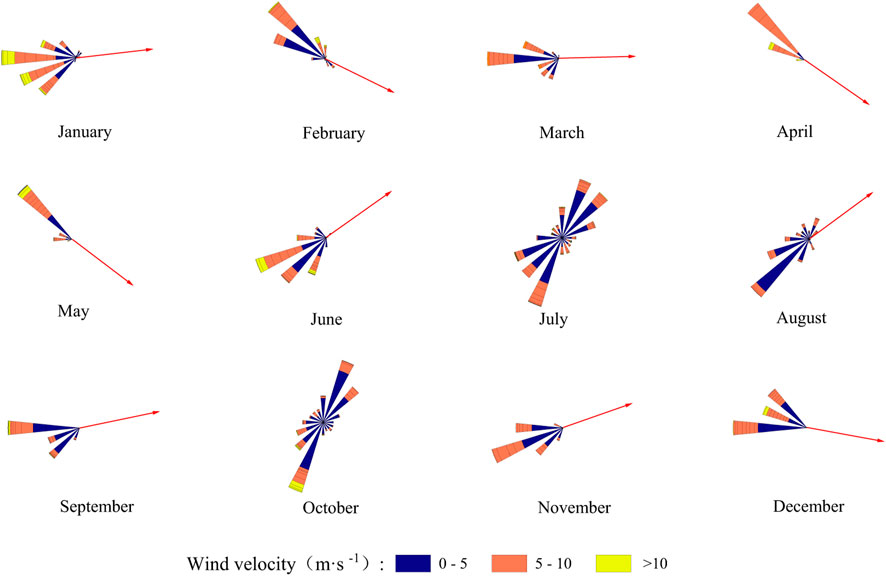
FIGURE 2. Monthly wind velocity and direction in the research area for 2021.
The processed sunflower stalks were arranged according to the combined configurations of barrier height and porosity, resulting in a total of 9 configurations of vertical sunflower stalk sand-obstacles (Table 1). The sunflower straw sand-obstacles were positioned on the mid-slope of the sand dunes according to these configuration parameters (Figure 1). Moreover, during the deployment of vertical belt-shaped sand-obstacles, the direction of deployment was perpendicular to the prevailing wind direction, with each configuration deployed over six rows, each 6 m long (Figure 3). As depicted in Figure 3, a shallow gully was initially dug in the ground to insert the prepared sunflower straw. An engineering line was then used to ensure a consistent height from the ground at each sample site, adjusted as necessary. Finally, the gully was filled with sand.
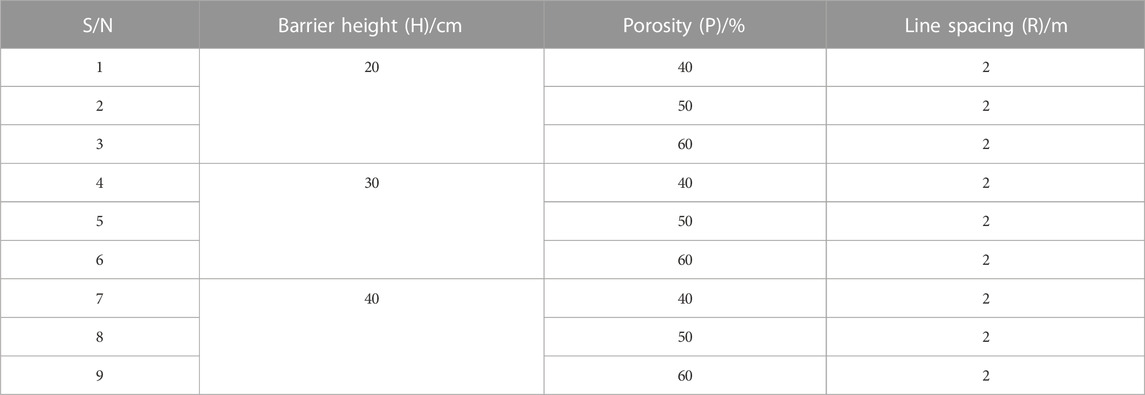
TABLE 1. Configuration parameters of sand-obstacles.
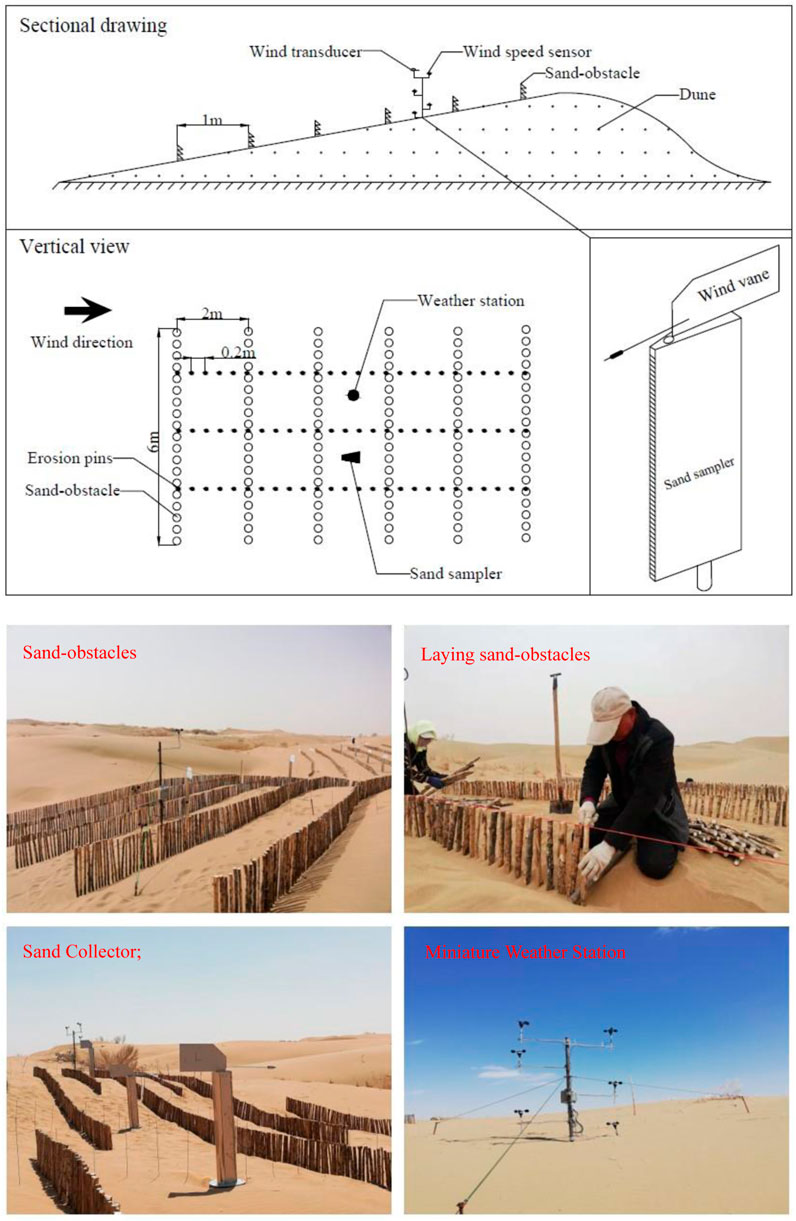
FIGURE 3. Experimental layout diagram.
As shown in Figure 4, field wind-blown sand observations were conducted in April 2021, coinciding with the local season of intense sand activity. Three wind events were recorded, with average wind speeds of 6.4 m/s, 7.3 m/s, and 9.7 m/s. The observed wind speeds fell within the 5 m/s-10 m/s range, which is typical for sand-laden winds in the region, ensuring the timeliness of the observation results.
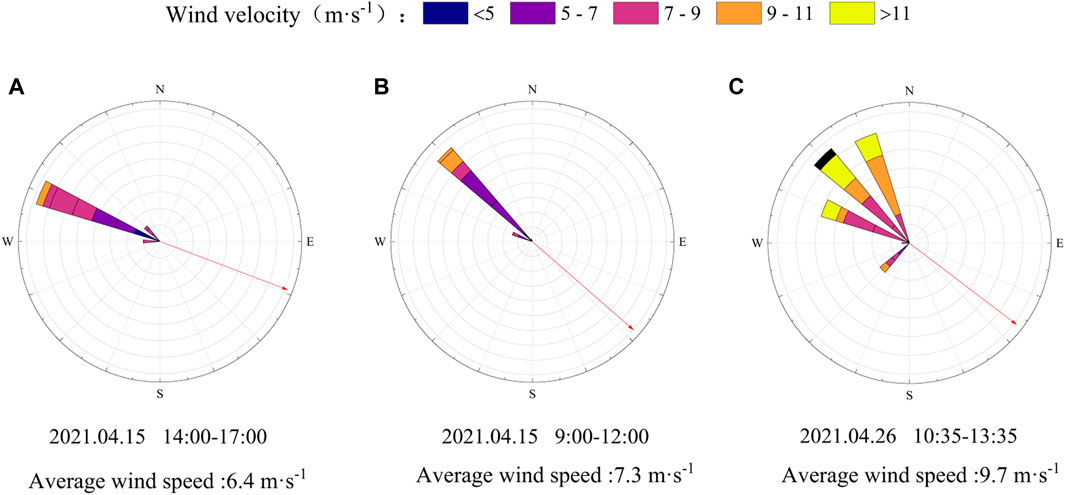
FIGURE 4. Wind velocity and direction during the observation period. (A): Wind speed 6.4 m/s, (B): Wind speed 7.3 m/s, (C): Wind speed 9.7 m/s.
A small weather station was deployed in the center of the observation site. Wind speed sensors were placed at four different heights (0.2, 0.5, 1, 2 m) around the weather station, and a wind direction sensor was set at a height of 2 m. Wind speed data was recorded every 20 s, and average values were logged every 5 minutes by the data collector, with the total observation duration being 3 h.
Vertical rotating sand samplers were deployed in the center of both the sand-obstacle and bare dune sites to measure sand transport (Figure 2). Each sand sampler was 100 cm tall, contained 50 gathering sand boxes vertically arranged, with each sand entrance measuring 2 cm × 2 cm. Based on wind speed during the observation period, the observation time was set to 3 h to prevent the collected sand material from reaching or exceeding the capacity of the gathering sand boxes. After the observation period, the sand material collected in each gathering sand box was sealed in bags and taken back to the laboratory for stratified weighing using a 0.01 g electronic scale.
Erosion/deposition measurements were conducted using the array insertion rod method. As shown in Figure 3, the measuring rods were made of steel wire and were 100 cm in length. The rods were inserted perpendicularly into the ground, leaving 50 cm exposed above and below the surface. Within the sand-obstacle plot, three columns and 51 rows were arranged with a spacing of 100 cm between columns and 20 cm between rows. For the bare sand plot, three columns and 26 rows were arranged with a spacing of 100 cm between columns and 40 cm between rows.
The sand transport rate is defined as the total amount of sand transported per unit of time by each layer of the sand trap within the wind-blown sand sampler (ZHOU et al., 2014). This metric is often used to determine the activity level of wind-blown sand movement during sand observations (WANG et al., 2008). The formula for its calculation is as follows:
Wherein:
The sand prevention effect serves as a widely acknowledged indicator of the protective efficacy of sand-obstacles (MENG et al., 2014). It quantifies the percentage reduction in sand transport within the barrier compared to that of bare sand. The formula is as follows:
Wherein:
Cumulative sediment transport rate height refers to the height range representing a specific proportion of the sand transport rate to the total sand transport rate. For instance, a 50% cumulative sediment transport rate height is the altitude at which the sand transport rate attains 50% of the total sand transport rate. This index reflects the cumulative variation characteristics of the sand transport amount within the sand-laden wind structure, and is commonly used to measure changes in the sand-laden wind structure (WANG et al., 2008). In this study, four cumulative sediment transport rate heights, namely, 50%, 70%, 80%, and 90%, were selected as evaluation indicators.
Sand transport fluxs characterizes the distribution of sand content per unit of time and per unit of area at different heights within a vertical height of 1 m above the ground. in wind-blown sand flow structures remains a point of ongoing discussion within the research community. Widely utilized fitting functions to accurately depict near-surface wind-blown sand flow structures include the two-parameter exponential function (Eq. 3), the three-parameter exponential function (Eq. 4), the two-parameter power function (Eq. 5), and the two-parameter modified power function (Eq. 6) (Ellis et al., 2009; LIU et al., 2014; Lu et al., 2016; TANG et al., 2021).
Wherein:
In this research, the measured data of wind-blown sand flow structures were individually fitted to the aforementioned functions. A fitting correlation coefficient R2 less than 80% signaled an unsuccessful fitting (MENG et al., 2014). The Akaike Information Criterion (AIC) was used to assess the fitting performance of each function. A lower AIC value indicates superior model fitting (YAN et al., 2022). It is calculated as follows:
Wherein:
Quantifying the depth and intensity of surface erosion and deposition serves as a standard method for determining erosion parameters (WEI et al., 2023). The calculation formulas are as follows:
Wherein:
As illustrated in Figure 5, the sand transport rates in bare sand and sand-obstacles ranged from 0.15 to 0.77 g/(cm2·min) and 0.02–0.47 g/(cm2·min), respectively, at desert wind velocities of 6.4 m/s to 9.7 m/s. The sand-obstacles markedly reduced near-surface sand transport, ranging from 38.68% to 92.31%. Additionally, the sand transport rates in both bare sand and sand-obstacles elevated with the increase in wind velocity. Notably, variation was observed in the sand transport rate within each sand-obstacle.
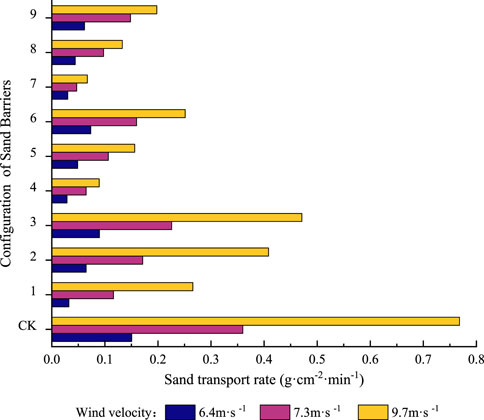
FIGURE 5. Variability of the sand transport rate with sand-obstacle Configuration at different wind velocities.
As shown in Figure 6, with 40% porosity as the baseline, an increase in porosity by 1.25 times results in an average sand transport rate increase of 28.57%. An increase in porosity by 1.5 times leads to an average sand transport rate increase of 57.14%. Significant differences exist in sand transport rates with different porosities (p < 0.05). It is evident that as porosity increases, the sand transport rate will multiply.
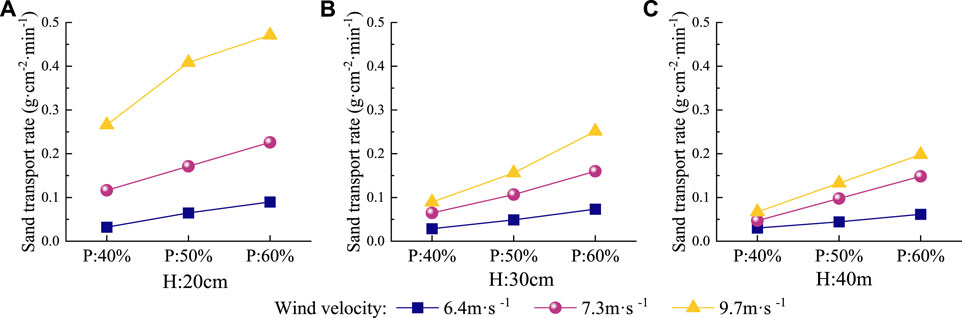
FIGURE 6. Variability of the sand transport rate with porosity at different wind velocities. (A): Barrier Height 20 cm, (B): Barrier Height 30 cm, and (C): Barrier Height 40 cm.
As illustrated in Figure 7, with a baseline height of 20 cm, a 1.5-fold increase in barrier height leads to an average reduction in sand transport rate of 47.82%. A twofold increase in barrier height results in an average reduction of 52.17%. There are significant differences in sand transport rates between 20 cm barriers and 30 cm and 40 cm barriers (p < 0.05). This indicates that when the barrier height increases to 30 cm or above, the reduction in sand transport rate becomes more gradual.
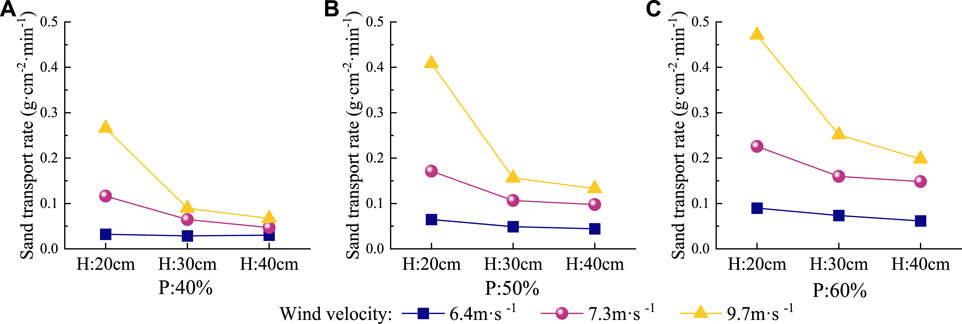
FIGURE 7. Variability of the sand transport rate with barrier height at different wind velocities. (A): 40% Porosity, (B): 50% Porosity, and (C): 60% Porosity.
To clarify the relationship between sand particle concentration and height within different sand-obstacles at various wind speeds, an analysis was conducted on the cumulative sediment transport rate height at 50%, 70%, 80%, and 90% with changes in wind speed and sand-obstacle configuration. The results are showcased in Figure 8. The sand flow due to wind on the underlying surface of bare sand is predominantly surface transport, with 90% of the sand transport occurring within a height range of 0–10 cm across all wind velocities. Moreover, as desert wind velocity increases, the height of sand transport.
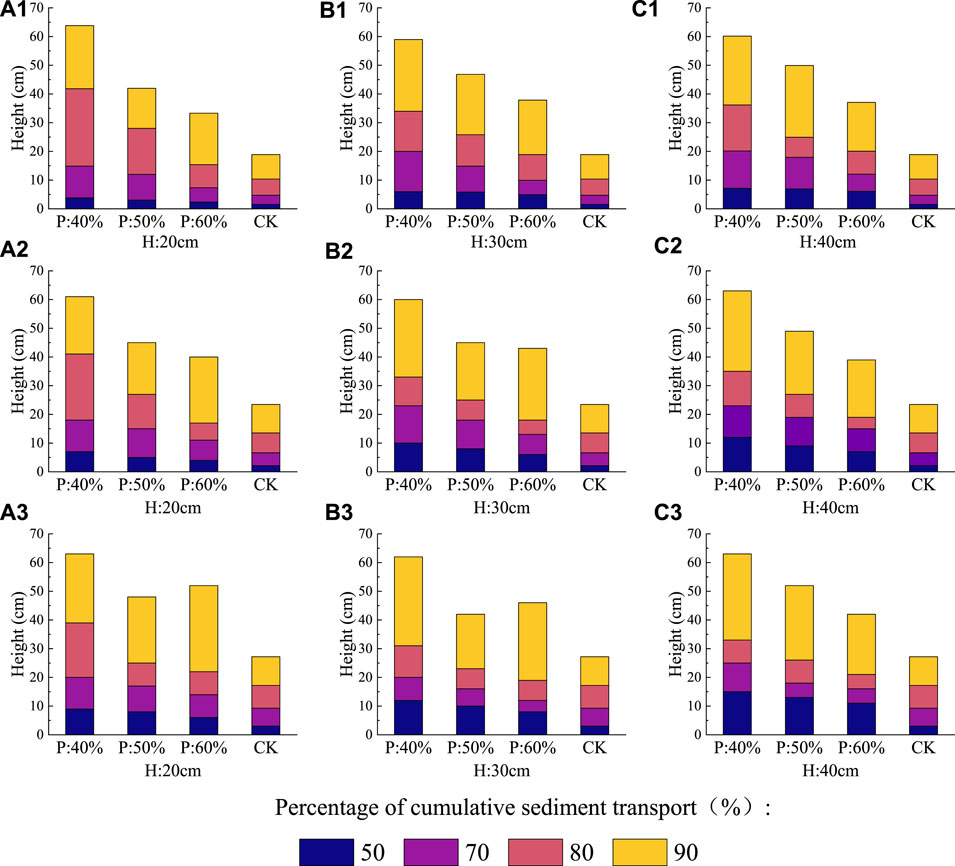
FIGURE 8. Graphical representation of the cumulative sediment transport rate with respect to height for each sand-obstacle configuration. (A): Barrier Height 20 cm, (B): Barrier Height 30 cm, and (C): Barrier Height 40 cm. Notes: Figures 8A1–C1: 6.4 m/s wind velocity; Figures 8A2–C2: 7.3 m/s wind velocity; Figures 8A3–C3: 9.7 m/s wind velocity.
With an increase in the height of the sand-obstacle, both 50% and 70% Cumulative sediment transport rate heights exhibit an upward trend (p < 0.05), whereas the 80% and 90% Cumulative sediment transport rate heights reveal no noticeable change (p > 0.1). As the porosity increases, the heights of 50%, 70%, 80%, and 90% Cumulative sediment transport rate all demonstrate a declining trend, with highly significant differences in the 50% and 70% levels (p < 0.01), significant differences at 80% (p < 0.05), and no significant differences at 90% (p > 0.05). As the wind speed escalates from 6.3 m/s to 9.7 m/s, the 50% and 70% Cumulative sediment transport rate heights rise respectively, with the 50% increase more pronounced, from 2.34 to 7.14 cm to 6.34–14.88 cm, while the 80% levels decline from 16.14 to 36.00 cm to 13.00–33.00 cm. Consequently, when the sand-obstacle is configured to be higher and denser, near-surface sand material exhibits a stronger tendency to move upward within the 70%, and this upward trend becomes more conspicuous as the wind speed increases.
To study the optimal sand transport flux model within 1 m near the surface under the interference of a sand-obstacle on flowing sand dunes, we applied dual-parameter exponential functions, triple-parameter exponential functions, dual-parameter power functions, and dual-parameter modified power functions to fit the sand flux in nine sand-obstacle plots under three different wind speeds. These are detailed in Figure 9. As Table 2 indicates, out of 108 fitting attempts, eight were unsuccessful. The two-parameter exponential function encountered the highest failure rate, whereas the three-parameter exponential function experienced the least. In terms of fitting correlation (R2), all four functions provided good fits, with the three-parameter exponential function demonstrating the best fit. According to the AIC values, the three-parameter exponential function deviates least from the true value and is significantly smaller than the other three fitted models. Consequently, the three-parameter exponential function is the most accurate model for wind and sand flux within a 1 m height. For instance, we used the three-parameter exponential function to analyze the sand transport flux characteristics of various sand-obstacle configurations.
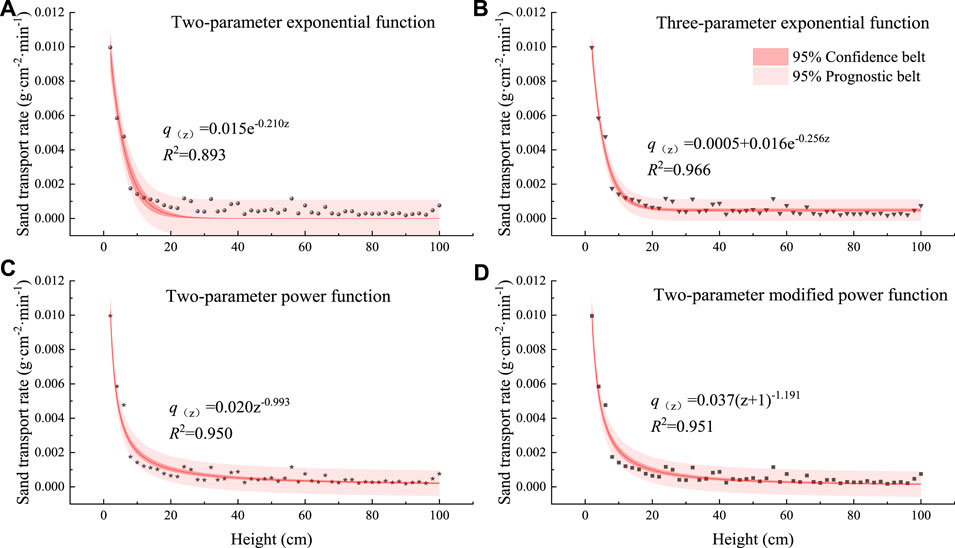
FIGURE 9. Four function fits for the wind-blown sand flow structure within the H20 cm-P40% configuration sand-obstacle under 6.4 m/s wind velocity. (A): Two-parameter exponential function, (B): Three-parameter exponential function, (C): Two-parameter power function, (D): Two-parameter modified power function.
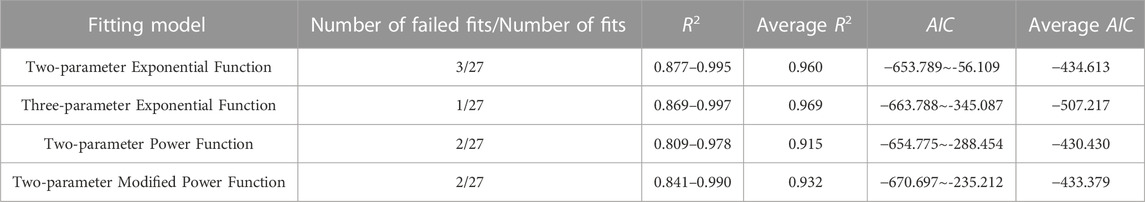
TABLE 2. Results of the sand transport rate fitting for four functional models.
The coefficient a characterizes the Creeping sediment transport rate within the sand-laden flow (SHI et al., 2020; YAN et al., 2022; WEI et al., 2023). As shown in Tables 3, 4, it was found that an average increase rate in a values of 107% and 235% for a 1.25-fold and 1.5-fold increase in porosity, respectively. As porosity increased, the a value rose exponentially. In contrast, the average decrease rate in a values was 53% and 61%; the average decrease rate exhibited a 1.5-fold and 2-fold increase in barrier height, respectively. The a value displayed an insignificant downward trend with increasing barrier height. These results suggest that changes in the creeping sand transport rate are more pronounced with porosity than barrier height, indicating that porosity has the most significant effect on the creeping sand transport rate. At wind velocities of 7.3 m/s and 9.7 m/s, the increase rate in creeping sand transport rates between sand-obstacles with different porosities tends to rise with increasing barrier height. This suggests that the difference in creeping sand transport rates within sand-obstacles of varying porosity becomes more significant as barrier height increases when wind velocity is higher.
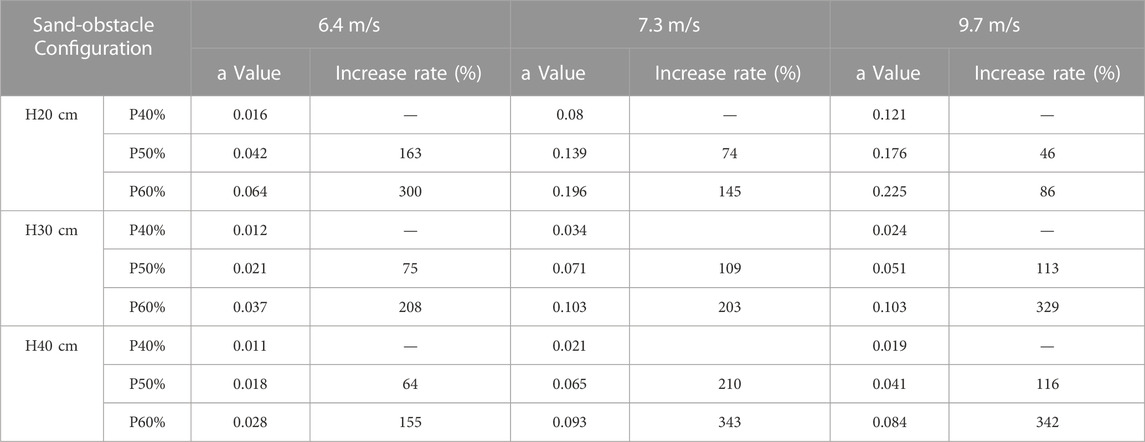
TABLE 3. Variation of the a coefficient with porosity at various wind velocities.
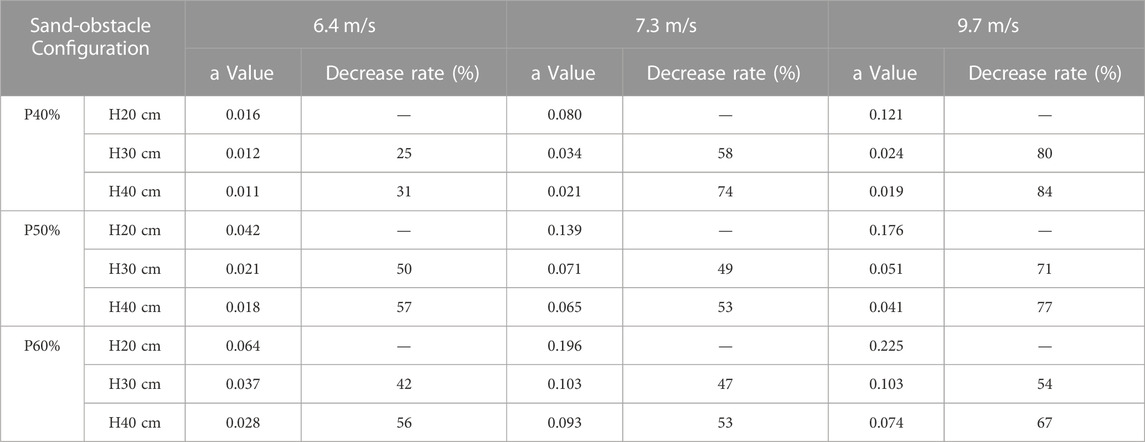
TABLE 4. Variation of the a coefficient with barrier height at various wind velocities.
The b coefficient is commonly used to illustrate the attenuation rate of sand concentration with height. Smaller b values suggest slower attenuation, while larger b values indicate faster attenuation (SHI et al., 2020; YAN et al., 2022; WEI et al., 2023). As shown in Tables 5, 6, a 1.25-fold and 1.5-fold increase in porosity resulted in an average increase in b values by 14% and 22%, respectively. Conversely, a 1.5-fold and 2-fold increase in barrier height led to an average decrease in b values by 25% and 33%, respectively. These findings suggest that the attenuation rate is more affected by barrier height than porosity.
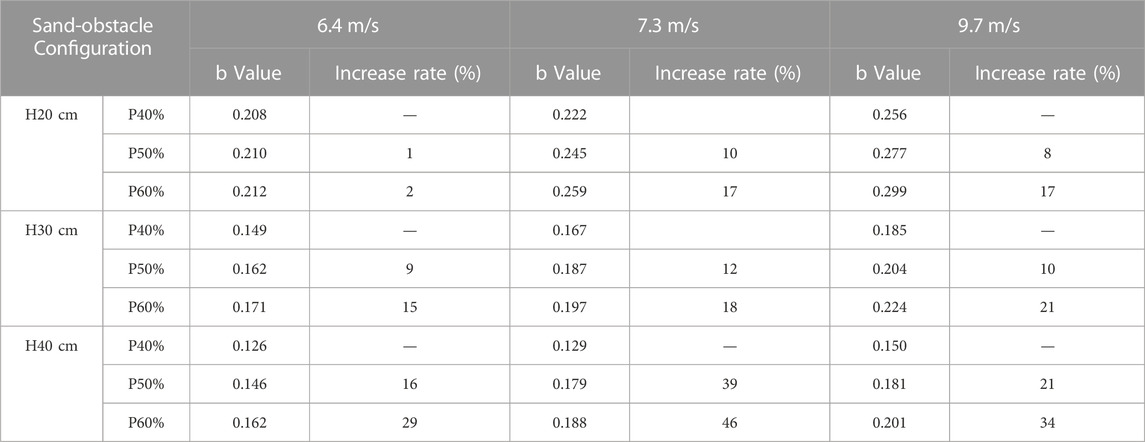
TABLE 5. Variation of the b Coefficient with Porosity at Various Wind Velocities.

TABLE 6. Variation of the b-coefficient with barrier height at various wind velocities.
In summary, the coefficients a and b tend to decrease with increasing barrier height and decreasing porosity, while they generally increase with escalating wind velocity. We observed that with an increase in barrier height and density, the quantity of creeping sand transported within the barrier diminishes. Simultaneously, the attenuation rate of the wind-blown sand flow structure reduces. On the other hand, as the barrier configuration becomes lower and sparser, the amount of creeping sand transport within the barrier escalates, the attenuation rate increases, and sand transportation shifts towards the ground layer. These observations align with the results discussed earlier.
Figure 10 illustrates the observed erosion and deposition patterns in both the bare sand dune and the sand-obstacle samples with varying configurations. The patterns of erosion and deposition within different sand-obstacle configurations remain consistent across wind velocities of 6.4 m/s, 7.3 m/s, and 9.7 m/s. For the purposes of this study, the patterns at a wind velocity of 7.3 m/s were chosen for analysis. At different wind velocities, the bare sand dunes exhibit surface wind erosion (as depicted in Figures 10A1–A3), with the depth of erosion amplifying with increased wind velocity. Correspondingly, the intensity of wind erosion escalates with stronger wind velocity. In contrast, the sand-obstacles show a pattern of accumulation between barriers and erosion along their lower edges. However, the overall erosion/deposition pattern within the sand-obstacle tends to be in an accumulation state (Figures 10B1–B9).
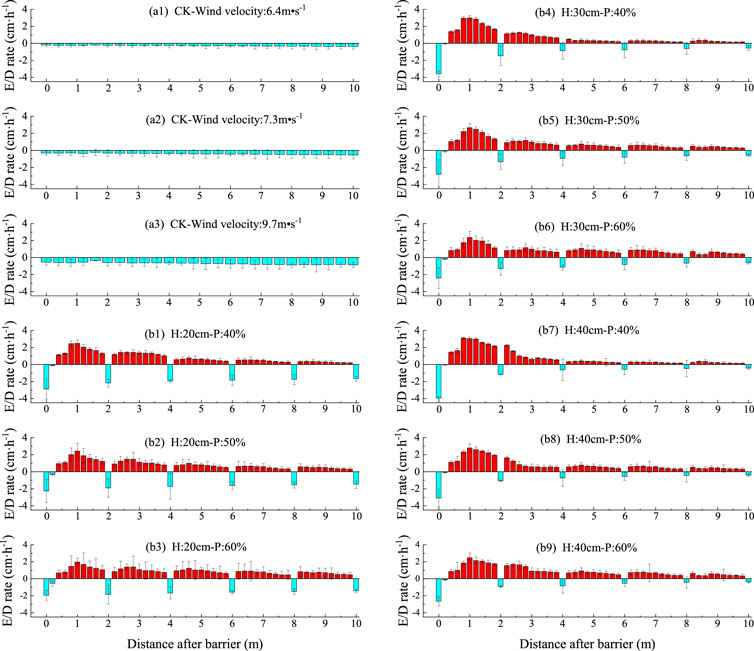
FIGURE 10. Variations in erosion and deposition patterns with sand-obstacle configurations. (A1–A3): The CK sample plots were under 6.4 m/s, 7.3 m/s, and 9.7 m/s wind speeds, respectively; (B1–B3): The sand barrier configurations were H20 cm-P40%, H20 cm-P0%, and H20 cm-P60%; (B4–B6): The sand barrier configurations were H30 cm-P40%, H30 cm-P0%, and H30 cm-P60%. P60%; (B7–B9):The sand barrier configurations are H40 cm-P40%, H40 cm-P0%, H40 cm-P60%, respectively.
In the sand-obstacle plot, the most pronounced accumulation occurs between the first and second rows of sand-obstacles, with accumulation decreasing as distance from the first row increases. Wind erosion predominantly takes place beneath the sand-obstacle, along its lower edge. This phenomenon is most noticeable along the lower edge of the first row of sand-obstacles and decreases in intensity further into the barrier. Sand-obstacles with different configurations exhibit varying blocking effects, resulting in distinct patterns of erosion and deposition. Analysis of variance (ANOVA) reveals a statistically significant difference in the depth of sand accumulation between the first and second rows of sand-obstacles with heights of 30 cm and 40 cm, as well as between the third and fourth rows (p < 0.005). Likewise, a significant difference is observed within the 40% porosity sand-obstacle (p < 0.005). However, no significant differences were detected in other sand-obstacles. Prior research has demonstrated that sand-carrying airflow is influenced by drag forces when it navigates through a sparsely permeable sand-obstacle (KANG et al., 2015). The magnitude of these forces inversely correlates with the barrier’s permeability, which is a crucial determinant of the size and strength of the eddies forming on the barrier’s downwind side (HAN Qingjie et al., 2021). The drag force exerted by a sand-obstacle directly correlates with the obstructed surface area, which expands with higher barrier heights. As the obstructed airflow converges with the upper airflow, the overall flow velocity reduces, causing the sand particles in the wind-blown sand flow to settle near the surface, forming a sand accumulation (LeeParkPark, 2002). Notably, sand material’s accumulation position generally relies not merely on the obstacle but within a certain range behind it. This is due to the generation of vortices near the obstacle, causing a certain degree of wind erosion (ZHANG et al., 2016). Moreover, the maximum distance of sand accumulation behind the barrier increases with the barrier’s increasing porosity (ZHANG et al., 2020).
Consequently, it can be inferred that the barrier height and porosity substantially influence the location and morphology of sand accumulation within a sand-obstacle. Sand-obstacles with a height of 30 cm and 40 cm, as well as a 20 cm barrier with a 40% porosity configuration, are effective in intercepting transiting sand transport within the first three rows of sand-obstacles at the barrier sample’s leading edge (Figures 10B1–B9). However, a lower and sparser sand-obstacle intercepts less sand, and the remaining sand material continues to accumulate behind. In contrast, sand-obstacles of 30 cm and 40 cm heights show stronger sand interception effects, causing undercutting at the lower edge of the barriers’ first row.
Wind-blown sand movement, a process involving the movement of air and solid particles near the surface, alternates between the initiation of transport and accumulation. Moreover, this movement pattern is intimately connected to the characteristics of wind-blown sand flow near the surface. In scenarios of high airflow and robust kinetic energy, the wind and sand flow tend towards an unsaturated state, resulting in wind erosion. Conversely, an accumulation state is observed (WANG et al., 2014). The vertical sunflower straw sand-obstacle, as a permeable structure, allows a part of the wind-blown sand flow to pass directly through gaps, while the rest is attenuated by reduced kinetic energy upon barrier interaction. Consequently, eddy currents form in front of the barrier, causing most sand material to deposit there, with only a small fraction crossing over the top (Dong et al., 2003; Dong et al., 2010; Rui et al., 2010). Previous studies report that up to 90% of sand transport in the sand drift region concentrates within a height of 20 cm (Dong and Qian, 2006; Dong et al., 2011; Zhou et al., 2016). However, our findings indicate that the 90% cumulative sediment transport rate height for all nine sand-obstacle configurations exceeds 20 cm. Moreover, a significant correlation (p < 0.05) is found between the 50% and 70% cumulative sediment transport rate height and both barrier height and porosity. Our results suggest that taller and denser sand-obstacles are more effective in enhancing the 50% and 70% cumulative sediment transport rate heights. The sand-obstacle significantly obstructs sand transport (p < 0.05) within its zone at a height of 0–12 cm compared to bare sand dunes (Table 7). Furthermore, as the distance from the ground increases, the sand blocking effects decline, in other words, the lower layer of the sand-obstacle blocks more sand transport, enhancing the relative distribution height of the sand material content. The obstruction by the sand-obstacle causes changes in the sand-laden wind in the sandy area, producing significant interference with the wind-sand flow structure. Thus, it can be asserted that the presence of sand-obstacles in the sand drift region significantly alters the wind-blown sand flow structure. The sand transport fluxes at different heights are redistributed, the relative content of creeping sand material decreases, and the content of saltation and suspended sand material increases 6–9]. Meanwhile, Dong (Dong et al., 2002; Dong et al., 2006) proposed that the increase in Saltation and Suspended sand material will cause the structure of the sand-laden wind to trend toward a three-parameter exponential function rule. This is consistent with the results of the near-surface wind-sand flow structure within 100 cm of the obstacle in this paper, adhering to a three-parameter exponential function distribution, and the fit improves when the barrier disturbance is more pronounced, that is, when the barrier height is higher and the porosity is lower.
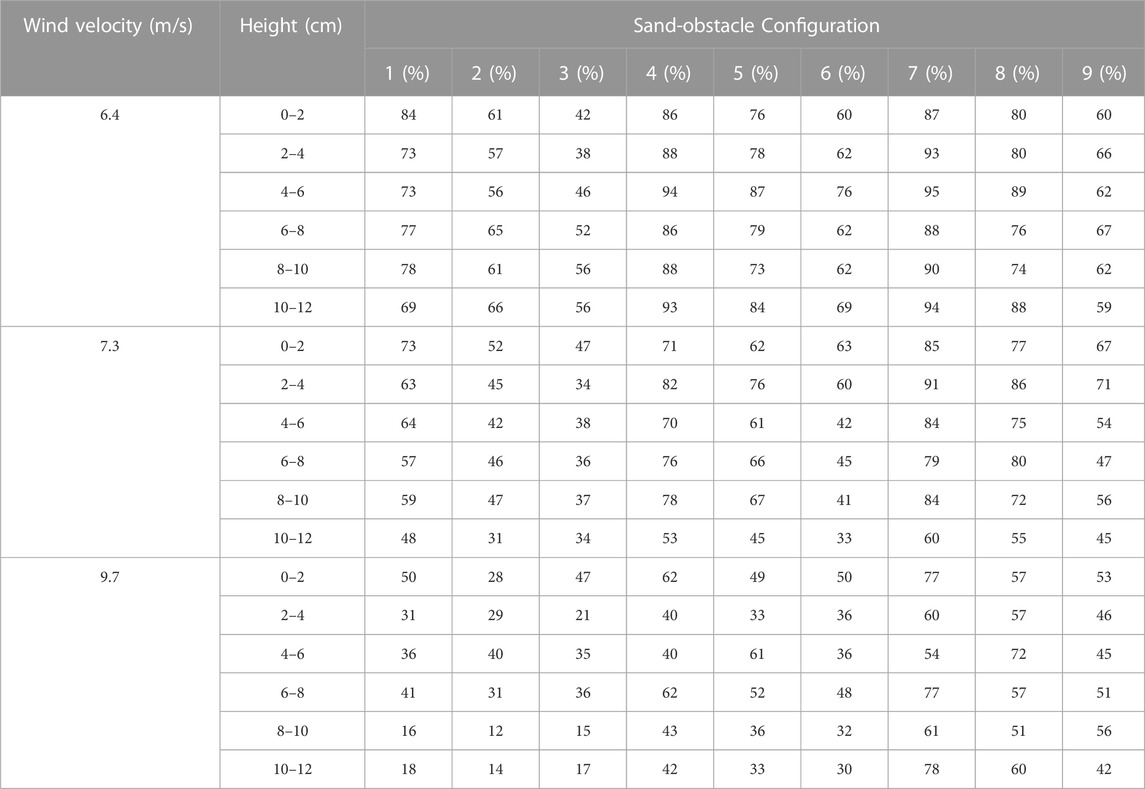
TABLE 7. Sand prevention effect at different heights above ground level within variously configured sand-obstacles.
The coefficients a and b in the three-parameter exponential function utilized in this study are intimately connected to the porosity and barrier height. When the sand-obstacle is configured higher and denser, more sand material transported through creeping will be intercepted. Consequently, the 50% and 70% cumulative sediment transport rate heights will show an upward trend, causing the sand particle concentration’s attenuation degree to slow down with height variation. The characterization of the attenuation rate in the three-parameter exponential function will present a decreasing trend, aligning with previous research findings (Duran and Herrmann, 2006). As illustrated, the creeping sand transport rate and attenuation rate in the wind-blown sand flow structure can elucidate the basic characteristics of sand transport flux at varying heights near the surface within differently configured sand-obstacles (WANG et al., 2018; Wen et al., 2022).
Table 7 demonstrates that sand-obstacles with varying configurations display sand prevention efficiencies ranging from 37.26% to 92.31%. These barriers effectively intercept near-surface sand transport and demonstrate promising performance in sand control. An increase in sand-obstacle height and a decrease in porosity augment resistance to near-surface sand transport, resulting in greater sediment deposition before the barrier. These results align with previous research (WANG et al., 2008; Rui et al., 2010; WANG et al., 2013; MENG et al., 2014; LIU et al., 2016). This study identified a significant difference in the sand transport rate within a 20 cm barrier as compared to 30 cm and 40 cm barriers. This can be attributed to the fact that the majority of the mass transport of leaping sand is distributed within a height range of 0–20 cm (Ni et al., 2003; Jiang et al., 2014). When the barrier height is set at 20 cm, some sand material still manages to cross the barrier due to the influence of updrafts. However, a 30 cm barrier height approaches the height threshold for sand transport by leapfrogging, which significantly reduces the mass of sand material crossing the barrier. As a result, the difference in the sand transport rate within 30 cm and 40 cm barriers is not significant. Regression analysis results (Table 8) show that within the 0–8 cm height range, porosity has a more substantial impact on the sand prevention effect than barrier height. However, within the 8–12 cm height range (or higher), it can be seen that barrier height has a more pronounced influence on the wind-blown sand flow than porosity. This suggests that in desert areas, barrier height plays a more significant role in controlling wind-blown sand flow compared to porosity. In this study, the minimum height of the sand-obstacle is set at 20 cm, where the bottom layer of 0–8 cm is dominated by the impact of porosity on sand transport, while the effect of barrier height within the 8–12 cm range (or higher) on sand transport is more pronounced. This is the main reason why porosity impacts the creeping sand transport rate more within the wind-blown sand flow structure of the sand-obstacle, while barrier height affects the attenuation rate more.
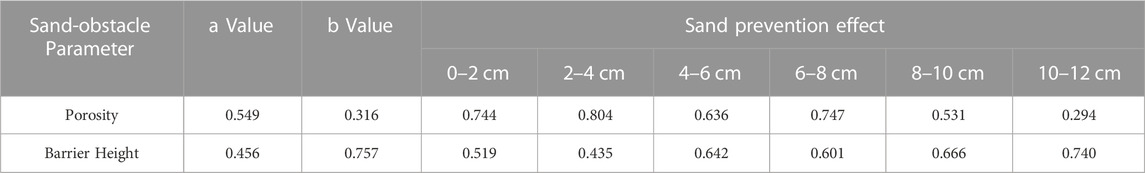
TABLE 8. Absolute value of the standardized regression coefficient of barrier height and porosity in the regression equation.
This study performed real-time observations on nine sand-obstacle configurations established in the wind-blown sand observation field in the eastern sand drift region of the Ulan Buh Desert under various wind conditions. The analysis indicated that different sand-obstacles exert varying degrees of interception on surface sand transport, and the wind-blown sand flow structure inside the barriers is influenced by the sand-obstacle configuration. The key findings are as follows:
(1) The sand transport rate significantly varies with porosity (p < 0.05). As porosity increases, the sand transport rate multiplies. A notable difference in sand transport rate is observed between a 20 cm barrier height and 30 cm, 40 cm barrier heights (p < 0.05). As the barrier height increases, the sand transport rate decreases, and the rate of this decrease slows down when the barrier height exceeds 30 cm.
(2) Sand-obstacles made of vertically aligned sunflower stalks, under different configurations, can achieve sand prevention effects ranging from 37.26% to 92.31%, effectively intercepting sand material. High and dense barriers lead to accumulation of intercepted sand material in front of the barrier, while low and sparse barriers result in a lagged accumulation distance for the sand material.
(3) With the increase in barrier height and the decrease in porosity, the sand transport height within the barrier exhibits an upward trend. Conversely, the opposite is true. The three-parameter exponential function can fittingly represent the change in the sand transport rate within a 1 m height range inside the sand-obstacle, achieving a correlation coefficient (R2) of 0.869–0.997 and an AIC of −663.788∼-345.087. (HE et al., 2012).
Writing—review, editing, conceptualization, methodology, validation, formal analysis, investigation data curation, visualization, writing—original draft preparation, and project administration, XL; Visualization, conceptualization and methodology, JL, GT, YL, RW, and ZH. JF and TR participate in the discussion and revision of papers during the post-production revision process. All authors contributed to the article and approved the submitted version.
This work is supported by the Science and Technology Program Project of Inner Mongolia Autonomous Region (2020GG0125).
Thanks to the authors and related institutions for their help.
The authors declare that the research was conducted in the absence of any commercial or financial relationships that could be construed as a potential conflict of interest.
All claims expressed in this article are solely those of the authors and do not necessarily represent those of their affiliated organizations, or those of the publisher, the editors and the reviewers. Any product that may be evaluated in this article, or claim that may be made by its manufacturer, is not guaranteed or endorsed by the publisher.
Chang, Z., Zhong, S., and Han, F. (2000). Investigation on the reasonable spacing of clay and wheat straw sand-obstacles. J. Desert Res. 4, 111–113. doi:10.1016/j.still.2008.02.005
Dong, Z. B., Wang, H. T., Liu, X. P., Li, F., and Zhao, A. (2002). Velocity profile of a sand cloud blowing over a gravel surface. Geomorphology 45 (3), 277–289. doi:10.1016/s0169-555x(01)00159-3
Dong, Z., Liu, X., Wang, H., and Zhao, A. (2003). The flux profile of a blowing sand cloud: a wind tunnel investigation. Geomorphology 49 (3), 219–230. doi:10.1016/s0169-555x(02)00170-8
Dong, Z., Lu, J., Man, D., Lv, P., Qian, G., and Zhang, Z. (2011). Equations for the near-surface mass flux density profile of wind-blown sediments: flux profile of wind-blown sediments. Earth Surf. Process. Landforms 36, 1292–1299. doi:10.1002/esp.2151
Dong, Z., Man, D., Luo, W., Qian, G., Wang, J., and Zhao, M. (2010). Horizontal aeolian sediment flux in the Minqin area, a major source of Chinese dust storms. Geomorphology 116 (1-2), 58–66. doi:10.1016/j.geomorph.2009.10.008
Dong, Z., Qian, G., Luo, W., and Wang, H. (2006). Analysis of the mass flux profiles of an aeolian saltating cloud. J. Geophys. Res. 111, D16111. doi:10.1029/2005jd006630
Dong, Z., and Qian, G. Q. (2006). Characterizing the height profile of the flux of wind-eroded sediment. Environ. Geol. 51, 835–845. doi:10.1007/s00254-006-0363-5
Dong, Zhibao (2005). Fifty years of physical research on wind-blown sand in china. (I). J. Desert Res. 3, 293–305. doi:10.1191/0309133304pp416ra
Duran, O., and Herrmann, H. J. (2006). Vegetation against dune mobility. Phys. Rev. Lett. 97 (18), 188001. doi:10.1103/physrevlett.97.188001
Ellis, J. T., Li, B., Farrell, E. J., and Sherman, D. (2009). Protocols for characterizing aeolian mass-flux profiles. Aeolian Res. 1 (1-2), 19–26. doi:10.1016/j.aeolia.2009.02.001
Han, Q., Caiyuan, H. A. O., Zhang, H., Qu, J., and Zhou, F. (2021b). Characteristics of windbreak efficiency and sand deposition amount in typical sand control engineering areas along the linhe-hami railway. J. Desert Res. 41 (1), 37–46. doi:10.7522/j.issn.1000-694X.2020.00117
Han, X., Wang, T., and Yang, W. (2021a). Research progress and hotspot analysis of sand-obstacle in china: quantitative analysis of mapping based on vosviewer and citespace. J. Desert Res. 41 (2), 153–163. doi:10.7522/j.issn.1000-694X.2020.00117
He, J., Guo, J., and Xing, E. (2012). Structure of wind-blown sand flow and law of dune movement along the ulan buh desert section of the yellow river. Trans. Chin. Soc. Agric. Eng. 28 (17), 71–77.
Jiang, H. T., Guo, C. R., Xing Hai, C., Sun, S. S., Xie, Y. H., and Liu, J. X. (2014). The wind-sand flux structure of grassland on the northern foot of yinshan mountain. Appl. Mech. Mater. 3590 (668-669), 1530–1537. doi:10.4028/www.scientific.net/amm.668-669.1530
Kang, X., Li, S., Wang, H., Ma, X., and Lei, J. (2015). Comparison of sand accumulation morphology of nylon sand-obstacles with different combinations and spacing. Arid. Land Geogr. 38 (2), 283–291.
Kang, Y., He, Q., and Yang, X. (2017). Study on the migration and creep movement characteristics of wind-blown sand flow observed in the field. J. Arid Land Resour. Environ. 31 (5), 119–125. doi:10.13448/j.cnki.jalre.2017.154
LeeParkPark, S. J. K. C. C. W. (2002). Wind tunnel observations about the shelter effect of porous fences on the sand particle movements. Atmos. Environ. 36 (9), 1453–1463. doi:10.1016/s1352-2310(01)00578-7
Li, Y., Peng, W., Ren, L., and Li, Y. (2016). Evolution of braided river channels in the ulan buh desert reaches of the yellow river over the past 50 years. J. Desert Res. 36 (6), 1689–1694. doi:10.7522/j.issn.1000-694X.2016.00175
Liu, F., Yuguang, H. A. O., and Xin, Z. (2014). The characteristics of surface wind-blown sand flow structure in the northeastern margin of the ulan buh desert. J. Desert Res. 34 (5), 1200–1207. doi:10.7522/j.issn.1000-694X.2014.00096
Liu, L., and Bo, T. L. (2019). A study on the initiation of saltation in the model of wind-blown sand transport considering the effect of turbulence. Granul. Matter 21 (3), 1–15. doi:10.1007/s10035-019-0934-2
Liu, S., Zhan, K., and Fang, E. (2016). Suppression methods and windbreak and sand-shifting control effects of e grass-based high vertical sunflower straw sand-obstacles. Res. Soil Water Conversat. 23 (6), 98–101. doi:10.1007/s12665-016-5361-7
Lu, L. (2020). A Study On Windbreak And Sand-Shifting Control Effects Of Fence-Type Sunflower And Corn Straw Sand-Obstacles Inner Mongolia. Uttar Pradesh, India: Agricultural University. doi:10.27229/d.cnki.gnmnu.2020.001020
Lu, P., Dong, Z., and Ma, X. (2016). Aeolian sand transport above three desert surfaces in northern china with different characteristics (shifting sand, straw checkerboard, and gravel): field observations. Environ. Earth Sci. 75 (7), 577. doi:10.1007/s12665-016-5361-7
Meng, Z., Ren, X., and Gao, Y. (2014). Windbreak and sand-shifting control of semi-hidden salix mongolica sand-obstacles. Bull. Soil Water Conservation 34 (3), 4. doi:10.13961/j.cnki.stbctb.2014.03.034
Ni, R., Li, Z. S., and Mendoza, C. (2003). Vertical profiles of aeolian sand mass flux. Geomorphology 49 (3), 205–218. doi:10.1016/s0169-555x(02)00169-1
Qiu, G. Y., Lee, I. B., Shimizu, H., Gao, Y., and Ding, G. (2004). Principles of sand dune fixation with straw checkerboard technology and its effects on the environment. J. Arid Environ. 56 (3), 449–464. doi:10.1016/s0140-1963(03)00066-1
Rui, M. A., Wang, J., and Qu, J. (2010). Study on the windbreak and sand-shifting control effects of cotton straw sand-obstacles with different structural types. J. Soil Water Conservation 24 (2), 48–51. doi:10.13870/j.cnki.stbcxb.2010.02.002
Shi, T., Meng, Z., and Cui, X., (2020). The windbreak and sand-shifting control effects of reed sand-obstacles in the photovoltaic power station in the kubuqi desert. Bull. Soil Water Conservation 40 (5), 166–171. doi:10.13961/j.cnki.stbctb.2020.05.025
Tang, G., Meng, Z., and Gao, Y. (2021). Interference effect of photovoltaic arrays on near-surface wind-blown sand transport in desert area. Trans. Chin. Soc. Agric. Eng. 37 (13), 101–110. doi:10.11975/j.issn.1002-6819.2021.13.012
Wang, C., Li, S., Lei, J., Mao, D., and Zhou, J. (2014). Response of near-surface wind-blown sand flow structure to different underlying surfaces in the transitional zone. J. Soil Water Conservation 28 (3), 52–56+71. doi:10.13870/j.cnki.stbcxb.2014.03.010
Wang, N., and Chun, X. (2022). Research progress on environmental evolution of the ulan Buh desert in the late quaternary. J. Desert Res. 42 (1), 175–183. doi:10.7522/j.issn.1000-694X.2021.00180
Wang, Q., Zuo, H., and Li, G. (2018). Windbreak and sand-shifting control effects of Pennisetum sinese stubble sand-obstacles and its suitable mode. Arid Zone Res. 35 (5), 1234–1241. doi:10.13866/j.azr.2018.05.29
Wang, W., Dang, X., and Zhang, J. (2013). Study on the sand prevention effect of different crop straw flat sand-obstacles on the northern edge of the kubuqi desert: A quantitative analysis. J. Desert Res. 33 (1), 65–71. doi:10.1080/22797254.2020.1736953
Wang, X., Ding, G., and Gao, H. (2008). Research on the windbreak and sand-shifting control effects of belt-shaped salix mongolica sand-obstacles. J. Soil Water Conservation 22 (2), 42–46. doi:10.3321/j.issn:1009-2242.2008.02.010
Wei, Y., Xie, Y., Guo, J., Lin, B., and Wang, X. (2023). Surface erosion and deposition characteristics of the protection system in jilantai salt lake. J. Soil Water Conservation 37 (3), 116–123. doi:10.13870/j.cnki.stbcxb.2023.03.016
Wen, M. A., Shi, C., Hu, P., Zhao, T., Zhang, Y., and Liu, Y., (2022). Characteristics of wind-blown sand flow on different underlying surfaces of a typical open-pit coal mine in the arid desert region of northwest china. Trans. Chin. Soc. Agric. Eng. 38 (7), 146–154. doi:10.11975/j.issn.1002-6819.2022.07.016
Yan, M., Zuo, H., Jia, G., and Cheng, X. I. (2022). The vertical differentiation characteristics of wind-blown sand flow and sand-carrying particle size under different sand prevention measures. Arid. Land Geogr. 45 (5), 1513–1522. doi:10.12118/j.issn.1000-6060.2021.580
Zhang, C., Chen, X., and Jianlin, X. U. (2016a). A numerical porous media modeling of the basic polyporous unit of windbreak barriers constructed on bridges. J. Railw. Sci. Eng. 18. doi:10.3969/j.issn.1672-7029.2016.01.018
Zhang, H., Li, F., and Zhang, T. (2002). Structure and variation characteristics of wind-blown sand flow on different underlying surfaces in the Khorchin desert. J. Soil Water Conservation 16 (2), 5. doi:10.3321/j.issn:1009-2242.2002.02.006
Zhang, K., Zhao, P., Zhang, X., Wang, Q., and Hao, Y. (2020). A study on the difference of wind-blown sand flow field in the high vertical sand-obstacle of HDPE plate with different wind velocity profiles. J. China Railw. Soc. 42 (9), 143–149. doi:10.3969/j.issn.1001-8360.2020.09.018
Zhang, K., An, Z., Pang, Y., and Cai, D. (2016b). Sand prevention effect of wind-blown sand protection system along the beiluhe section of the qinghai-tibet railway. J. Desert Res. 36 (5), 1216–1222. doi:10.7522/j.issn.1000-694X.2015.00148
Zhao, M., Jiang, M., and Zhou, Z. (2011). Composition analysis of several crop straws. Mater. Rev. 25 (16), 122–125. doi:10.1016/j.wasman.2020.05.018
Zhou, N., Zhang, C., and Tian, J. (2014). Analysis of flow field and sediment deposition characteristics of concave surface of hidden grass grid sand-obstacle. Geogr. Res. 12 (11). doi:10.11821/dlyj201411014
Keywords: barrier height, porosity, sand prevention effect, structure of wind-blown sand flow, erosion and deposition patterns, fitting model
Citation: Luo X, Li J, Tang G, Li Y, Wang R, Han Z, Feng J and Ren T (2023) Interference effect of configuration parameters of vertical sand-obstacles on near-surface sand transport. Front. Environ. Sci. 11:1215890. doi: 10.3389/fenvs.2023.1215890
Received: 02 May 2023; Accepted: 16 August 2023;
Published: 29 August 2023.
Edited by:
Tao Wang, Chinese Academy of Sciences (CAS), ChinaCopyright © 2023 Luo, Li, Tang, Li, Wang, Han, Feng and Ren. This is an open-access article distributed under the terms of the Creative Commons Attribution License (CC BY). The use, distribution or reproduction in other forums is permitted, provided the original author(s) and the copyright owner(s) are credited and that the original publication in this journal is cited, in accordance with accepted academic practice. No use, distribution or reproduction is permitted which does not comply with these terms.
*Correspondence: Jinrong Li, bGlqaW5yb25nOTE4QDEyNi5jb20=
Disclaimer: All claims expressed in this article are solely those of the authors and do not necessarily represent those of their affiliated organizations, or those of the publisher, the editors and the reviewers. Any product that may be evaluated in this article or claim that may be made by its manufacturer is not guaranteed or endorsed by the publisher.
Research integrity at Frontiers
Learn more about the work of our research integrity team to safeguard the quality of each article we publish.