 Jennifer Lyon-Mackie1*
 Prassede Vella2Pamela A. DiBona2Noora Shehab-Sehovic1Samantha B. Roche1Allison I. Kreiley1
 Georgia Mavrommati1
- 1School for the Environment, University of Massachusetts Boston, Boston, MA, United States
- 2Massachusetts Bays National Estuary Partnership, Boston, MA, United States
Deliberative methods to assess ecosystem services values formalize community members’ and stakeholders’ involvement in decision-making related to natural resources management. This paper presents the methodological design and the application of a deliberative multicriteria evaluation (DMCE) method that combines the advantages of deliberation with structured decision-making to assess community-based values of four coastal ecosystem services (valued by indicators such as Total Nitrogen, Blue Carbon, Scallop Landings, Fish Abundance) and explore the spatial variability of group values along the Massachusetts coastline. We implemented four virtual deliberative workshops consisting of stakeholders from four Massachusetts Bays (MassBays) estuarine categorizations to collect quantitative and qualitative data. Quantitative data came from individual survey results and group preferences, while qualitative data were derived through the analysis of video recordings and transcripts of deliberations. Compared to previous studies, we combined quantitative and qualitative data by using applied thematic and co-occurrence analysis to identify themes of discussion during the deliberative process. Our results show that coastal stakeholders place a particular emphasis on access to clean water and services that directly support human wellbeing and provide direct economic benefits. Differences in the quantitative and qualitative results of these deliberative tasks between groups provide insight into the need for localized policymaking instead of solely regional or statewide management. Environmental managers and policymakers will utilize these insights to address local values and priorities as they work towards implementing habitat restoration efforts.
1 Introduction
Understanding nature’s contribution to human wellbeing is essential for designing environmental policies, making informed and legitimate decisions, and transitioning to sustainable pathways of development. Scientists have been using the concept of ecosystem services (ESs) to communicate to stakeholders the direct and indirect benefits that people derive from the environment. The concept of ESs has become widely known since Millennium Ecosystem Assessment (2003) which classifies ESs into four categories: provisioning (e.g., food), regulating (e.g., water purification), cultural (e.g., recreation), and supporting (e.g., biodiversity) (Millenium Ecosystem Assessment, 2003). Assessing the monetary value of ESs remains challenging due to their collective character and the limited knowledge of stakeholders concerning their complex properties (Wegner and Pascual, 2011; Farley, 2012; Parks and Gowdy, 2013).
Responding to these challenges has led to the development of valuation techniques that actively engage stakeholders in decision-making and provide a framework for building their knowledge of socio-ecological systems’ complexity. In particular, deliberative forms of ES valuation have been used consistently in recent decades to ascertain said values and communicate them efficiently to improve policy advice (Guerry et al., 2015; Kenter et al., 2016; Orchard-Webb et al., 2016; Mavrommati et al., 2021).
A deliberative process creates the space for in-depth discussion and effective interaction among participants and may lead to value convergence (Murphy et al., 2017). When first introduced to the deliberative process, participants may have pre-set individual values based on personal experience, knowledge, or morals. Individual values are challenged within the deliberative process and may shift to the so-called shared social values. Previous studies have shown that social learning, improved engagement, and a higher level of interconnectedness among participants that occur within the deliberative process link individual and shared social values (Brymer et al., 2018; Eriksson et al., 2019; Mavrommati et al., 2021).
There are many deliberative valuation techniques to elicit monetary and non-monetary values (Lennox et al., 2011; Wanek et al., 2023). In this study, we used the deliberative multicriteria evaluation method (DMCE) because it 1) combines the advantages of decision theory (structure and transparency) with deliberation to elicit shared social values (collective preferences) that reflect local knowledge and experiences (Proctor and Drechsler, 2006; Kenter et al., 2016) and 2) allows to include in the assessment task ecosystem services that may have different measurement units, provide intangible benefits, and/or cannot be assigned in monetary terms (Belton and Stewart, 2002) The DMCE method provides the appropriate framework to encourage and allow citizens and stakeholders to actively contribute to decision-making, resulting in heightened community involvement and understanding, leading to better outcomes and socially justifiable choices in environmental policy formation and planning (Elliott and Kaufman, 2016). Shared social values usually differ from the aggregate values of the group’s individual members (Mavrommati et., 2021; Murphy et al., 2017).
Utilizing discourse-based methods to explore people’s pluralistic values regarding specific ecosystems services allows for the representation of community members from different professions and personal backgrounds who may not otherwise be involved in formal environmental decision-making (Kenter et al., 2016; Borsuk et al., 2019; Walz et al., 2019). For example, a realtor and a fisherman engaging with the same ecosystem likely utilize and value the services it provides differently; without actively soliciting their opinions and exploring the reasoning behind them through a process such as deliberative valuation, these differences of opinion (or, conversely, points of agreeance) would likely go unrepresented in policymaking.
In the absence of formal valuation exercises, simply naming the services provided by an ecosystem helps increase public recognition and knowledge and, therefore, their recognition in environmental management; deliberative valuation offers benefits beyond simple awareness by utilizing transdisciplinary methods to examine the nuances of complex, interconnected natural systems (Costanza et al., 2017). Failing to consider plural values in managing natural systems may create conflicts resulting in policy outcomes not supported by the involved stakeholders’ (Walker, 2010; Hossu et al., 2018).
Even though there is a growing literature in the field of deliberative valuation, the method’s outputs have not been translated into decision changes as results are often not presented in a format that is useful for policymakers (McKenzie et al., 2014; Posner et al., 2016; Handmaker et al., 2021). Designing valuation research collaboratively with the end-users of the results as well as presenting said results both quantitatively and qualitatively can help to minimize this disconnect (Wyborn et al., 2019). Quantitative data alone is often met with resistance, whether that stems from fears of manipulation or perceived disconnect from real-world situations–qualitative data, particularly that in the form of narratives, provides more useful information to stakeholders and policymakers alike (Handmaker et al., 2021). Contextualizing an issue through discussion of lived experiences yields more personal and tangible results, the preference for which is well documented by science communication literature (Dahlstrom Michael, 2014; Handmaker et al., 2021).
While deliberative processes in an environmental management context have been well studied and documented, and their impact on decision-making processes has been acknowledged, relatively few studies explore ES valuation through the lens of spatial variability (Kenter et al., 2016; Eriksson et al., 2019). Exploring the differences in ES values from the perspective of geographic usage patterns allows for more efficient resource usage and targeted management (Bennett et al., 2015). Understanding variations in how local communities value the benefits received from a given ecosystem allows for restoration or conservation efforts to be implemented first at the locations where a service is most highly valued, resulting in the efficient allocation of scarce resources. Given the multifunctional nature of ecosystems, asking stakeholders to consider the importance of multiple ESs in relation to each other furthers the goal of increased specificity in management decisions (Manning et al., 2018).
This paper aims to explore whether stakeholders’ coastal ESs prioritization differs along the Massachusetts coastline by using quantitative and qualitative data. To address this overarching goal, we employed the DMCE method. We organized three workshops with stakeholders in the study area to evaluate the ESs provided by Eelgrass and Salt Marsh Habitats. This paper addresses the following questions: 1) is there spatial variability in group ESs values across Massachusetts embayments? 2) do deliberative valuation methods offer participants a space for value convergence? 3) in what ways are group ESs values similar or different? Compared to other studies, we used a mixed methods approach to evaluate the role of spatial variability in ES valuation by utilizing pre-established categories of Mass Bays embayments and analyzing the workshop outputs quantitatively and qualitatively.
2 Methods
2.1 Study location
We applied the DMCE method to estuarine assessment areas defined by MassBays in the Estuary Delineation and Assessment 2.0. In addition to delineating Massachusetts coastal estuarine watershed boundaries, this report also identified unique geospatial attributes and classified human usage patterns of said estuaries (Geosyntec, 2017). The MassBays planning area (extending from Salisbury at the New Hampshire border to Provincetown) was spatially delineated using ecosystem-based landward and seaward boundaries. The area was then subdivided into 65 assessment areas, including 44 embayments, based on sub-watersheds. Estuarine habitats in the 44 embayment areas include tidal flats, eelgrass beds, salt marshes, and other estuarine resources. These habitats provide a plethora of ecosystem benefits to both human and natural systems; flora and fauna are provided with the necessities for different stages in their life cycle, while humans experience direct benefits such as access to recreation and economic resources as well as indirect benefits such as pollution filtration and protection from storm surges (Granek et al., 2010).
After delineation, each assessment area was characterized using spatial distribution of resource and stressor attributes. Details of the delineation methodology as well as analyses of datasets are provided in the Estuary Delineation and Assessment Report (Geosyntec, 2017). Coastal Massachusetts has a rich and complex geomorphology, resulting in estuarine and non-estuarine embayments with distinct natural characteristics and anthropogenic conditions. For management purposes, the embayments were classified into four categories based on a subset of resource and stressor attributes (see Supplementary Table S1). Principal component analyses (PCA) and partitioning around medoids (PAM) was used to cluster embayments with similar resource and stressor attribute levels (Nagpal et al., 2013; Jolliffe and Cadima, 2016). The PCA and PAM analyses identified four clusters of embayments labeled categories 1 through 4, as shown in Figure 1 (Hanley, 2021).
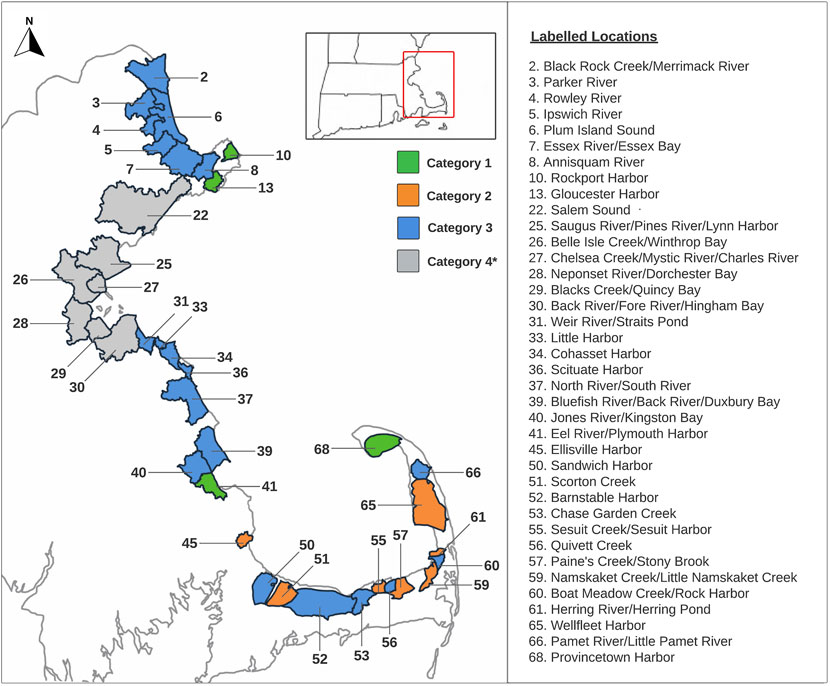
FIGURE 1. MassBays embayment categories map. All labeled and categorized locations are embayments. *Category 4, shown in grey, was not included in the final analyses.
2.2 The swing weighting method
To elicit ES values from participants within the context of DMCE methodology, we employed the “swing” weighting method that is easy for the participants to understand and perform (Keeney and Raiffa, 1993). This method starts from a hypothetical reference alternative where all attributes are set to their worst potential value. Based on this hypothetical reference alternative, other hypothetical alternatives are developed in which one attribute at the time is “swung” to its best possible level. The deliberative processes for each ecosystem within these workshops utilized a set of several hypothetical alternatives formulated using multiattribute value theory (MAVT), which yields weights in an additive multiattribute utility function (Keeney and Raiffa, 1993; Eisenführ et al., 2010; Mavrommati et al., 2021). This method requires only the knowledge of the potential range of values an attribute might take and creates an opportunity for participants to discuss and score the given attributes (Mavrommati et al., 2017).
Tradeoff weights represent the relative importance of the attributes inferred from the participant ratings using the swing weighting method. They show the willingness of groups to compromise on one objective in favor of improvement in another objective. The weights were calculated using the following equation:
where wi are the trade-off weights for each attribute, and si is defined as a contingent rating for the ith choice bundle (Neumann and Morgenstern, 2007).
2.3 Participant recruitment
In our initial pool of potential workshop participants, we identified and included a diverse range of stakeholders based on two criteria: 1) stakeholders’ specific knowledge relevant to the habitats and ESs selected for this study (see Section 2.4 for a detailed description) and 2) stakeholders’ established connection (e.g., livelihood, their position on a council or other local management body, or through their membership in a local indigenous community) to the embayment evaluated. Contacts were identified through internet searches for various titles and a city, town, or location in each category (i.e., “Barnstable Harbormaster”). When reaching out to a body such as a town council or a nonprofit organization, an invitation was extended to nominate a suitable representative. We also used the snowball sampling method, a type of sample recruitment strategy whereby all or a portion of participants who are asked to engage with a study are not directly recruited by the researcher but through other persons who may connect them as potential participants (Reed, 2008; Marcus et al., 2016; Naderifar et al., 2017).
A researcher not familiar with established networks of environmental science professionals conducted outreach procedures to reduce selection bias. In some cases, participants were contacted based on previous relationships with researchers–specifically the recruitment of indigenous peoples. We approached approximately 120 potential participants to participate in one of the four workshops, and 28 agreed to participate. Recruited participants were assigned workshop groups based on their location; all participants in a given workshop were stakeholders residing in the same specific category (for example, participants in the first workshop were all residents of towns within the geographic boundaries of category 1). Table 1 details the groups of stakeholders we aimed to recruit and their perceived potential contribution to the deliberative process. Ideally, the DMCE method requires participants to be identified early in the process with the goal of including them in the study design and attribute selection process; this was not possible due to both the collaborative nature of this work and a lack of resources. While we recruited participants for four workshops as dictated by the four identified embayment categories, we were unsuccessful in recruiting the minimum number of participants to conduct a workshop for category 3.
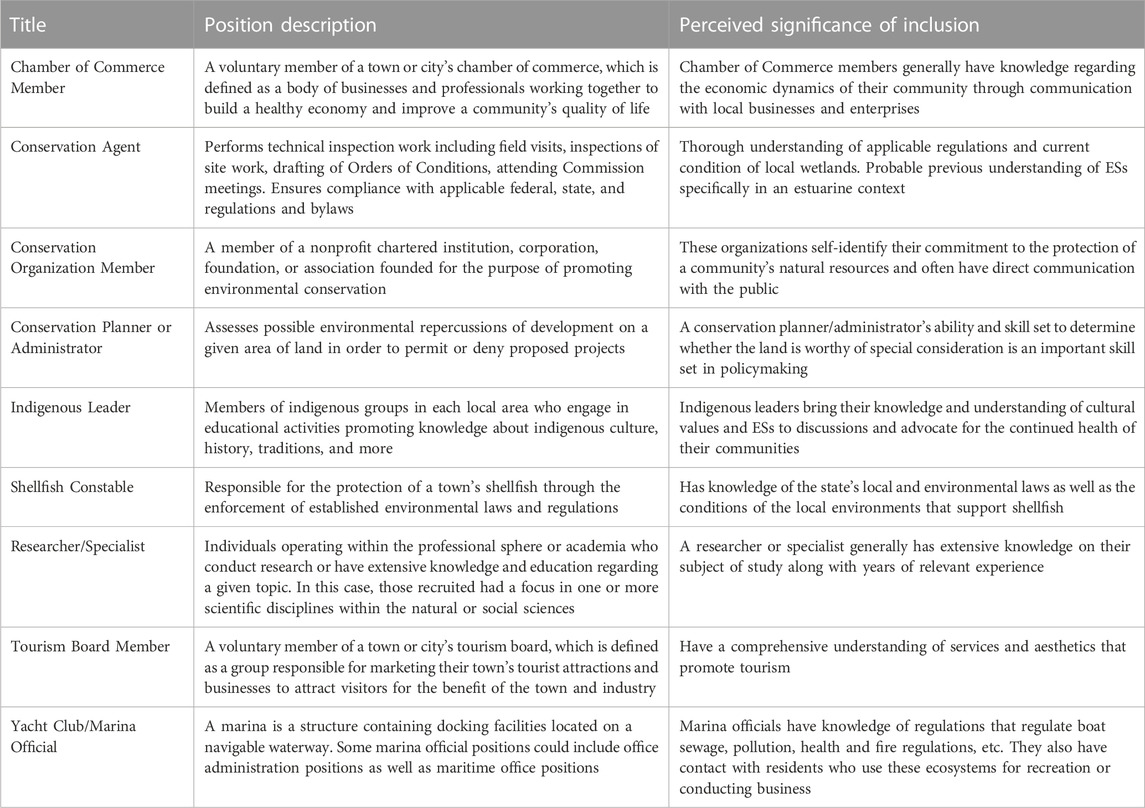
TABLE 1. Stakeholder groups and their perceived value to group deliberations.
2.4 Attribute selection and hypothetical management options
This study focused on two habitats, eelgrass beds, and salt marshes, due to their ecological and socioeconomic significance and the availability of reliable data across all embayments. A diverse group of scientists, e.g., biologists, geologists, ecologists, and ornithologists, was convened for each habitat, and over a series of four meetings discussed ESs provided by the two habitats and how they could be represented in a way that would be easily understandable by workshop participants. The output of these discussions was the identification of four attributes, outlined in Table 2, which were selected based on the applicability to both habitats and the availability of good and reliable data.
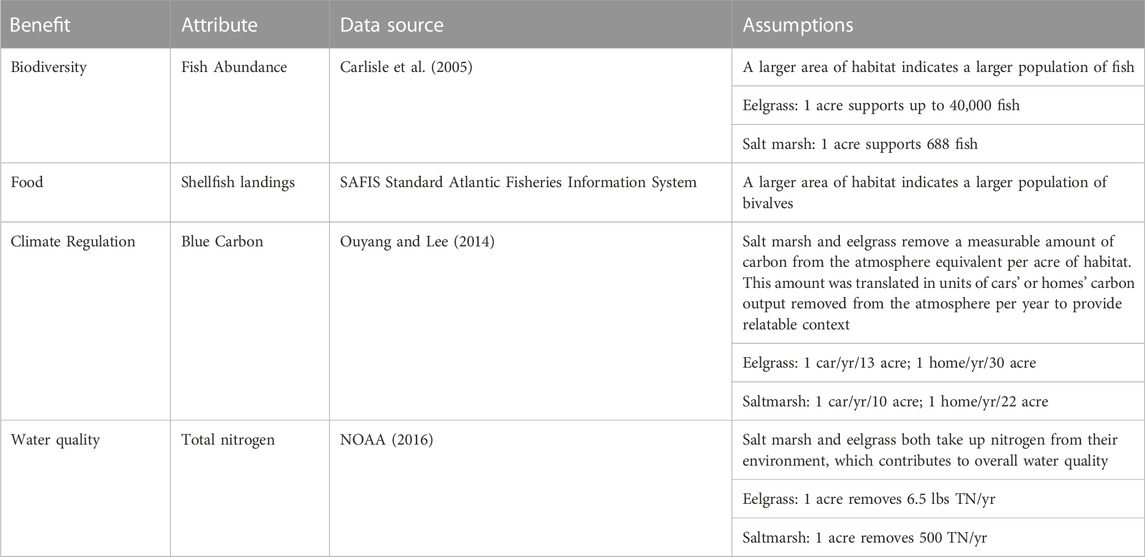
TABLE 2. Sources and assumptions made for each ecosystem attribute.
The best- and worst-case values for each attribute correspond to a range of hypothetical alternative management choices and depend on the cluster of embayments being considered, given that each cluster has its own unique set of stressors and capacity that dictate what management actions are applied to get the best results. Such hypothetical management alternatives included but were not limited to upgrading wastewater treatment facilities, increasing dredging activity to improve navigation channels, and building hardened shorelines to protect against flooding; each identified management alternative had direct, measurable effects on the chosen ecosystem attributes and could be translated into a range of projected future values that formed the basis of the deliberative tasks using the swing method. Similar management alternatives were used to develop each category’s deliberative tasks, but slight variations to reflect the anthropogenic stressors unique to each group of embayments were introduced. Table 3 details the projected values for each attribute within the context of the specific conditions of a given category.
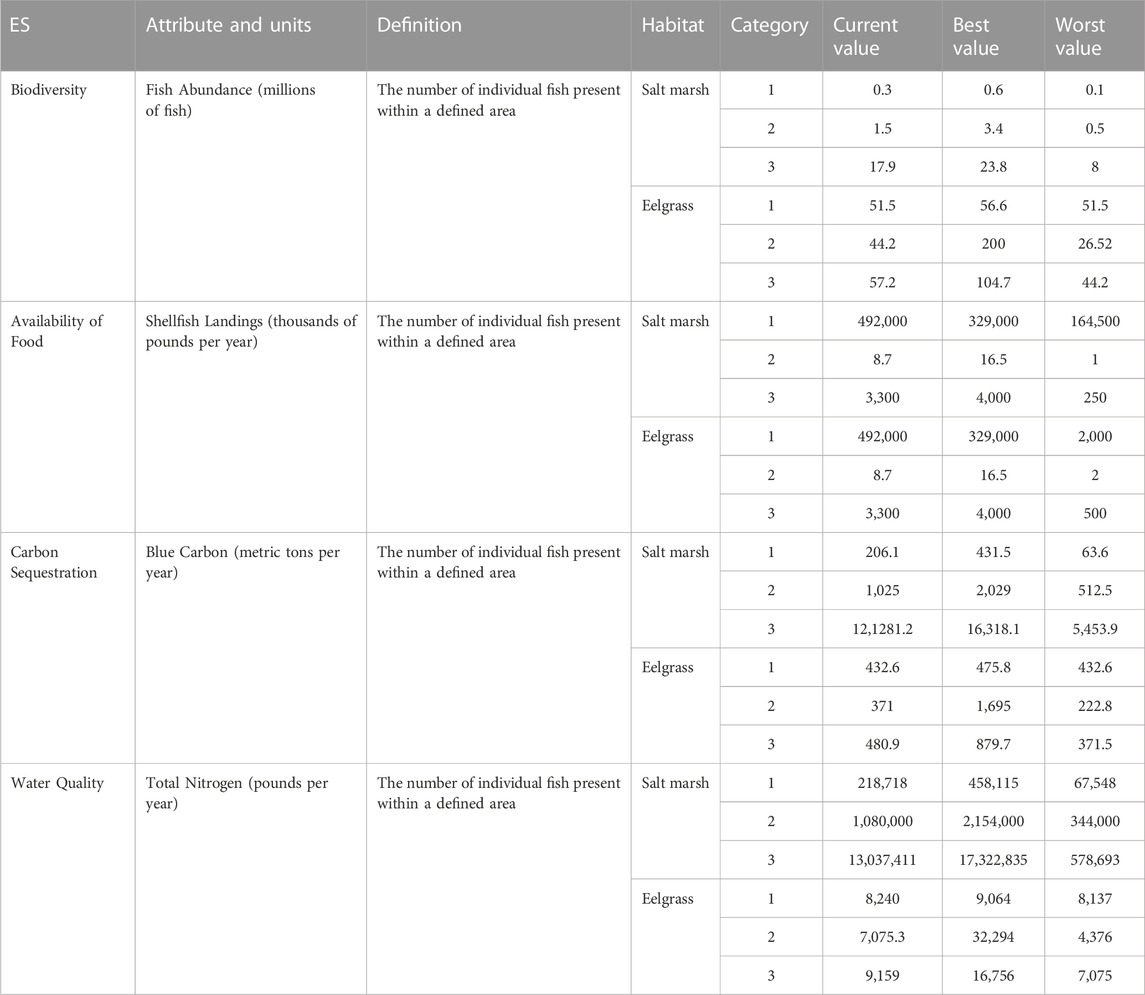
TABLE 3. Definitions of attributes. Metrics were estimated using both historic and current data to project current, best possible, and worst possible values based on a set of hypothetical future choices.
The choice between the alternatives described will depend on several factors, including costs and resource capacity. For example, upgrading an existing wastewater treatment plant (WWTP) and growing shellfish to reduce TN may be less expensive than building a new WWTP. However, using biological methods to reduce nutrients also means that a lot of space must be available, which may not be the case in some embayments.
2.5 Workshop structure
Before the workshop, stakeholders received further information about the workshop logistics and an informational video presentation (see Supplementary Video). This presentation provided information about the location and characteristics of their category, the two habitats that would be discussed, and the four ESs provided by each that would form the basis of the deliberative process.
While many participants were familiar with the ecosystem services in question, we decided to provide all participants with the same basis of knowledge and understanding to hopefully reduce confusion or a lack of understanding during the deliberative process. Particularly important was ensuring a collective understanding of the definition of an ES as this concept formed the basis of all tasks as well as the presentation of the attributes that we used to represent them (Murphy et al., 2017).
Each workshop was conducted over 3 hours on the virtual meeting platform Zoom. We began by introducing the participants to each other and the researchers, moderator, and experts present. A concise version of the video presentation participants viewed before their workshop was presented to refresh their knowledge of the concepts and ESs in question. The assessment tasks followed, starting with the eelgrass ecosystem and ending with the salt marsh ecosystem, with a break in between.
Besides the stakeholders present at each workshop were a moderator, two technical experts, two researchers, and an impartial expert. The role of the moderator was to encourage respectful and productive deliberative discussions as well as keep the group focused on their goal of representing their local communities and promoting the common good (Schaafsma et al., 2018). The moderator refrained from asking any leading questions or inserting her own opinions, instead simply reminding participants of the task at hand when necessary and ensuring our pre-determined timeline was upheld. Our two technical experts were ecologists familiar with the ecosystem dynamics in question. Their role was to answer participant questions during the workshop so deliberation could continue with greater collective understanding. The two researchers were present at all workshops to observe proceedings and assist in virtually conducting the assessment tasks. Lastly, the impartial expert who was the lead researcher of this project assisted in the workshop by correcting misleading information and clarifying any technical questions related to the individual and group assessment tasks. During the tasks, a student researcher used a shared dynamic virtual interface that visualized changes in preferences in real-time during group discussions (Tobin et al., 2020). In addition, we tested our method by running a pretest workshop with MassBays’ regional staff (who regularly work with the stakeholder groups) to ensure that the flow of the workshop is smooth, the information conveying ESs was clear and that the workshop assessment tasks described in Section 2.4 could be performed in a virtual environment.
At the start of the workshop, participants were directed to complete a pre-deliberation survey based on their individual valuation of the ESs. Similar to Murphy et al. (2017), the survey was administered in the form of a questionnaire that asked each participant to numerically rank the relative importance of ESs within the context of each ecosystem. This choice was made based on the recommendations of the pretest workshop participants and the relevant literature (Burk and Nehring, 2022). In particular, we elicited complete swing weights in the individual tasks during the pretest workshop, and participants advised us to use rank order instead because it is an easier and less time-consuming elicitation method. After engaging in the deliberative process, an identical post-deliberation survey was administered to track changes in individual values engendered by group discussions.
2.6 Deliberative task design
We developed the deliberative task using the swing weighting method (Section 2.2). In particular, we presented five decision alternatives for each ecosystem to the workshop participants based on the best and worst values of the attributes. The best and worst values of each attribute correspond to two states of the world that pair a broad range of hypothetical management future choices (Table 2). The overall social value of the ecosystem services provided for various hypothetical management future choices hinges upon the projected attribute levels and the weights assigned by the stakeholders. We used the term ‘decision options’ to communicate the alternatives to participants. Each workshop group was asked to place the five decision options along a meter stick with a scale of 0–100, with 0 being the least preferred decision option and 100 being the most preferred as shown in Figure 2. The reference alternative with all attributes at their worst level was always set to 0. Groups could decide to rank two decision options at the same numerical value if they felt they were equally preferred.
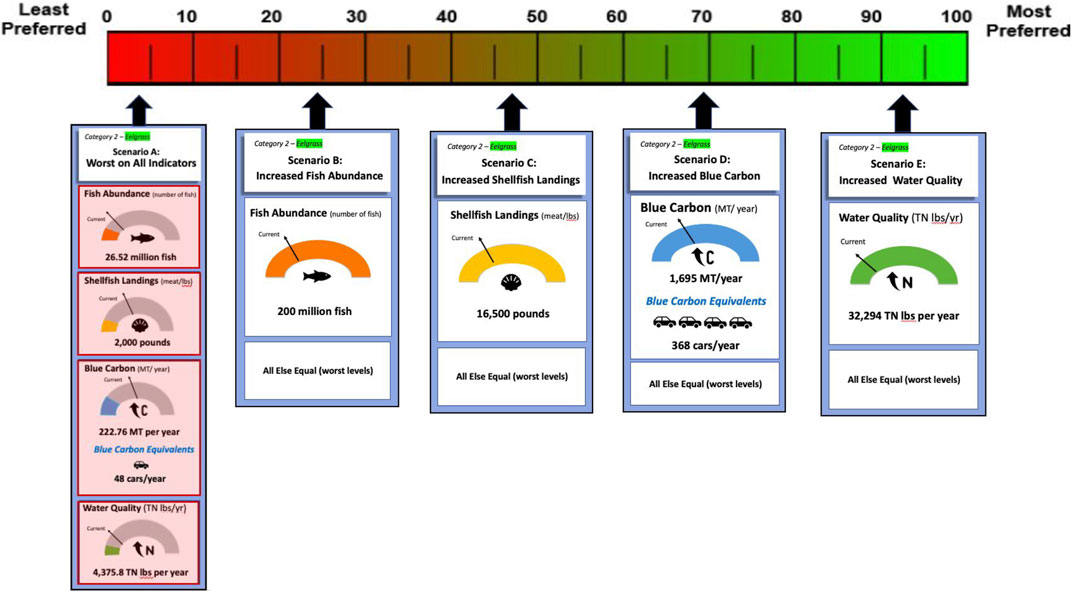
FIGURE 2. Decision option cards used for group assessment tasks. This set of cards was formulated for Group 2’s eelgrass habitat assessment task; each group was presented with two unique sets of cards, one set each for the salt marsh and eelgrass habitats, based on data collected by various sources found in Table 2.
Deliberations began with each stakeholder voicing their initial rankings of the decision options at the moderator’s request. Once all stakeholders had voiced their opinions, a moderated debate ensued, during which time participants attempted to come to a consensus regarding how they would rank the four decision options. Participants were encouraged to consider alternative viewpoints, ask questions if they did not understand a particular concept or perspective, and consider how their group rankings reflected their overarching goal of promoting the common good. Once deliberation concluded, the moderator requested that the group categorize their final rankings as a consensus decision or a compromise. While the goal of the exercise was to reach a consensus, this result was not forced on participants - they were encouraged to express any degree of compromise they accepted to finish deliberations. Individual participant convergence toward final group ranking decisions was also explored through the calculation of Kendall’s τ rank coefficients, which were derived using results from the individual pre-deliberation surveys and final group rankings (Kendall, 1938).
2.7 Applied thematic analysis
Video and audio recordings of each category’s Zoom meeting were used to build a thematic framework through which each category was analyzed. Audio recordings were transcribed by an outside firm and checked for accuracy by multiple members of the research team. These transcripts were used to perform an applied thematic analysis, which allows for qualitative data to be analyzed in a systematic manner (Mackieson et al., 2018; Guest, 2012). Thematic analysis is a broad term with many applications; in this case, it was used to identify common themes and subthemes discussed by participants during deliberations that influenced how their individual rankings of each ES morphed over time.
Three members of the research team, referred to as “coders,” analyzed each category’s transcript to identify these common themes. This process began with creating an Excel spreadsheet containing each quote, its corresponding timestamp, and several columns of codewords associated with each quote. Not all quotes from the deliberation were included in the analysis process–only those expressing a clear opinion regarding the value of a service or the reasoning behind a ranking decision were included to avoid clutter and double counting. Coders met regularly to discuss and refine the index of codewords through multiple iterations of quote analysis; Figure 3 portrays an example of how codewords were grouped together over time to identify subthemes. In each iteration, of which there were approximately 6 for each category, a different coder would initially review and identify codewords. Subsequently, the other two coders would examine and refine their work. By assigning equal tasks to three coders, we hoped to minimize individual influence and maintain consistency (Mavrommati et al., 2021).
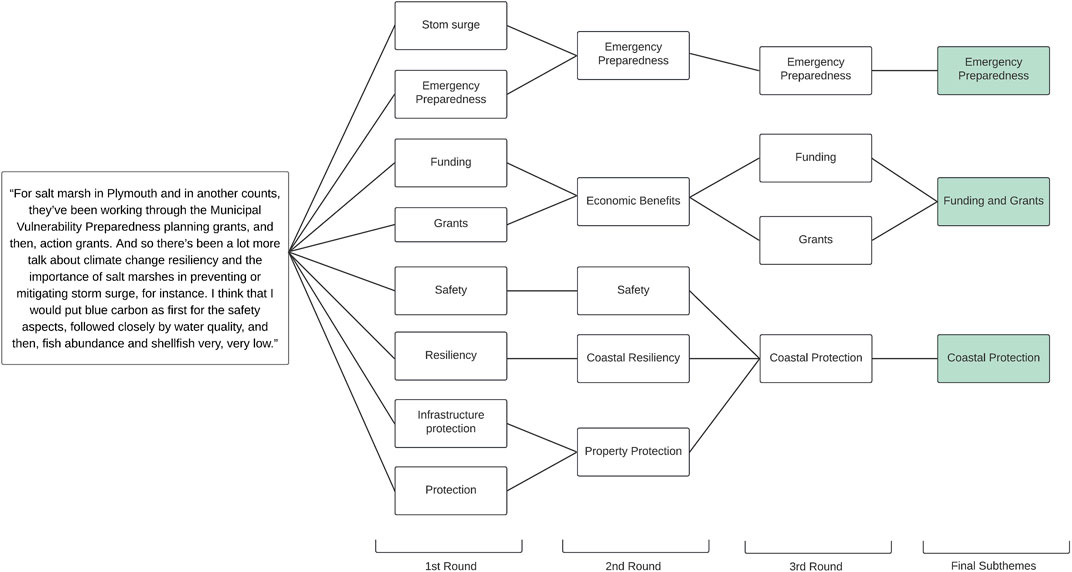
FIGURE 3. Visual representation of the codebook formulation process. The 1st Round column gives the initial keywords attributed to the quote by coders, the 2nd and 3rd Round illustrate the refinement process that occurred with consideration for all other quotes in a group’s transcript, and the final subthemes listed were those included in the final codebook. As shown by the pathway terminating in the “Funding and Grants” subtheme, the refinement process could include both combining terms as well as distinguishing between them based on the desired level of specificity. This quote was taken from Group 2’s salt marsh assessment task.
2.8 Co-occurrence analysis
Co-occurrence analyses use qualitative data to explore the rate at which certain keywords are brought up by individuals in tandem with the goal of illustrating how ideas are clustered together visually (Scharp, 2021). Keywords (or in this case, subthemes) are not necessarily an adequate proxy to represent highly nuanced discussions such as those held by each group in this study, but they do serve to identify general thematic relationships and trends (Guest, 2012).In order to determine co-occurrence frequencies of subthemes, all possible pairings of the final subthemes assigned to a given quote were numerically represented with a value of one. To give an example, if the subthemes “commercial enterprises,” “nutrient levels,” and “public engagement” were assigned to the same quote, a total of three co-occurrences would be tabulated: 1) commercial enterprises with nutrient levels 2) commercial enterprises with public engagement and 3) nutrient levels and public engagement. Once all quotes are analyzed, the final co-occurrence frequencies represent all the instances in which two given subthemes were assigned to the same quote.
3 Results
3.1 Quantitative results
The pre- and post-deliberative surveys were used alongside group assessment task results to perform quantitative analyses with the purpose of identifying the ES preferences of each group.
3.1.1 Results by category
Final rankings of each attribute varied across both habitats and workshop groups. The sole commonality was the elevated level of importance universally placed on the Total Nitrogen attribute–apart from a second-place ranking given by Group 2 with respect to the salt marsh ecosystem, Total Nitrogen received the highest ranking in every assessment task. When considering attribute rankings respective to each ecosystem, groups emphasized the importance of the Blue Carbon attribute during the salt marsh assessment tasks and discussed the Fish Abundance and Shellfish Landings attributes more frequently during the eelgrass assessment tasks, although this did not necessarily translate to higher relative rankings.
The quantitative outcomes of the deliberative assessment tasks were first portrayed as tradeoff weights and shown as an initial result to participants at the conclusion of their deliberation. As shown in Figure 4, participants were least willing to accept compromises regarding the Total Nitrogen attribute in the context of both habitats. Shellfish Landings and Fish Abundance tradeoff weights show variability across habitats, but Blue Carbon was given a generally higher weight in the context of the salt marsh ecosystem.

FIGURE 4. Tradeoff weight results by ecosystem and workshop group.
Figure 5 gives the quantitative results of the salt marsh participant surveys and assessment tasks: 1) Total Nitrogen consistently ranked highly both before and after deliberations 2) Blue Carbon was ranked highly by Groups 2 and 3, whose corresponding categories have significantly more salt marsh area than Group 1 3) Fish Abundance and Shellfish Landings were generally given lower rankings with Blue Carbon and Total Nitrogen except for Group 1, which may again be due to the relatively small area of salt marsh under consideration for this category.
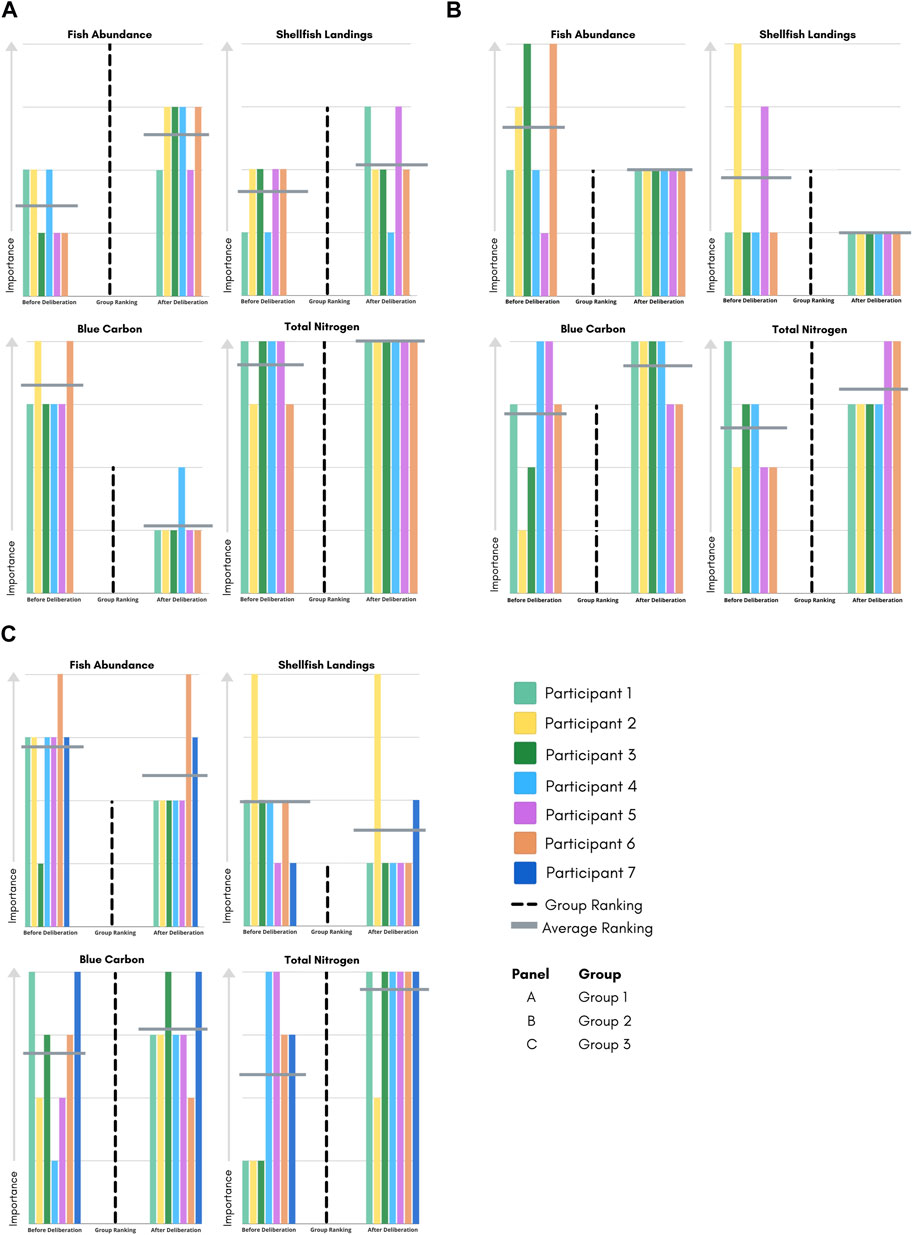
FIGURE 5. Salt marsh rankings bar plot. Individual rankings before and after deliberation are compared with group rankings at the close of the assessment task. Each panel is divided into four sub-panels displaying the rankings of the four ES attributes. The y-axis represents the level of importance assigned to a given attribute. The x-axis displays three stages of the workshop. Individual rankings given in the pre- and post-deliberation surveys (labelled here as “Before Deliberation” and “After Deliberation” respectively) are represented by colored bars assigned to a particular participant, group rankings are represented by a dotted black line, and the average rankings across individuals for each survey are represented by a grey bar (see legend). Panels (A) and (B), which represent Groups 1 and 2, had 6 participants as opposed to Group 3’s 7 and therefore do not display the terminal dark blue bar shown in panel (C).
Figure 6 gives the accompanying quantitative results to Figure 5 for the eelgrass ecosystem: 1) Total Nitrogen was unanimously ranked as the most important service to this group at all stages apart from a single participant in the pre-deliberation survey 2) Fish Abundance was perceived to be the least important attribute by all except for participants 3 and 6 and 3) Blue Carbon was almost unanimously ranked as the second most important attribute.
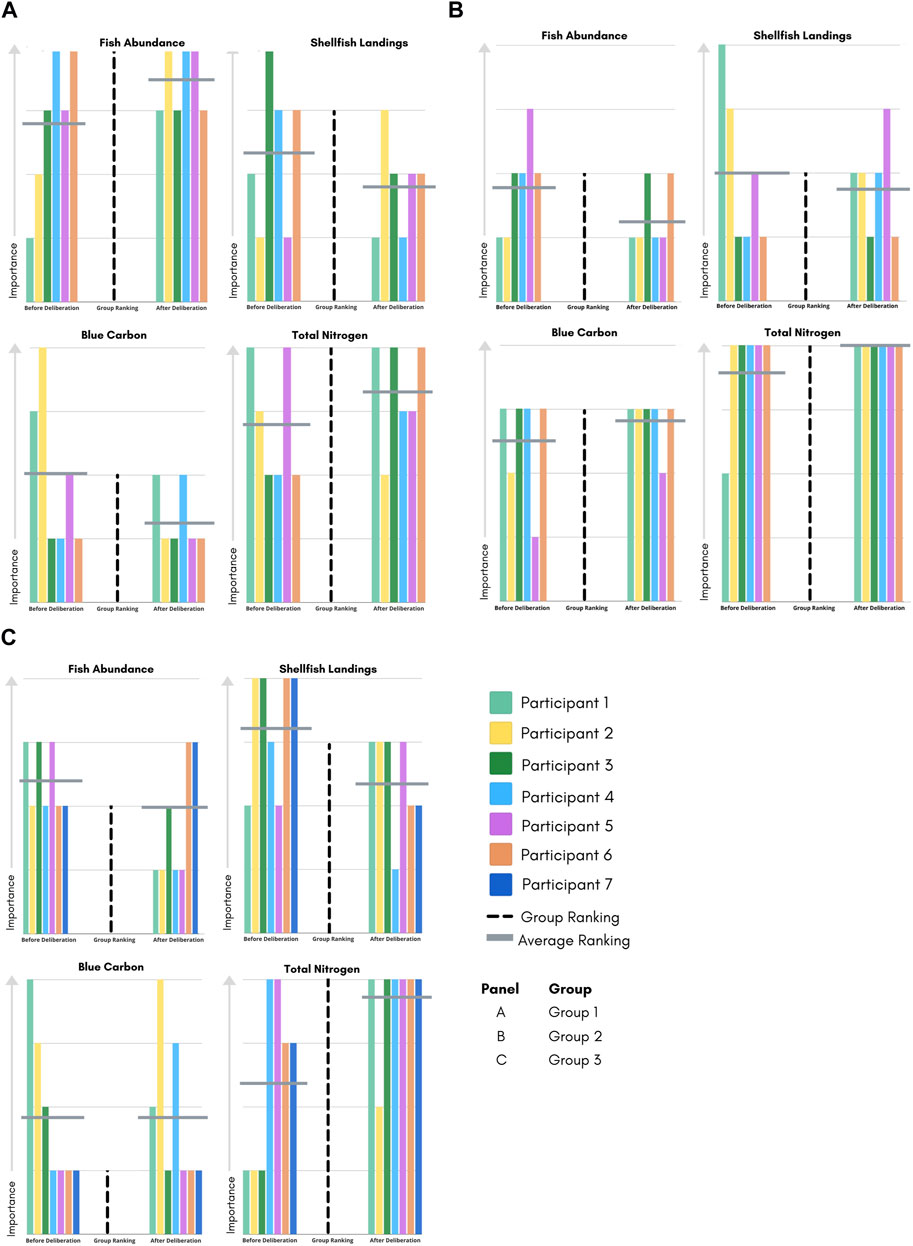
FIGURE 6. Eelgrass rankings bar plot. Individual rankings before and after deliberation are compared with group rankings at the close of the assessment task. Each panel is divided into four sub-panels displaying the rankings of the four ESs attributes. The y-axis represents the level of importance assigned to a given attribute. The x-axis displays three stages of the workshop. Individual rankings given in the pre- and post-deliberation surveys (labelled here as “Before Deliberation” and “After Deliberation” respectively) are represented by colored bars assigned to a particular participant, group rankings are represented by a dotted black line, and the average rankings across individuals for each survey are represented by a grey bar (see legend). Panels (A) and (B), which represent Groups 1 and 2, had 6 participants as opposed to Group 3’s 7 and therefore do not display the terminal dark blue bar shown in panel (C).
3.1.2 Standard deviations of rankings
Table 4 shows standard deviation values between participant rankings in the pre-and post-deliberation surveys for each attribute in each group. The final column gives the change in value of a group’s standard deviation—a negative change value indicates a lower standard deviation in the post-deliberation survey, which implies that participants’ opinions converged regarding the importance of a given attribute. A positive change value indicates that individual responses became more disparate after the assessment task.
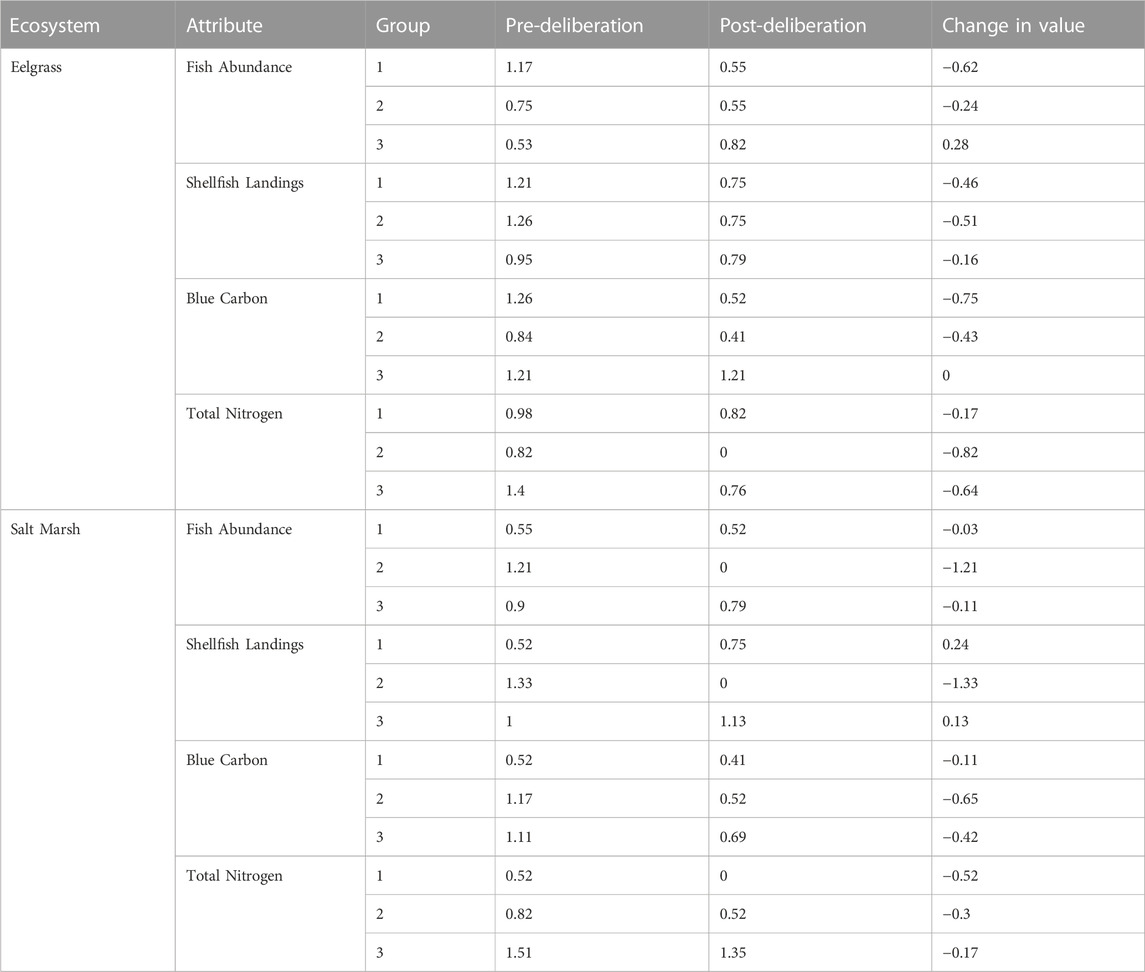
TABLE 4. Standard deviation of pre-and post-deliberation survey results grouped by ecosystem and attribute. Standard deviations represent the extent of deviation from the mean ranking for an attribute in a specific group.
Regarding the eelgrass ecosystem, all categories exhibited increased agreement in attribute rankings across all attributes–the only positive standard deviation change recorded was the Fish Abundance attribute in Group 3. Regarding the salt marsh ecosystem, Fish Abundance, Blue Carbon, and Total Nitrogen saw a negative change in standard deviation across all groups. Shellfish Landings saw an increase in standard deviation in both Group 1 and Group 3. All standard deviation changes for Group 2 in both habitats were negative.
3.1.3 Individual participant influence on group rankings
Each participant’s total time spoken was plotted against Kendall’s τ rank coefficients, which signified the individual’s degree of convergence with group results. No clear relationship was observed–in actuality, participants that volumetrically contributed the most to deliberative discussions showed a higher degree of variance from the group results. Those who spent less time contributing and, consequently, more time listening to the opinions of other stakeholders had higher levels of convergence with final group rankings.
3.2 Qualitative results
After completing the coding process, we found six major themes and 26 subthemes that were present in all three groups. The six themes represent groupings of subthemes related to the same topic or sphere. For example, the theme “Conservation” has six subthemes: coastal protection, environmental policy, habitat condition, habitat extent, and wildlife considerations. Subtheme definitions were formulated by the research team specifically for use within the context of this study and may not be universally applicable. A complete list of themes, subthemes, and subtheme definitions is included in Table 5. Example quotes from participants during the deliberative tasks can be found in Supplementary Table S2.
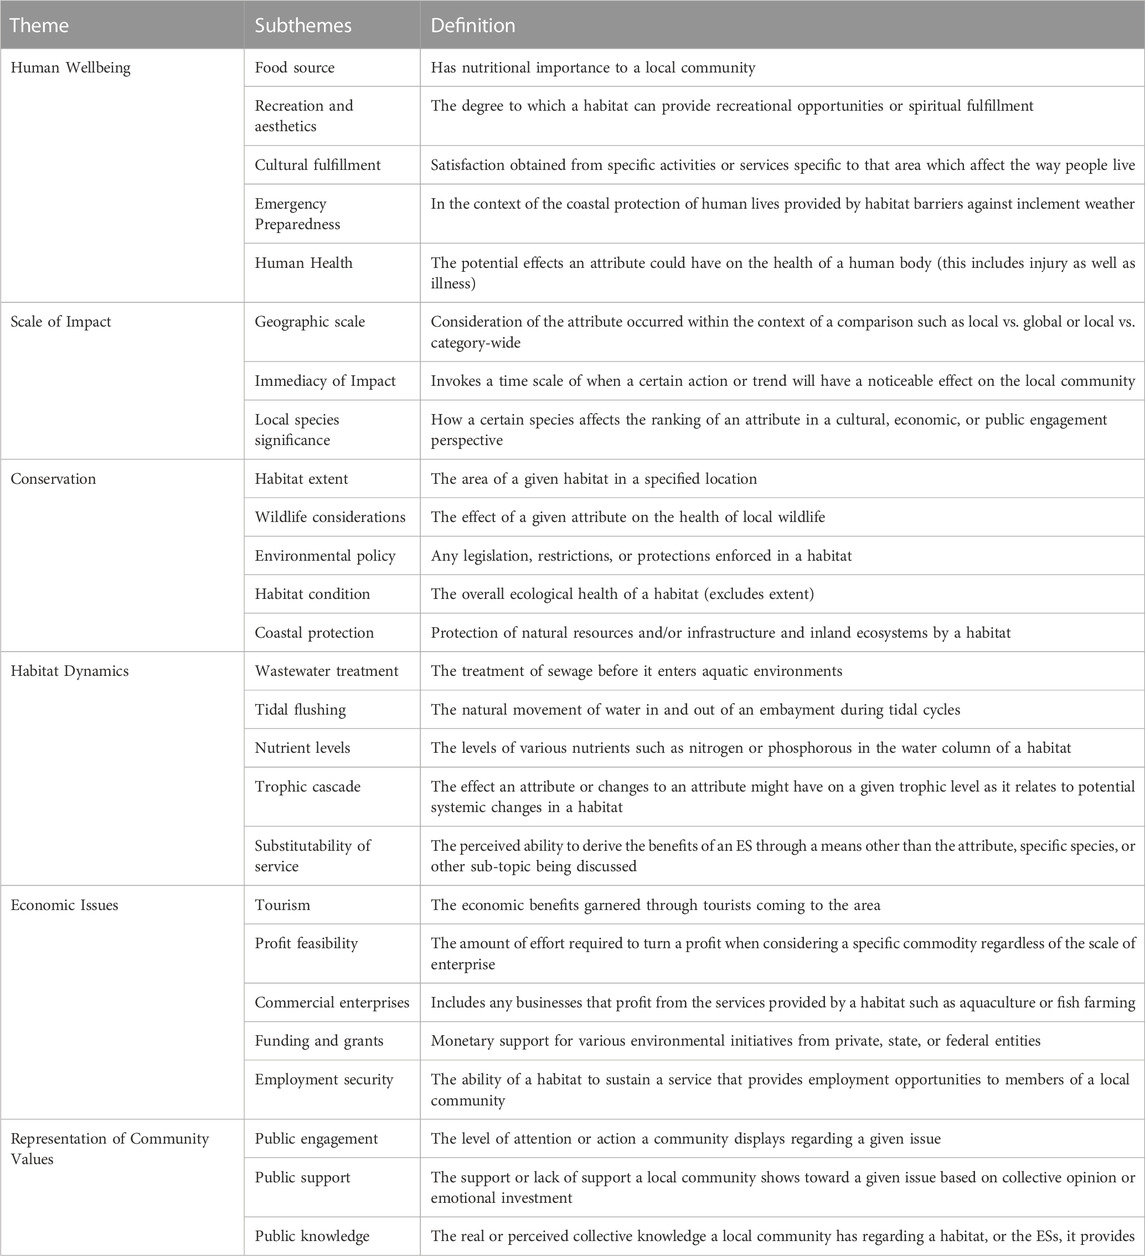
TABLE 5. Final theme and subtheme codebook. Themes and subthemes listed in this codebook were generated using participant quotes from all three categories and thus apply to all workshop analyses.
3.2.1 Thematic frequencies by category
Following the identification of thematic groupings, the frequencies of theme and subtheme occurrences within the assessment tasks of a given group were tabulated. Figure 7 shows the number of times each subtheme was assigned to a quote over the course of deliberation. Both assessment tasks for each group were included in the final tabulations; results are not separated by ecosystem.
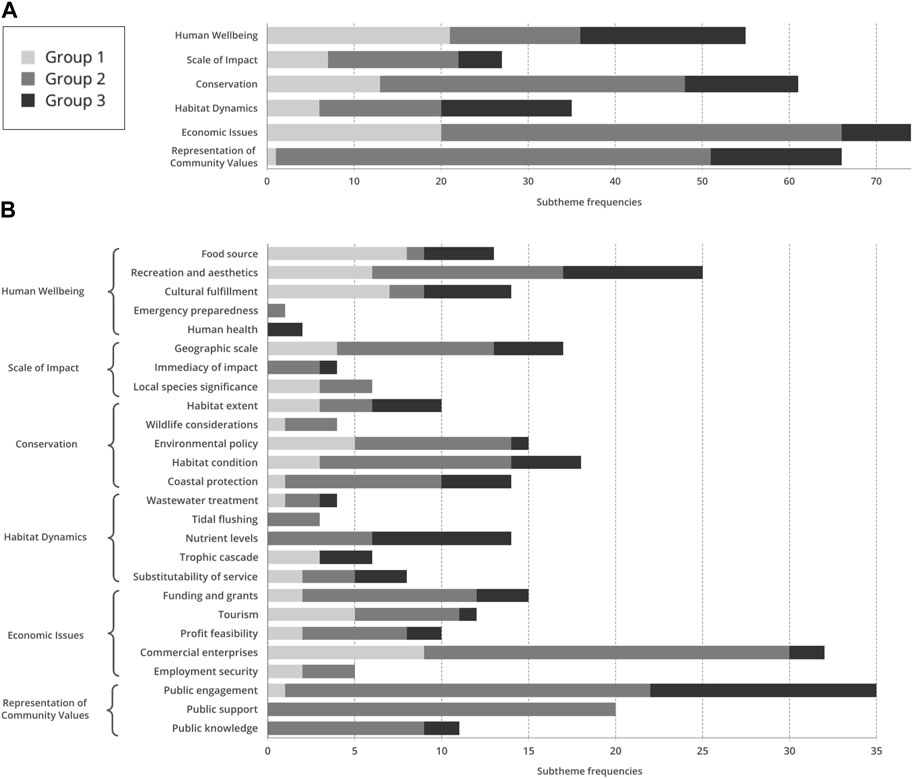
FIGURE 7. Stacked bar plot showing subtheme frequencies across both habitats by category. Results are shown organized by theme (panel (A)) and by both theme and individual subthemes (panel (B)). Bar shades represent the frequencies of a given group (see legend). The y-axis of panel A lists the six major themes and the y-axis of panel (B) lists the six major themes as well as all subthemes. The x-axis gives subtheme frequencies, defined as the number of times a given subtheme was assigned to a participant quote over the course of a workshop regardless of ecosystem.
Subtheme frequencies were highly disparate across the three categories analyzed. Certain subthemes, such as commercial enterprises and public engagement, had high frequencies across two of the groups but low frequency in the third. In some cases, a subtheme that was discussed frequently by one group was completely absent in the discussions of another group (for example, the “public support” subtheme was assigned to 20 quotes from Group 2 but none from Group 1). The results organized by overall thematic grouping further emphasize the variety of results recorded; as seen in panel A of Figure 7, the most discussed thematic group in one category could be the least discussed in another. Also notable is the difference in scale when interpreting subtheme results–the final quote lists of Groups 1 and 3 contained far fewer useable quotes than Group 2 due to differences in group dynamics.
3.2.2 Co-occurrence analysis
To visualize co-occurrence frequencies, matrices were constructed for each category that contained all subthemes as both the rows and columns; intersecting cells describe the number of times a subtheme combination was observed in a group’s discussion (McLellan-Lemal et al., 2003). To produce the heat map shown in Figure 8, subtheme co-occurrences were grouped into their larger thematic categories. A cell value of zero conveys that no subtheme co-occurrences were recorded within the two intersecting thematic groups at any point in a group’s discussion. For example, Group 2’s heat map shows that the highest co-occurrence frequencies between subthemes occurred between those included in the Conservation and Representation of Community Values thematic groups with a total of 17 instances. Practically, this means that any of the five subthemes in the Conservation theme were attributed to the same quote as any of the three subthemes in the Representation of Community Values theme 17 times.
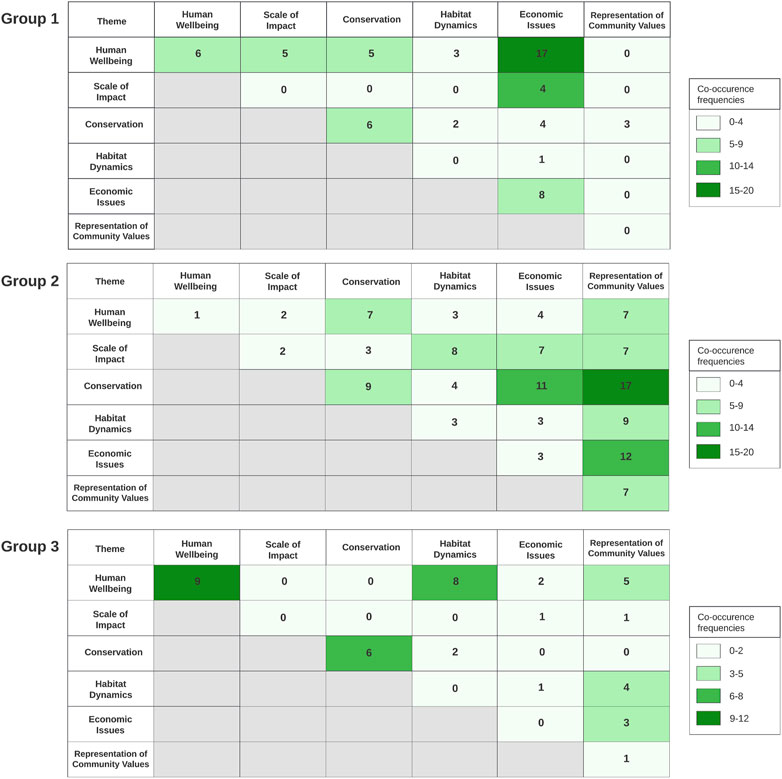
FIGURE 8. Co-occurrence frequencies heat map. Both the x- and y-axis display the six thematic groups determined during the applied thematic analysis. Lighter shades of green indicate fewer co-occurrences of the subthemes within the two thematic groups intersecting a cell while darker shades indicate higher frequencies (see legend). Quartile values were determined by dividing the highest co-occurrence frequency for each group and dividing that value into fourths (if the highest frequency did not yield integer values when establishing quartiles, the next highest divisible integer was used to establish an upper value). Empty cells, shown in grey, represent subtheme combinations that are already accounted for by another intersecting cell (for example, when read beginning with the rows, “Habitat Dynamics” and “Scale of Impact” co-occurrences are already counted at the intersection of “Scale of Impact” and “Habitat Dynamics”).
4 Discussion
We employed a mixed-methods approach to address questions of spatial variability as it affects ecosystem-service valuation, a process that can be applied and expanded upon in alternative future contexts. Using decision theory, deliberative exercises, and applied thematic analysis, we could examine how assessed tradeoff weights by stakeholders differed along the Massachusetts coastline. Our findings suggest that stakeholders in each of the three groups had markedly different preferences and shared social values; our quantitative and qualitative results indicate that policies formed with specific community values as a focal point may be better received than those formulated using generalized values (Benson et al., 2013; Ciftcioglu, 2021).
4.1 Study limitations
Given the highly collaborative nature of deliberative processes, we anticipated that conducting workshops virtually would present both advantages and disadvantages. The high cost and extensive travel associated with in-person workshops, such as mileage reimbursement, hotel reservations, video-recording equipment, food, and supplies, can be costly and, thus, often a deterrent to voluntary participation; virtual workshops require less effort on behalf of the participant to attend and therefore theoretically should translate to higher recruitment rates. We, however, did not find this to be the case and experienced low recruitment rates, which we attributed to general fatigue regarding virtual events during this time–given that these workshops were conducted in December of 2020 during the coronavirus pandemic, widespread use of virtual platforms to conduct business and research seemed to decrease the willingness of stakeholders to participate in voluntary studies. These low recruitment rates resulted in the elimination of category 3 from this study, which would have provided not only data regarding the valuation of ecosystem services provided by the category’s embayments but an additional group of thematic analysis results with which to compare inter-category discussions.
While Zoom proved to be a sufficient platform with which to host deliberative discussions, we did encounter minor technological issues that interrupted the flow of conversation or otherwise made it difficult for individual participants to engage in the deliberative activities. In similar past studies, in which deliberations were conducted in person, participants worked together to complete assessment tasks using interactive physical tools representing the ecosystem ESs under consideration. We recognize that had these workshops take place in person, our results may have differed due to a shift in participant dynamics (Tobin et al., 2020). Future studies implementing similarly collaborative studies using MAVT would likely be more effective if conducted in person.
4.2 Importance of value convergence for policymaking
Both the quantitative and qualitative analyses revealed divergent valuations of the ESs provided by salt marsh and eelgrass habitats at the category level. Our quantitative results, particularly the ESs attribute rankings at both the individual and group levels, portray unambiguous dissimilarity. Apart from a general study-wide consensus regarding the high relative importance of the Total Nitrogen attribute, results were highly disparate–for example, during the three salt marsh deliberations, Blue Carbon was given the lowest ranking by Group 1 but nearly tied with Total Nitrogen for most important in Groups 2 and 3 (Figure 5). The three eelgrass deliberations yielded a broad range of rankings for the Fish Abundance attribute: Fish Abundance was given a tied ranking for most important by Group 1 but was ranked as least or next to least important by Groups 2 and 3 (Figure 6). Conversely, standard deviation results from the pre- and post-deliberation surveys illustrate the consensus-generating nature of deliberative exercises. With three exceptions out of a total of 24 standard deviation changes recorded, as seen in Table 4, participants converged toward a given attribute’s ranking. This outcome shows that the deliberative processes may create a space for in-depth discussion and interaction among participants, allowing new information and the experiences of others to influence and shift their own values (Allen et al., 2021; Saarikoski and Mustajoki, 2021).
The output of deliberative processes, particularly when they result in value convergence, can assist environmental managers to justify decisions related to policy prioritization and enactment. For example, Group 1 placed monetary subthemes at the forefront of deliberations, as exhibited by their emphasis on the commercial enterprises and food source subthemes. This suggests that policies written from the perspective of direct human benefits rather than ecological considerations may receive more support. This group was also unique in placing Fish Abundance as their highest priority for the eelgrass ecosystem–special attention should be given to the ecological and economic benefits this service provides to the category’s local communities (Pascual et al., 2022). In addition, environmental managers can assess the relative desirability of hypothetical management future choices by using MAVT (Borsuk et al., 2019). The overall social value of the ecosystem services provided for various hypothetical management future choices hinges upon the projected attribute levels and the weights assigned by the stakeholders. Future studies may need to invest more resources in projecting the provision of ecosystem services under different management future choices.
In addition, our analysis shows the importance of including the public in the environmental decision-making process. Group 2’s discussions centered around the perceived needs and desires of the public; their most frequently recorded subthemes were commercial enterprises, public engagement, and public support. Intentional citizen participation in environmental decision-making and structured solicitation of local perceptions is likely necessary for long-term success, as is the need to clearly communicate the systematic implications of a policy decision, especially as they relate to local economies. Therefore, we need to invest more resources in participatory valuation methods that engage citizens and represent both their values and subjective judgment in environmental decision-making (Beyers and Arras, 2021; Dimitrovski et al., 2021).
4.3 Importance of spatial variability for environmental management
Deliberative valuation has previously been used to identify shared social values and allow stakeholders to express their willingness to prioritize certain ESs above others (Orchard-Webb et al., 2016; Mavrommati et al., 2020). This study utilized DMCE to elicit shared values from stakeholders of statistically defined geographic locations, highlighting the variability of valuation along the Massachusetts coastline. Utilizing a deliberative format rather than a questionnaire or survey-based approach allowed us to observe the nuances of how stakeholders in each group interacted with their local ecosystem and benefited from their continued health (Kenter et al., 2016). By presenting identically designed workshops to groups of stakeholders that utilize spatially delineated landscapes, we were able to identify the need for community-led policy formulation designed with a specific geographic region at the center rather than broad measures drafted for large, multi-faceted areas of coastline.
By limiting our investigations to specific habitats, eelgrass beds, and salt marshes, we could provide category-specific data to stakeholders, enabling them to contextualize potential changes in the attributes we examined. Specific drivers clustered embayments with similar attributes together, making it easier for decision-makers to identify priority restoration and conservation actions specific to those embayments to protect vulnerable resources, reduce stressors, and improve habitat conditions. This information will assist in setting realistic goals for improving the extent and condition of habitats in various embayments.
4.4 Opportunities for future research
A potential area for further study is the role of the individual within deliberative groups. Our observed lack of a relationship between total verbal contributions and an individual’s convergence with group values suggests that the content of participants’ contributions holds more power in a deliberative setting than their willingness to consistently engage in discussion. Within the context of this study’s workshops, participants that spent the most time silently considering the values of others were more likely to converge toward final group results. Several potential explanations for this phenomenon exist in deliberative literature; variation in receptivity to alternative opinions with regard to participant age and gender, the volatile variable of personality, and an individual’s previous experience with deliberation in a formal or informal context are some of those often cited (Steiner, 2012; Suiter et al., 2014). The ability of an individual or individual(s) to dictate the direction and results of a deliberative discussion is a variable worth exploring further.
The effectiveness of investments in habitat restoration depends on the willingness to gain stakeholders’ support. Employing decision-making frameworks that actively engage stakeholders and provide tools for science communication, building social learning, and eliciting environmental priorities is essential. We suggest that deliberative valuation techniques provide a basis for assessing ESs tradeoffs in a manner that critical research questions such as spatial variability could be explored. Quantitative and qualitative analysis of the workshop outputs shed a light on the reasoning behind participants’ choices within a process in that participants build their understanding and appreciation of other values resulting in shared social values and value convergence in individual values. More applications are needed to explore deliberative valuation techniques further and find alternate ways to engage the general public effectively.
Data availability statement
The original contributions presented in the study are included in the article/Supplementary Material, further inquiries can be directed to the corresponding author.
Ethics statement
The studies involving humans were approved by the University of Massachusetts Boston Institutional Review Board. The studies were conducted in accordance with the local legislation and institutional requirements. The participants provided their written informed consent to participate in this study.
Author contributions
Research performed under the direction of GM (Primary Investigator) by JL-M, NS-S, AK, and SBR in collaboration with PAD and PV. Manuscript written by JL-M under the guidance of GM, PAD, and PV. Workshop design and implementation by JL-M, GM, PAD, and PV. Thematic analysis performed by JL-M, NS-S, AK, and SBR. All authors contributed to the article and approved the submitted version.
Funding
This work was supported by the Massachusetts Bays National Estuary Partnership, under EPA Grant No. CE00A00865 and EPA Grant No. CE00A00815. The citizens’ workshops were approved by UMASS Boston IRB # 2020173 and we appreciate the involvement of 28 stakeholders.
Conflict of interest
The authors declare that the research was conducted in the absence of any commercial or financial relationships that could be construed as a potential conflict of interest.
Publisher’s note
All claims expressed in this article are solely those of the authors and do not necessarily represent those of their affiliated organizations, or those of the publisher, the editors and the reviewers. Any product that may be evaluated in this article, or claim that may be made by its manufacturer, is not guaranteed or endorsed by the publisher.
Supplementary material
The Supplementary Material for this article can be found online at: https://www.frontiersin.org/articles/10.3389/fenvs.2023.1214879/full#supplementary-material
References
Allen, K. E., Castellano, C., and Pessagno, S. (2021). Using dialogue to contextualize culture, ecosystem services, and cultural ecosystem services. Ecol. Soc. 26 (2), art7. doi:10.5751/es-12187-260207
Belton, V., and Stewart, T. (2002). Multiple criteria decision analysis: An integrated approach. New York, NY: Springer. doi:10.1007/978-1-4615-1495-4
Bennett, E. M., Cramer, W., Begossi, A., Cundill, G., Díaz, S., Egoh, B. N., et al. (2015). Linking biodiversity, ecosystem services, and human well-being: three challenges for designing research for sustainability. Curr. Opin. Environ. Sustain. 14, 76–85. doi:10.1016/j.cosust.2015.03.007
Benson, D., Jordan, A., and Smith, L. (2013). Is environmental management really more collaborative? A comparative analysis of putative ‘paradigm shifts’ in europe, Australia, and the United States. Environ. Plan. A Econ. Space 45 (7), 1695–1712. doi:10.1068/a45378
Beyers, J., and Arras, S. (2021). Stakeholder consultations and the legitimacy of regulatory decision-making: a survey experiment in Belgium. Regul. Gov. 15 (3), 877–893. doi:10.1111/rego.12323
Borsuk, M. E., Mavrommati, G., Samal, N. R., Zuidema, S., Wollheim, W., Rogers, S. H., et al. (2019). Deliberative multiattribute valuation of ecosystem services across a range of regional land-use, socioeconomic, and climate scenarios for the upper Merrimack River watershed, New Hampshire, USA. Ecol. Soc. 24 (2), art11. doi:10.5751/ES-10806-240211
Brymer, A. L. B., Wulfhorst, J. D., and Brunson, M. W. (2018). Analyzing stakeholders’ workshop dialogue for evidence of social learning. Ecol. Soc. 23 (1), art42. doi:10.5751/es-09959-230142
Burk, R. C., and Nehring, R. M. (2022). An empirical comparison of rank-based surrogate weights in additive multiattribute decision analysis. Decis. Anal. 20 (1), 55–72. doi:10.1287/deca.2022.0456
Carlisle, B. K., Tiner, R. W., Carullo, M., Huber, I. K., Nuerminger, T., Polzen, C., et al. (2005). 100 Years of estuarine marsh trends in Massachusetts (1893 to 1995): boston harbor, cape cod, nantucket, martha’s vineyard, and the elizabeth islands. Available at: https://www.mass.gov/files/documents/2016/08/or/ma-estuarine-trends.pdf.
Ciftcioglu, G. C. (2021). Participatory and deliberative assessment of the landscape and natural resource social values of marine and coastal ecosystem services: the case of kyrenia (girne) region from northern Cyprus. Environ. Sci. Pollut. Res. Int. 28 (22), 27742–27756. doi:10.1007/s11356-021-12600-x
Costanza, R., de Groot, R., Braat, L., Kubiszewski, I., Fioramonti, L., Sutton, P., et al. (2017). Twenty years of ecosystem services: how far have we come and how far do we still need to go? Ecosyst. Serv. 28, 1–16. doi:10.1016/j.ecoser.2017.09.008
Dahlstrom Michael, F. (2014). Using narratives and storytelling to communicate science with nonexpert audiences. Proc. Natl. Acad. Sci. 111 (4), 13614–13620. doi:10.1073/pnas.1320645111
Dimitrovski, D., Lemmetyinen, A., Nieminen, L., and Pohjola, T. (2021). Understanding coastal and marine tourism sustainability - a multi-stakeholder analysis. J. Destination Mark. Manag. 19, 100554. doi:10.1016/j.jdmm.2021.100554
Eisenführ, F., Langer, T., Weber, M., Langer, T., and Weber, M. (2010). Rational decision making. New York, NY: Springer.
Elliott, M. L., and Kaufman, S. (2016). Enhancing environmental quality and sustainability through negotiation and conflict management: research into systems, dynamics, and practices. Negot. Confl. Manag. Res. 9 (3), 199–219. doi:10.1111/ncmr.12077
Eriksson, M., van Riper, C. J., Leitschuh, B., Bentley Brymer, A., Rawluk, A., Raymond, C. M., et al. (2019). Social learning as a link between the individual and the collective: evaluating deliberation on social values. Sustain. Sci. 14 (5), 1323–1332. doi:10.1007/s11625-019-00725-5
Farley, J. (2012). Ecosystem services: the economics debate. Ecosyst. Serv. 1 (1), 40–49. doi:10.1016/j.ecoser.2012.07.002
Geosyntec (2017). Massachusetts Bays national estuary program estuary delineation and assessment 2.0. Available at: https://www.mass.gov/doc/2017-massbays-estuary-delineation-and-assessment-eda-20/download.
Granek, E. F., Polasky, S., Kappel, C. V., Reed, D. J., Stoms, D. M., Koch, E. W., et al. (2010). Ecosystem services as a common language for coastal ecosystem-based management. Ecosyst. Serv. as a Common Lang. Coast. Ecosystem-Based Manag. Conservation Biol. 24 (1), 207–216. doi:10.1111/j.1523-1739.2009.01355.x
Guerry, A. D., Polasky, S., Lubchenco, J., Chaplin-Kramer, R., Daily, G. C., Griffin, R., et al. (2015). Natural capital and ecosystem services informing decisions: from promise to practice. Proc. Natl. Acad. Sci. 112 (24), 7348–7355. doi:10.1073/pnas.1503751112
Guest, G., MacQueen, K. M., and Namey, E. E. (2012). Applied thematic analysis. California: SAGE Publications, Inc. doi:10.4135/9781483384436
Handmaker, O., Keeler, B. L., and Milz, D. (2021). What type of value information is most valuable to stakeholders? Multi-Sector perspectives on the utility and relevance of water valuation information. Environ. Sci. Policy 115, 47–60. doi:10.1016/j.envsci.2020.10.006
Hanley, T. (2021). Estuarine delineation assessment (EDA) 2.1 - final report. Available at: https://www.mass.gov/doc/massbays-estuary-delineation-and-assessment-embayment-categories/download.
Hossu, C. A., Ioja, I. C., Susskind, L. E., Badiu, D. L., and Hersperger, A. M. (2018). Factors driving collaboration in natural resource conflict management: evidence from Romania. Ambio 47 (7), 816–830. doi:10.1007/s13280-018-1016-0
Jolliffe, I. T., and Cadima, J. (2016). Principal component analysis: a review and recent developments. Philosophical Trans. R. Soc. A 374 (2065), 20150202. doi:10.1098/rsta.2015.0202
Keeney, R. L., and Raiffa, H. (1993). Decisions with multiple objectives: preferences and value trade-offs. Cambridge: Cambridge University Press.
Kendall, M. G. (1938). A new measure of rank correlation. Biometrika 30 (1/2), 81–93. doi:10.2307/2332226
Kenter, J. O., Bryce, R., Christie, M., Cooper, N., Hockley, N., Irvine, K. N., et al. (2016). Shared values and deliberative valuation: future directions. Ecosyst. Serv. 21, 358–371. doi:10.1016/j.ecoser.2016.10.006
Lennox, J., Proctor, W., and Russell, S. (2011). Structuring stakeholder participation in New Zealand's water resource governance. Ecol. Econ. 70 (7), 1381–1394. doi:10.1016/j.ecolecon.2011.02.015
Mackieson, P., Shlonsky, A., and Connolly, M. (2018). Increasing rigor and reducing bias in qualitative research: a document analysis of parliamentary debates using applied thematic analysis. Qual. Soc. Work 18 (6), 965–980. doi:10.1177/1473325018786996
Manning, P., van der Plas, F., Soliveres, S., Allan, E., Maestre, F. T., Mace, G., et al. (2018). Redefining ecosystem multifunctionality. Nat. Ecol. Evol. 2 (3), 427–436. doi:10.1038/s41559-017-0461-7
Marcus, B., Weigelt, O., Hergert, J., Gurt, J., and GellÉRi, P. (2016). The use of snowball sampling for multi source organizational research: some cause for concern. Pers. Psychol. 70, 635–673. doi:10.1111/peps.12169
Mavrommati, G., Borsuk, M. E., and Howarth, R. B. (2017). A novel deliberative multicriteria evaluation approach to ecosystem service valuation. Ecol. Soc. 22 (2), art39. doi:10.5751/es-09105-220239
Mavrommati, G., Borsuk, M. E., Kreiley, A. I., Larosee, C., Rogers, S., Burford, K., et al. (2021). A methodological framework for understanding shared social values in deliberative valuation. Ecol. Econ. 190, 107185. doi:10.1016/j.ecolecon.2021.107185
Mavrommati, G., Rogers, S., Howarth, R. B., and Borsuk, M. E. (2020). Representing future generations in the deliberative valuation of ecosystem services. Elem. Sci. Anthropocene 8. doi:10.1525/elementa.417
McKenzie, E., Posner, S., Tillmann, P., Bernhardt, J. R., Howard, K., and Rosenthal, A. (2014). Understanding the use of ecosystem service knowledge in decision making: lessons from international experiences of spatial planning. Environ. Plan. C Gov. Policy 32 (2), 320–340. doi:10.1068/c12292j
McLellan-Lemal, E., Macqueen, K., and Neidig, J. (2003). Beyond the qualitative interview: data preparation and transcription. Field Methods 15, 63–84. doi:10.1177/1525822X02239573
Millennium Ecosystem Assessment (2003). Ecosystems and human well-being: a framework for assessment. Washington: World Resources Institute.
Murphy, M. B., Mavrommati, G., Mallampalli, V. R., Howarth, R. B., and Borsuk, M. E. (2017). Comparing group deliberation to other forms of preference aggregation in valuing ecosystem services. Ecol. Soc. 22 (4), art17. Article 17. doi:10.5751/ES-09519-220417
Naderifar, M., Goli, H., and Ghaljaei, F. (2017). Snowball sampling: A purposeful method of sampling in qualitative research. Strides in Development of Medical Education. In Press. doi:10.5812/sdme.67670
Nagpal, A., Jatain, A., and Gaur, D. (2013). “Review based on data clustering algorithms,” in 2013 IEEE Conference on Information & Communication Technologies, Thuckalay, India, 11-12 April 2013.
Neumann, J. v., and Morgenstern, O. (2007). Theory of games and economic behavior. Princeton: Princeton University Press. doi:10.1515/9781400829460
NOAA (2016). How people benefit from New Hampshire’s great Bay estuary: a collaborative assessment of the value of ecosystem services and how our decisions might affect those values in the future. Available at: https://www3.epa.gov/region1/npdes/schillerstation/pdfs/AR-344.pdf.
Orchard-Webb, J., Kenter, J. O., Bryce, R., and Church, A. (2016). Deliberative democratic monetary valuation to implement the ecosystem approach. Ecosyst. Serv. 21, 308–318. doi:10.1016/j.ecoser.2016.09.005
Ouyang, X., and Lee, S. Y. (2014). Updated estimates of carbon accumulation rates in coastal marsh sediments. Biogeosciences 11 (18), 5057–5071. doi:10.5194/bg-11-5057-2014
Parks, S., and Gowdy, J. (2013). What have economists learned about valuing nature? A review essay. Ecosyst. Serv. 3, e1–e10. doi:10.1016/j.ecoser.2012.12.002
Pascual, U., Balvanera, P., Christie, M., Baptiste, B., Gonzalez-Jimenez, D., Anderson, C., et al. (2022). Summary for policymakers of the methodological assessment of the diverse values and valuation of nature of the Intergovernmental Science-Policy Platform on Biodiversity and Ecosystem Services (IPBES). doi:10.5281/zenodo.6522392
Posner, S. M., McKenzie, E., and Ricketts, T. H. (2016). Policy impacts of ecosystem services knowledge. Proc. Natl. Acad. Sci. 113 (7), 1760–1765. doi:10.1073/pnas.1502452113
Proctor, W., and Drechsler, M. (2006). Deliberative multicriteria evaluation. Environ. Plan. C Gov. Policy 24 (2), 169–190. doi:10.1068/c22s
Reed, M. S. (2008). Stakeholder participation for environmental management: a literature review. Biol. Conserv. 141 (10), 2417–2431. doi:10.1016/j.biocon.2008.07.014
Saarikoski, H., and Mustajoki, J. (2021). Valuation through deliberation - citizens' panels on peatland ecosystem services in Finland. Ecol. Econ. 183, 106955. doi:10.1016/j.ecolecon.2021.106955
Schaafsma, M., Bartkowski, B., and Lienhoop, N. (2018). Guidance for deliberative monetary valuation studies. Int. Rev. Environ. Resour. Econ. 12 (2-3), 267–323. doi:10.1561/101.00000103
Scharp, K. M. (2021). Thematic Co-occurrence analysis: advancing a theory and qualitative method to illuminate ambivalent experiences. J. Commun. 71 (4), 545–571. doi:10.1093/joc/jqab015
Steiner, J. (2012). The foundations of deliberative democracy: Empirical research and normative implications. Cambridge: Cambridge University Press. doi:10.1017/CBO9781139057486
Suiter, J., Farrell, D. M., and O’Malley, E. (2014). When do deliberative citizens change their opinions? Evidence from the Irish citizens’ assembly. Int. Political Sci. Rev. 37 (2), 198–212. doi:10.1177/0192512114544068
Tobin, C., Mavrommati, G., and Urban-Rich, J. (2020). Responding to social distancing in conducting stakeholder workshops in COVID-19 era. societies 10 (4), 98. doi:10.3390/soc10040098
Walker, T. C. (2010). The perils of paradigm mentalities: revisiting kuhn, lakatos, and popper. Perspect. Polit. 8 (2), 433–451. doi:10.1017/s1537592710001180
Walz, A., Schmidt, K., Ruiz-Frau, A., Nicholas, K. A., Bierry, A., de Vries Lentsch, A., et al. (2019). Sociocultural valuation of ecosystem services for operational ecosystem management: mapping applications by decision contexts in europe. Reg. Environ. Change 19 (8), 2245–2259. doi:10.1007/s10113-019-01506-7
Wanek, E., Bartkowski, B., Bourgeois-Gironde, S., and Schaafsma, M. (2023). Deliberately vague or vaguely deliberative: a review of motivation and design choices in deliberative monetary valuation studies. Ecol. Econ. 208, 107820. doi:10.1016/j.ecolecon.2023.107820
Wegner, G., and Pascual, U. (2011). Cost-benefit analysis in the context of ecosystem services for human well-being: a multidisciplinary critique. Glob. Environ. Change 21 (2), 492–504. doi:10.1016/j.gloenvcha.2010.12.008
Keywords: ecosystem services, applied thematic analysis, deliberative valuation, stakeholder participation, ecosystem service management
Citation: Lyon-Mackie J, Vella P, DiBona PA, Shehab-Sehovic N, Roche SB, Kreiley AI and Mavrommati G (2023) Exploring stakeholders’ ecosystem services perceptions across Massachusetts Bays using deliberative valuation. Front. Environ. Sci. 11:1214879. doi: 10.3389/fenvs.2023.1214879
Received: 30 April 2023; Accepted: 08 August 2023;
Published: 22 August 2023.
Edited by:
Tammy Newcomer-Johnson, United States Environmental Protection Agency (EPA), United StatesReviewed by:
Nidhi Nagabhatla, The United Nations University Institute on Comparative Regional Integration Studies (UNU-CRIS), BelgiumSimone Martino, The James Hutton Institute, United Kingdom
Muniyandi Balasubramanian, Institute for Social and Economic Change, India
Copyright © 2023 Lyon-Mackie, Vella, DiBona, Shehab-Sehovic, Roche, Kreiley and Mavrommati. This is an open-access article distributed under the terms of the Creative Commons Attribution License (CC BY). The use, distribution or reproduction in other forums is permitted, provided the original author(s) and the copyright owner(s) are credited and that the original publication in this journal is cited, in accordance with accepted academic practice. No use, distribution or reproduction is permitted which does not comply with these terms.
*Correspondence: Jennifer Lyon-Mackie, ai5seW9ubWFja2llMDAxQHVtYi5lZHU=