 Anqi Wang1*
 Junyu Ren2
- 1College of Finance and Statistics, Hunan University, Changsha, China
- 2Hunan Provincial Tax Service, State Taxation Administration, Changsha, China
Introduction: The prospective Belt and Road (B&R) Initiative by China must be thoroughly examined by the participating nations in all respects. It is now essential to investigate whether the digital economy of the B&R countries can support green total factor productivity (GTFP). This study examines the connection between green total factor productivity (GTFP) and the digital economy in B&R countries with the aim of providing China with practical recommendations for advancing the initiative.
Methods: This study explores 40 B&R countries from 2006 to 2021, calculates the GTFP using the unexpected super-efficient SBM model and the Global Malmquist-Luenberger index method, and constructs the digital economy index using the principal component analysis method. OLS, FMOLS methods, and spatial panel regressions are used to examine the digital economy-GTFP nexus.
Results and Discussion: In the selected 40 B&R countries, there is a non-linear relationship between the digital economy and GTFP, and the overall effect of the digital economy on GTFP is negative, implying that the growth of the digital economy will cause a decline in GTFP. Energy transition has mediation effects that can mitigate the negative impact of digital economic growth on GTFP. The spatial spillover effects of the digital economy on the GTFP of neighboring countries are evident. There is also heterogeneity; the digital economy will reduce GTFP in high- and middle-income countries, but the negative effects are not evident in low-income countries. This paper adds to the discussion of the digital economy and green development by drawing different conclusions from previous studies using a variety of regression models, providing a fresh foundation for policy-making.
1 Introduction
In recent years, green and sustainable development has become a topic of intense discussion around the world. On the one hand, green and sustainable development is conducive to mitigating Earth crises such as climate change, species extinction, and environmental pollution. On the other hand, a green economy and sustainable development will also help countries around the world get out of the shadow of COVID-19 and restore their economic vitality. Total factor productivity reflects the allocation of resources, the technical level of generating means, the change of production objects, the level of production organization and management, the enthusiasm of workers for production and business activities, and the degree of influence of the economic system and various social factors on production activities. When studying the economy, the World Bank, the OECD, and other international institutions often look at the change in total factor productivity as an important ingredient in examining the quality of economic growth. Since ignorance toward environmental factors leads to biased measurement results and easily misleading policy choices, the term green total factor productivity (GTFP, hereafter) has emerged. GTFP incorporates energy consumption and pollution output in the total factor productivity framework, which is consistent with the idea of high-quality green development. The GTFP, which seeks to reconcile economic growth with environmental conservation, is widely used to measure green development and is considered one of the most important indicators related to the level of green production (Wang et al., 2020; Qiu et al., 2021a; Li et al., 2021; Ma et al., 2022; Hao et al., 2023).
At the same time, with the rapid development and progress of communication technology and Internet technology, the digital economy and digital trade have become important factors in changing the global information flow, industrial structure, trade mode, and trade pattern. The digital economy refers to a number of economic activities that use data as the primary production element, information networks as the primary carrier, and digital technology application as the driving force to improve the economy’s and society’s level of digitalization, networking, and intelligence (G20, 2016; Zhang et al., 2022a). It includes both the development of digital industries and the penetration of digital technology into other industries, or even the digitization of other industries. As the core industry of the digital economy, digital industries are classified differently around the world. For example, in China, digital industries cover four categories: digital product manufacturing, applications of digital technology, industries influenced by digital factors, and digital product services (Shi, 2022). In addition to the digital industry, the digital economy also includes the digitalization of traditional industries, digital government affairs, and other important content.
There appears to be a consensus that the digital economy has a favorable economic impact. At the macro level, existing research has found that ICT can boost output and generate economic spillover effects (Kim et al., 2021). Digital technology can help improve production efficiency and accelerate economic growth. The digital economy can promote the transition from traditional energy to renewable energy, improve the quality of exports, and have a positive and lasting impact on subsequent regional productivity (Tranos et al., 2020; Shahbaz et al., 2022; Yabo and Jie, 2022). At the meso level, Pan et al. (2022) pointed out that the digital economy is the driving force of provincial TFP innovation and development, and Hao et al. (2023) found that the digital economy can improve the green TFP of China’s manufacturing industry (Pan et al., 2022; Hao et al., 2023). At the micro level, numerous studies on enterprises have found that digital transformation is conducive to improving the productivity and performance of enterprises and reducing the risk of stock price crashes (He and Liu, 2019; Li and Wang, 2021; Dong et al., 2022).
On the other hand, the contribution of the digital economy to green, sustainable development is not necessarily linearly beneficial. An inverted “U”-shaped non-linear relationship between CO2 emissions and the digital economy was discovered by Li et al. (2021) using panel data for 190 countries from 2005 to 2016. This finding suggests that the digital economy encouraged CO2 emissions in the early stages of its development, supporting the environmental Kuznets curve (EKC) hypothesis (Li et al., 2021). The influence of the growth of the digital economy on green total factor energy efficiency (GTFEE) dramatically inverts from negative to positive as the digital economy expands, according to Zhao et al. (2022). They accomplished this by studying panel data from 281 Chinese cities at the prefecture level between 2003 and 2018 (Zhao et al., 2022a). The ICT and Internet industries greatly increase electricity consumption in both OECD nations and China. The utilization of massive global data centers and mobile data traffic may cause manufacturing-related electronic waste (Sadorsky, 2012; Dr et al., 2015; Salahuddin and Alam, 2016; Ren et al., 2021).
In recent years, China has made great strides in the field of the digital economy. By October 2022, China had signed memoranda of understanding on “Digital Silk Road” cooperation with 17 countries and established bilateral cooperation mechanisms on “Silk Road e-commerce” with 23 countries, deepening cooperation on “Digital Silk Road”. At the same time, China’s determination to actively respond to environmental changes and safeguard global ecological security is also reflected in the Belt and Road Initiative. Making new progress between China and countries along the Belt and Road in the field of digital economic cooperation and jointly promoting green, ecological, and sustainable development has become an issue that China and countries along the Belt and Road need to discuss together. However, research on the digital economy-GTFP nexus in B&R countries is just beginning.
In summary, although the discussion on the relationship between GTFP and DE has become the focus of many scholars, there are few existing studies on the “Green Belt and Road” and the “Digital Silk Road”. In other words, few studies have examined the impact of digital economy development in countries along the Belt and Road on GTFP. From this perspective, this paper measures the development level of GTFP and the digital economy in countries along the Belt and Road; explores the relationship between the digital economy and GTFP; and analyzes its mediation mechanism, spatial spillover effect, and heterogeneity among different countries.
The marginal contributions of this paper are as follows. First, this study enriches the research on the impact and transmission mechanisms of the digital economy on green development at the national level of the Belt and Road Initiative. The digital economy and GTFP of 40 Belt and Road countries from 2006 to 2021 are measured for the first time. Secondly, the empirical results of this paper find that for countries along the Belt and Road, the digital economy will inhibit the growth of GTFP, which is different from the conclusions of many past studies. This paper analyzes and discusses the reasons for this result, which also makes this study different from the previous ones. Thirdly, in this paper, the quadratic of DE is added to the regression, while the nonlinear relationship between the digital economy and GTFP is considered, respectively, which also enriches the research conclusions. Finally, in the past, for examining the heterogeneity of sample countries, the World Bank’s division of national income levels in the current year was usually used; however, the income levels of sample countries changed dynamically in inter-temporal data. This paper adopts the World Bank’s classification criteria for the income level of countries in each year from 2006 to 2021, which makes the heterogeneity analysis of this paper more reliable.
The remaining part of the study is organized as follows. We briefly provide a structured literature review and present the theoretical hypotheses in Section 2. Section 3 details the methodology, variables, and data. We also conduct unexpected output super-efficiency SBM model and global Malmquist-Luenberger indexes to calculate the GTFP and measure digital economy levels using the principal component analysis (PCA) method from 2006 to 2021 for the 40 B&R countries in Section 3. After a series of tests on panel data, such as the slope heterogeneity test, cross-sectional correlation test, panel unit root test, and cointegration test, Section 4 shows the OLS and FMOLS regression results. Spatial regression, heterogeneity checks, and robustness checks are then presented. Finally, Section 5 contains conclusions, suggestions, and outlooks.
2 Literature review and research hypotheses
2.1 The digital economy-GTFP nexus
Identifying the influencing factors of green development is considered the primary factor in improving the efficiency of green development, and numerous scholars have analyzed the influencing factors of green development efficiency from different perspectives and dimensions. Since GTFP is developed on the basis of TFP, theories related to TFP can be transplanted into GTFP.
Emerging technologies, such as big data, artificial intelligence, and the Internet of Things, are driving changes in the mode of economic operation, guiding economic entities to adopt more advanced technologies and modern applications, and forming a different scope, scale, and level of production. Under the current technological and economic paradigm of the digital economy, digital and information technologies have rapidly realized industrialization and marketization and accelerated their penetration into the whole range of economic activities, changing the original mode of production, organization, and management (Du and Zhang, 2021). Therefore, through technological innovation in the ICT sector, the digital economy spreads technology to different production sectors, optimizes production allocation efficiency, and finally, realizes the improvement of macro TFP. Specifically, the mechanism of the digital economy to improve productivity includes the following two aspects.
On the one hand, the digital economy leads to the transformation of production factors and production functions. The popularization of the Internet can improve the real per capita GDP and change the industrial structure (Liu and Chen, 2017). When “data” production factors are added to the production process, production efficiency can be greatly improved through the channel effect of data development and application and data dissemination and sharing (Li and Wang, 2021). On the other hand, the characteristic that the value of “data” increases with the increase in the amount of data can generate the increasing return to scale effect, which expands the production possibility curve and greatly improves output efficiency (Shi et al., 2019; Ding, 2020).
On the other hand, the digital economy promotes technological efficiency and progress. It has been found that the digital economy has greatly contributed to social productivity through high-tech innovations and applications (Nambisan, 2017). The association between the digital economy index and provincial TFP in China was demonstrated by Pan et al. (2022), demonstrating the role of the digital economy as an innovation engine for the broad and sustained development of TFP (Pan et al., 2022). Zhang et al. (2022) found that the digital economy can effectively promote technological progress and efficiency improvement and promote green total factor productivity growth under the coupling effect (Zhang et al., 2022a). The application of ICT can also improve the digitalization of enterprises and governments, thereby increasing productivity and governance efficiency. According to Sadik-Zada et al. (2022), the adoption of electronic government in the delivery of public sector services has been the central factor that has contributed to the reduction of almost all corruption in developing and transition economies. E-government presents one of the greatest opportunities for socio-economic development and offers solutions for improving the efficiency and effectiveness of public administration (Sadik-Zada et al., 2022).
However, considering the environmental constraints, the impact of the digital economy on GTFP is more complex and difficult to judge. It is difficult to judge whether the digital economy promotes or inhibits GTFP. Modern information technology promotes the innovation of urban development modes, which produce technological effects, allocation effects, and structural effects through innovation drives and then reduces urban environmental pollution through the above three effects. However, the ICT industry itself is a high energy consumption industry (Shi et al., 2018). In the early stages of the digital economy, limited resources are devoted to the development of infrastructure, leading to few opportunities for industrial structure optimization. Through increased expenditure on digital devices and infrastructure, as well as the digitization of existing commercial enterprises, the digital economy increases pollution emissions and energy consumption (Wang, 2022). The degree of penetration of the digital economy in different industries was obviously unbalanced. According to Guo and Liang (2021), the siphon effect of talent and capital brought on by digital industrialization hampered technical advancement (Guo and Liang, 2021). According to Zhou et al. (2021), based on the panel data of Chinese cities from 2011 to 2019, the digital economy significantly increased the GTFP of central cities, but the “siphon effect” hindered the green total factor productivity improvement of peripheral cities (Zhou et al., 2021). Xu and Liu. (2023) found that the digital economy and the green economy in central and western China have not yet had a positive interaction (Xu and Liu, 2023). There is a vertical deepening process from the Internet economy to the digital economy, and the dimensions of the digital economy “enabling” economic transformation and green development are more extensive and the mechanism of action is more complex (Guo and Liang, 2021).
While technology embedding in economic transformation based on digital technology development takes a lot of time, with the transformation of the digital economy and industrial structure, future development of the digital economy can improve GTFP through innovative technology, better capacity management, increased worker productivity, resource management, more rational environmental regulations, higher energy efficiency, reduced energy consumption, and lower pollution (Lange et al., 2020; Huang and Lei, 2021). Therefore, the promotion effect of the digital economy on GTFP may have a time-lag effect.
On the basis of these elements, we propose the following theory.
Hypothesis 1: The digital economy has a nonlinear impact on GTFP. At the same time, the promotion effect of the digital economy on GTFP has a time lag.
2.2 Mediating role of energy transition in the digital economy on GTFP
Factors that are considered for GTFP include energy input and output, meaning that efficiency of energy usage is crucial for GFTP. Pao andd Fu. (2013) revealed the positive relationship between clean energy and green growth, thereby explaining the importance of promoting clean energy applications (Pao and Fu, 2013). Taskin et al. (2020) also described the positive effect of renewable resources on sustainable development, which is consistent with Pao and Fu. (2013) (Taskin et al., 2020).
Considering that the process of digital industrialization can affect the energy structure, the role of energy transformation in studies of the digital economy’s impact on GTFP cannot be ignored. The digital economy encourages the digital transformation of established sectors and the development of new business models, particularly those with low energy consumption and emissions. The digital economy can also have a positive impact on energy transformation by enhancing government governance, improving the efficiency of traditional energy use, and promoting the generation and consumption of renewable energy (Shahbaz et al., 2022). Fan et al. (2022) demonstrated that the development of new digital infrastructure has a positive effect on China’s energy restructuring (Fan et al., 2022). Wang et al. (2023) found that RETI (renewable energy technological innovation) significantly improves GTFP in China (Wang et al., 2023). According to some data, the digital economy may improve energy efficiency, lower CO2 emissions, and alter the composition of energy consumption (Rodríguez Casal et al., 2005).
It can be seen that the digital economy may affect GTFP through energy transition; however, few studies have discussed the mediating role of energy transition in the past.
On the basis of these factors, we put forth the following theory.
Hypothesis 2: Energy transition plays a mediating role in the digital economy–GTFP nexus.
As the aforementioned study demonstrates, the digital economy can contribute to energy transition, and we consider two aspects of energy transition: the structure of the use of renewable energy and the structure of the production of renewable energy.
2.3 The spillover effects of the digital economy on GTFP
The development of the digital economy not only accelerates the spread of information and reduces the cost of information flow but also creates new resources and promotes knowledge sharing. The digital economy can break the traditional time and space constraints, making closer ties between regions and countries, thus improving labor efficiency, productivity, and management locally, and even crossing borders, presenting spatial spillover effects from digitization to GFTP. Furthermore, according to the theory of technology diffusion and the new economic geography, geographical proximity may be an important factor influencing the effect of the digital economy (Zhao et al., 2022a; Shahbaz et al., 2022).
At the same time, the Internet may exhibit different effects on socio-economic and green development in regions with different levels of economic development and different locational conditions. Countries differ greatly in terms of available resources and capabilities for designing e-government strategies and measures. A country’s e-government development plans may not necessarily benefit from government spending or economic growth due to internal political, social, and bureaucratic issues (Niftiyev, 2022b). Due to historical, cultural, and religious reasons in countries along the Belt and Road, there may also be spatial heterogeneity in the impact of the digital economy on GTFP in these countries. Niftiyev (2022) analyzed three countries in the South Caucasus (Armenia, Azerbaijan, and Georgia), which are also Belt and Road Initiative (BRI) countries, and found that the three countries have different growth speeds in the ICT sector and digitalization levels, resulting in differences in manufacturing labor productivity. This has also led to differences in China’s foreign economic interests in these countries (Niftiyev, 2022a). However, this point is typically ignored by academics.
We propose Hypothesis 3 according to the above study.
Hypothesis 3: The spatial spillover effect of digital economy on GTFP is statistically significant.
In general, our research focuses on three mechanisms. (Figure 1).
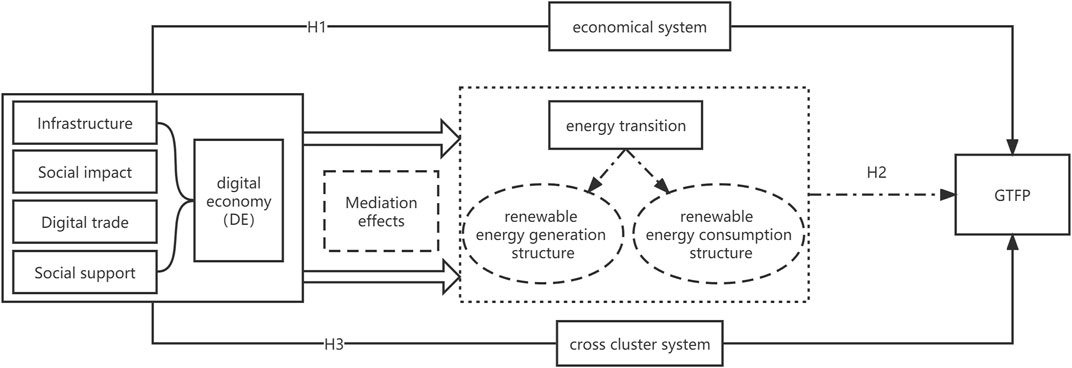
FIGURE 1. The conceptual framework of the digital economy on GTFP.
3 Econometric model and data
3.1 Econometric methods
The major dependent variable in this study is green total factor productivity (GTFP), whereas the key independent variable is the digital economy (DE), with the aim of examining the link between these two variables. This study introduces a series of control variables to control for the impact of macroeconomic factors. Due to the fact that panel data is selected for empirical analysis, we construct a multivariate framework as Eq. 1:
where subscripts i represent countries and t represent years; The explanatory variable GTFP is green total factor productivity, DE is the digital economy indicator, and CON stands for a vector that contains the control variables; μi denotes individual fixed effects of countries i that do not vary over time; γt refers to time fixed effects; ε denotes random disturbance terms; and α0 is an intercept term, α1 and αk are the coefficients for DE and CON, respectively.
Since many studies have shown that there may be a non-linear relationship between the digital economy and green development, in order to verify Hypothesis 1, we run the regression in two ways.
First, a quadratic term for the level of development of the digital economy DE2 is added to the previous linear model and, thus, can be transformed into a regression model, given as Eq. 2.
In addition, according to previous studies, digital technology needs time to spread, which means the digital economy may have a time lag; therefore, the lag period of DE is added to Eq. 2.
In the previous discussion of the transmission mechanism, we discussed how the digital economy may affect GTFP through energy transition. The indirect effect of the independent variable on the dependent variable through the intermediate variable is called the mediating effect (Mackinnon et al., 2000). To test whether the above factors can play the role of mediating variables, this paper adopts a standardized intermediary effect model to carry out further empirical investigation. Specifically, to verify Hypothesis 2, the indirect influence of the explanatory variable (X) on the explained variable (Y) through the intermediate variable (M), the following Eqs 3–5 are used:
This paper regards GTFP as the explanatory variable Y. Renewable energy generation (REG) and renewable energy consumption (REC) are regarded as intermediary variables M to be tested, and the DE is regarded as an explanatory variable X to construct the intermediary effect model.
Moreover, spatial panel econometric models are usually used in empirical studies of regions because they can take into account the inherent properties of the regions themselves and their spatial linkages. To verify Hypothesis 3, the underlying panel regression is extended to a spatial panel Durbin model (Eq. 6).
where:
In model estimation, the variables are standardized from 0 to 1 to avoid the effect of different magnitudes on the results. In order to accurately estimate the interrelationship between the digital economy and green development, it is necessary to select the most appropriate model among different types of spatial panel econometric models for parameter estimation, i.e., combining LM, Robust LM, Wald, and other statistics with the Hausman test for judgment and selection (Jiang, 2016).
Where, if
Where: γ denotes the degree of influence of the GTFP of neighboring countries in the previous period on the GTFP of the region; λ denotes the spatial dependence effect of the GTFP of countries.
3.2 Variable measures and data sources
3.2.1 Unexpected output super-efficiency SBM model and global Malmquist-Luenberger index
As a non-parametric method, Data Envelopment Analysis (DEA) is superior in computing GTFP involving multiple input-output factors. While the past DEA method is not suitable for cases where there are multiple outputs, such as unexpected outputs, Tone (2002) constructed the SBM model for unexpected outputs (Tone, 2002). It can increase expected output while reducing unexpected output (Guo et al., 2022). Considering that outputs are difficult to predict, we expect to have less waste regardless of inputs. Therefore, the most efficient production method in the context of achieving green development must be the green production method, i.e., producing more expected outputs with fewer inputs as well as fewer unexpected outputs.
Compared with the general radial DEA model, the super-SBM model takes relaxation into account. Since Tone (2002) did not give the formula for the super-efficiency SBM model with unexpected output, this paper refers to Cheng (2014) and uses the super-efficiency SBM model with unexpected output to evaluate DMU (x0, y0, z0) (Cheng, 2014).
Assumed to be present are n decision-making units (DMUs), each of which has three components: inputs, anticipated results, and unexpected results (production emissions such as wastewater, carbon dioxide, and soot), represented by three vectors (X, Y, Z).
The DMU (x0, y0, z0) is evaluated using the super-efficiency SBM model with unexpected outputs, as shown in Eq. 9.
To measure the dynamic green efficiency in B&R countries, we first follow Paster and Lovell (2005), who constructed a production technology set formed by all period data of all DMUs as a common production frontier, then calculate the Global-Malmquist productivity index (GM index, hereafter), the same frontier used by the global reference Malmquist, to derive the single Malmquist index (Pastor and Lovell, 2005).
Since the GTFP measure includes unexpected output, this paper also uses the Global Malmquist-Luenberger Index (GMLI) model to measure the dynamic change of GTFP, referring to the GMLI model proposed by Oh (Oh, 2010), with the following Eq 10.
The technical efficiency change index (EC) is the efficiency change indicator. Best practice gap change (BPC) measures technical change between the two time periods. Hence, BPCt, t+1 measures how closely a contemporaneous technology frontier shifts toward the global technology frontier in the direction of more desirable outputs and less undesirable outputs. BPCt, t+1> (<)1 corresponds to technical progress (regress) (Oh, 2010).
Eqs 11, 12 introduce the specific composition of EC and BPC:
Based on green development and model data requirements, we followed Meng and Zhao (2022), Zhao et al. (2022), Xie et al. (2021), who constructed a system of input and output indicators that are needed to measure GTFP (Table 1) (Xie et al., 2021; Zhao et al., 2022c; Meng and Zhao, 2022).
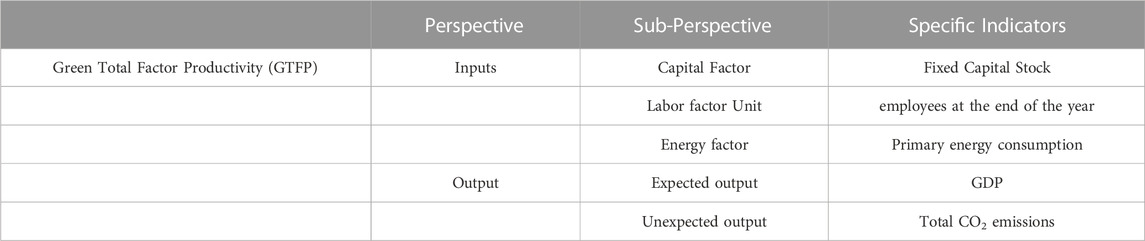
TABLE 1. Valuation index system of GTFP.
This paper refers to Zhang et al. (2019) and uses the perpetual inventory method to estimate the capital stock of the sample countries, in which the depreciation rate is taken as 6% (Zhang et al., 2019). The labor input is obtained by directly subtracting the total number of unemployed from the total labor force, and the units are human beings; the unemployment is obtained from IFS (International Financial Statistics). Primary energy consumption, total CO2 emissions, and GDP are obtained from WDI (World Development Indicators).
3.2.2 Digital economy indicators
There is relatively little relevant literature on specifically measuring the level of digital economy development, so this paper follows Shahbaz et al. (2022) and Zhao et al. (2022) to construct a digital economy index based on four sub-indicators representing infrastructure, social impact, digital trade, and social support using principal component analysis (PCA), denoted as DE, and standardizing the DE from 0 to 1 (Zhao et al., 2022b; Shahbaz et al., 2022). The specific variables and data sources are shown in Table 2.
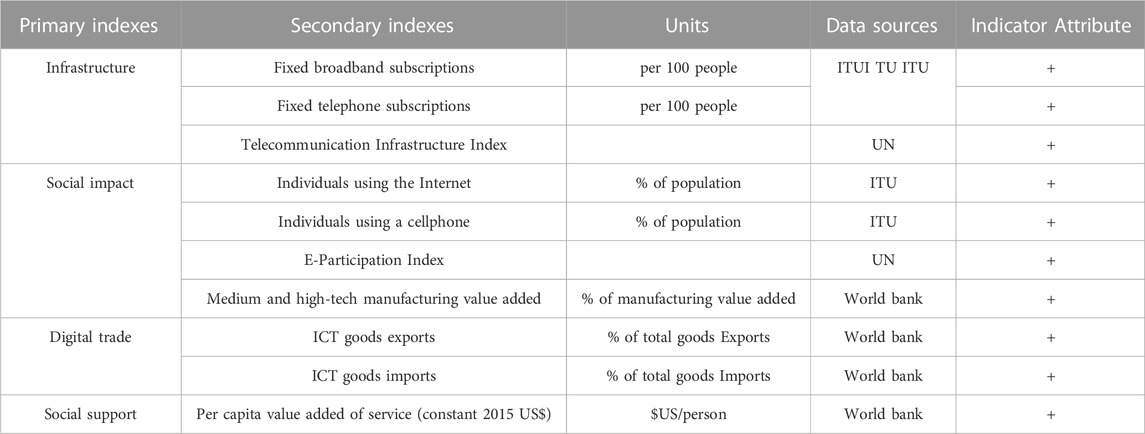
TABLE 2. Comprehensive index system of the digital economy.
3.2.3 Control variables
We select five control variables that may influence green efficiency.
(1) Openness (FDI). According to the technology spillover theory, foreign direct investment (FDI) can bring more advanced production technology and a more scientific management system to the host country. Additionally, FDI promotes the technological progress of the host country through technology spillover and has a positive impact on the ecological environment. Therefore, we control FDI as the earlier studies do (Antweiler et al., 2001; Qiu et al., 2021b; Du and Ma, 2022).
(2) Industry Structure (Service). Industrial structure can reflect a country’s economic structure and development pattern. According to the followers of structuralism, the evolution of industrial structure is actually the process of transferring input factors from low-productivity sectors to high-productivity sectors, thus realizing a “structural dividend”. Therefore, changes in industrial structure affect GTFP, and the industry structure in this study is expressed by service industry value added to GDP (Jiang et al., 2022).
(3) Urbanization (Urban). Chinnery and Syrquin (1975) proposed a “development model” of urbanization and industrialization, and it argues that the development of urbanization is initially driven by industrialization and that its role in urbanization diminishes in the later stages of industrialization (Chenery and Syrquin, 1975). Industrialization brings more frequent economic activities to cities, and the influx of large numbers of people in cities undoubtedly provides a more sufficient impetus for urban economic growth. Economies of scale bring many benefits, such as lower transaction costs. However, they are usually accompanied by higher levels of industrial pollution. Therefore, the development of urbanization is assumed to have an impact on GTFP. Following Liu et al. (2022), we choose urbanization as a control variable (Liu et al., 2022).
(4) Industrial Concentration (IC). The number of secondary industries is selected to calculate the location entropy, which measures the level of industrial agglomeration in Belt and Road countries (Zhang et al., 2022c).
(5) GDP per capita (RGDP). The level of economic development reflects the comprehensive development status of a country. The more developed the economy is, the better the endowment conditions are, which can not only provide better capital conditions for industrial upgrading and transformation but also attract resources and talent, therefore providing better foundations for green development. Following Mikayilov et al. (2018), the GDP per capita of each country is selected as the measurement index of economic development level (Mikayilov et al., 2018).
The data on GDP per capita, FDI, value added of the service industry, and urbanization level are obtained from the World Bank Development Database (WDI), and industrial concentration is calculated according to the World Bank Development Database (WDI). Missing data are supplemented by interpolation and regression methods, as applied frequently in previous studies (Zhao et al., 2022a; Ma and Zhu, 2022).
In order to avoid the problems caused by the distributive characteristics of the data series, all the selected control variables are converted into logarithmic form in this study.
Table 3 shows the results of the descriptive statistics for the variables.
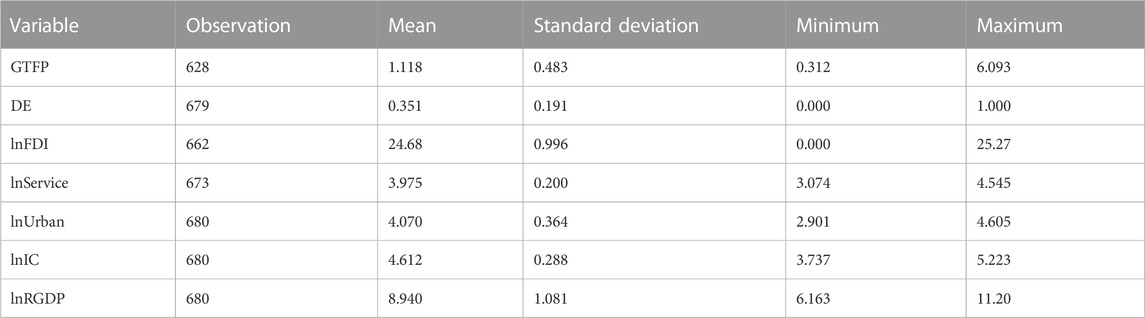
TABLE 3. Descriptive Statistics.
Between 2006 and 2021, the minimum value of GTFP of the B&R sample countries is 0.312 and the maximum value is 6.093; the higher the GTFP, the “greener” the B&R countries.
We show the dynamic changes of GTFP and DE in the years 2006, 2011, 2016, and 2021 from B&R countries in Figure 2 and Figure 3, in which the darker colors indicate a higher level of GTFP (DE).
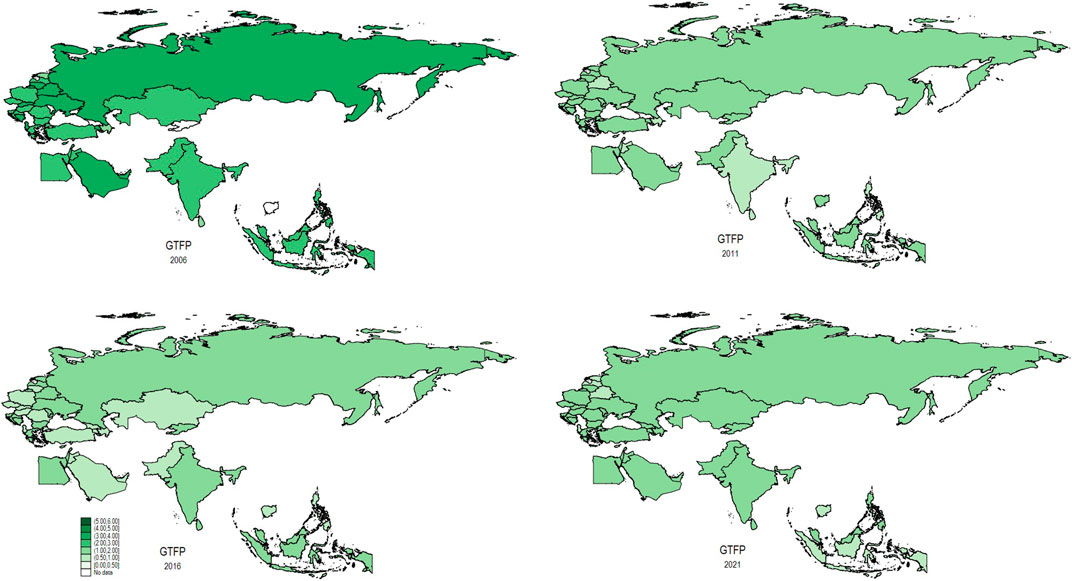
FIGURE 2. the GTFP of B&R countries in the years 2006, 2011, 2016, and 2021.
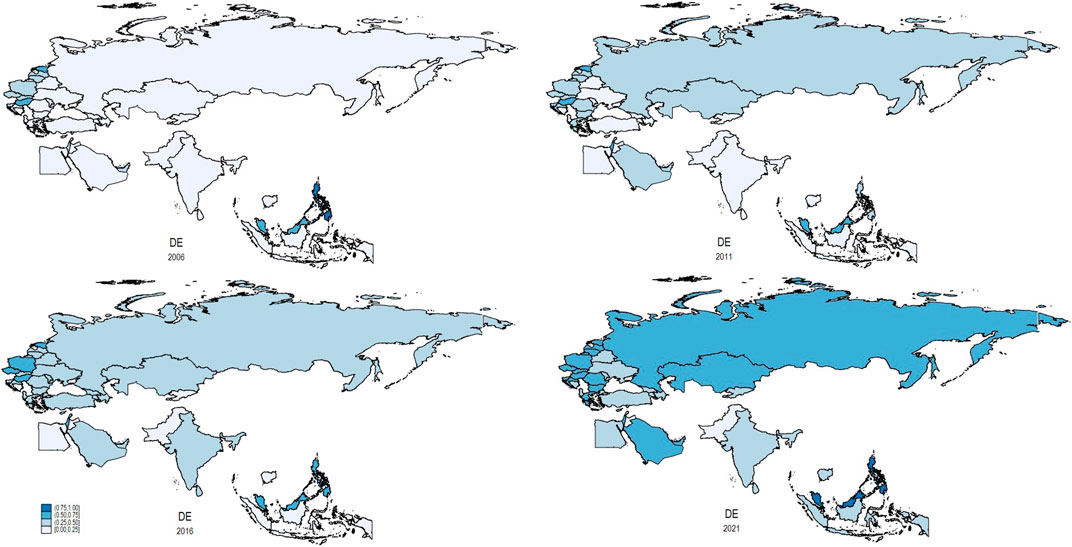
FIGURE 3. the DE of B&R countries in the years 2006, 2011, 2016, and 2021.
Overall, the average GTFP of the 40 sample countries along the Belt and Road shows a W-shaped characteristic of falling and rising, then falling and rising again, with countries such as Azerbaijan, Brunei, and Kyrgyzstan declining slightly from 2006 to 2021, while GTFP in European countries such as Albania, Armenia, Belarus, and Moldova shows a strong downward trend (Figure 2).
The maximum value of the digital economy is 1 (Singapore in 2021) and the minimum value is 0 (Cambodia in 2012). The highest urbanization rate in the sample countries is 100% (Singapore), and the lowest urbanization rate in the sample period is 18.196% (Sri Lanka). The highest share of the service sector in GDP is 94.15% (Lebanon, 2021), and the lowest is 21.632% (Azerbaijan, 2007). Industrial concentration (IC), on the other hand, lies between 0.419 (Georgia, 2006) and 1.856 (Czechia, 2005). The highest value of GDP per capita among the sample countries is $72794.003 (Singapore), and the lowest is only $539.747 (Cambodia), which proves that there is a large gap between countries involved in the Belt and Road initiative.
4 Empirical methodology and results
4.1 Pre-estimation diagnostics
Table 4 demonstrates the correlation coefficients between the variables, showing that variables are low correlated, thus having a lower probability of multicollinearity.
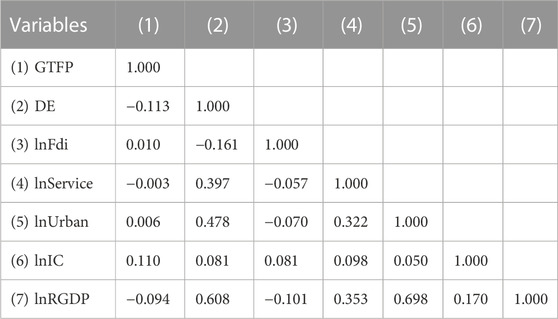
TABLE 4. Matrix of correlations.
4.2 Heterogeneity and cross-sectional dependence
While the data have been analyzed using descriptive statistics, there is a need for a slope heterogeneity analysis. The research factors in panel data analysis may be impacted by a variety of information, including social, economic, or technological information. Therefore, before starting the estimation procedure, slope heterogeneity and cross-sectional correlation tests should be used. The results for slope heterogeneity are shown in Table 5. The slope coefficient test’s statistical value is significant at the 1% level, rejecting the null hypothesis of homogeneity. The findings indicate that the variables are heterogeneous, necessitating a cross-sectional dependence test.
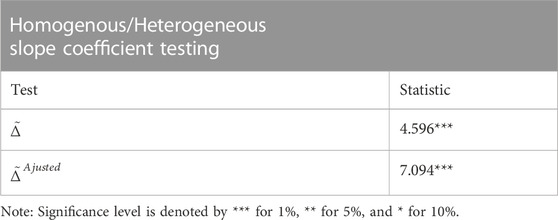
TABLE 5. Slope heterogeneity test.
When analyzing the relationship between all variables in panel data models, cross-sectional correlation is a key issue that needs to be considered; ignorance of cross-section dependence may cause substantial estimation bias and size distortions (Pesaran, 2007). Thus, before assessing the stationary nature of the variables, this analysis first examines the presence of any potential cross-sectional dependence in the panel.
The Pesaran test, the Friedman test, and the Frees test are applied, and the results are presented in Table 6. As shown in the table, the statistics for the Pesaran test and Frees test significantly reject the null hypothesis at the 1% significance level, and the statistics for the Friedman test significantly reject the null hypothesis at the 5% significance level, which provides strong evidence for the cross-sectional dependence among B&R countries. Therefore, in further analysis using this panel sample, we use estimation techniques that allow for cross-sectional dependence.
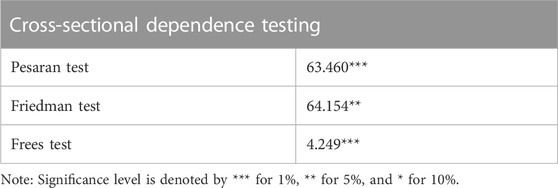
TABLE 6. Cross-sectional dependence tests.
4.3 Unit root analysis and cointegration tests
To prevent erroneous regression, panel unit root tests must be carried out prior to parameter estimation in the panel data model. The first-generation conventional panel unit root tests, including the Levin-Lin Chu (LLC), Im, Pesaran, Shin (IPS), augmented Dickey-Fuller (ADF), and Phillips-Perron (PP) tests, are not appropriate due to the presence of cross-sectional dependency in the panel data (Dou et al., 2021). As a result, the Pesaran cross-sectionally augmented IPS (CIPS) test and the cross-sectionally ADF (CADF) test, two second-generation panel unit root tests that take into account cross-sectional dependence, are more applicable in this investigation (Pesaran et al., 2007). The stationarity and level of integration of the variables are therefore examined in this study using the CADF test. Table 7 displays the results of the stationarity test.
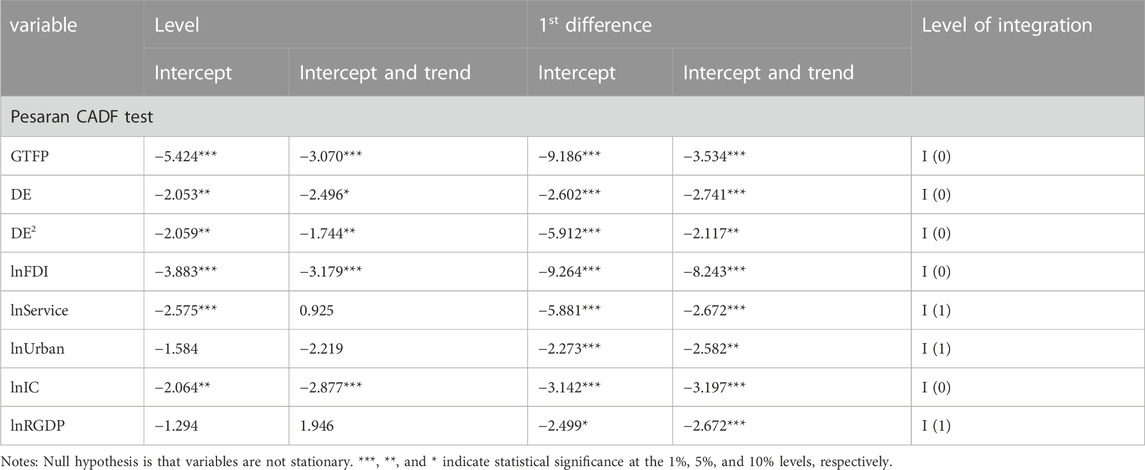
TABLE 7. Panel unit-root tests.
It can be seen from Table 7 that not all variables I (0) are stationary, but the null hypothesis of unit root is significantly rejected in all first-order differences. Thus, our choice of variables is order-one stationary, providing the conditions for us to perform the cointegration test. The Westerlund ECM Cointegration Test is employed in the study to achieve this. The test results in Table 8 show the rejection of the null hypothesis. The significant p-values indicate the presence of long-term associations between variables indicating DE, and the control variables are associated with GTFP in B&R countries, illustrating long-term equilibrium relationships among the selected variables. Therefore, the following estimate of the DE-GTFP nexus is reliable and valid.
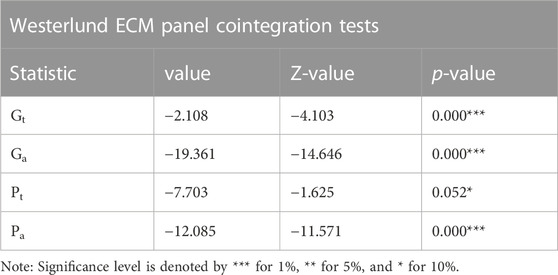
TABLE 8. Cointegration test.
4.4 Benchmark estimates
After the discussion of data stationarity and cointegration, this paper conducts an empirical analysis of the DE-GTFP nexus by estimating Eq. 1. Table 9 shows the baseline regression results. For the OLS method, the Hausman test results suggest that the fixed effect model should be used. If the OLS estimation is still used when there are unit roots and cointegration relationships among the variables, although the OLS super-consistent estimator will be obtained, the asymptotic distribution of the OLS estimator is non-standard and is affected by noise parameters, which cause the commonly used test procedures to fail. In order to avoid possible endogeneity problems among variables, Phillips and Hansen (1990) suggested using non-parametric methods to modify OLS estimators and proposed the fully modified least squares method (FMOLS) for time series (Hansen and Phillips, 1990). On this basis, Pedroni (2001) proposed FMOLS estimation for panel data, including within-dimension FMOLS estimation and between-dimension panel estimation (Pedroni, 2001). The two methods are also compared, and it is found that the inter-group panel FMOLS has better small-sample properties and flexible condition setting than the intra-group FMOLS, so we use the inter-group panel FMOLS for estimation. In order to correct the cross-sectional dependence problem, we also adopt the PCSE estimation method. Regressions in columns (1), (3), and (5) show the estimated coefficients of the digital economy (i.e., DE) based on the OLS, FMOLS, and PCSE methods are consistently negative, indicating a monotonically decreasing relationship between the digital economy and green total factor productivity (GTFP).
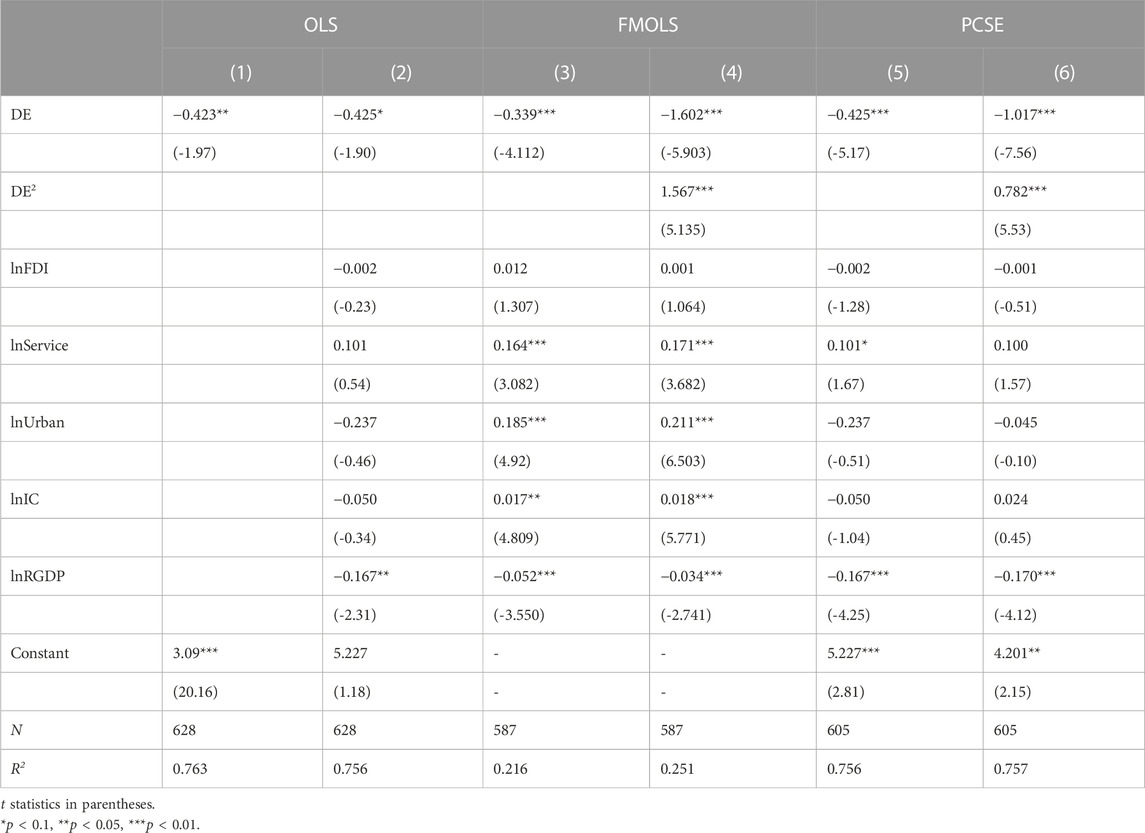
TABLE 9. Benchmark estimates.
The findings also support the validity and reliability of the theoretical derivation, which is supported by our theoretical expectation and Hypothesis 1, given in Section 3. The estimated coefficients for DE differ because two cross sections are dropped from the FMOLS estimation because of the missing data. Specifically, in columns (1), (2), (3), and (5), a 0.1 decrease in DE will cause GTFP to decline by approximately 0.04. Columns (4) and (6) present the estimation results for the nonlinear model of Eq. 2 and show that the coefficient of the quadratic term of DE is significantly positive, which proves that DE has a U-shaped relationship with GTFP, which is in line with the Kuznets curve. By calculating the marginal effects in column (6), it can be concluded that the turning point nearly occurs at DE equal to 0.6. The development of the digital economy has all the time inhibited the improvement of GTFP in B&R countries. While the level of the digital economy is below 0.6, as DE increases, the negative effect of DE on GTFP is increasing. With the development of the digital economy, when it reaches a certain level, for example, 0.6, the inhibition effect of the digital economy on GTFP will start to diminish. This conclusion is also in line with the existing literature on the study of the Internet, digital economy, and economic efficiency (Guo and Liang, 2021). In the meantime, over the sample period of the sample countries, although the coefficient of the quadratic term of DE is significantly positive, the total contribution of the digital economy to GTFP is consistently negative. Our findings are also in line with Zhao et al. (2022), who proved that the coefficient for the effect of digital economy development on green total factor energy efficiency (GTFEE) is significantly negative (Zhao et al., 2022a). There are two plausible explanations for these findings. First, massive investment in the construction of digital infrastructure such as network sites and data centers, as well as matching digital technologies, drives investment in ICT equipment manufacturing, chips, steel, optical fiber, and other industries, thus increasing energy consumption. Agricultural and land surveys have been carried out with the help of the Beidou navigation system, while projects such as digital connectivity, digital railways, ports, roads, energy, and water resources have been rapidly developed, driving power consumption up.
As for the control variables in column (4), the estimated coefficients of industry structure (i.e., lnService), Urbanization level (i.e., lnUrban), industry concentration (i.e., lnIC), and GDP per capita (i.e., lnRGDP) are all significant, and their signs mostly coincide with those 38 B&R countries’ actual conditions (as two cross-sections are dropped). Specifically, the GDP per capita has a negative impact on the growth rate of GTFP in all the columns of Table 9. The results may be explained in the following ways: rapid economic expansion is typically accompanied by high energy consumption, which has a positive impact on the rise in household CO2 emissions. These results are consistent with previous studies (Nasir et al., 2019; Pham et al., 2020; Shahbaz et al., 2020; Nasir et al., 2021). Large CO2 emissions lower the GTFP of the country. As rural residents rely heavily on coal consumption (Dou et al., 2021), the urbanization process contributes to the centralized utilization of energy, which can effectively improve energy utilization efficiency and, thus, improve GTFP. Since the energy consumption per unit output value of industry exceeds that of the service industry, and the scale effect brought by industrial concentration can improve the utilization efficiency of energy, capital, and labor, the increase in the proportion of tertiary industries (i.e., lnService) and the increase in the concentration of secondary industries (i.e., lnIC) can both lead to the improvement of GTFP.
In the early days of the digital economy, investment in digital infrastructure required the consumption of limited local resources. Moreover, the optimization of the production and organization modes of the secondary industry is often ignored in the early stages of the development of the digital economy. In addition, the “enabling” of the digital-based economy requires a certain amount of time for technological precipitation and penetration so as to play the role of the digital economy in optimizing the industrial structure and production mode. These factors may together lead to the reverse effect of the early development of the digital economy on GTFP. On the other hand, due to the “digital” nature of the digital economy, it is usually reflected in the improvement of the efficiency and output value of the tertiary industry, especially in the aspects of platform economy, digital currency, digital finance, etc. Although high efficiency in these areas contributes to economic development, it has a limited effect on energy conservation and emission reduction. In order to further explore the lagged effect brought by DE and confirm the research conclusions, we conducted regression with lagged terms. We find that the three-order lag term of DE has a significantly positive effect on GTFP, and the result is listed in column (3) of Table 10. This suggests that there is a significant lagged effect from DE on GTFP, supporting Wei and Hou (2022), who also reached the same conclusion (Wei and Hou, 2022). Figure 4 shows the intuitive trend. It has been shown that the improvement of GTFP depends on the level of environmental regulations and the optimal allocation of resources among secondary and tertiary industries, and the penetration of “digital” in these aspects usually requires a longer “enabling” process (Zhang et al., 2022c).
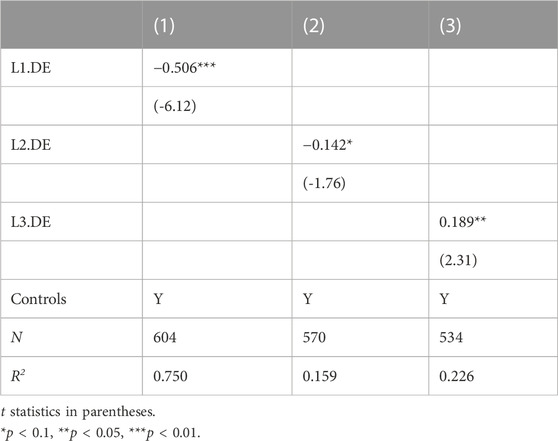
TABLE 10. digital economy lagging behind 1, 2, and 3 period.
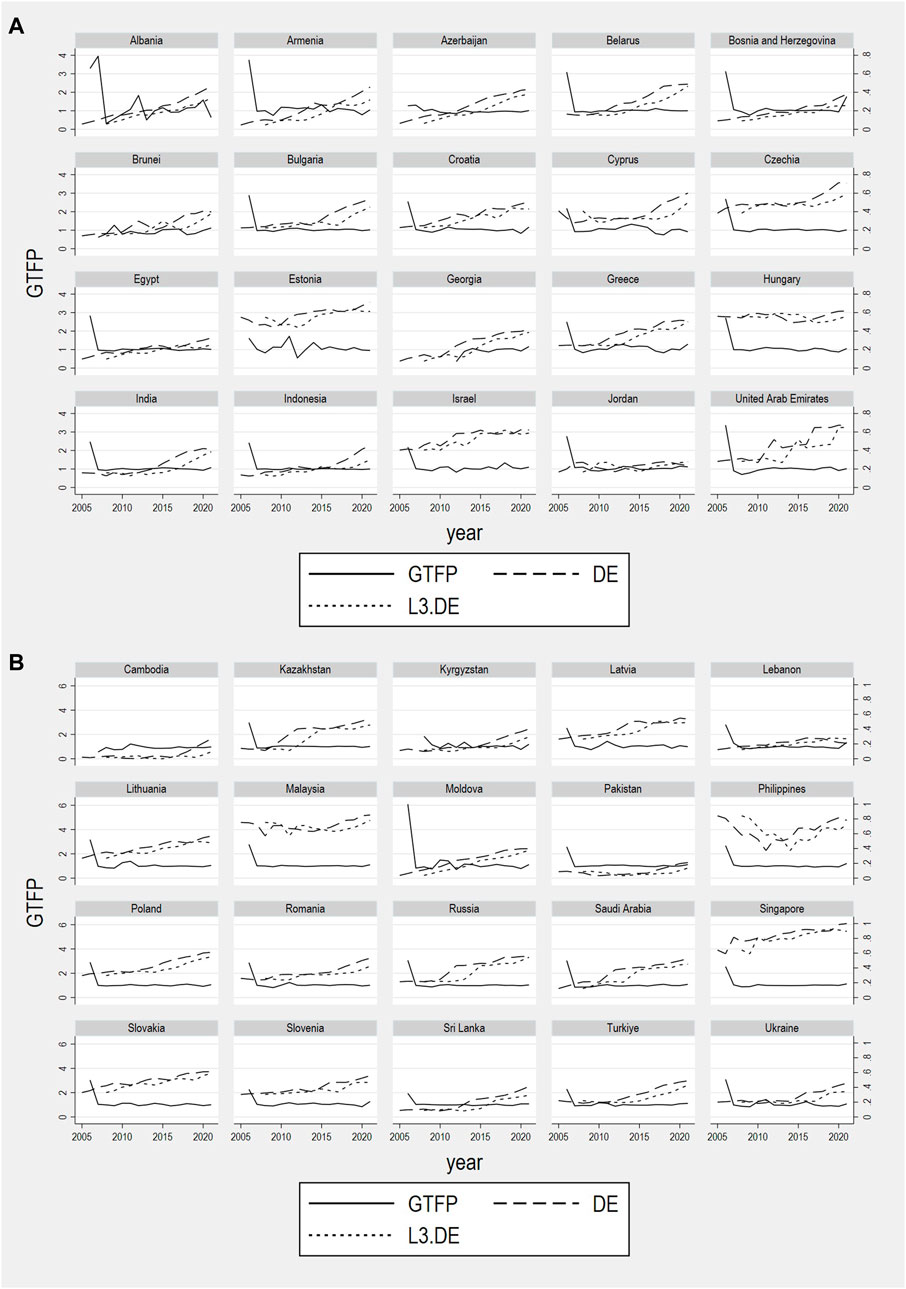
FIGURE 4. GTFP, DE, lagged DE for 3 years in B&R countries (A, B).
4.3 Mediating effect test
Muhammad Shahbaz et al. (2022) found that the digital economy positively affects energy transition; therefore, we explore the mediating effect of energy transition on the digital economy–green efficiency relationship. Following Shahbaz et al. (2022), the renewable energy consumption structure and the renewable energy generation structure are used as proxies for energy transition in this article, including data from the EIA for renewable energy consumption (REC) and renewable energy generation (REG) (Shahbaz et al., 2022). Table 6 presents the mediating effects results.
Columns (1) and (2) of Table 11 present that the digital economy can significantly raise REC and REG, meaning that the digital economy promotes energy transition in the sample countries. While columns (3) and (4) show that energy transitions can significantly contribute to the growth of GTFP, the results mean that B&R sample countries have been undergoing energy transitions with the help of the digital economy, and the decline of GTFP brought on by the digital economy may be partially offset by the intermediary effect and become a nonlinear relationship. Table 11 verifies Hypothesis 2.
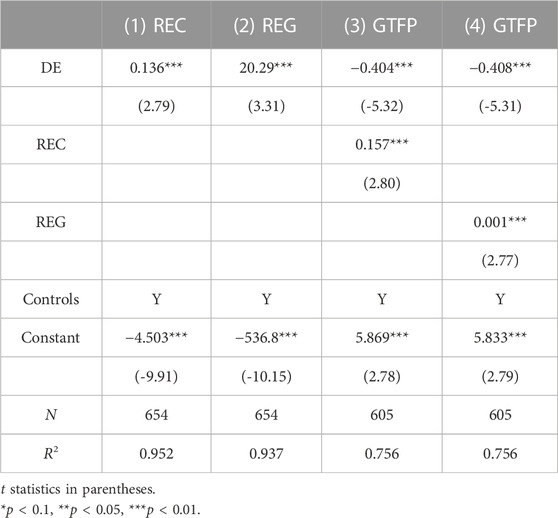
TABLE 11. Mediating Effect Test.
According to Muhammad Shahbaz et al. (2022), countries or regions with more mature renewable energy transition, the digital economy will contribute more obvious effects on that transition. Developed countries are more experienced in improving the application scope of renewable energy through digital technology. However, most B&R countries are less developed, which means that they are less skilled at energy transition and are not technologically advanced. Moreover, they use fewer renewable energies, therefore having a limited ability to raise GTFP. When the digital economy plays a highly vital role in improving industrial production efficiency and raising the economy, those less experienced B&R countries then have additional carbon emissions, which have a negative total effect on GTFP.
4.4 Spatial spillover effect
Moran’s I test is used to analyze the spatial distribution of GTFP.
The global Moran’s I index is calculated by Eq 10.
Where yi denotes the value of the indicator for country i, n is the total number of countries in the sample, and Wij is the weight matrix. Moran’s I is within the range of [-1, 1], and a value larger than zero implies a positive geographical correlation, while a value less than zero indicates a negative spatial correlation, and a value equal to 0 indicates no spatial correlation. In this paper, we use the matrix of inverse bilateral distance between countries (Wang, 2013).
The values of Moran’s I are shown in Table 12.

TABLE 12. The test of spatial correction of GTFP and DE.
It can be seen that Moran’s index of GTFP of countries along the Belt and Road is significant in 2011, 2015, 2019, and 2020, which proves that there is not always spatial correlation in the GTFP of countries along the Belt and Road; however, there is a significant spatial correlation between the variables of the digital economy from 2006 to 2021. Therefore, this paper discusses the spatial spillover effect of the DE-GTFP nexus.
The LM, Robust LM, Wald, and Hausman tests suggest that the SDM model should be used. In column (3) of Table 13, the SDM model estimation results prove that the coefficient of DE is significantly negative and the coefficient of DE2 is significantly positive. In addition, within the range of sample values, the total effect of the digital economy on GTFP is negative, which is consistent with our benchmark regression results. Urbanization is significantly positive, while GDP per capita is significantly negative, which is also consistent with our benchmark regression.
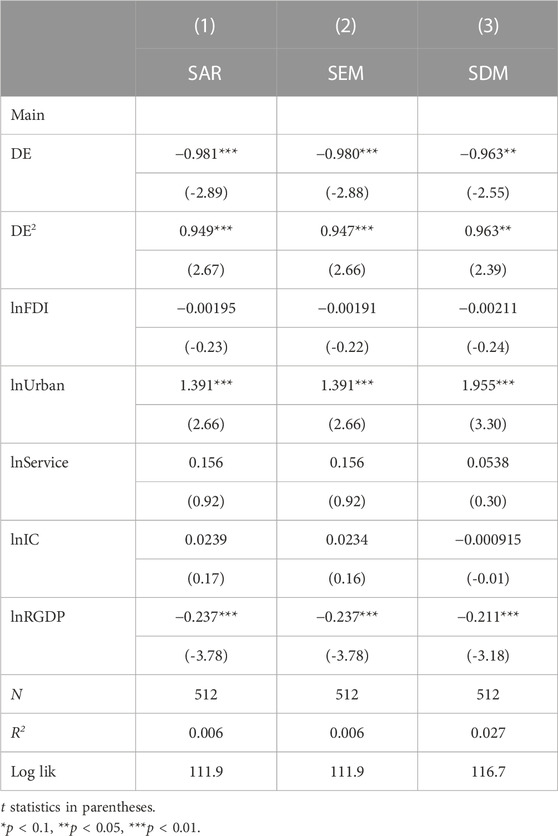
TABLE 13. Regression results of spatial panel model.
The direct and indirect effects are shown in Table 14. The regression results prove that DE has both a significant direct effect and a significant indirect effect. That is, the development of DE will cause the decline of domestic GTFP and the rise of GTFP in neighboring countries through spillover effects. This inconsistent result may be because it takes time for digital technology to spread. On the other hand, the majority of infrastructure investment is borne by the home country, so other countries can enjoy the benefits of digital progress without having to bear a large cost. As the foundation of the digital economy, the advancement of Internet technology has increased the flow of information, cut the cost of information transmission, and considerably reduced the spatiotemporal distance between regions. The increased usage of Internet technology has boosted management efficiency, broadened the market, and improved the structure of energy use. Therefore, the development of the digital economy promotes the improvement of GTFP in neighboring countries by improving the quality of innovation and upgrading the industrial structure.
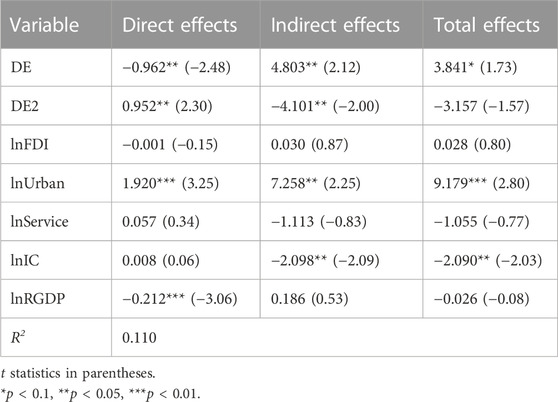
TABLE 14. Direct effects and indirect effects.
The same phenomenon has been captured in previous studies (Su et al., 2021; Zhao et al., 2022a).
4.5 Analysis of heterogeneity
As can be seen in Table 15, the contribution of the digital economy to GTFP is significantly negative in European countries and ASEAN (Association of Southeast Asian Nations) countries, while the effect is positive but not significant in Asian countries other than ASEAN countries (mainly Central, South, and West Asian countries).
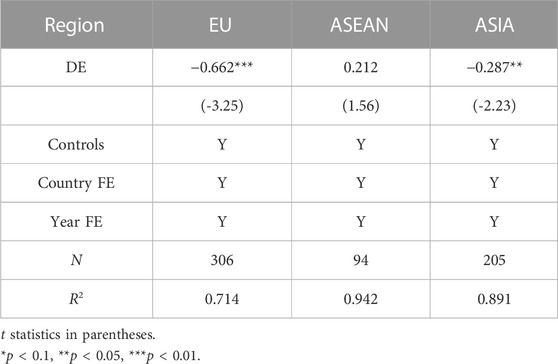
TABLE 15. Spatial heterogeneity measurement results.
For high- and middle-income countries, DE progress brings a decline in GTFP, while in low-income countries, the coefficient of DE is not significant (see Table 16). At the same time, we can see that for middle-income countries, the negative impact of the digital economy on GTFP is greater than that of high-income countries, which is consistent with our previous analysis of industrial stages and household consumption in different countries.
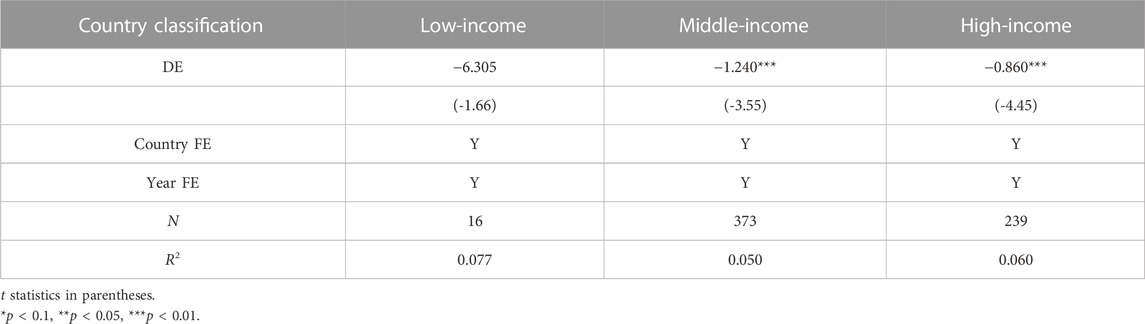
TABLE 16. Heterogeneity test for different income levels.
The classification of countries can be found in Appendix Tables A1; Table B1. This paper uses the World Bank’s annual classification of national income levels to classify the income levels of countries along the Belt and Road. The national income classification changes dynamically from year to year.
4.6 Robustness tests
Table 17 presents the robustness tests. Since there are numerous ways to measure the digital economy, this paper replaces the digital economy index with the Online service index in the UN e-government report. The Online service index is based on an overall synthesis of service delivery, technology, institutional frameworks supporting e-government development, content delivery, and e-participation. Online service indexes can also reflect the development of the digital economy (Zhang et al., 2022b). The regression results prove that the model and conclusions of this paper are robust.
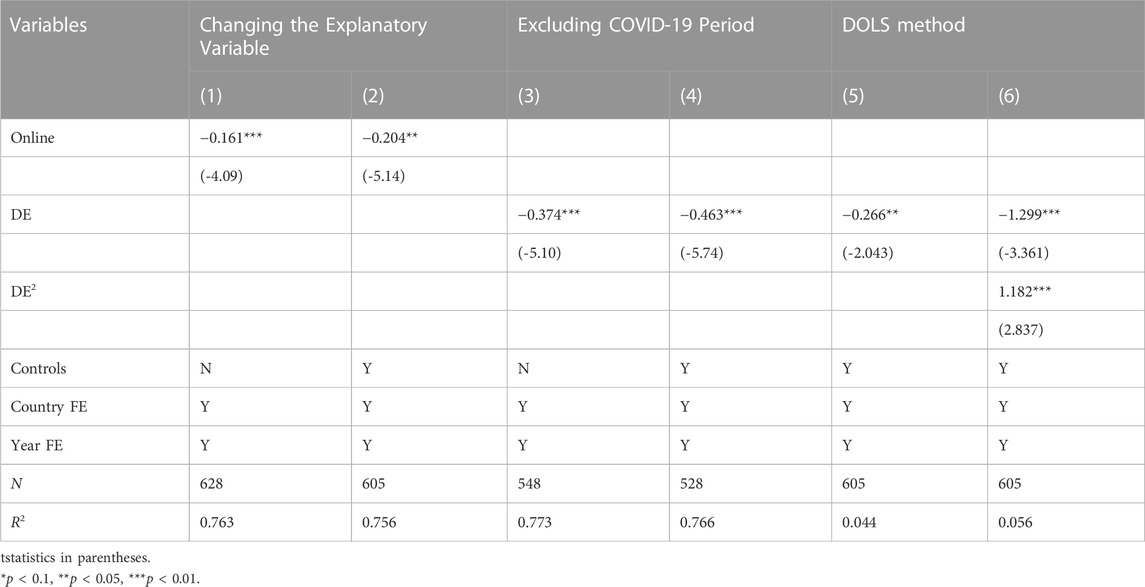
TABLE 17. Robustness Tests.
Meanwhile, in order to exclude the influence of COVID-19, this paper also conducts a regression on the data from 2006 to 2019, and the regression results show that our conclusions still hold.
In addition, this paper uses the dynamic least squares (DOLS) method to test the robustness of the benchmark empirical models. Columns (5)–(6) in Table 15 show the results. The DOLS regression coefficients have the same direction and have similar values with FMOLS, which also proves that our benchmark regression model is reliable.
5 Conclusion and policy implications
For politicians and academics, the digital economy and green total factor productivity are becoming more and more appealing. Though numerous studies have examined the factors that influence GTFP, estimates of the effects of the digital economy on GTFP are scarce, especially for B&R countries. This study looks into the relationship between green total factor productivity and the digital economy in this environment. The following critical conclusions are highlighted.
First, the digital economy has a significant negative impact on green total factor productivity, which is reflected in a U-shaped relationship. The positive effect of the digital economy on GTFP has a time lag.
Second, as an intermediary variable, energy transition can effectively weaken the negative effect of digital economy development on GTFP.
Third, the impact of the digital economy on GTFP has a spatial spillover effect.
Finally, there is heterogeneity in the DE-GTFP nexus among B&R countries. Among these middle-income countries, DE growth has the largest negative impact on GTFP.
Based on the above findings, several critical policy implications are highlighted as follows.
First, the negative effect of DE on GTFP is an essential issue for countries along the Beltand Road in the context of optimizing government governance, increasing environmental regulations, applying digital technologies to reduce carbon and pollution emissions, and promoting economic development to improve GTFP and to avoid the path dependence of “polluting first, then treating”.
Second, in view of the fact that energy transformation can weaken the negative impact of digital economy development on GTFP, Belt and Road countries should actively promote energy transformation, increase investment in renewable energy, and increase the proportion of generation and consumption of renewable energy.
Third, due to the existence of a spatial spillover effect, strengthening international cooperation and enhancing communication among Belt and Road countries can help share the cost of digital infrastructure construction, bridge the “digital divide”, and jointly promote each other’s green economic development.
Finally, considering that different levels of digital economy development have different impacts on GTFP, countries along the Belt and Road should take the initiative to learn from the experience of developed countries and formulate measures to manage the possible negative impacts of the digital economy.
Countries along the Belt and Road have different geographical locations, resource endowments, and stages of social development, and their ICT infrastructure construction is also different. For China, improving the construction of the Belt and Road requires a deeper understanding of these countries, and when evaluating investment projects, it is necessary to consider both the level of digital economy development and the level of GTFP in these countries. At the same time, China should promote the development of big data platforms and international cooperation on environmental protection technologies; share its experience in addressing climate change, global ocean governance, and biodiversity conservation; and effectively promote the Green Belt and Road Initiative.
Limitations of the study: (1) The data from 40 sample countries was only from 2006 to 2021, and detailed information was difficult to obtain due to a lack of data availability. Data for several Belt and Road countries cannot be obtained; while the geographical location of these countries is very important, they connect the sample countries. Due to the lack of data, the analysis of spatial measurement and the spatial spillover effect is not accurate enough, as is the analysis of spatial heterogeneity. (2) This study lacked the ability to investigate whether the digital economy and GTFP have a dynamic relationship (Hao et al., 2023); moreover, there may be other mechanisms of the digital economy on GTFP that can play a mediation role, such as industrial structure transformation, FDI, and fintech, that were not revealed here. (3) Different countries play different roles in the BRI, and the exact relationship between the BRI and the sample of 40 countries participating in this China-initiated and led economic project deserves further in-depth discussion, some kind of methodological control for the project is worth adding. The above aspects represent the current study’s limitations and should be considered in the future.
Data availability statement
The original contributions presented in the study are included in the article/Supplementary Material further inquiries can be directed to the corresponding author.
Author contributions
Conceptualization, AW; methodology, AW; software, AW; resources, JR; writing-original draft preparation, AW; writing—review and editing, AW and JR; supervision, JR; validation, AW; project administration, JR All authors have read and agreed to the published version of the manuscript. All authors contributed to the article and approved the submitted version.
Conflict of interest
The authors declare that the research was conducted in the absence of any commercial or financial relationships that could be construed as a potential conflict of interest.
Publisher’s note
All claims expressed in this article are solely those of the authors and do not necessarily represent those of their affiliated organizations, or those of the publisher, the editors and the reviewers. Any product that may be evaluated in this article, or claim that may be made by its manufacturer, is not guaranteed or endorsed by the publisher.
Supplementary material
The Supplementary Material for this article can be found online at: https://www.frontiersin.org/articles/10.3389/fenvs.2023.1213961/full#supplementary-material
References
Antweiler, W., Copeland, B. R., and Taylor, M. S. (2001). Is free trade good for the environment? Am. Econ. Rev. 91, 877–908. doi:10.1257/aer.91.4.877
Chenery, H. B., and Syrquin, M. (1975). Patterns of development, 1950-1970. Africa: African Economic History.
Cheng, G. (2014). Data envelopment analysis method and MaxDEA software. Beijing, China: Intellectual Property Press.
Ding, Z.-F. (2020). Research on the mechanism of digital economy driving high quality economic development: A theoretical analysis framework. Mod. Econ. Res. 1, 85–92. doi:10.13891/j.cnki.mer.2020.01.011
Dong, B., Xu, H., and Wang, J. (2022). Enterprise digital strategic commitment and stock price crash risk. J. Account. Res. 09, 112–126.
Dou, Y., Zhao, J., Dong, X., and Dong, K. (2021). Quantifying the impacts of energy inequality on carbon emissions in China: A household-level analysis. Energy Econ. 102, 105502. doi:10.1016/j.eneco.2021.105502
Dr, K. D. K. K., Lennerfors, T. T., Fors, P., and Van Rooijen, J. (2015). ICT and environmental sustainability in a changing society. Inf. Technol. People 28, 758–774. doi:10.1108/itp-09-2014-0219
Du, C.-Z., and Zhang, Y. (2021). On the mechanism of the impact of digital economic development on the growth of enterprise productivity. Secur. Mark. Her. 02, 41–51.
Du, L., and Ma, Y. (2022). Efficiency measurement and driving factors of green development for countries along the “Belt and road”. China: Journal of Sichuan University, 173–183.
Fan, L., Zhang, Y., Jin, M., Ma, Q., and Zhao, J. (2022). Does new digital infrastructure promote the transformation of the energy structure? The perspective of China’s energy industry chain. Energies 15, 8784. doi:10.3390/en15238784
G20 (2016). G20 digital economy development and cooperation initiative [Online]. Available at: http://www.g20chn.org/hywj/dncgwj/201609/t20160920_3474.html. [Accessed September 22 2016].
Guo, J., and Liang, S. (2021). The impact mechanism of the digital economy on China’s total factor productivity:an up-lifting effect or a restraining effect? South China J. Econ. 2021, 9–27. doi:10.19592/j.cnki.scje.390281
Guo, J., Zhang, K., and Liu, K. (2022). Exploring the mechanism of the impact of green finance and digital economy on China’s green total factor productivity. Int. J. Environ. Res. Public Health 19, 16303. doi:10.3390/ijerph192316303
Hansen, B. E., and Phillips, P. C. B. (1990). Statistical inference in instrumental variable regression with I(I) processes. Rev. Econ. Stud. 57, 99–125.
Hao, X., Wang, X., Wu, H., and Hao, Y. (2023). Path to sustainable development: Does digital economy matter in manufacturing green total factor productivity? Sustain. Dev. 31, 360–378. doi:10.1002/sd.2397
He, F., and Liu, H. (2019). The Performance Improvement Effect of Digital transformation Enterprises from the Digital Economy Perspective. Reform. 4, 137–148.
Huang, L., and Lei, Z. (2021). How environmental regulation affect corporate green investment: Evidence from China. J. Clean. Prod. 279, 123560. doi:10.1016/j.jclepro.2020.123560
Jiang, L., Chen, Y., and Huang, J. (2022). Impact of fiscal expenditure efficiency on green total factor productivity:based on panel data of 284 Chinese cities. Econ. Geogr. 42, 28–36. doi:10.15957/j.cnki.jjdl.2022.11.004
Jiang, L., Chen, Y., and Huang, X. (2016). Selective activation of CB2 receptor improves efferocytosis in cultured macrophages. J. Statistics Inf. 31, 10–18. doi:10.1016/j.lfs.2016.07.013
Kim, K., Bounfour, A., Nonnis, A., and Zaygen, A. (2021). Measuring ICT externalities and their contribution to productivity: A bilateral trade based approach. Telecommun. Policy 45, 102085. doi:10.1016/j.telpol.2020.102085
Lange, S., Pohl, J., and Santarius, T. (2020). Digitalization and energy consumption. Does ICT reduce energy demand? Ecol. Econ. 176, 106760. doi:10.1016/j.ecolecon.2020.106760
Li, X., Liu, J., and Ni, P. (2021). The impact of the digital economy on CO2 emissions: A theoretical and empirical analysis. Sustainability 13, 7267. doi:10.3390/su13137267
Li, Z.-G., and Wang, J. (2021). Digital economy development, data factor allocation and manufacturing productivity improvement. Economist 10, 41–50. doi:10.16158/j.cnki.51-1312/f.2021.10.005
Liu, J., and Chen, W. (2017). An empirical study on the relationship between internet development level and economic growth in China. Econ. Geogr., 37.08, 108–113+154. doi:10.15957/j.cnki.jjdl.2017.08.014
Liu, L., Ding, T., and Wang, H. (2022). Digital economy, technological innovation and green high-quality development of industry: A study case of China. Sustainability 14, 11078. doi:10.3390/su141711078
Ma, D., Zhu, Q., Business, J. O., and Woodside, A. G. (2022). Innovation in emerging economies: Research on the digital economy driving high-quality green development. J. Bus. Res. 145, 801–813. doi:10.1016/j.jbusres.2022.03.041
Ma, D., and Zhu, Q. (2022). Innovation in emerging economies: Research on the digital economy driving high-quality green development. J. Bus. Res. 145, 801–813. doi:10.1016/j.jbusres.2022.03.041
Mackinnon, D. P., Krull, J. L., and Lockwood, C. M. (2000). Equivalence of the mediation, confounding and suppression effect. Prev. Sci. 1 (4), 173–181.
Meng, F., and Zhao, Y. (2022). How does digital economy affect green total factor productivity at the industry level in China: From a perspective of global value chain. Environ. Sci. Pollut. Res. 29, 79497–79515. doi:10.1007/s11356-022-21434-0
Mikayilov, J. I., Galeotti, M., and Hasanov, F. J. (2018). The impact of economic growth on CO2 emissions in Azerbaijan. J. Clean. Prod. 197, 1558–1572. doi:10.1016/j.jclepro.2018.06.269
Nambisan, S. (2017). Digital entrepreneurship: Toward a digital technology perspective of entrepreneurship. Entrepreneursh. theory Pract. 41, 1029–1055. doi:10.1111/etap.12254
Nasir, M. A., Canh, N. P., and Lan Le, T. N. (2021). Environmental degradation and role of financialisation, economic development, industrialisation and trade liberalisation. J. Environ. Manag. 277, 111471. doi:10.1016/j.jenvman.2020.111471
Nasir, M. A., Huynh, T., and Tram, H. (2019). Role of financial development, economic growth and foreign direct investment in driving climate change: A case of emerging ASEAN. J. Environ. Manag. 242, 131–141. doi:10.1016/j.jenvman.2019.03.112
Niftiyev, I. (2022a). China’s interests in the industrialization of the South Caucasus: Comparative analysis of labor productivity in the manufacturing sector. Ekon. i Sotsialnye Peremeny 15, 205–222. doi:10.15838/esc.2022.2.80.13
Niftiyev, I. (2022). “The role of public spending and the quality of public services in E-government development,” in Materials II International Conference “Digital Economy: Modern Challenges and Real Opportunities, Baki, 28-29 April 2022, 2022b, 450–454.
Oh, D. H. (2010). A global Malmquist-Luenberger productivity index. J. Prod. Analysis 34, 183–197. doi:10.1007/s11123-010-0178-y
Pan, W., Xie, T., Wang, Z., and Ma, L. (2022). Digital economy: An innovation driver for total factor productivity. J. Bus. Res. 139, 303–311. doi:10.1016/j.jbusres.2021.09.061
Pao, H. T., and Fu, H. C. (2013). The causal relationship between energy resources and economic growth in Brazil. Energy Policy 61, 793–801. doi:10.1016/j.enpol.2013.06.113
Pastor, J. T., and Lovell, C. A. K. (2005). A global Malmquist productivity index. Econ. Lett. 88, 266–271. doi:10.1016/j.econlet.2005.02.013
Pedroni, P. (2001). “Fully modified OLS for heterogeneous cointegrated panels,” in Nonstationary panels, panel cointegration, and dynamic panels. Editors B. H. BALTAGI, T. B. FOMBY, and R. CARTER HILL (Bingley, United Kingdom: Emerald Group Publishing Limited).
Pesaran, M. H. (2007). A simple panel unit root test in the presence of cross section dependence. J. Appl. Econ. 22, 265–312. doi:10.1002/jae.951
Pesaran, M. H., Smit, L. V., and Yamagata, T. (2007). Panel unit root tests in the presence of a multifactor error structure. Camb. Work. Pap. Econ. 175, 94–115. doi:10.1016/j.jeconom.2013.02.001
Pham, N. M., Huynh, T. L. D., and Nasir, M. A. (2020). Environmental consequences of population, affluence and technological progress for European countries: A malthusian view. J. Environ. Manag. 260, 110143. doi:10.1016/j.jenvman.2020.110143
Qiu, S. L., Wang, Z. L., and Geng, S. S. (2021b). How do environmental regulation and foreign investment behavior affect green productivity growth in the industrial sector? An empirical test based on Chinese provincial panel data. J. Environ. Manag. 287, 112282. doi:10.1016/j.jenvman.2021.112282
Qiu, S., Wang, Z., and Liu, S. (2021a). The policy outcomes of low-carbon city construction on urban green development: Evidence from a quasi-natural experiment conducted in China. Sustain. Cities Soc. 66, 102699. doi:10.1016/j.scs.2020.102699
Ren, S., Hao, Y., Xu, L., Wu, H., and Ba, N. (2021). Digitalization and energy: How does internet development affect China’s energy consumption? Energy Econ. 98, 105220. doi:10.1016/j.eneco.2021.105220
RodríGUEZ Casal, C., Van Wunnik, C., Delgado Sancho, L., Claude Burgelman, J., and Desruelle, P. (2005). How will ICTs affect our environment in 2020? foresight 7, 77–87. doi:10.1108/14636680510581330
Sadik-Zada, E. R., Gatto, A., and Niftiyev, I. (2022). E-government and petty corruption in public sector service delivery. Technol. Analysis Strategic Manag. 2022, 1–17. doi:10.1080/09537325.2022.2067037
Sadorsky, P. (2012). Information communication technology and electricity consumption in emerging economies. Energy Policy 48, 130–136. doi:10.1016/j.enpol.2012.04.064
Salahuddin, M., and Alam, K. (2016). Information and communication technology, electricity consumption and economic growth in OECD countries: A panel data analysis. Int. J. Electr. Power and Energy Syst. 76, 185–193. doi:10.1016/j.ijepes.2015.11.005
Shahbaz, M., Nasir, M. A., Hille, E., and Mahalik, M. K. (2020). UK’s net-zero carbon emissions target: Investigating the potential role of economic growth, financial development, and R&D expenditures based on historical data (1870–2017). Technol. Forecast. Soc. Change 161, 120255. doi:10.1016/j.techfore.2020.120255
Shahbaz, M., Wang, J., Dong, K., and Zhao, J. (2022). The impact of digital economy on energy transition across the globe: The mediating role of government governance. Renew. Sustain. Energy Rev. 166, 112620. doi:10.1016/j.rser.2022.112620
Shi, D., Ding, H., Wei, P., and Liu, J. (2018). Can smart city construction reduce environmental pollution. China: China Industrial Econom-ics, 117–135.
Shi, D. (2022). Evolution of industrial development trend under digital economy. China Ind. Econ. 11, 26–42. doi:10.19581/j.cnki.ciejournal.2022.11.001
Shi, L., Wang, S., and Wang, J. (2019). Economic analysis from stock to flow: On the construction of theoretical framework of flow economics. Acad. Mon. 01, 50–28. doi:10.19862/j.cnki.xsyk.2019.01.005
Su, J., Su, K., and Wang, S. (2021). Does the digital economy promote industrial structural upgrading?—a test of mediating effects based on heterogeneous technological innovation. Sustainability 13, 10105. doi:10.3390/su131810105
Taskin, D., Vardar, G., and Okan, B. (2020). Does renewable energy promote green economic growth in OECD countries? Sustain. Account. Manag. Policy J. 11, 771–798. doi:10.1108/sampj-04-2019-0192
Tone, K. (2002). A slacks-based measure of super-efficiency in data envelopment analysis. Eur. J. Operational Res. 143, 32–41. doi:10.1016/s0377-2217(01)00324-1
Tranos, E., Kitsos, T., and Ortega-ArgiléS, R. (2020). Digital economy in the UK: Regional productivity effects of early adoption. Reg. Stud. 55, 1924–1938. doi:10.1080/00343404.2020.1826420
Wang, H., Cui, H., and Zhao, Q. (2020). Effect of green technology innovation on green total factor productivity in China: Evidence from spatial Durbin model analysis. J. Clean. Prod. 288, 125624. doi:10.1016/j.jclepro.2020.125624
Wang, J. C. (2022). Understanding the energy consumption of information and communications equipment: A case study of schools in taiwan. Energy 249, 123701. doi:10.1016/j.energy.2022.123701
Wang, J., Dong, X., and Dong, K. (2023). Does renewable energy technological innovation matter for green total factor productivity? Empirical evidence from Chinese provinces. Sustain. Energy Technol. Assessments 55, 102966. doi:10.1016/j.seta.2022.102966
Wang, S., Liu, M. Y., and Wang, F. (2013). Anti-amnesic effect of pseudoginsenoside-F11 in two mouse models of Alzheimer's disease. J. Quantitative Econ. 30, 57–67. doi:10.1016/j.pbb.2013.03.010
Wei, L., and Hou, Y. (2022). Research on the impact of China’s digital economy on urban green development. J. Quantitative Technol. Econ. 39, 60–79. doi:10.13653/j.cnki.jqte.2022.08.005
Xie, F., Zhang, B., and Wang, N. 2021. Non-linear relationship between energy consumption transition and green total factor productivity: A perspective on different technology paths. Sustain. Prod. Consum., 28, 91–104.doi:10.1016/j.spc.2021.03.036
Xu, J., and Liu, Z. (2023). Research on the measurement and synergistic interaction effect of China’s provincial digital economy and green economy. Ecol. Econ. 39, 57–62.
Yabo, L., and Jie, C. (2022). Research on the export quality effect of digital economy. World Econ. Stud. 17, 32–134. doi:10.13516/j.cnki.wes.2022.03.006
Zhang, J., Lyu, Y., Li, Y., and Geng, Y. (2022a). Digital economy: An innovation driving factor for low-carbon development. Environ. Impact Assess. Rev. 96, 106821. doi:10.1016/j.eiar.2022.106821
Zhang, J. Z., Zhao, W. Q., Cheng, B. D., Li, A. X., Wang, Y. Z., Yang, N., et al. (2022b). The impact of digital economy on the economic growth and the development strategies in the post-COVID-19 era: Evidence from countries along the "Belt and road. Front. Public Health 10, 856142. doi:10.3389/fpubh.2022.856142
Zhang, Q., Yan, F., Li, K., and Ai, H. (2019). Impact of market misallocations on green TFP: Evidence from countries along the Belt and road. Environ. Sci. Pollut. Res. 26, 35034–35048. doi:10.1007/s11356-019-06601-0
Zhang, Y., Wang, M., and Cui, L. (2022c). Impact of the digital economy on green total factor productivity in Chinese cities. Econ. Geogr. 42, 33–42. doi:10.15957/j.cnki.jjdl.2022.09.004
Zhao, S. A., Zhang, Y. C., Iftikhar, H., Ullah, A., Mao, J., and Wang, T. T. (2022b). Dynamic influence of digital and technological advancement on sustainable economic growth in Belt and road initiative (BRI) countries. Sustainability 14, 15782. doi:10.3390/su142315782
Zhao, S., Peng, D., Wen, H., and Wu, Y. (2022a). Nonlinear and spatial spillover effects of the digital economy on green total factor energy efficiency: Evidence from 281 cities in China. Environ. Sci. Pollut. Res. 2022, 1–21. doi:10.1007/s11356-022-22694-6
Zhao, X., Nakonieczny, J., Jabeen, F., Shahzad, U., and Jia, W. (2022c). Does green innovation induce green total factor productivity? Novel findings from Chinese city level data. Technol. Forecast. Soc. Change 185, 122021. doi:10.1016/j.techfore.2022.122021
Zhou, X., Liu, Y., Peng, L., et al. (2021). Progress of esophageal stricture prevention after endoscopic submucosal dissection by regenerative medicine and tissue engineering. Shanghai J. Econ. 17, 51–60. doi:10.1016/j.reth.2021.01.003
Appendix
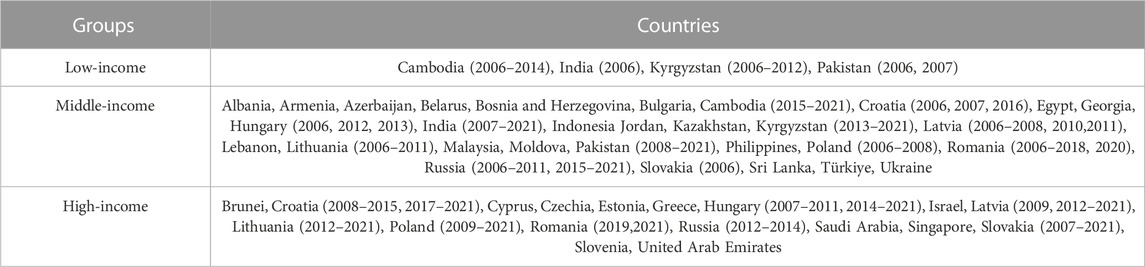
TABLE A1. List of countries by income levels (Classified by the World Bank).
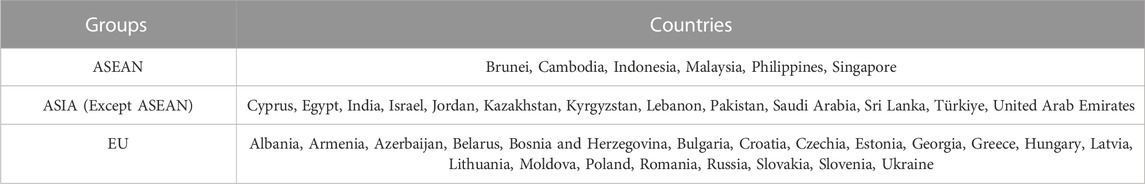
TABLE B1. List of countries by region.
Keywords: digital economy, green total factor productivity, energy transition, B&R, spatial regression
Citation: Wang A and Ren J (2023) The impact of the digital economy on green total factor productivity in Belt and Road countries: the mediating role of energy transition. Front. Environ. Sci. 11:1213961. doi: 10.3389/fenvs.2023.1213961
Received: 28 April 2023; Accepted: 23 June 2023;
Published: 06 July 2023.
Edited by:
Vikas Kumar, Birmingham City University, United KingdomReviewed by:
Elkhan Richard Sadik-Zada, Ruhr University Bochum, GermanyMihaela Simionescu, University of Bucharest, Romania
Copyright © 2023 Wang and Ren. This is an open-access article distributed under the terms of the Creative Commons Attribution License (CC BY). The use, distribution or reproduction in other forums is permitted, provided the original author(s) and the copyright owner(s) are credited and that the original publication in this journal is cited, in accordance with accepted academic practice. No use, distribution or reproduction is permitted which does not comply with these terms.
*Correspondence: Anqi Wang, YW5nZWx3YW5nMTk5MUBobnUuZWR1LmNu