
94% of researchers rate our articles as excellent or good
Learn more about the work of our research integrity team to safeguard the quality of each article we publish.
Find out more
ORIGINAL RESEARCH article
Front. Environ. Sci., 07 August 2023
Sec. Interdisciplinary Climate Studies
Volume 11 - 2023 | https://doi.org/10.3389/fenvs.2023.1212211
This article is part of the Research TopicFood-Energy-Water Systems: Achieving Climate Resilience and Sustainable Development in the 21st CenturyView all 21 articles
 Jiaqi Zhang1
 Mengye Chen1
 Shang Gao1
 Zhi Li1
 Charles J. Vörösmarty2,3,4*
 Balazs Fekete2,3
 Ariel Miara2
 Yang Hong1*
As one of the components comprising food-energy-water systems (FEWS), the energy sector, especially electricity production, is intimately connected to water. Climate extremes-related impacts on water resources will directly affect the interdependence of water, food, and energy. A better understanding of the extent of climate impacts on energy sector and the options to improve water-energy security are needed for planning an overall resilient FEWS. Therefore, we are motivated to examine the climate stress on the thermoelectric power supply using the Water Balance Model coupled with Thermoelectric Power & Thermal Pollution Model (WBM-TP2M), which can simulate water-energy linkages at the power plant, river reach, and regional scales. Using the Midwest (MW) and Northeast (NE) regions as our study area, we design a group of single- and multi-factor experiments both for historical climate period (1980–2019) and a case where we create a series of intensified extremes (2010–2019). The results show that power generation over the two regions features a gradually increasing trend in the past four decades, while, in contrast, thermal pollution has been decreasing steadily since 2005. Heat waves created temporary dips in the generation of electricity and peaks of heavily thermal-polluted stream length. The experiments reveal the significant role of cooling towers in reducing thermal pollution without losing much capacity to generate power, one important measure of resilience against climate extremes. Constraints placed on effluent temperature from the Clean Water Act lead to interrupted operations, which reduces (up to 20%) power generation, increases sensitivity to climatic extremes, but only show a small reduction in thermal pollution. Coal, as a fuel source, is subject to low thermal efficiency and high-water demand, which results in clearly decreased power generation. Overall, our findings suggest that replacing a less thermal-efficient fuel mix and environmentally destructive once-through cooling can move the energy sector towards several beneficial outcomes. Chief among these is a more efficient power production system that uses less water and does so while fostering clean, less carbon-intense technologies (e.g., combined gas cycle turbines, cooling towers, renewable energy), thus linking positive outcomes that simultaneously and positively impact aquatic ecosystems, regional airsheds and human health.
Food, energy, and water resources are essential for the benefit of human wellbeing and sustainable development worldwide (UN General Assembly, 2015; Yuan and Lo, 2020). These three sectors are inextricably connected: water is necessary for both food and energy production; energy is needed for food preparation, water pumping for irrigation, and wastewater treatment, etc.; irrigation is required for biofuel production and food is a necessity in poverty reduction. As the two largest water consumers, energy and agriculture sectors may have unintended conflicts when available water is limited (Qin, 2021). In the United States, it is estimated that thermoelectric power accounted for about 48% of the total fresh surface-water withdrawals and irrigation accounted for about 31% as of 2015 (Dieter et al., 2018).
Thermoelectric power contributes 90% to the total production of electricity generated in the United States (DeNooyer et al., 2016). The thermoelectricity generation largely relies on the availability of water resources for cooling (Averyt et al., 2011; Miara and Vörösmarty, 2013; Van Vliet et al., 2016). Thermal power plants boil water to produce steam, which spins the turbines to generate electricity. Cooling is then conducted by withdrawing large volumes of water from surrounding water bodies, e.g., rivers, lakes, and oceans, to condense the steam back to water so it can be returned to the electricity generation cycle (Fleischli and Hayat, 2014). Two common methods for cooling, once-through and recirculating systems, utilize water in different ways. Recirculating cooling systems withdraw relatively less but consume more water (Macknick et al., 2011; Fleischli and Hayat, 2014), since the water is recirculated and evaporated from cooling towers instead of being discharged back to source waters. Once-through systems consume a relatively small amount water but withdraw a high volume of flow from rivers and lakes. A report by the National Renewable Energy Laboratory (NREL) shows that once-through cooling technologies withdraw 10 to 100 times more water per unit of electric generation than recirculating cooling technologies (Macknick et al., 2011). Another drawback of once-through cooling is the thermal pollution generated when water is discharged back to rivers, lakes, and coastal oceans at higher temperatures that may induce degradation of aquatic ecosystems in the receiving waters (Stewart et al., 2013; Fleischli and Hayat, 2014).
The Earth’s climate is changing rapidly, and extreme climate events are becoming more frequent with higher intensity and lasting longer in recent decades (Peterson et al., 2013; Wuebbles et al., 2014; Wuebbles, 2018; Pörtner et al., 2022). These climate extremes, especially heat waves and droughts, inevitably have impacts on water resources, which poses a particular challenge to thermoelectric power generation requiring sufficient cooling (Förster and Lilliestam, 2010; Van Vliet et al., 2012; Barton and Chester, 2015; DeNooyer et al., 2016). Heat waves can cause ambient river temperatures to rise. Because water temperature plays a vital role in shaping the overall health of aquatic ecosystems (Caissie, 2006), it is crucial to manage and prevent the negative impacts of temperature increases on ecosystem dynamics. Therefore, when river temperature has already been elevated by heat waves, there would be less capacity for cooling systems to take effect, leading to the reduced efficiency of power generation (Miara et al., 2018).
During droughts, the stream water flow/volume can be too low for thermoelectric power plants to withdraw for cooling (McCall and Macknick, 2016). What’s more, the limited water available in drought years will inevitably lead to competition between irrigation and energy sectors (Hightower and Pierce, 2008). Failure to consider the sensitivity of water allocation/usage by agriculture and energy under extreme weathers may threaten regional food and energy security. In the future, food, water and energy all will likely be in higher demand as the United States population is projected to grow from 317 to 400 million by 2050 (US Census Bureau, 2012). This, in turn, induces conflict between the energy sector and other water-demanding sectors (e.g., irrigation) as well as with the environmental needs of inland aquatic habitat protection.
Power plants must operate according to policies and regulations, which could also face unprecedented changes in the future. Even today, power plants with once-through cooling are especially vulnerable under the drought and extreme heat weather conditions with increased incidences of shutdowns and curtailments (EPA, 2001; Miara et al., 2018). The warm and dry summers that occurred three times within the single decade of the 2000’s (2003, 2006, 2009) affected many European countries (Förster and Lilliestam, 2010; Van Vliet et al., 2012) and several thermoelectric power plants had to curtail output or shut down (Elash, 2007; Kanter, 2007; Förster and Lilliestam, 2010). A drought event occurred in 2007 caused less power generation due to the shutdowns and curtailments of several thermal generators in the Southeast United States, arising from a lack of surface water for cooling and environmental restrictions on thermal effluents (Kimmell et al., 2009; Macknick et al., 2011; Van Vliet et al., 2012). The Environmental Protection Agency (EPA) enforces Clean Water Act limitations on the temperature of return water discharged by power plants, particularly when background river temperatures are high, to protect aquatic wildlife (EPA, 1988). The river temperature regulation is different for each state and is contingent upon factors such as the local habitat and species, as well as the season for each region. For example, the absolute temperature limits for river/lake within the United States Northeast and Midwest regions range from 28.3°C to 32.3°C during summertime. When river temperatures approach the compliance thresholds because of thermal effluents, power plants are forced to reduce their thermal load and thus their electricity output. Therefore, power generation becomes particularly sensitive near or exceeding threshold temperature defined in the Clean Water Act.
The United States thermoelectricity sector is driven by the evolution of technology and policy while impacted by the changing climate. At present, the effects of extreme climate conditions on thermoelectric power systems are not fully understood, especially when combined with technology and policy. During climate extremes (e.g., heat waves and droughts), the tradeoff between power generation and thermal pollution becomes evident–it is more difficult to generate more power with less pollution. Previous research focuses more on individual generators (e.g., Förster and Lilliestam, 2010), and some assess the reliability of power supply under future projections (Van Vliet et al., 2012; Bartos and Chester, 2015; Van Vliet et al., 2016; Miara et al., 2017). Without a regional-level analysis of climate extremes impacts on power production and thermal pollution, the assessment of vulnerability to climate change remains incomplete.
To this end, this study applies a spatially distributed hydrologic model (Water Balance Model) coupled to a Thermoelectric Power and Thermal Pollution Model (WBM-TP2M) to simulate electricity production dependent upon the available water resources residing in river corridors across two large mega-regions (Midwest and Northeast of U.S). The objectives of this study are to: (1) investigate the retrospective power generation and thermal pollution during summertime and assess the impact of major climate extreme events (heat wave and drought) in the past four decades, (2) evaluate the technology and policy impacts on power generation and length of streams exceeding the violated thermal limits, and (3) examine whether policy and technology can contribute to climate resiliency in extreme events (heat wave and drought). The study is part of a larger study on the Climate-induced Extremes on Food, Energy, Water Systems (C-FEWS) and the Role of Engineered and Natural Infrastructure (Vörösmarty et al., 2023a; Vörösmarty et al., 2023b) that examines the interactions of the food, energy, and water components in the study area for a range of experiments.
The paper is organized as follows. Section 2 describes the methodology including the study area, model and data utilized, designed scenarios and experiments, and evaluated variables and equations. Section 3 summarizes the results from the multiple experiments. We conclude in Section 4 with discussions and insights gained from this study and proposed next steps in the research.
This study focuses on the United States Midwest (MW) and Northeast (NE) macro-regions, which includes Iowa, Illinois, Indiana, Michigan, Minnesota, Missouri, Ohio, Wisconsin, Connecticut, District of Columbia, Delaware, Massachusetts, Maryland, Maine, New Hampshire, New Jersey, New York, Pennsylvania, Rhode Island, Vermont, and West Virginia. The study area has 444 thermal power plants that require cooling water and thereby generate riverine thermal pollution. About 84% (by number) of these are traditional power plants powered by coal (44%), natural gas (27%), and oil (13%), 8% being biopower plants, and 8% being nuclear plants according to EIA records (EIA, 2022a). The spatial location and distribution of the power plants is displayed in Figure 1.
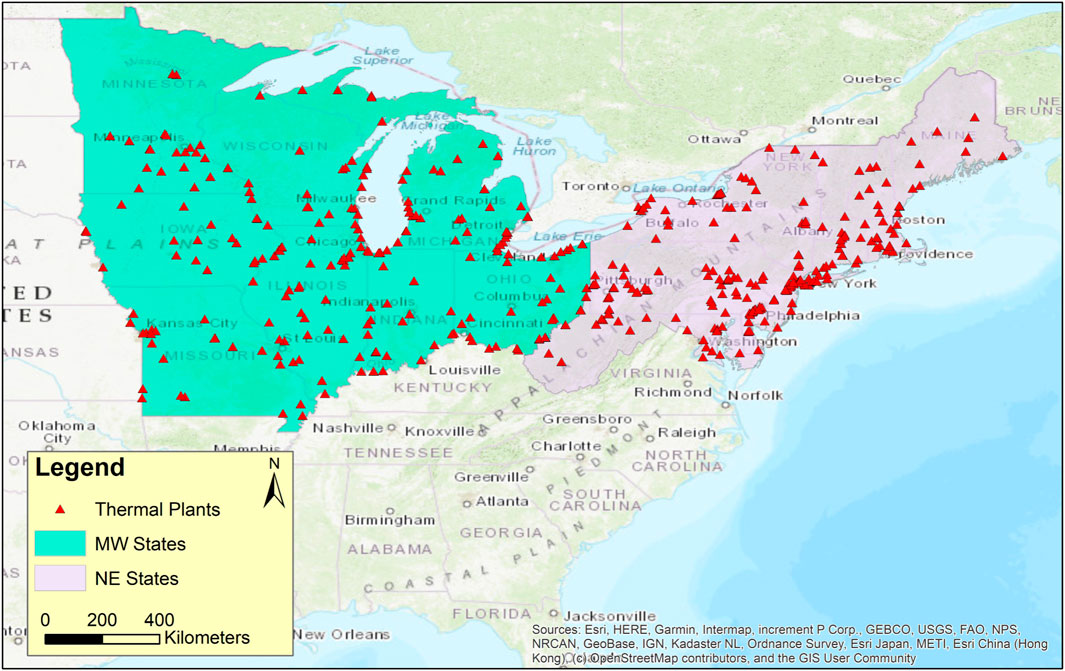
FIGURE 1. The study area and the power plant distribution of Midwest (MW) and Northeast (NE) regions of the United States.
To conduct our study, we utilize the coupled Water Balance Model and Thermoelectric Power and Thermal Pollution Model (WBM-TP2M) (Miara and Vörösmarty, 2013; Stewart et al., 2013) within the C-FEWS (Climate-induced Extremes on Food, Energy, Water Systems) modeling framework (Vörösmarty et al., 2023a) to simulate the power plant operations and thermal effluents. The water balance/transport model (WBM) was first introduced by Vörösmarty et al. (1989; Vörösmarty et al., 1997) and modified over time by Wisser et al. (2010a, 2010b). WBM computes the water balance through a soil water budget model, transforming precipitation and potential evapotranspiration into soil moisture, evapotranspiration, surface and subsurface runoff. Surface water is routed by Muskingum-Cunge to calculate the river-reach-level discharge. Coupled with WBM, the thermoelectric power and thermal pollution model (TP2M) developed by Miara and Vörösmarty (2013) can quantify the thermal effluents and estimate efficiency losses of electricity generation. With heat exchange calculation and multiple operational and regulatory constraints, WBM-TP2M computes river temperature changes at the downstream of each thermal power plant (Miara and Vörösmarty, 2013; Stewart et al., 2013).
Compared with previous studies focusing on thermoelectric sector and water resources (Vassolo and Döll, 2005; Förster and Lilliestam, 2010; Roy et al., 2012; Van Vliet et al., 2012), WBM-TP2M not only incorporates fuel type and cooling technology at each power plant, but also considers climatic and hydrological impacts on power plant operations (Miara and Vörösmarty, 2013). In addition, WBM-TP2M is well documented and has been used to examine the interactions among electricity production, cooling technologies, ecosystem services, and climate change (e.g., Miara et al., 2013; Stewart et al., 2013; Miara et al., 2017; Miara et al., 2018). Therefore, WBM-TP2M is suitable for this study with systematic calculations of engineered power production, cooling water withdrawal, water consumption, and water discharged back to receiving waters based on electricity demand.
The simulations are conducted at a daily time step with 0.05° latitude/longitude (approximately 5-km) river network spatial resolution to provide unique operating conditions at each power plant. Historical climate forcings including precipitation, wind speed, specific humidity, air temperature, air pressure, and shortwave radiation from 1980 to 2019 drive the WBM-TP2M are from the North American Land Data Assimilation Phase 2 (NLDAS-2) (Xia et al., 2012a; Xia et al., 2012b). Power plant characteristics including the capacities, fuel types and cooling technologies are from the Energy Information Administration (EIA, 2022a). Electricity demand is downloaded from EIA monthly electricity generation data (EIA, 2022b) and then averaged to a daily time step to serve as input to the model. Thermoelectric power plants that withdraw cooling water from the coastal waters (i.e., Atlantic Ocean for the NE region) are not included in this study.
To investigate how technology, policy, and extreme climate events influence power generation and thermal pollution, six scenarios are designed as single and multi-factor experiments as shown in Table 1. The Baseline scenario reflects the recorded inputs of climate, technology, and management, including the geospatial positioning of power plants (i.e., which ones are located upstream of others, thereby generating potential plant-to-plant interferences in terms of thermal impacts and consumption of water) (Miara et al., 2018). The Baseline-NI scenario assumes each power plant is operated separately and the upstream plants do not have impacts on downstream plants. The difference in river temperature between Baseline and Baseline-NI scenarios can quantify thermal pollution levels. The Clean Water Act (CWA) scenario applies a strict interpretation from CWA Section 316(a) (EPA, 1988) to the Baseline scenario, and state-defined thresholds are used in the model to limit the increased river temperature from power plants, resulting in curtailments of power output. The Cooling Tower (CT) scenario aims to establish a foundational condition where cooling tower technology is uniformly implemented in all thermal power plants with electricity production increasing throughout the years (i.e., new plants come online with only recirculating cooling towers). The Fixed Coal Fuel (Fixed-CF) scenario represents a control experiment setting to fix the fuel type, which assumes only coal and no new fuel sources (e.g., natural gas combined cycle) have been added to power stations, but other characteristics like cooling technology and power plants number appear as they did in the historical period (1980–2019) record. The extreme climate scenario is designed for the last decade of the time series (2010–2019) with intensified extreme events. This scenario is a hypothetical condition which creates a synthetic time series with an increased frequency of extreme years (Vörösmarty et al., 2023a). In contrast to the historical climate, the intensified climate represents the potential future change on the extremes; and the 10-year simulation (2010–2019) is carried out to examine the regions’ near-current capability to meet the future climate challenges. It should be noted that the design of these six scenarios is intended to help us better understand regional-scale dynamics, instead of creating the actual, on the ground (or day-to-day) management.
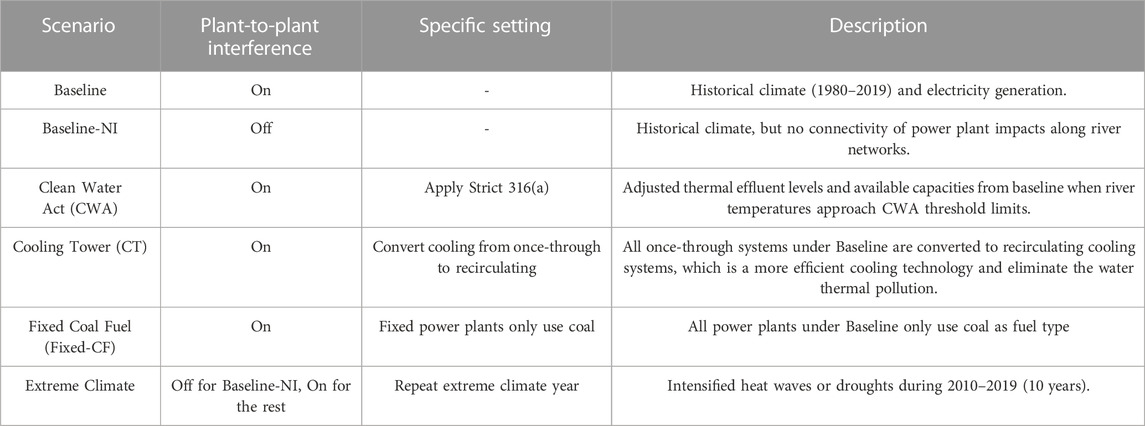
TABLE 1. Modelling scenarios with specific settings and descriptions.
During the study period of 1980–2019, there were multiple extreme heat wave and drought events happened. These climate events are identified for early, middle, and late of the experiment period in both MW and NE regions. For each climate event, a total five-year period is selected containing 2 years before and after the extreme climate year (Vörösmarty et al., 2023a). The selected event years and their corresponding five-year periods are listed in Table 2.
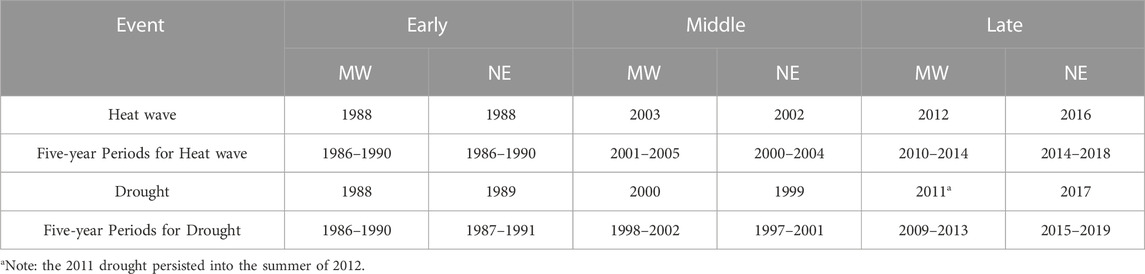
TABLE 2. Event year for heat waves and droughts in MW and NE with their five-year analysis periods (2 years pre/post) (Vörösmarty et al., 2023a).
In order to investigate how technology, land use, management/regulations influence FEWS performance when confronted with a decade of more intense climate challenges, we use years of 2010–2019, i.e., the first decade before we actually go into the future, to generate climate extremes (Vörösmarty et al., 2023a). The scenarios of intensified heat waves or droughts are created using the identified event year with two subsequent years (e.g., MW heat wave year 2012, with 2013 and 2014) to replicate this 3-year period three times commencing in 2010. As a result, the climate from 2012 to 2014 (2011–2013) for MW and 2016–2018 (2017–2019) for NE triple their frequency of occurrence to represent the intensified heat wave (drought) conditions. Under the intensified climate, the hydrological systems of MW and NE are thus expected to experience three strong heat waves (droughts) in the last decade of the study period. The demonstration of the climate intensification for heat wave is displayed in Figure 2.

FIGURE 2. The demonstration of the creation of intensified heat wave climates.
Compared with the climate model downscaling products, the current applied scheme for generating extremes allows us to solely increase their frequency with unchanged intensity (or magnitude), which helps to isolate the impact purely due to more occurrences of extremes. Another issue with climate downscaling products for historical study is the need of postprocessing the simulation (form climate model) to eliminate/minimize uncertainties from simulation performance (mismatch with observed climate). With all factors considered, we determined it reasonable to apply the current scheme of generating climate extremes in this study.
This study focuses on summer months (June, July, and August) when electricity generation is at its peak and river temperatures are warmest. Two variables are analyzed and discussed: electricity generation (TW-hr) and thermal pollution (km). Thermal pollution is calculated by subtracting the river temperatures in Baseline-NI (as if no thermal pollution) from Baseline, CWA, CT, Fixed-CF scenarios at grid scale and then quantified by the length of river (km) with an increase in river temperature resulting from thermal effluents (i.e., water discharged back by power plants). To conduct analysis of technology (fuel mix, cooling technology), policy/management (CWA), and extreme climate (repeated heat wave and drought) impacts, this study uses the following equations as shown in Table 3.
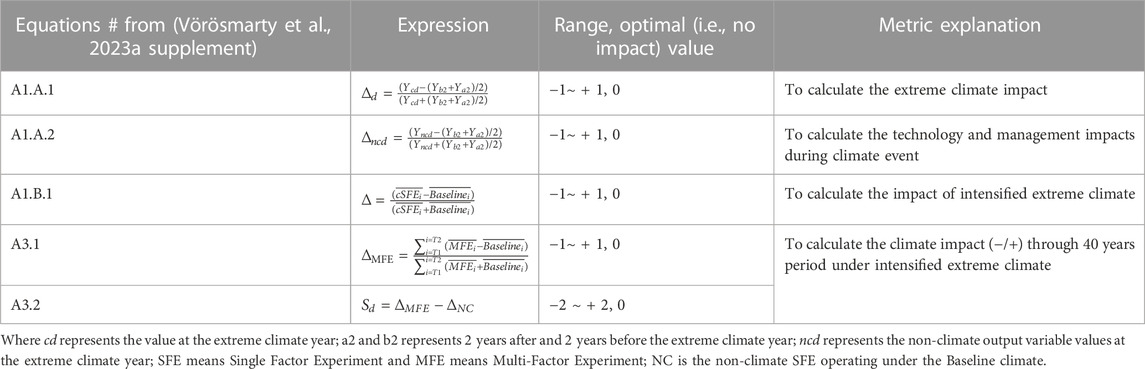
TABLE 3. DELTA (sensitivity) metrics.
Figures 3A, B show the time series of simulated power generation during summer from 1980 to 2019 for different scenarios in MW and NE regions. During the historical period, we highlight both drought and heat wave events for each region (event year can be found in Table 2). Note that overlaps between heat wave and drought periods occur often over the past four decades. The Baseline scenario is intended to represent a historic baseline throughout the 40-year period (green) using the WBM-TP2M model. As expected, the energy production is negatively impacted by the heat wave in most of the cases, except the middle period heat wave for NE (2000–2004) and MW (2001–2005) regions. This time period overlaps the economic expansion period after the 2000 US recession while the information technology (IT) was intensively adapted (Fernald and Wang, 2015), and the increases of electric power demand (accompanying production) dilute the impact from the extreme heat wave. This hypothesis will be further discussed in the next chapter.
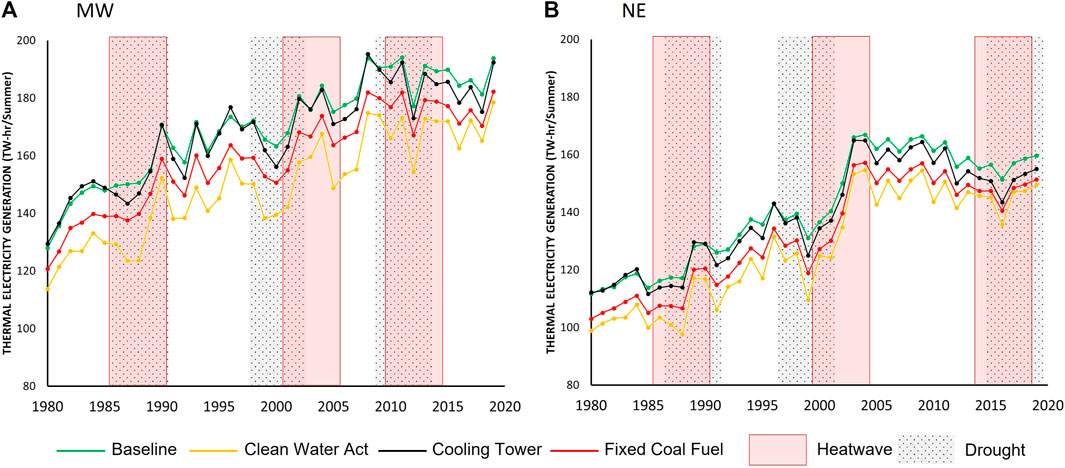
FIGURE 3. Electricity generation during summertime (June, July, and August) for different scenarios (Baseline, CWA, CT, and Fixed-CF) under the historical climate from 1980 to 2019 in (A) Midwest (MW) region and (B) Northeast (NE) region with the highlighted heat wave and drought periods. The analysis is operating on climate Approach A (Table 3).
The CT scenario reduces power production slightly relative to Baseline, meaning changing towards the recirculating cooling technology does not have a big influence on power production. The recirculating cooling tower will consume more power, which can lower the output from single power plant. However, this reduction may be offset by minimizing river temperature impact to sustain/improve the efficiencies and power productions by downstream plants. Fixed-CF produces much less electricity compared to Baseline, indicating the fuel mix that optimizes the heat content from the fuels plays an important role on total power production. Compared with others, the CWA scenario generates the least power because it controls the upper limit of river temperature, leading to curtailments in power generation from once-through facilities whenever the river temperature reaches to a certain threshold. These scenarios establish important new foundational conditions for energy production and reflect the price to be paid without historical technology development.
To better assess the impact of climate extremes alone and the compound effects of climate and other factors, we use Equations A1.A.1 and A1.A.2 (Table 3) to calculate the Δ (sensitivity) metrics for power generation. As shown in Figures 4A, B, the heat wave and drought events overall have the expected negative impact on electricity production for all scenarios (Baseline, CWA, CT, and Fixed-CF). Compared to the non-extreme event year (2 years before and 2 years after the extreme climate event), natural river temperatures are higher during the heat wave, the intake water for cooling system is too warm to effectively cool the turbines and the energy production would further be reduced due to the overly warm effluent, which could pose threat to the downstream ecosystem. Note that exceptions of positive Δ can be found in 2003 heat wave in MW, 2011 drought in MW, and the 1989 drought in NE, which are likely due to complex of several factors as later discussed in Section 4.1.
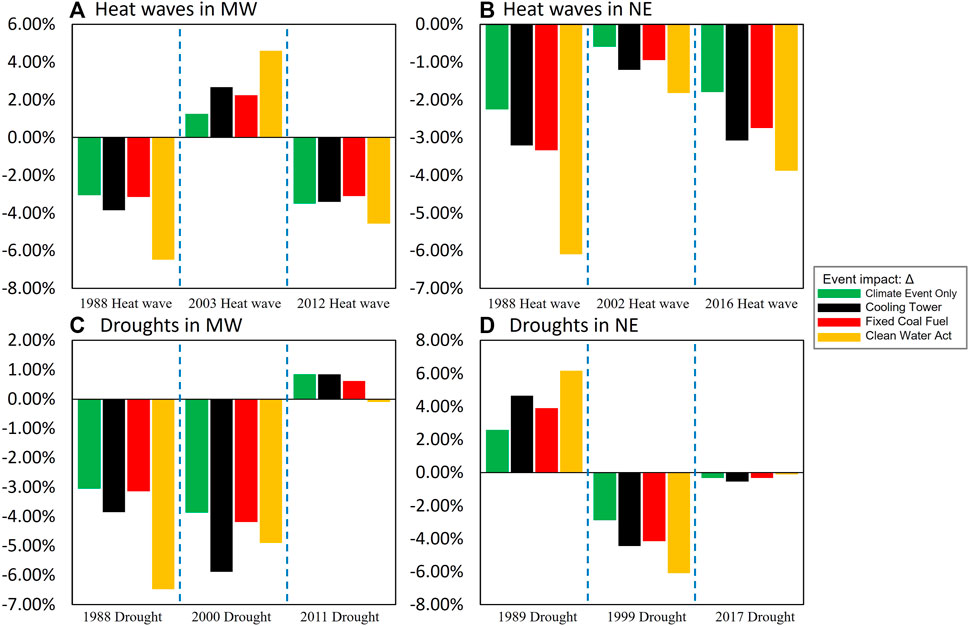
FIGURE 4. Δ (sensitivity) results of electricity production for each climate extreme: (A) heat wave events in MW, (B) heat wave events in NE, (C) droughts in MW, and (D) droughts in NE.
For both heat wave and drought events, the Baseline (climate event only) scenario exhibits in general the least adverse impact (green bar). In comparison, the additional energy consumption by cooling towers (CT scenario) in most cases leads to more impacts from climate extremes (black bar), since the warmer water requires more energy to cool the plants. The Fixed-CF scenario (red bar) shows slightly less impact than the CT; one of the reasons for this result is that the coal-only fuel input generates less power overall, which exerts less heat than Baseline and CT, consequently leading to less heat being transferred to the river system, with therefore less reduction in power output during heat waves. In the CWA scenario, the threshold of effluent temperature forces curtailment of power generation and shutdowns, i.e., minimal power output, which can be longer and more frequent during heat wave events than normal.
Figure 5 illustrates the monthly mean length (km) of stream where thermal effluents cause 1°C–3°C (1 < TP < 3) and larger than 3°C (TP > 3) increases in river temperature. In the first (1986–1990) and the third (2010–2014) heat wave periods, the proportion of stream length with TP > 3 show local peaks, meaning more river length becomes heavily thermal-polluted. It is also found that the total thermal polluted (TP > 1) stream length starts to decline since 2010 for both MW and NE regions. This is due to the increasing implementation of cooling towers and dry cooling systems installed together with new power plants in the last decade (EIA, 2022a). Not only is the total polluted stream length reduced, the stream length with TP > 3 also decreases in relative to stream length with 1 < TP < 3; in MW region, the latter even surpasses the former in 2017 for the first time in near 30 years.
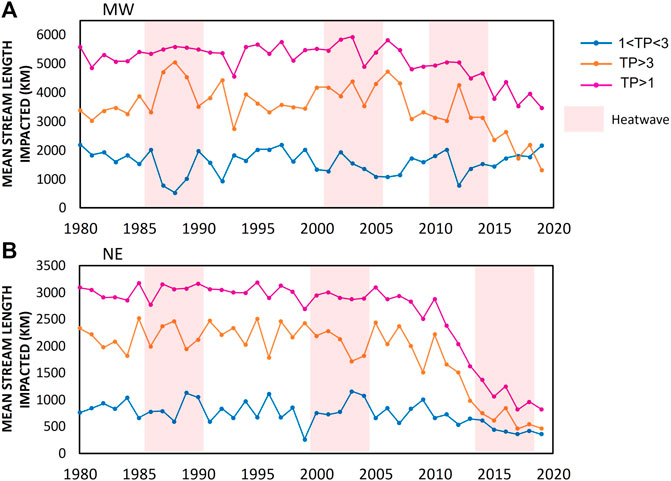
FIGURE 5. Stream length of various thermal-polluted levels (1<TP < 3, TP > 3, and TP > 1) during summertime for Baseline with heat wave periods highlighted for (A) MW region and (B) NE region.
Figure 6 shows the total thermal pollution (TP > 1) in river length for the four scenarios (Baseline, CWA, CT, and Fixed-CF). Over the four decades, the CWA and the CT scenarios show consistently lower thermal pollution than the Baseline. However, we find the thermally polluted stream length (km) in CWA to be highly correlated with that in the Baseline scenario but with a slight lower magnitude. In contrast, the CT scenario shows a significant, unconditional reduction in thermal pollution in both regions, which is nearly one-order of magnitude (or more than 90%). In the CWA scenario, the power plant operation is constrained by a river temperature threshold, allowing thermal pollution up to a state-defined threshold (modeled). The CT scenario, on the other hand, features a technology update of the recirculating system which fundamentally reduces effluent temperature and yields the expected result of a considerably reduced thermal pollution when uniformly adopted by all plants. It is noteworthy that the total thermal pollution declines after 2010 for the Baseline, CWA, and Fixed-CF scenarios due to the fuel mix moving away from less efficient coal-fired stations and toward more efficient systems (i.e., combined gas cycle turbines) and where most of the new power stations are outfitted with recirculating cooling towers (EIA, 2022a).
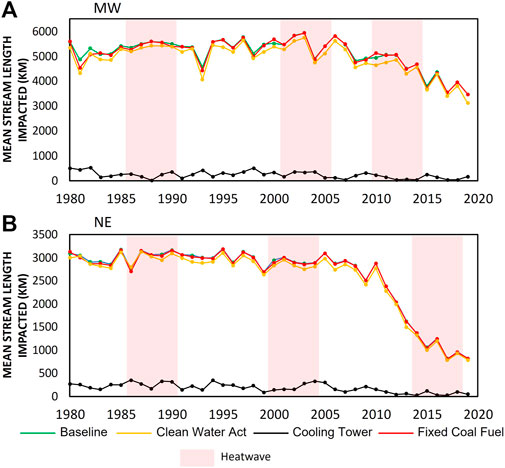
FIGURE 6. Stream length of thermal pollution with river temperature increased large than 1 Celsius degree (TP > 1) during summertime for different scenarios with heat wave periods highlighted for (A) MW region and (B) NE region.
Under the intensified climate (heat wave and drought), we conduct experiments depicting the impact of the Clean Water Act (CWA), changing once-through to cooling tower technology (CT), and fixing fuel mix to coal-fired (Fixed-CT) to investigate system responses from more frequent climate extremes. These experiments consist of three multi-factor experiments (MFEs) — the repeated climate extremes plus CWA, climate extremes plus CT, and climate extremes plus Fixed-CF.
Figure 7 shows the electricity production of these three scenarios under the intensified heat waves in addition to the Baseline scenario under the historical climate (green line, same as Figure 3). For both MW and NE, the intensified heat waves have negative impacts on power production associated with all three regional time series of policy/technology scenarios. Similar to the Baseline simulations, the CWA scenario generates the least electricity. The CT, on the other hand, consistently outperforms the Fixed-CF and CWA scenarios on power production. Such stability from CT indicates at least some capacity to counteract more frequent negative impacts from the heat wave.
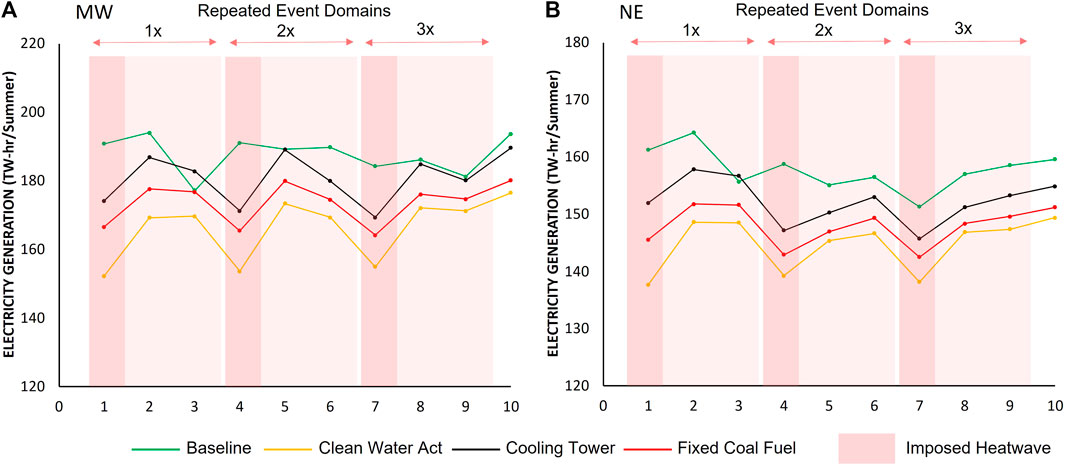
FIGURE 7. Thermal power production of different scenarios (CWA, CT, and Fixed-CF) under intensified heat waves and Baseline under historical climate for (A) MW region and (B) NE region.
Overall, the thermal pollution timeseries reveal interesting system sensitivities that are technology dependent. Figure 8 shows the time series of thermal pollution (TP >1) under the intensified heat wave period. As expected, the CT scenario eliminates virtually all thermal pollution. The Baseline, Fixed-CF, and CWA scenarios all show progress with the same (improving) trend discussed above for Approach A—more efficient and less thermally polluting technologies are implemented in the final decade of the 40-year historical period. In MW region, Fixed-CF and CWA show relatively higher sensitivity to the heat waves, with peaks corresponding to the three imposed heat wave years.
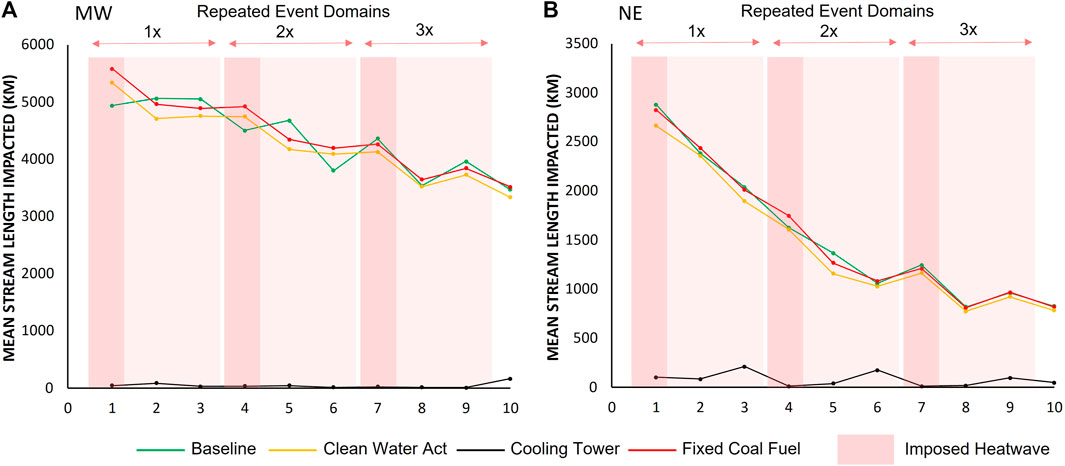
FIGURE 8. Thermal pollution of different scenarios (CWA, CT, and Fixed-CF) under intensified heat waves and Baseline under historical climate for (A) MW region and (B) NE region.
Table 4 summarizes the Δ values (Equation A3.1) indicating the overall impacts (climate extreme plus the single factor considered) and Sd values (Equation A3.2) representing climate-only effects on power production and thermal pollution, including the intensified climate scenarios and the historical climate change over the 40-year period. As indicated by ΔMFE, the intensified climate extremes exert the strongest impacts relative to the Baseline simulation under CWA scenario followed by Fixed-CF and then CT, which applies to both power production and thermal pollution. The sheer effect from the intensification of climate extremes (Sd) is accounted for by removing ΔNC term, i.e., the non-climate SFE analog operating under the Baseline climate, from ΔMFE. The Sd term also measures the importance of the non-climate factor in overriding (or accentuating) the impact of the climate extreme (heat wave in this case). Here, even though we see the greatest relative impact (quantified by ΔMFE) assigned to CWA, it is almost of the same level of importance in determining power production with cooling technology and fuel mix type, demonstrated by CT and Fixed-CF scenarios.
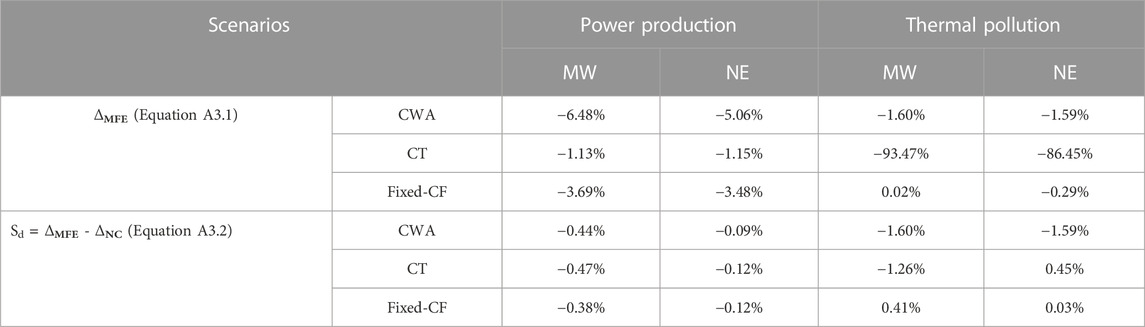
TABLE 4. Δ values for power production and thermal pollution with intensified heat wave climate for different scenarios.
Figure 9 shows similar results to Figure 7 but with imposed climate event switched to drought. The impact during the event year (the vertical bars) fails to become evident, but local minima are seen in the year immediately following the event. This is due to limitation in the design of the climate scenario, where a heat wave event occurs in the second year of the three-year window and its impact on power generation overwhelms the drought. To more comprehensively analyse the impact from drought, future studies could allow the selection of a time period with only drought as the climate event.
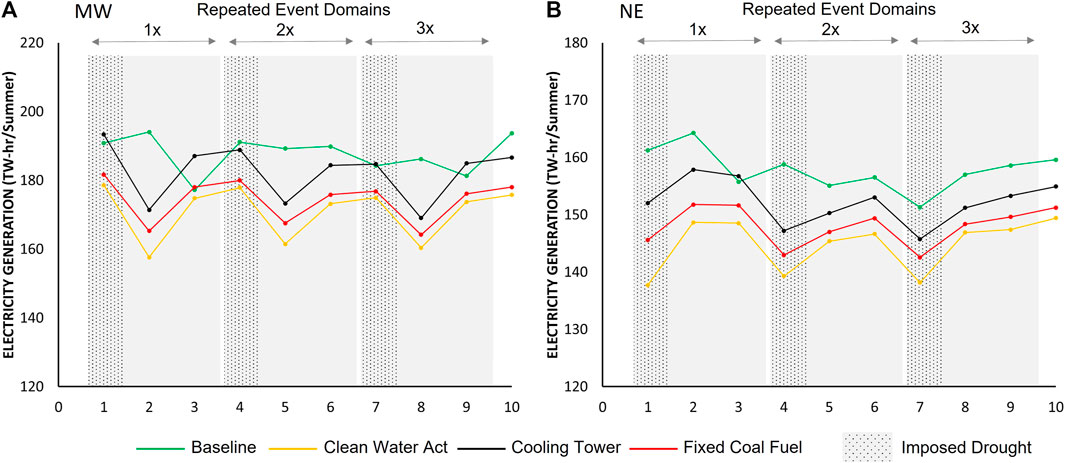
FIGURE 9. Thermal power production of Baseline and different scenarios (Climate, CT, CWA, and Fixed-CF) under intensified drought climate for (A) MW region and (B) NE region.
Overall, the intensified climate (repeated heat wave) causes the reduction of power generation and increase of river thermal pollution. Moreover, the management and technology factors cause more reduction of power generation compared to the pure heat wave impact. In this study, the strict application of CWA provides the worst-case scenario for power production, where it is cut by 12% and only minimal (4%) thermal pollution is reduced. The cooling technology upgrade is the most desirable scenario from the standpoint of thermal pollution, as it is reduced to minimum with the loss of only marginal power production.
As the largest segment of United States electricity production, thermoelectric power generation is vulnerable to climate change and extreme weather conditions (Carter, 2010; Schaeffer et al., 2012; Van Vliet et al., 2012; Bauer et al., 2014; Van Vliet et al., 2016; Miara et al., 2017). During heat wave and drought conditions, the optimal capacity of power plants may not be attained due to high temperature and insufficient streamflow (Bartos and Chester, 2015). Together with population growth and high electricity demand in summer, this climate-induced capacity reduction poses a great challenge to energy security. A better understanding of the climate extremes on power production and mitigating thermal pollution, as well as options for improving climate resiliency of water-energy systems, is critical for building a sustainable and environment-friendly future.
For practical implications, the outcome from this work can be incorporated into decision-making processes of regional land-use planning and environmental legislation. For instance, the on-going outreach with the stakeholders in our study region is intended to inform the policymakers about the importance of planning variables (e.g., landscape and water use scenarios, choice of power sector technologies) when facing the climate extreme challenges; and they have recognized the capacity of WBM-TP2M to map the thermal impacts by thermoelectric power plants (Vörösmarty et al., 2023a).
The Baseline simulation using WBM-TP2M under the historical climate essentially analyzes the importance of the changes in technology and climate over the past four decades on the thermoelectricity supply. In terms of power generation (Figure 3), a gradual, steady increasing trend that is relatively insensitive to the extreme climate events can be found in both regions driven by a growing demand (EIA, 2022a). On the other hand, thermal pollution (Figure 5) stays relatively unchanged before 2005 and has been decreasing ever since. This distinct change is due to the improved efficiency of thermal plants (i.e., combined gas cycle turbines) and replacement of recirculating cooling systems at new power stations (EIA, 2022a). Moreover, deployment of renewable energy (i.e., wind and solar), which replaces the demand for thermoelectric power, also contributes to reducing the thermal pollution and this trend is expected to continue (Jacobson, 2009; Miara et al., 2019). Climate extremes, i.e., heat waves and droughts, impose temporary reductions in electricity generation (Figure 3) and produce rapid increases in heavily polluted stream reaches (TP > 3 in Figure 5), which allows us to infer resilience by examining the duration and magnitude of impact. The overall negative impact from heat wave events on power generation (Figure 4) is mixed with several positive Δ values due to the following possible reasons. First, the overlap of heat wave and drought shift the local minima away from the event year. Second, the 2-year window (Equations A1.A.1 and A1.A.2) subjectively applied in Δ’s formulations could differ from the real duration under which a system reacts to and then recovers from a climate extreme. For instance, a one-year window may have better captured the 2003 heat wave that we analyzed only during the summer over the MW. Third, the market demand for electricity may overpower the climate impact on power generation (Fernald and Wang, 2015), particularly when electricity can be imported from outside the affected region. Droughts in general also have a negative impact on power production. Exceptions are the 2011 drought in MW and the 1989 drought in NE, mainly due to the overlap with heat wave occurrence. In summary, the impact of climate extremes is identifiable with an overall loss of power generation near 5%, which indicates relatively reliable power supply even without technology development. This finding is similar to Miara et al. (2017), where their study showed the current power supply infrastructure in United States has significant adaptation potential to future warmer climates while maintaining energy security.
The technological evolution represented by growth in the use of cooling towers causes thermal pollution to be one 10th of the current level from the simulation scenarios (Figure 6). What’s more, such environmental benefits do not necessarily come at the cost of proportionally reduced generation capacity or resilience against climate extremes: only a slight decrease over the past 4 decades in the two regions (Figure 3). This small decrement reflects the combined effects of the following two potential factors. First, additional power is consumed to pump the water between the condenser and cooling towers, which is reported by EPA (2001) that the nameplate capacity will decrease by 2% when switching from once-through technologies to recirculating cooling. Second, the reduced turbine efficiencies due to the recirculating cooling system may be offset by minimizing river temperature impact to sustain the downstream plant power output efficiency.
The technology related to fuel type is represented by the coal-only scenario (Fixed-CF) in our study. Compared with the Baseline and CT scenario, Fixed-CF has the least power production, mainly because the coal-fired plants are less thermal-efficient and more water-demanding (Miara et al., 2018), resulting in less capacity compared to other fuel sources (i.e., natural gas, nuclear). In terms of thermal pollution, Fixed-CF shows similar impacts to the Baseline scenario. However, other externalities become important, for example, CO2 emissions by burning coal yielding adverse impacts on air quality and contributing to global warming (Sims et al., 2003).
A hardline limit on effluent temperature, represented by the CWA scenario, is subject to several drawbacks: the interrupted operation leads to a 20% reduction in power generation (Figure 3) and increased sensitivity to climatic extremes (Figure 4). The positive effect of reducing thermal pollution is also limited (Figure 6), because plants are allowed to operate just below the threshold effluent temperature. This demonstrates the limits of solely relying on policy tools to combat the challenges of growing electricity demand and climate change.
This study focuses on the Northeast and Midwest regions of United States, yet the methodology established can be applied and expaned to other areas in the United States because (1) the WBM-TP2M model is open-access and have been applied in Mississippi River basin (Miara et al., 2018) and Continental United States (Miara et al., 2017); (2) all data including forcing data and power plant information (Section 2.2) can be accessed freely for research. For applications in other parts of the world, the data needed for hydrologic simulations (precipitation, wind speed, etc.) can be replaced by gridded global datasets (e.g., GLDAS). The detailed power plants data including the capacities, fuel types and cooling technologies and electricity demand data need to be acquired and processed before implementing the WBM-TP2M model. Findings revealed by our study may not be the same for other regions because modeling results are generated by the unique combination of climate, land use, hydrology, and thermoelectricity sector in the study area. Future studies in other regions are encouraged to adopt the same methodology in order to evaluate the regional resiliency of thermal power production under climate extremes.
This study utilizes two indicators, i.e., electricity generation and thermally polluted river length for the analysis. Future studies could examine more indicators to provide additional perspectives on the sensitivity of power sector to climate extremes. For instance, changes in water quantity (volume or streamflow) are another aspect to assess the water constraints on power generation especially during drought conditions. Similar to high ambient river temperature, low streamflow will also have negative influences on the cooling systems of thermal power plants, subsequently reducing electricity generation. We expect the impact from drought, as revealed by river temperature here, could be more distinct and more clearly separated from heat waves, when change in streamflow is examined. Moreover, reduced water usage by implementing cooling towers (Stillwell et al., 2011) can be quantified by looking at the streamflow downstream of power stations. Adjusted available capacity (AAC) is another variable to evaluate in our future study, which accounts for losses or gains in thermal efficiencies due to the changes in environment (e.g., temperature in air and river, water availability, humidity). The ranges (lower and upper bounds) of AAC at plant and regional scale can provide insights into losses and gained of power generation capacity under different conditions (Miara et al., 2017). Spatial patterns of changes in streamflow, temperature, and capacities will also help identify vulnerable areas that would be heavily affected by climate extremes.
Also, we aggregate the original 5-km, daily output from the model to a regional scale and monthly time steps for all analyses in this study. While we consider the aggregation proper for this study, a valuable signal at finer spatial and temporal scale could be muted. For instance, analyses based on the original model output may reveal how upstream plants with cooling towers can help increase efficiency at downstream plants due to the lowered river temperature.
Overall, our analyses indicate relatively reliable power supply in Midwest and Northeast regions against extreme climate events, which can be considered in the decision-making process to strengthen regional preparedness for future climate change. Our finding underlines the critical role of fuel mix and cooling technologies, thus encourages the replacement of less thermal-efficient fuel mix and environmentally destructive once-through cooling systems moving towards more efficient, less water-intensive and clean technologies to ensure a sustainable water-energy system. The next phase of our study will incorporate a wider range of experiments to reveal more facets of the interconnections among sectors in the FEWS system.
The original contributions presented in the study are included in the article/supplementary material, further inquiries can be directed to the corresponding authors.
JZ, MC, and CV contributed to conception and design of the study. BF compiled and configured the model. AM provided guidance and suggestions for model simulations. JZ collected data and performed the model simulation. JZ, MC, SG, and CV analyzed results and conducted discussions. JZ, MC, SG, and ZL contributed to the first draft of the manuscript. CV and YH supervised the study. All authors contributed to the manuscript revision and approved the submitted version.
Financial support for this work was provided by the U.S. National Science Foundation’s Innovations at the Nexus of Food, Energy and Water Systems Program (INFEWS/T1 Grant #1856012).
We would like to thank Fabio Corsi for providing suggestions on data preparation for TP2M.
The authors declare that the research was conducted in the absence of any commercial or financial relationships that could be construed as a potential conflict of interest.
All claims expressed in this article are solely those of the authors and do not necessarily represent those of their affiliated organizations, or those of the publisher, the editors and the reviewers. Any product that may be evaluated in this article, or claim that may be made by its manufacturer, is not guaranteed or endorsed by the publisher.
Averyt, K., Fisher, J., Huber-Lee, A., Lewis, A., Macknick, J., Madden, N., et al. (2011). Freshwater use by U.S. power plants: Electricity’s thirst for a precious resource. A report of the Energy and Water in a Warming World initiative. Cambridge, MA, USA: Union of Concerned Scientists.
Bartos, M. D., and Chester, M. V. (2015). Impacts of climate change on electric power supply in the Western United States. Nat. Clim. Change 5 (8), 748–752. doi:10.1038/nclimate2648
Bauer, D., Philbrick, M., Vallario, B., Battey, H., Clement, Z., and Fields, F. (2014). The water-energy nexus: Challenges and opportunities. Washington, D.C., USA: US Department of Energy.
Caissie, D. (2006). The thermal regime of rivers: A review. Freshw. Biol. 51 (8), 1389–1406. doi:10.1111/j.1365-2427.2006.01597.x
Carter, N. T. (2010). Energy’s water demand: Trends, vulnerabilities, and management. Collingdale, Pennsylvania, USA: DIANE Publishing.
DeNooyer, T. A., Peschel, J. M., Zhang, Z., and Stillwell, A. S. (2016). Integrating water resources and power generation: The energy–water nexus in Illinois. Appl. Energy 162, 363–371. doi:10.1016/j.apenergy.2015.10.071
Dieter, C. A., Maupin, M. A., Caldwell, R. R., Harris, M. A., Ivahnenko, T. I., Lovelace, J. K., et al. (2018). Estimated use of water in the United States in 2015: U.S. Geol. Surv. Circ. 1441, 65. doi:10.3133/cir1441
EIA (U.S. Energy Information Administration) (2022a). Electricity form EIA-860. https://www.eia.gov/electricity/data/eia860/.
EIA (U.S. Energy Information Administration) (2022b). Electricity form EIA-923. https://www.eia.gov/electricity/data/eia923/.
Elash, A. (2007). Will France be caught with its plants down? The globe. http://www.theglobeandmail.com/servlet/story/LAC.20070622.NUKE22/TPStory/Environment.
EPA (U.S. Environmental Protection Agency) (2001). Technical development document for the final regulations addressing cooling water intake structures for new facilities EPA-821-R-1-36. https://www.epa.gov/sites/production/files/2015-04/documents/cooling-water_phase-1_tdd_2001.pdf.
EPA (U.S. Environmental Protection Agency) (1988). Temperature, water quality standards criteria summaries: Compilation of state/federal criteria. https://nepis.epa.gov/Exe/ZyPURL.cgi?Dockey=00001NPM.TXT.
Fernald, J. G., and Wang, B. (2015). “The recent rise and fall of rapid productivity growth,” in FRBSF Economic Letter, Federal Reserve Bank of San Francisco. Available at: https://ideas.repec.org/a/fip/fedfel/00044.html.
Fleischli, S., and Hayat, B. (2014). Power plant cooling and associated impacts: The need to modernize US power plants and protect our water resources and aquatic ecosystems. Nat. Resour. Def. Counc.,
Förster, H., and Lilliestam, J. (2010). Modeling thermoelectric power generation in view of climate change. Reg. Environ. Change 10 (4), 327–338. doi:10.1007/s10113-009-0104-x
Hightower, M., and Pierce, S. A. (2008). The energy challenge. Nature 452 (7185), 285–286. doi:10.1038/452285a
Jacobson, M. Z. (2009). Review of solutions to global warming, air pollution, and energy security. Energy Environ. Sci. 2, 148–173. doi:10.1039/B809990C
Kanter, J. (2007). Climate change puts nuclear energy into hot water. http://www.nytimes.com/2007/05/20/health/20ihtnuke.1.5788480.html?_r=1.
Kimmell, T. A., Veil, J. A., and Environmental Science Division, (2009). DOE/NETL-2009/1364. Argonne, IL United States: Argonne National Lab ANL. doi:10.2172/951252Impact of drought on U.S. steam electric power plant cooling water intakes and related water resource management issues
Macknick, J., Newmark, R., Heath, G., and Hallett, K. C. (2011), NREL/TP-6A20-50900. Golden, Colorado, USA: NREL.Review of operational water consumption and withdrawal factors for electricity generating technologies
McCall, J., and Macknick, J. (2016), NREL/TP-6A20-67084. Golden, Colorado, USA: NREL, Water-related power plant curtailments: An overview of incidents and contributing factors
Miara, A., Macknick, J. E., Vörösmarty, C. J., Tidwell, V. C., Newmark, R., and Fekete, B. (2017). Climate and water resource change impacts and adaptation potential for US power supply. Nat. Clim. Change 7 (11), 793–798. doi:10.1038/nclimate3417
Miara, A., and Vörösmarty, C. J. (2013). A dynamic model to assess tradeoffs in power production and riverine ecosystem protection. Environ. Sci. Process. Impacts 15 (6), 1113–1126. doi:10.1039/c3em00196b
Miara, A., Vörösmarty, C. J., Macknick, J. E., Tidwell, V. C., Fekete, B., Corsi, F., et al. (2018). Thermal pollution impacts on rivers and power supply in the Mississippi River watershed. Environ. Res. Lett. 13 (3), 034033. doi:10.1088/1748-9326/aaac85
Miara, A., Vörösmarty, C. J., Stewart, R. J., Wollheim, W. M., and Rosenzweig, B. (2013). Riverine ecosystem services and the thermoelectric sector: Strategic issues facing the northeastern United States. Environ. Res. Lett. 8 (2), 025017. doi:10.1088/1748-9326/8/2/025017
Peterson, T. C., Heim, R. R., Hirsch, R., Kaiser, D. P., Brooks, H., Diffenbaugh, N. S., et al. (2013). Monitoring and understanding changes in heat waves, cold waves, floods, and droughts in the United States: State of knowledge. Bull. Am. Meteorological Soc. 94 (6), 821–834. doi:10.1175/bams-d-12-00066.1
Pörtner, H. O., Roberts, D. C., Adams, H., Adler, C., Aldunce, P., Ali, E., et al. (2022). Climate change 2022: Impacts, adaptation and vulnerability. IPCC Sixth Assess. Rep.
Qin, Y. (2021). Global competing water uses for food and energy. Environ. Res. Lett. 16 (6), 064091. doi:10.1088/1748-9326/ac06fa
Roy, S. B., Chen, L., Girvetz, E. H., Maurer, E. P., Mills, W. B., and Grieb, T. M. (2012). Projecting water withdrawal and supply for future decades in the US under climate change scenarios. Environ. Sci. Technol. 46 (5), 2545–2556. doi:10.1021/es2030774
Schaeffer, R., Szklo, A. S., de Lucena, A. F. P., Borba, B. S. M. C., Nogueira, L. P. P., Fleming, F. P., et al. (2012). Energy sector vulnerability to climate change: A review. Energy 38 (1), 1–12. doi:10.1016/j.energy.2011.11.056
Sims, R. E. H., Rogner, H.-H., and Gregory, K. (2003). Carbon emission and mitigation cost comparisons between fossil fuel, nuclear and renewable energy resources for electricity generation. Energy Policy 31, 1315–1326. doi:10.1016/S0301-4215(02)00192-1
Stewart, R. J., Wollheim, W. M., Miara, A., Vörösmarty, C. J., Fekete, B., Lammers, R. B., et al. (2013). Horizontal cooling towers: Riverine ecosystem services and the fate of thermoelectric heat in the contemporary Northeast US. Environ. Res. Lett. 8 (2), 025010. doi:10.1088/1748-9326/8/2/025010
Stillwell, A. S., Clayton, M. E., and Webber, M. E. (2011). Technical analysis of a river basin-based model of advanced power plant cooling technologies for mitigating water management challenges. Environ. Res. Lett. 6 (3), 034015. doi:10.1088/1748-9326/6/3/034015
UN General Assembly (2015). Transforming our world: The 2030 agenda for sustainable development. A/RES/70/1. Available at: https://www.refworld.org/docid/57b6e3e44.html (Accessed October 10, 2022).
U.S. Census Bureau (2012). Projections and components of change for the United States: 2015 to 2060. Tech rep. Maryland, United States: U.S. Census Bureau.
Van Vliet, M. T., Wiberg, D., Leduc, S., and Riahi, K. (2016). Power-generation system vulnerability and adaptation to changes in climate and water resources. Nat. Clim. Change 6 (4), 375–380. doi:10.1038/nclimate2903
Van Vliet, M. T., Yearsley, J. R., Ludwig, F., Vögele, S., Lettenmaier, D. P., and Kabat, P. (2012). Vulnerability of US and European electricity supply to climate change. Nat. Clim. Change 2 (9), 676–681. doi:10.1038/nclimate1546
Vassolo, S., and Döll, P. (2005). Global-scale gridded estimates of thermoelectric power and manufacturing water use. Water Resour. Res. 41 (4). doi:10.1029/2004wr003360
Vörösmarty, C. J., Federer, C. A., and Schloss, A. L. (1998). Potential evaporation functions compared on US watersheds: Possible implications for global-scale water balance and terrestrial ecosystem modeling. J. Hydrology 207 (3-4), 147–169. doi:10.1016/s0022-1694(98)00109-7
Vörösmarty, C. J., Melillo, J. M., Wuebbles, D. J., Jain, A. K., Ando, A. W., Chen, M., et al. (2023b). Applying the framework to study climate-induced extremes on food, energy, and water systems (C-FEWS): The role of engineered and natural infrastructures, technology, and environmental management in the United States Northeast and Midwest. Front. Environ. Sci. 11, 186. doi:10.3389/fenvs.2023.1070144
Vörösmarty, C. J., Melillo, J. M., Wuebbles, D. J., Jain, A. K., Ando, A. W., Chen, M., et al. (2023a). The C-FEWS framework: Supporting studies of climate-induced extremes on food, energy, and water systems at the regional scale. Front. Environ. Sci. 11, 13. doi:10.3389/fenvs.2023.1069613
Vörösmarty, C. J., Moore, B., Grace, A. L., Gildea, M. P., Melillo, J. M., Peterson, B. J., et al. (1989). Continental scale models of water balance and fluvial transport: An application to South America. Glob. Biogeochem. cycles 3 (3), 241–265. doi:10.1029/gb003i003p00241
Wisser, D., Fekete, B. M., Vörösmarty, C. J., and Schumann, A. H. (2010a). Reconstructing 20th century global hydrography: A contribution to the global terrestrial network- hydrology (GTN-H). Earth Syst. Sci. 14 (1), 1–24. doi:10.5194/hess-14-1-2010
Wisser, D., Frolking, S., Douglas, E. M., Fekete, B. M., Schumann, A. H., and Vörösmarty, C. J. (2010b). The significance of local water resources captured in small reservoirs for crop production – a global-scale analysis. J. Hydrol. 384 (3-4), 264–275. doi:10.1016/j.jhydrol.2009.07.032
Wuebbles, D. J. (2018). “Climate change in the 21st century: Looking beyond the paris agreement,” in Climate change and its impacts (Cham, Germany: Springer), 15–38.
Wuebbles, D. J., Kunkel, K., Wehner, M., and Zobel, Z. (2014). Severe weather in United States under a changing climate. Eos, Trans. Am. Geophys. Union 95 (18), 149–150. doi:10.1002/2014eo180001
Xia, Y., Mitchell, K., Ek, M., Cosgrove, B., Sheffield, J., Luo, L., et al. (2012b). Continental-scale water and energy flux analysis and validation for North American land data assimilation system project phase 2 (NLDAS-2): 2. Validation of model-simulated streamflow. J. Geophys. Res. Atmos. 117 (D3). doi:10.1029/2011jd016051
Xia, Y., Mitchell, K., Ek, M., Sheffield, J., Cosgrove, B., Wood, E., et al. (2012a). Continental-scale water and energy flux analysis and validation for the North American land data assimilation system project phase 2 (NLDAS-2): 1. Intercomparison and application of model products. J. Geophys. Res. Atmos. 117 (D3). doi:10.1029/2011jd016048
Keywords: thermal power production, thermal pollution, heat wave, drought, Clean Water Act, cooling technology, WBM-TP2M
Citation: Zhang J, Chen M, Gao S, Li Z, Vörösmarty CJ, Fekete B, Miara A and Hong Y (2023) Examining impacts of policy, technology, and climate extremes on thermoelectric power production and river thermal pollution in the Midwest and Northeast of the United States. Front. Environ. Sci. 11:1212211. doi: 10.3389/fenvs.2023.1212211
Received: 25 April 2023; Accepted: 24 July 2023;
Published: 07 August 2023.
Edited by:
Edward A. Byers, International Institute for Applied Systems Analysis (IIASA), AustriaReviewed by:
Kristan Cockerill, Appalachian State University, United StatesCopyright © 2023 Zhang, Chen, Gao, Li, Vörösmarty, Fekete, Miara and Hong. This is an open-access article distributed under the terms of the Creative Commons Attribution License (CC BY). The use, distribution or reproduction in other forums is permitted, provided the original author(s) and the copyright owner(s) are credited and that the original publication in this journal is cited, in accordance with accepted academic practice. No use, distribution or reproduction is permitted which does not comply with these terms.
*Correspondence: Yang Hong, eWFuZ2hvbmdAb3UuZWR1; Charles J. Vörösmarty, Y3Zvcm9zbWFydHlAZ21haWwuY29t
Disclaimer: All claims expressed in this article are solely those of the authors and do not necessarily represent those of their affiliated organizations, or those of the publisher, the editors and the reviewers. Any product that may be evaluated in this article or claim that may be made by its manufacturer is not guaranteed or endorsed by the publisher.
Research integrity at Frontiers
Learn more about the work of our research integrity team to safeguard the quality of each article we publish.