 Karen McLaughlin
 Raphael Mazor
 Martha Sutula
 Kenneth Schiff
94% of researchers rate our articles as excellent or good
Learn more about the work of our research integrity team to safeguard the quality of each article we publish.
Find out more
ORIGINAL RESEARCH article
Front. Environ. Sci., 29 June 2023
Sec. Toxicology, Pollution and the Environment
Volume 11 - 2023 | https://doi.org/10.3389/fenvs.2023.1210201
Trash impairment of watersheds has been recognized as a worldwide environmental problem. Trash monitoring in streams and rivers is necessary to enhance our understanding of its effects on freshwater habitats and the role of streams as a conduit for transport to marine environments. Southern California, with a population of over 22 million, is home to nearly 7,400 km of wadeable streams in watersheds spanning a variety of land uses, making it an ideal region to study the extent and magnitude of trash and trash types (plastic, metal, glass, etc.) and identify relationships between land use and the amount of trash. These data can be used to develop mitigation strategies and evaluate management successes. We found that 77% of Southern California’s coastal stream kilometers contained trash, with an estimated stock of 7 million pieces of trash. Of the types enumerated, plastic trash was the most ubiquitous, present in 69% of stream kilometers, and the most abundant, with an estimated stock of over 4.3 million pieces of plastic. The most common items were single-use plastic containers, wrappers, and plastic bags. Urban land use was associated with the greatest extent and magnitude of trash, with levels nearly double those found in open land uses. Trash was strongly associated with indicators of human activity and development in watersheds. Road density and proximity to roads and parking lots were strongly associated with increased trash in watersheds. This survey also suggested that management actions had a positive effect on trash count. After the previous trash survey in Southern California streams in 2011–2013, a statewide ban on plastic bags was implemented in 2016. We found a significant decrease in the number of plastic bags within streams in the present survey compared to the previous survey.
Trash, particularly plastic, has become a pollutant of global concern. Trash is found not only in populated areas but also on remote shorelines and in mid-oceanic gyres thousands of miles from shore (Derraik, 2002; National Research Council, 2009; Amon et al., 2020). Trash is both an aesthetic pollutant and a risk to wildlife and habitat quality (Ryan et al., 2009; Boerger et al., 2010; Gall and Thompson, 2015) and possibly human health (Thompson et al., 2009). Plastic waste is the dominant type of anthropogenic litter in both freshwater and marine environments, comprising as much as 60%–80% by number (Derraik, 2002; Lebreton et al., 2017; Castro-Jimenez et al., 2019). Furthermore, recent studies have suggested that the estimates of macrotrash emissions into the ocean may be much higher than those calculated previously (van Emmerik et al., 2018), and the amount of plastic marine debris in the North Pacific Gyre is exponentially increasing (Moore et al., 2001a; Lebreton et al., 2018). Without waste management infrastructure improvements, plastic waste in the ocean is expected to increase by an order of magnitude between 2010 and 2025 (Jambeck et al., 2015).
Rivers play a significant role in the transport of debris into receiving waters, including inland reservoirs and the ocean, in addition to being directly impacted by trash (van Emmerik et al., 2018; Wagner et al., 2019). Most studies of riverine environments generally focus on quantifying the sources of trash rather than the abundance of trash within the channel (Jambeck et al., 2015; Lebreton et al., 2017). Estimates of total particles of trash (abundance), spatial distribution, and types of trash in streams and rivers are necessary because they convey to managers and policymakers a need for action or demonstrate the success of current actions. Such information could also convey priority sources and land uses that can be targeted for intensive management action.
Southern California is a region where trash is expected to be prevalent in streams and rivers. With a population of 22 million, this coastal region contains roughly 30% of the urban landscape. Waterways are considered the main pathway by which trash is transported from the land to the ocean in urbanized coastal environments (Sheavly and Register, 2007; Willis et al., 2017). Because this region has a Mediterranean climate with rainfall concentrated in winter months, trash can accumulate in watersheds during long dry summers (approximately from April to October) to greater levels than in more temperate climates. The coastal watersheds of Southern California drain into the Southern California Bight, a coastal zone prized for its beaches and other ecotourism, as well as for the biodiversity and endemism of its marine and estuarine ecosystems (Claisse et al., 2018; Schiff et al., 2019). In such a region, quantifying the extent, magnitude, and types of trash found in watersheds is an important step toward guiding management actions and evaluating the effect of trash policies. In some parts of the region, state and federal regulators have established total maximum daily loads (TMDLs) for trash greater than 5 mm in diameter, with the objective of reaching zero allowable anthropogenic litter (CRWQCBLAR, 2007; CRWQCBLA, 2015). The State of California recently adopted similar regulations for extending comparable trash reduction policies statewide and implemented a statewide ban on single-use plastic bags (SB270/Proposition 67) in 2016, with additional bans on plastic packaging and single-use items to be implemented in the coming years (SB 54).
This study was part of a collaborative effort by multiple stakeholders to assess the overall biological condition of rivers and streams in Southern California. As part of this wider study, trash was assessed to provide a regional-scale study of the extent and magnitude of trash in rivers and streams. The goal of this study was three-fold: 1) to assess the extent and magnitude of trash found in Southern California’s wadeable streams; 2) to quantify the types of trash; and 3) to identify relationships between the intensity of land use, presence of trash management policies (e.g., bans on single-use plastic bag), and trash.
This study used a probabilistic study design to produce unbiased areal estimates of trash extent (stream kilometers) and magnitude (item count per kilometer). The trash assessment leveraged a larger study conducted by the collaborative Stormwater Monitoring Coalition (SMC) program to assess the biological condition of streams throughout Southern California, establish linkages with stressors causing poor conditions, and track changes through time (Mazor, 2015). Briefly, the sampling frame included all wadeable, second-order, and higher streams in Southern California coastal watersheds from Ventura County to the U.S.–Mexico border (National Hydrography Dataset Plus [NHD Plus], United States Geological Survey and United States Environmental Protection Agency, 2005). Wadeable streams are those that during dry weather are shallow enough to sample without boats (i.e., by “wading”). This represents approximately 28,051 km2 of watershed area and over 7,400 km of stream length (Figure 1). Stream sites were selected from the sampling frame using a spatially balanced, stratified, random master list design (Stevens and Olsen, 2004; Larsen et al., 2008) using the R package spsurvey (Kincaid and Olsen 2013). Typical reaches were 150 m long, and the first 30.5 m was assessed for trash.
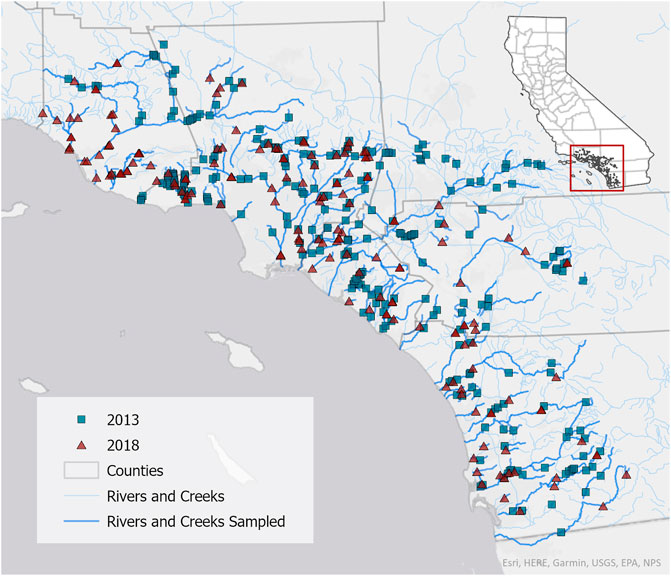
FIGURE 1. Trash sampling locations. Sites sampled in the 2011–2013 survey are indicated by green squares, and sites sampled in the 2018–2019 survey are indicated by red triangles.
Trash was surveyed at 204 sites over 3 years from 2011 to 2013 and at 166 sites over 2 years from 2018 to 2019, stratified by county and land use (Table 1). A total of 15 aggregated watersheds were delineated in Southern California, roughly approximating hydrologic unit code (HUC) 18 (California) from NHD Plus. County stratification included the six counties that comprise these coastal watersheds: Ventura, Los Angeles, Orange, Riverside, San Bernardino, and San Diego. Three land uses were defined—urban, agriculture, and open—based on the National Oceanic and Atmospheric Association’s Coastal Change Analysis Program (National Oceanic and Atmospheric Administration, 1995; National Oceanic and Atmospheric Administration, 2001). For the purpose of site selection, land use was assigned to each stream segment using a 500-m streamline buffer. If the buffer was more than 75% natural or open land, that segment was considered open space. Otherwise, land use was classified as urban or agricultural, depending on which land use dominated.
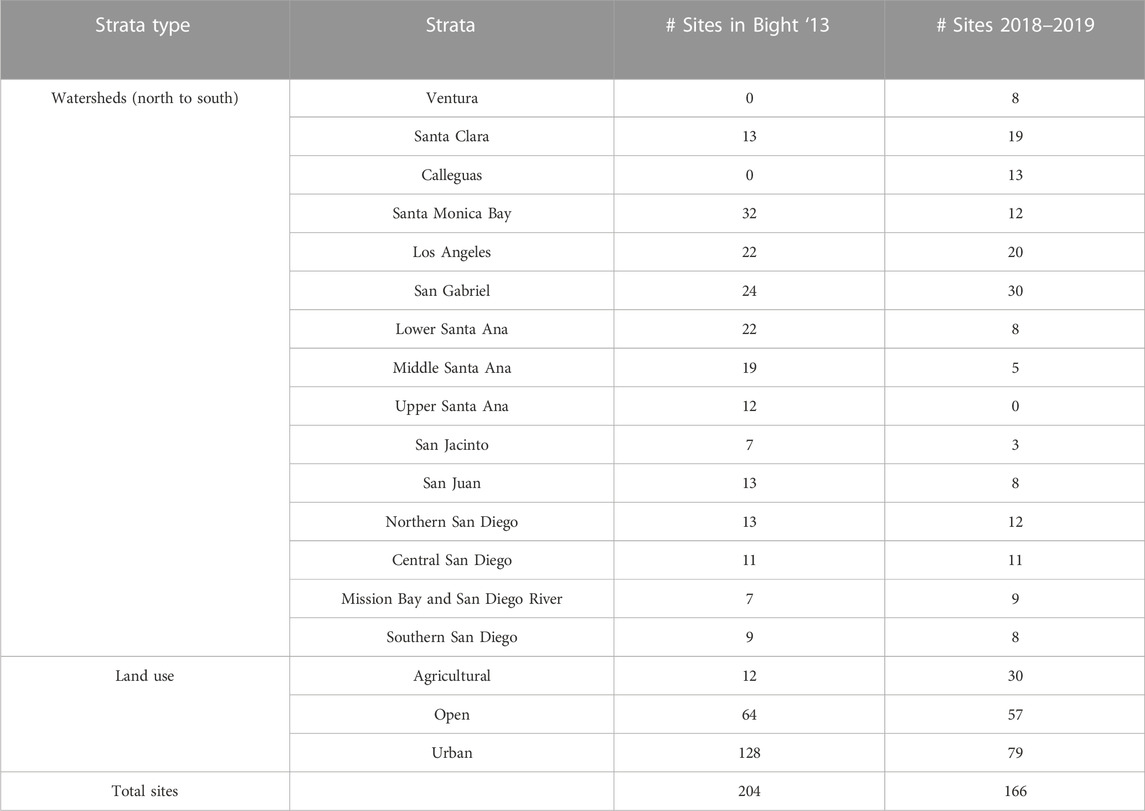
TABLE 1. Sites sampled during the 2011–2013 and 2018–2019 surveys by watershed and land use type.
All sites were sampled during the dry season, spring–summer (April–August), during 2011–2013 and again during 2018–2019. Sampling followed the Southern California Bight Regional Monitoring Riverine Trash Survey (Moore et al., 2016)and the Bay Area Stormwater Management Agencies Association (BASMAA) Trash Monitoring Program Plan (BASMAA, 2017) protocols. Briefly, each site was defined as a stream reach with a length of 30.5 m (100 ft) and a width equal to the high-water mark, also referred to as the ordinary high-water mark, if a visible high-water level was not discernable. Trash assessment included a combination of qualitative assessment and an associated quantitative item tally. The qualitative assessment rated each site with a visual assessment score based on the amount of trash seen while walking the 30.5 m reach (low, moderate, high, and very high). The quantitative assessment included an enumeration and classification of all visible trash within the stream reach. The 10 general trash classifications were as follows: plastic (e.g., wrappers, bags, pieces, and bottles), glass, metal (e.g., aluminum cans), cloth, biohazard (e.g., diapers and pet waste), biodegradable waste (e.g., paper), construction waste (e.g., concrete and asphalt), large trash (e.g., refrigerators and sofas), toxic waste (e.g., cigarette butts and spray paint cans), and miscellaneous waste (e.g., sports balls and ceramics). If an item fit multiple categories, the category that fit the greatest proportion of material was recorded, with comments made on any additional categories for minor material types. All field teams participated in a training event at the same field site and reviewed trash types in each category presented on the field data sheets to ensure standardization of data collection. In addition, field audits were conducted by a single individual at a random site within each team’s site lists to ensure comparability of data collection.
Data on site factors were collected using the physical habitat assessment and landscape variables collected from GIS and Google Earth. The physical habitat assessment is described in Mazor (2015) and is based on Ode (2007) and Fetscher et al. (2009). Briefly, the entire 150-m reach was divided into 11 equidistant transects, with 10 inter-transects located halfway between them. At each transect, channel characteristics (e.g., bank dimensions, wet width, water depth, and sinuosity), substrate size and type, riparian vegetation, and human influence parameters (e.g., storm drains and structures) were measured. Within-channel characteristics (parameters and substrate) were also measured at each inter-transect. The slope of the water surface was measured across the entire reach at each site. Metrics based on physical habitat data were calculated using custom scripts in R, based on those presented in Kaufmann et al. (1999). The index of physical integrity (IPI), a multi-metric index based on physical habitat measurements, intended to measure habitat integrity, was calculated using custom R scripts according to Rehn et al. (2018). We utilized the IPI along with the combined riparian human disturbance index used by the Surface Water Ambient Monitoring Program (SWAMP; Rehn et al., 2018) to assess the relationship of trash with stream physical integrity.
Using a GIS, watersheds were delineated for each site from 30-m digital elevation models (USGS 1995) and visually corrected to reflect local conditions. Watersheds were clipped at 5 km around each site to evaluate local conditions for road density (total length of roads within the polygon/total area of the polygon) and the number of paved intersections. Distance to the nearest road (km), type of the nearest road, and distance to the nearest parking lot (km) for each site were estimated from Google Earth Pro and local knowledge.
Sampling weights were assigned to each site for each stratum definition, to account for differences in total stratum stream sites/length. These weights were used when estimating magnitude (area-weighted mean count of trash pieces per stream kilometer) and spatial extent (percent of stream kilometers with visible trash) using the Horvitz–Thompson estimator (Horvitz and Thompson, 1952). Counts are represented as total trash particles counted and normalized to 1 km, estimating total trash per stream kilometer from that counted in the 30.5-m reach. Confidence intervals (CIs) were calculated based on local neighborhood variance estimators (Stevens and Olsen, 2004). Trash stock in Southern California coastal watersheds was calculated by first determining the number of trash items per meter of the stream at each site and then multiplying by the length of the stream represented by each site (length-weighted) and summing the stocks by land use type and for the region to get a total estimate of the number of trash pieces in the region.
Data analyses were performed using R 4.0.2 (R Core Team, 2014), the tidyverse (Wickham et al., 2019), IDPmisc (Locher and Ruckstuhl, 2012), and ggpubr packages (Kassambara, 2018). Statistical analyses were conducted using the rstatix package (Kassambara and Kassambara, 2020). Trash counts were log-transformed for analysis (log10 (count + 1)). The Kruskal–Wallis one-way analysis of variance (ANOVA) was used to test differences in trash abundance among the three land use categories and by county. Quantile regressions were used to evaluate relationships between trash abundance and site factors using the R package quantreg. We selected quantile regression over linear regression to assess factors associated with a high abundance of trash as the target of management actions.
Trash was pervasive in Southern California Bight watersheds. Over three-quarters (77%) of the more than 7,400 km of Southern California wadeable streams contained at least one trash item (Figure 2A). Trash was most common in urban streams, present in 89% of stream kilometers, and least common in open streams (56% of stream kilometers). Trash was found in a portion of all stream kilometers in every watershed assessed (Figure 2B), ranging from 100% of stream kilometers in the Middle Santa Ana River and San Jacinto River watersheds to 53 % of stream kilometers in the Santa Clara River watershed.
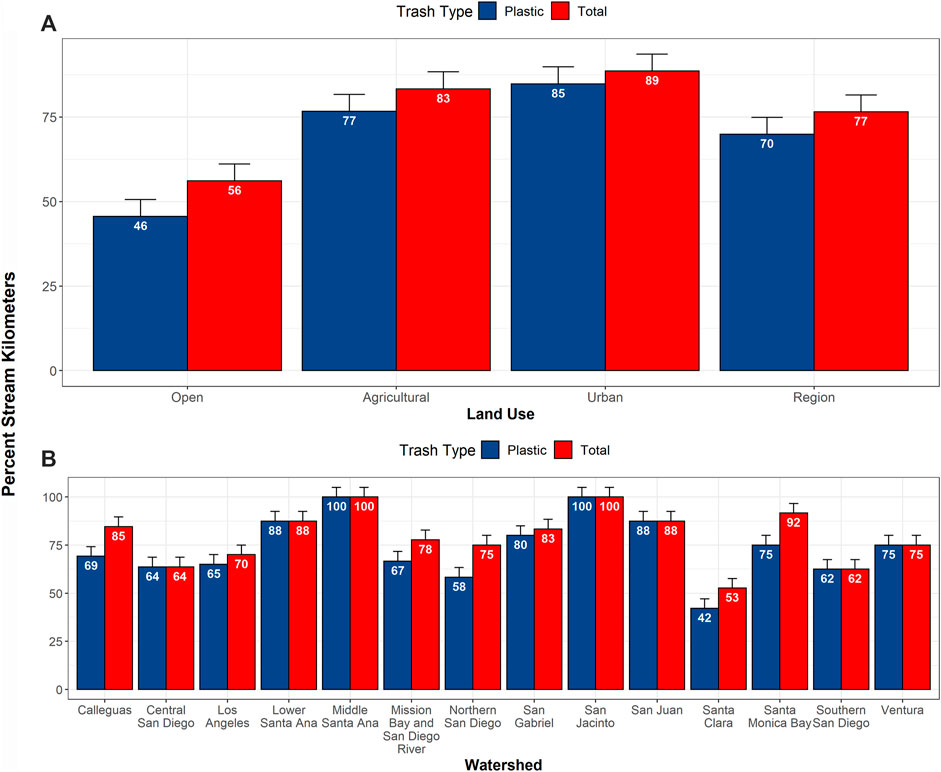
FIGURE 2. Percentage of stream kilometers in which at least 1 piece of plastic (blue) or trash (red) was found per reach from (A) open, agricultural, and urban land uses and in the entire Southern California Bight region and (B) in each watershed during the 2018–2019 survey.
Plastic trash was the most common trash type in all land uses and all watersheds, with an estimated 70% of stream kilometers having plastic trash (Figures 2, 3, 5). Patterns in plastic trash extent mirrored that of total trash, with urban streams most affected (89% of stream kilometers) and open areas least affected (46% of stream kilometers). Within watersheds, stream length affected by plastic trash ranged from 100% of stream kilometers in the Middle Santa Ana and San Jacinto watersheds to 42% of stream kilometers in the Santa Clara River watershed (Figure 2B).
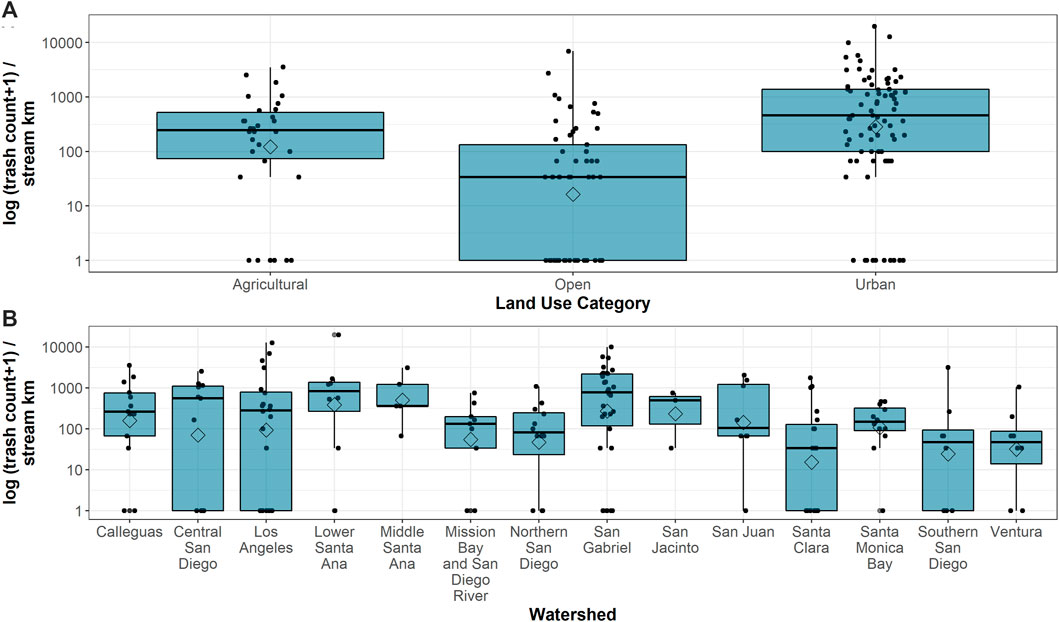
FIGURE 3. Total trash count per stream kilometer (log10 transformed) by land use (A) and by watershed (B) in the Southern California coastal region. Individual points represent trash/plastic abundance at each site sampled during the 2018–2019 survey. Diamonds represent area-weighed mean counts per stream kilometer. Box and whiskers represent the area-weighed median and quartiles.
The amount of trash counted along any stream reach was variable within and among the land use (Figure 3). The number of trash items counted along a stream reach ranged from a high of 600 items in an urban stream (Lower Santa Ana watershed) to no trash found (25 open streams, five agricultural streams, and nine urban streams). The area-weighted mean trash count was highest in urban land streams (1,450 ± 2,910 items per stream kilometer, mean ± standard deviation), followed by agricultural (516 ± 800 items) and open (290 ± 986 items) streams. The top five watersheds with the highest trash abundance were Lower Santa Ana (with a mean of 3,120 ± 6,720 trash items counted per stream kilometer), Los Angeles River (mean 1,550 ± 3,190 trash items), San Gabriel River (mean 1,540 ± 2,180 trash items), Middle Santa Ana River (mean 1,020 ± 1,230 trash items), and Calleguas Creek (mean 711 ± 1,010 trash items).
A stock assessment of trash indicated that more than 7 million pieces of trash were present in streams in Southern California coastal watersheds (Figure 4). Over 4 million of those pieces of trash were plastic. There were nearly 4 million pieces of trash in urban streams alone, which represent only 25% of the total watershed area in the region, and over 2 million of those pieces were plastic.
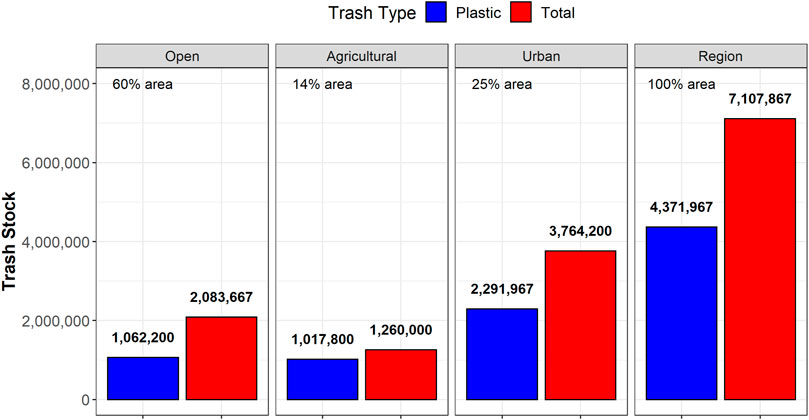
FIGURE 4. Stock assessment of total plastic (blue) and total trash (red) in Southern California coastal wadeable streams. Facets represent land use categories and the region overall. The percent area in each land use category is given, and the numbers represent the total stock of each trash type.
In Southern California coastal watersheds, plastic trash was the most widely encountered trash type (found in 69% of stream kilometers), followed by metal (43% of stream kilometers), biodegradable items such as paper (34% of stream kilometers), and fabric (33% of stream kilometers) (Figure 5). These four trash types were the most common in all land use categories and in most watersheds, although some watersheds had high percentages of stream kilometers with glass or miscellaneous items (items that could not neatly fit into one category or another such as rubber, ceramics, and sports balls). Large items (such as appliances and tires) and biohazard items (such as dog waste bags and diapers) were the least common in all land uses. Biodegradable items, especially paper and cardboard, were the second most common trash type in urban streams (found in 53% of stream kilometers) after plastic (in 85% of stream kilometers).
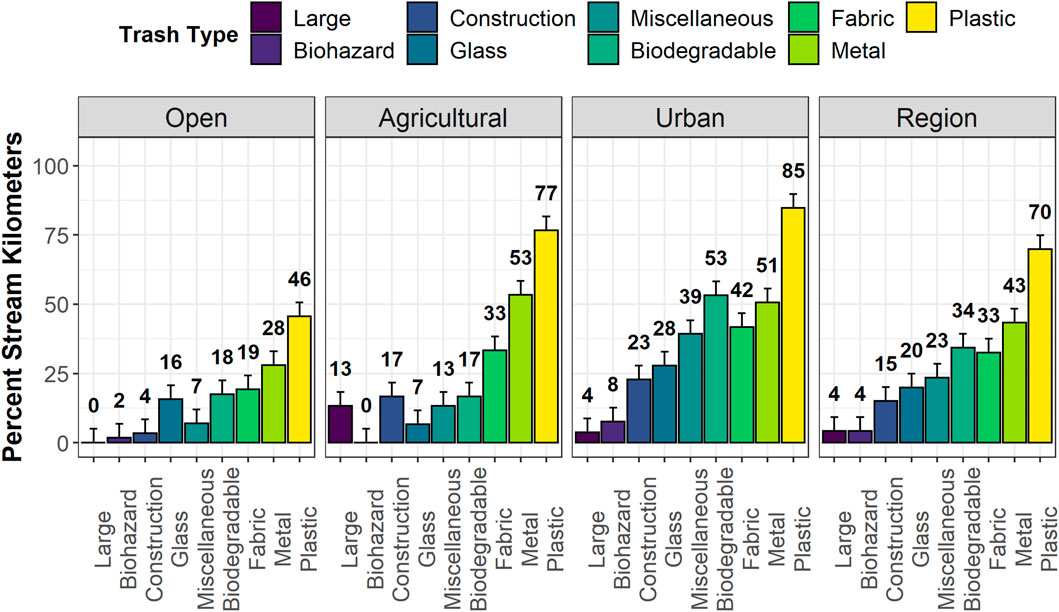
FIGURE 5. Percent of stream kilometers where each trash type was present during the 2018–2019 survey by land use category for the region overall.
The amount of trash counted of any type along stream reaches was variable within and among the land uses (Figure 6). In addition to being present in the greatest number of stream kilometers, plastic trash items also had the highest mean counts for all land uses, ranging from a mean count of 880 ± 1,723 plastic items per kilometer in urban streams (nearly 1 piece of plastic encountered for every meter of stream) to 132 ± 350 items in open streams (1 piece of plastic encountered every ∼10 m of stream). The high variability in the counts is partly due to the high numbers of items (e.g., pieces of broken glass, metal nails, plastic fragments, etc.) at some sites, and the number of “whole” items represented by the pieces was impossible to discern in the field. Pieces of items were particularly common for plastics where the numbers of whole plastic items (entire plastic bags, intact plastic bottles, etc.) accounted for 5% of the total plastic counts; 95% were pieces.
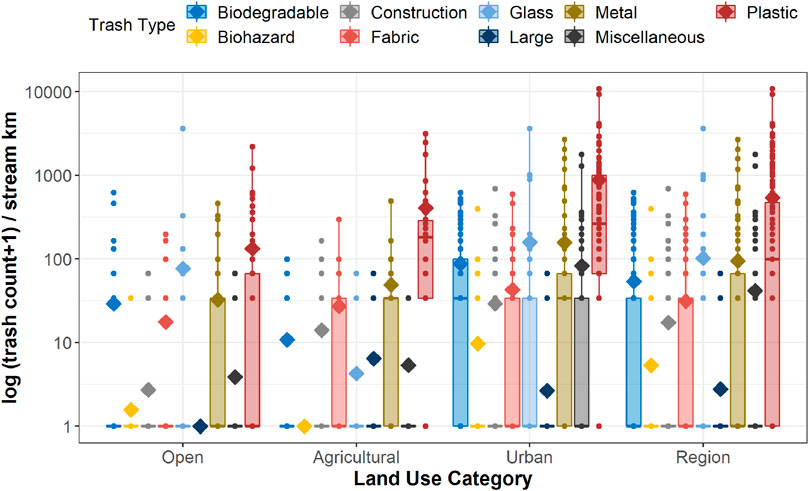
FIGURE 6. Count per stream kilometer of each trash type by land use category during the 2018–2019 survey. Count is the log10-transformed of the total counts of all items plus 1. Diamonds are the mean counts of each type in each land use category.
Across land use types, the five most frequently encountered items were wrappers, paper/cardboard, plastic pieces, bags, and foam pieces (Table 2). Other items often found were aluminum or steel cans, glass, plastic bottles, single-use containers, and synthetic fabrics. We also evaluated the relative percentages of plastic items found. Wrappers and container pieces had the greatest relative percentages of the total counts of items, followed by foam/foam pieces, plastic bags/bag pieces, and tobacco-related items (cigarette butts, cigar tips, etc.).

TABLE 2. Top 10 most common trash items by each land use type and for the region.
Proximity to roads and parking lots, as well as in-stream metrics of human disturbance, were all correlated with increased trash abundance in a stream reach. Some non-human disturbance metrics (e.g., width) were also correlated with increased trash abundance.
Trash distribution and abundance in Southern California Bight watersheds were strongly associated with proximity to roads and parking lots. Increased trash abundance within a stream reach was well correlated with increased road density (R2 = 0.44, p < 2.2 × 10⁻¹⁶) and the number of paved intersections (R2 = 0.04, p = 0.02) within 5 km of the site (Figure 7). Trash abundance in streams was highest if the road or parking lot was close to the survey reach, with highest abundances within 250 m of the reach (Figure 8). Whether the road or parking lot was upstream, downstream, or alongside the stream reach did not seem to affect the abundance of trash in the reach, only the proximity. There were significant differences in the amount of trash by type/size of road nearest to the reach (ANOVA on log-transformed data where p = 0.01 for all trash and plastic trash, respectively), with dirt and 1-lane roads having significantly lower amounts of trash than other types of roads (Tukey HSD). There were no significant patterns in relation to roads by land use or survey year (Tukey HSD). Whether the stream was fenced or not did not appear to affect the amount of trash found within the stream.
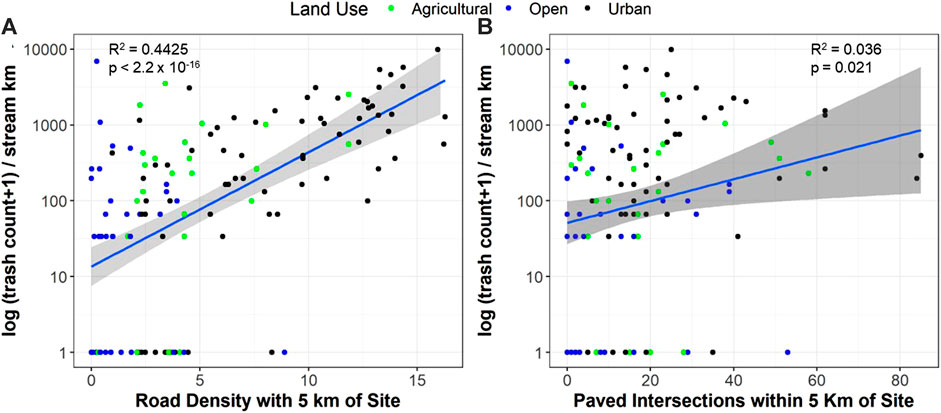
FIGURE 7. Total trash count per stream kilometer (log10-transformed) as a function of roads within the watershed for the 2018–2019 survey. (A) Total trash count per stream kilometer as a function of the road density within 5 km of the site and (B) total trash count as a function of the paved intersections within 5 km of the site. Each point is an individual stream reach, color/shape is the land use type, the blue line is the linear model, and the blue shading is the 95% confidence interval of the fit. The R2 and p-value for each fit are given.
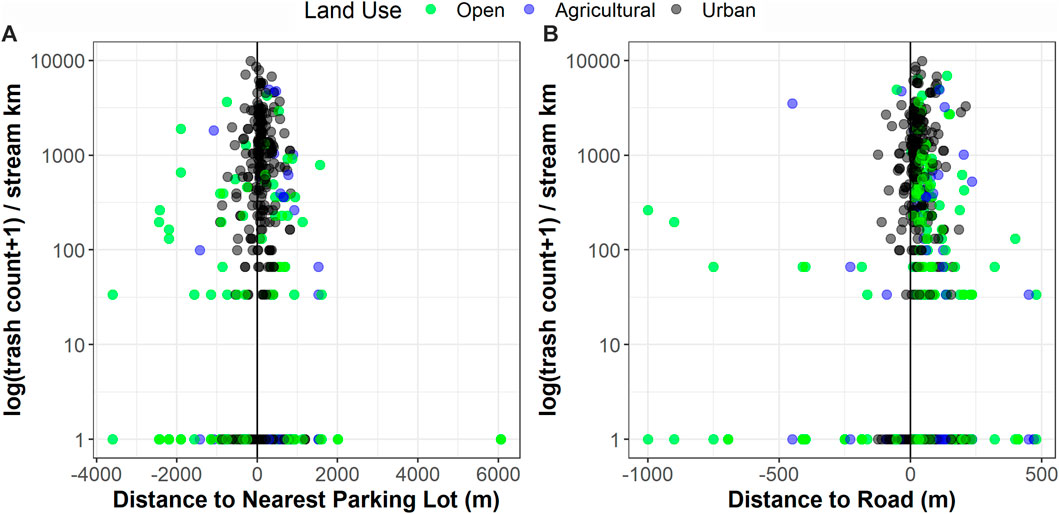
FIGURE 8. Trash count per stream kilometer (log10-transformed) as a function of the distance to the nearest parking lot (A) or nearest road (B) during both surveys. Positive values are where the stream site is located upstream of the road/parking lot, and negative values are where the site is located downstream of the road/parking lot. The color of the point is the land use category of each stream site.
Instream indicators of human disturbance assessed by the California Regional Bioassessment Program were well correlated with increased trash abundance within a stream reach (Figure 9). The index of physical integrity (IPI), a measure of the relative habitat integrity of a stream, was negatively correlated with trash abundance in streams for the 75th and 90th percentiles of trash abundance (τ = 0.9, p = 0.024; τ = 0.75, p = 0.0015). The riparian human disturbance index (Rehn et al., 2018) was strongly positively correlated with stream trash abundance for the 75th and 90th percentiles of trash abundance (τ = 0.9, p < 1 × 10⁻¹⁶; τ = 0.75, p < 1 × 10⁻¹⁶). Buildings (τ = 0.9, p = 3.3 × 10⁻⁵; τ = 0.75, p < 1 × 10⁻¹⁶), pavement and cleared lots (τ = 0.9, p = 1.7 × 10⁻¹²; τ = 0.75, p = 8.7 × 10⁻⁸), pipes (τ = 0.9, p = 1.6 × 10⁻⁷; τ = 0.75, p = 4.7 × 10⁻⁵), anthropogenic channel alteration (τ = 0.9, p = 0.0014; τ = 0.75, p = 0.0072), and walls/rip-rap (τ = 0.9, p = 3.4 × 10⁻⁷; τ = 0.75, p = 4.4 × 10⁻¹⁶) within the stream reach were positively correlated with increased trash for the 75th and 90th percentiles of trash abundance. Bridges and abutments were also positively correlated, but the relationships for trash abundance were not significant for any quantile.
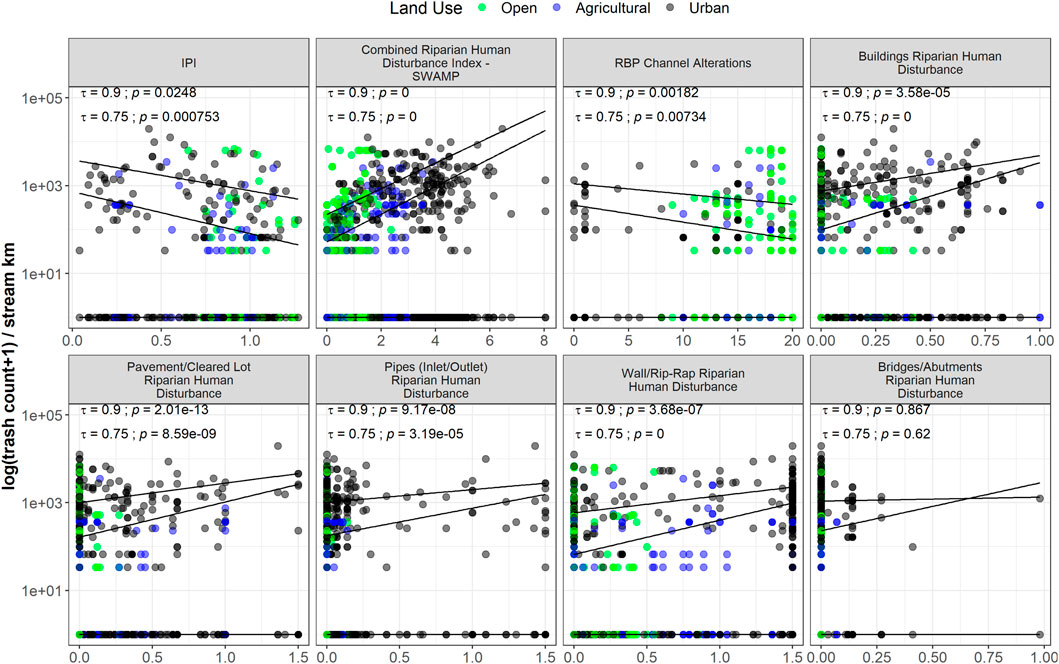
FIGURE 9. Quantile regressions of trash count per stream kilometer (log10-transformed) as a function of instream human disturbance metrics collected during physical habitat assessments during both surveys. The shape of the point is the land use category of each stream site. Lines represent linear regressions of quantile data (50th, 75th, and 90th percentiles). The p-values for each quantile are also provided for the 75th and 90th percentiles.
In addition to human disturbance metrics, some channel characteristics were also correlated with trash abundance. Both mean bankfull width and the mean wetted width were associated with increased trash abundance (τ = 0.9, p = 4.5 × 10⁻⁵ and 0.019, respectively) for the 90th percentile of trash abundance, and steeper channels were associated with less trash abundance (τ = 0.9, p = 6.2 × 10⁻¹⁰; τ = 0.75, p = 1.8 × 10⁻⁶) for both the 90th and 75th percentile of abundance data. Increased sinuosity was associated with less trash (τ = 0.9, p = 1.3 × 10⁻⁵; τ = 0.75, p = 7.5 × 10⁻⁶), though this may be confounded by the fact that urban streams are hydrologically altered to be less sinuous.
Overall trash extent and magnitude were similar between the 2011–2013 and 2018–2019 surveys (Figure 10), with no significant differences in either trash abundance within streams or the percentage of stream kilometers containing trash between the two surveys (Wilcoxon, p > 0.05). However, there was a significant decrease in plastic bag abundance throughout the region (Wilcoxon, p = 1.5e−7), particularly in the open land use category (Wilcoxon, p = 2.9e−8; Figure 11), possibly due to the implementation of the statewide plastic bag ban in 2016. Despite the decrease in plastic bags, the overall plastic trash extent and magnitude were not significantly different between the two surveys (Figure 10), with no significant difference in either plastic abundance or percent of stream kilometers containing plastic trash (Figure 12).
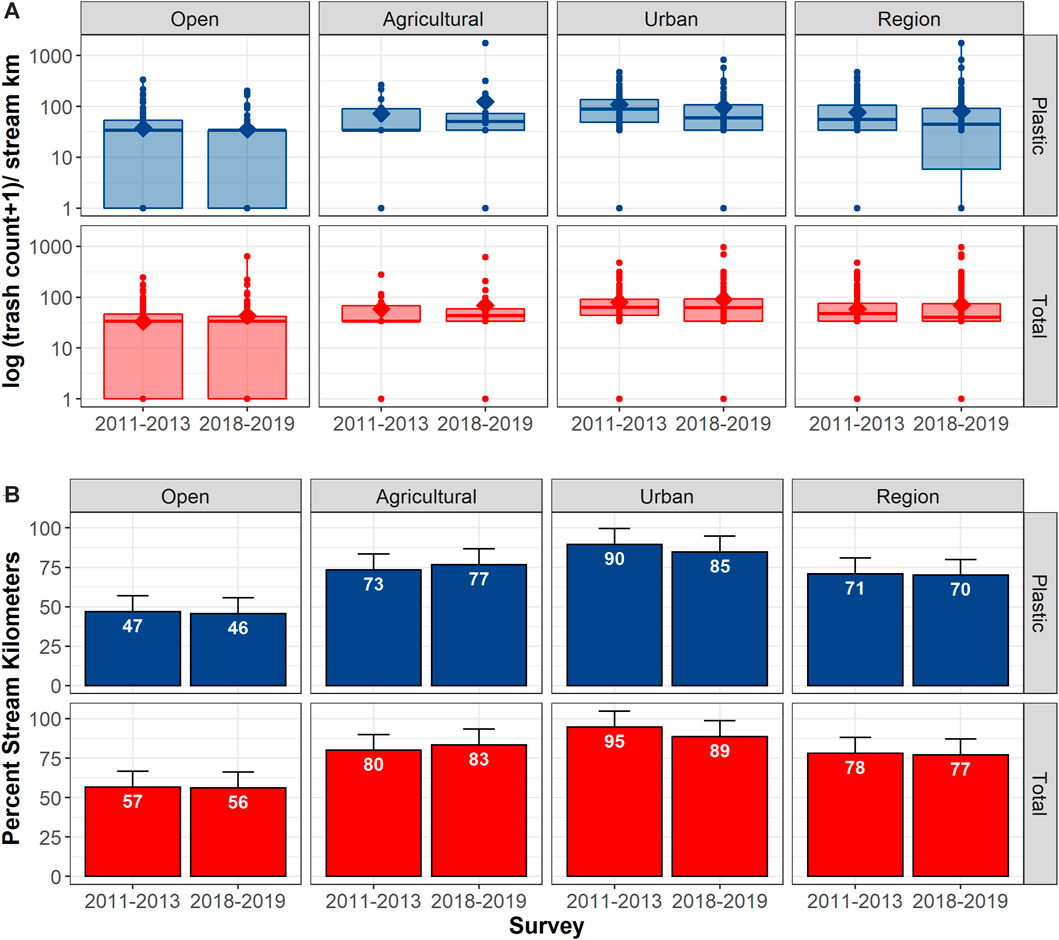
FIGURE 10. Difference in watershed total trash count per stream kilometer (A) and areal extent (B) between the 2011–2013 and 2018–2019 surveys. Counts are the log (base 10) of the total counts of all items plus 1. Diamonds are the mean counts of each type in each land use category and for the region overall. The percent of stream kilometers is based on the presence of at least 1 piece of trash in the sampled 30.5-m reach.
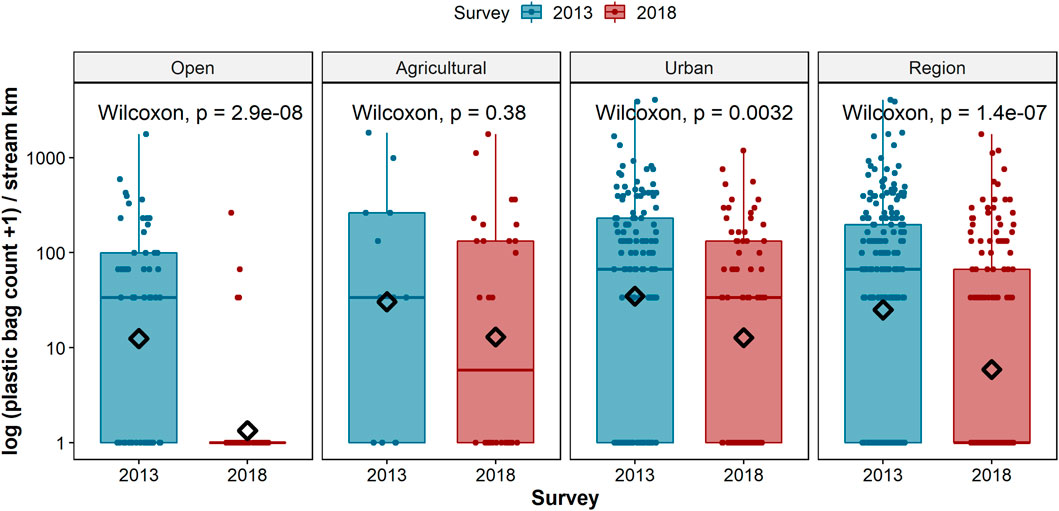
FIGURE 11. Total count of plastic bags per stream kilometer in each land use category and for the region overall in 2011–2013 (blue) and 2018–2019 (red). Counts are the log (base 10) of the total number of plastic bags observed plus 1. Diamonds are the mean count in each land use category and for the region overall. Significance of the difference in mean abundance is given by the Wilcoxon test.
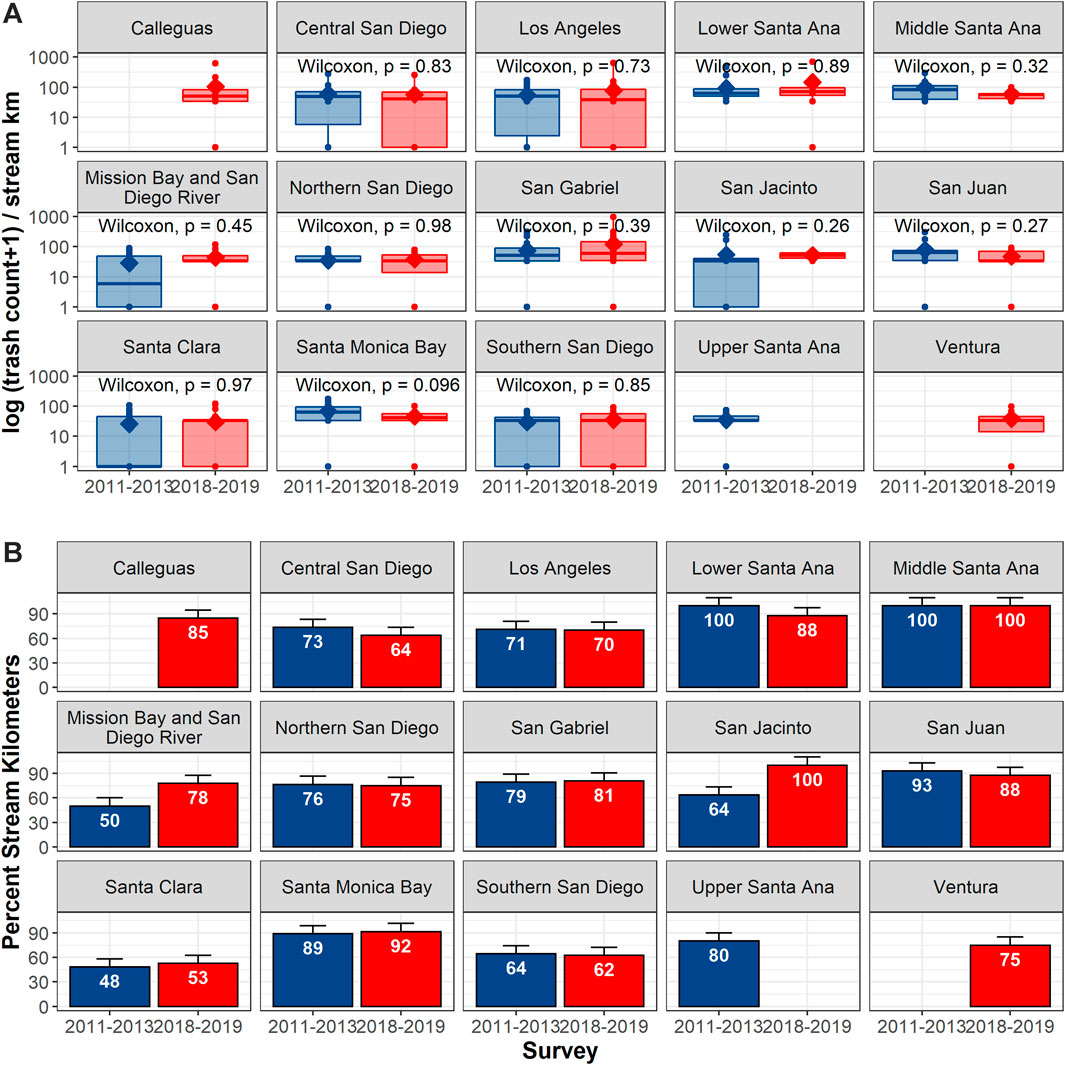
FIGURE 12. Difference in watershed total trash counts per stream kilometer (A) and areal extent (B) between the 2011–2013 and 2018–2019 surveys. Count is the log (base 10) of the total counts of all items plus 1. Diamonds are the mean counts of watershed for each survey. Percent of stream kilometers is based on the presence of at least 1 piece of trash in the sampled 30.5-m reach. Zero indicates watershed was not sampled during the survey period.
Trash was pervasive throughout Southern California watersheds, present in an estimated 77% of the nearly 7,400 stream kilometers with an estimated stock of over 7 million pieces. The large extent and magnitude observed in this survey are consistent with the large quantities of trash discharged into the marine environment from Southern California’s river mouths during storm events. Moore et al. (2011) estimated that 2.3 × 10⁹ pieces of trash, cumulatively weighing at least 30 metric tons, were discharged from three of Southern California’s urban watersheds during a range of typical storm events. While it is tempting to compare our abundance estimates (7 × 10⁶ trash pieces) to those of Moore et al. (2011), we note that the latter represents a wet weather transport process (fluxes) rather than dry weather accumulation (standing stock), which was the focus of this study. A better understanding of accumulation rates during dry weather and immediately following storm events is needed to characterize the wet weather measured fluxes (e.g., Moore et al., 2011) within the context of estimates of standing stock (this study).
This survey found that plastic was the leading type of trash in both extent and magnitude, consistent with findings from many other freshwater and oceanic systems [e.g., the Seine River (Gasperia et al., 2014), Chicago River (Hollein et al., 2014), Danube River (Lechnera et al., 2014), Rhone River (Castro-Jimenez et al., 2019), and Southern California watersheds (Moore et al., 2011)]. Globally, between 1.15 and 2.41 million tons of plastic waste enters the ocean annually from rivers (Lebreton et al., 2017). Moreover, of the plastic items found, over 90% of the items were broken pieces from a larger item, similar to other riverine studies (Castro-Jimenez et al., 2019). This visible degradation of plastics suggests that continued degradation to microplastics is occurring in watersheds. The weathering and breakdown of larger plastic particles from land-based sources is one mechanism for microplastic contamination of marine habitats and is a source of concern for marine microplastic pollution (Andrady, 2011). Microplastics have been identified in Southern California river surface waters (Moore et al., 2011; Talley et al., 2020), though the extent of the problem in the Southern California region is poorly understood. Given that an estimated 80% of microplastic pollution in the ocean comes from land and rivers which are the dominant pathways for microplastics to reach the oceans (Rochman, 2018), it is likely that the loading of plastic trash from Southern California coastal watersheds is contributing to the region’s high density of marine shoreline (Moore et al., 2001b), floating (Moore et al., 2002), epibenthic (McLaughlin et al. submitted), and benthic (Moore et al., 2011) plastic trash.
Urban stormwater has been implicated as a primary source of debris in the marine environment (Bauer-Civiello et al., 2019; Conley et al., 2019). Particularly along urbanized coastlines, terrestrial waterways are considered the primary sources that transport trash from the land to the coastal ocean (Sheavly and Register, 2007, Willis et al., 2017). Consequently, efforts at trash management have been increasing globally to mitigate trash pollution (Willis et al., 2017; Jambeck et al., 2015). Local solutions, such as improvements in infrastructure (e.g., trash booms), public outreach, and trash receptacles at popular beaches, decrease the amount of debris on shorelines (Frost and Cullen, 1997; Ribic et al., 2012; Willis et al., 2017). Similarly, stormwater traps have been shown to significantly reduce debris entering the coastal margin, capturing up to 44% of litter before it enters the coast (Whitehead et al., 2010; Schlining et al., 2013).
Trash extent and magnitude were closely tied to human activity. Similar relationships between plastic concentrations in watersheds and human population density and proportion of urban development in catchments have been identified in other regions (Yonkos et al., 2014; Galgani et al., 2015; Carpenter and Wolverton, 2017; Nelms et al., 2021). Southern California urban land use sites contained the greatest extent and magnitude of trash compared to other land uses, present in over 40 percent more stream kilometers and having an average of 5 times as many pieces of trash within a reach compared to open land uses. Increased trash was also correlated with key indicators of urban development such as nearby roads and parking lots, as well as instream human disturbance metrics, relationships that were consistent across land uses. Increased trash density has been linked to site accessibility in urban areas, and these high-density, high-accessibility sites represent a particularly important source area of receiving water trash occurrence (Carpenter and Wolverton, 2017). Indeed, survey sites located near bike paths with direct access to a waterway had some of the highest abundances of trash present compared to other types of roadways.
Management strategies should consider mechanisms through which trash is deposited in streams. Trash deposited in stream corridors occurs through several primary sources and pathways including, but not limited to, 1) land-based sources, 2) incidental or wind-blown trash from adjacent areas, and 3) direct deposit of trash from unsheltered communities living in floodplains, littering, illegal dumping, and trash mismanagement (Ryan et al., 2009; Jambeck et al., 2015). Roadways seem to play a role in trash source accumulation processes for streams, either as a mechanism for transport to waterways or as a proxy for human activity near the site. The relationship between stream trash and roadway contribution suggests that management strategies to address roadway-associated trash may increase the cost-effectiveness of trash source reduction efforts. Survey results indicated that trash abundance was higher in sites that were within 250 m of either a road or parking lot, suggesting management strategies to mitigate direct deposits associated with roadways or trash washed off or blown off from roadways may reduce instream trash. That the largest roads had higher trash abundance than areas with smaller roads would suggest that such actions should be prioritized for larger roadways.
One limitation to this study is the lack of trash mass data. The study design sacrificed weighing trash to measure more sites, which was an important tradeoff to increase confidence in estimates of extent and magnitude. However, mass estimates will be a key attribute for linking land-based trash and trash measured in the near coastal oceans; however, methodological challenges such as subtracting water, sediment, and biological material from the trash must be overcome. This linkage becomes especially important for plastics that can break into smaller pieces, thereby increasing abundance without affecting the total mass. Now that this survey has measured the extent and magnitude of trash counts, future studies focused on accumulation rates, and especially accumulation rates of trash mass, are logical next steps.
This study provides some encouraging information about the effectiveness of trash reduction strategies. Southern California’s watershed management community has proposed and implemented diverse measures to minimize the amount of trash in waterways, including recycling programs, plastic bag bans, and other regulations and legislation. California Senate Bill 270, which established a statewide ban on plastic bags, was implemented in 2016 between Bight Trash surveys. We found a significant reduction in plastic bags since the 2013 survey, which indicates that management actions can be effective in combating trash abundance in watersheds. The 2018–2019 survey saw a significant decrease in the abundance of plastic bags and bag pieces since the 2011–2013 survey, from an area-weighted mean of 200 ± 500 bags/bag pieces per stream kilometer to 67 ± 200 bags/pieces per stream kilometer region-wide, with most of that decrease occurring in urban land uses. Although, despite the bans, plastic bags were still some of the most frequently encountered items, suggesting how bans are implemented and enforced will influence the outcome (for example, in many stores, one can still get a plastic bag for a surcharge).
Evaluating the most prevalent types of trash as well as their distribution can provide insights into where focused environmental management actions may be most effective for trash mitigation. For example, plastic container pieces, plastic bags, plastic wrappers, and Styrofoam ranked as the top four most abundant trash items in the region. Source control of these items could be achieved through alternative material selection or reduction of packaging materials. Alternative materials are currently being explored as a mechanism to reduce marine plastic litter globally, with a focus on replacement materials for single-use plastics utilizing a combination of natural fibers, synthetic, degradable biopolymers, and reusable containers (United Nations Environment Programme, 2017). Given the success in the reduction of plastic bags, similar actions for other materials might be expected to have similar outcomes.
The datasets presented in this study can be found in online repositories. The names of the repository/repositories and accession number(s) can be found at: smc.sccwrp.org.
Ethical review and approval was not required for the study on human participants in accordance with the local legislation and institutional requirements. Written informed consent from the participants was not required to participate in this study in accordance with the national legislation and the institutional requirements.
KM: conceptualization, validation, formal analysis, data curation, writing—original draft, writing—review and editing, visualization, and project administration; RM: conceptualization, methodology, formal analysis, data curation, writing—review and editing, and project administration; MS: conceptualization, validation, formal analysis, data curation, writing—original draft, and writing—review and editing; KS: conceptualization, methodology, validation, supervision, writing—review and editing, and project administration. All authors contributed to the article and approved the submitted version.
This project was funded collaboratively through the Southern California Bight Regional Monitoring Program and the Southern California Stormwater Monitoring Coalition. Project partners provided in-kind and financial support for the data collection and analysis. This research did not receive any specific grant from funding agencies in the public, commercial, or not-for-profit sectors.
This manuscript is one of a series of products produced by the Southern California Bight 2018 Regional Monitoring Program (Bight ’18), an integrated, collaborative effort to provide large-scale assessments of the Southern California Bight. The authors wish to thank the members of the Bight ’18 Trash and Marine Debris Committee for their assistance with study design, data collection, data analysis, and manuscript review. The authors also thank the Bight ’18 Sediment Quality Planning Committee and the Stormwater Monitoring Coalition for their guidance and support of trash and marine debris measurements in regional monitoring. This study would not have been possible without the expertise in sample collection from the following organizations participating in the Southern California Storm Water Monitoring Coalition (SMC): Aquatic Bioassay and Consulting Laboratories, California Regional Water Quality Control Board, Los Angeles Region, California Regional Water Quality Control Board, San Diego Region, California Regional Water Quality Control Board, Santa Ana Region, California State Water Resources Control Board, California Department of Transportation, City of Long Beach Public Works, City of Los Angeles Public Works, Los Angeles County Public Works, Orange County Public Works, San Diego County Public Works, Southern California Coastal Water Research Project, Ventura County Public Works, and Weston Solutions.
The authors declare that the research was conducted in the absence of any commercial or financial relationships that could be construed as a potential conflict of interest.
All claims expressed in this article are solely those of the authors and do not necessarily represent those of their affiliated organizations, or those of the publisher, the editors, and the reviewers. Any product that may be evaluated in this article, or claim that may be made by its manufacturer, is not guaranteed or endorsed by the publisher.
Amon, D.J., Kennedy, B.R., Cantwell, K., Suhre, K., Glickson, D., Shank, T.M., and Rotjan, R.D. (2020). Deep-sea debris in the central and western Pacific Ocean. Frontiers in Marine Science, 369.
Andrady, A.L., (2011) Microplastics in the marine environment. Marine Pollution Bulletin, 62(8), 1596–1605.
Bauer-Civiello, A., Critchell, K., Hoogenboom, M., and Hamann, M. (2019). Input of plastic debris in an urban tropical river system. Mar. Pollut. Bull. 144, 235–242. doi:10.1016/j.marpolbul.2019.04.070
Boerger, C. M., Lattin, G. L., Moore, S. L., and Moore, C. J. (2010). Plastic ingestion by planktivorous fishes in the North Pacific central gyre. Mar. Pollut. Bull. 60, 2275–2278. doi:10.1016/j.marpolbul.2010.08.007
Carpenter, E., and Wolverton, S. (2017). Plastic litter in streams: the behavioral archaeology of a pervasive environmental problem. Applied Geography 84, 93–101.
Castro-Jiménez, J., González-Fernández, D., Fornier, M., Schmidt, N., and Sempéré, R. (2019). Macro-litter in surface waters from the Rhone River: Plastic pollution and loading to the NW mediterranean sea. Mar. Pollut. Bull. 146, 60–66. doi:10.1016/j.marpolbul.2019.05.067
Claisse, J. T., Blanchette, C. A., Dugan, J. E., Williams, J. P., Freiwald, J., Pondella, D. J., et al. (2018). Biogeographic patterns of communities across diverse marine ecosystems in southern California. Mar. Ecol. 39, 12453. doi:10.1111/maec.12453
Conley, G., Beck, N., Riihimaki, C. A., and Hoke, C. (2019). Improving urban trash reduction tracking with spatially distributed Bayesian uncertainty estimates. Comput. Environ. Urban Syst. 77, 101344. doi:10.1016/j.compenvurbsys.2019.05.001
CRWQCBLA (2015). Amendment to the water quality control plan for the Los Angeles region to revise the total maximum daily load for trash in the Los Angeles River watershed and the total maximum daily load for trash in the ballona Creek watershed. Los Angeles Region: California Regional Water Quality Control Board.
CRWQCBLAR (2007). Trash total maximum daily loads for the Los Angeles River watershed. Los Angeles Region: California Regional Water Quality Control Board.
Derraik, J. (2002). The pollution of the marine environment by plastic debris: A review. Maine Pollut. Bull. 44, 842–852. doi:10.1016/s0025-326x(02)00220-5
Eriksson, C., Burton, H., Fitch, S., Schulz, M., and van den Hoff, J. (2013). Daily accumulation rates of marine debris on subAntarctic island beaches. Mar. Pollut. Bull. 66 (1–2), 199–208. doi:10.1016/j.marpolbul.2012.08.026
Fetscher, E.A., Busse, L., and Ode, P.R. (2009). Standard operating procedures for collecting stream algae samples and associated physical habitat and chemical data for ambient bioassessments in California. California State Water Resources Control Board Surface Water Ambient Monitoring Program (SWAMP) Bioassesment SOP 002.
Frost, A., and Cullen, M. (1997). Marine debris on northern New South Wales beaches (Australia): Sources and the role of beach usage. Mar. Pollut. Bull. 34 (5), 348–352. doi:10.1016/s0025-326x(96)00149-x
Gall, S. C., and Thompson, R. C. (2015). The impact of debris on marine life. Mar. Pollut. Bull. 92, 170–179. doi:10.1016/j.marpolbul.2014.12.041
Galgani, F., Hanke, G., and Maes, T. (2015) Global distribution, composition and abundance of marine litter. Marine Anthropogenic Litter, 29–56.
Gasperia, J, R. D., Bonina, T., Rocherb, V., and Tassin, B. (2014). Assessment of floating plastic debris in surface water along the Seine River. Environ. Pollut. 195, 163–166. doi:10.1016/j.envpol.2014.09.001
Hollein, T., Rojas, M., Pink, A., Gasior, J., and Kelly, J. (2014). Anthropogenic litter in urban freshwater ecosystems: Distribution and microbial interactions. PLOS One 9 (6), 98485. doi:10.1371/journal.pone.0098485
Horvitz, D. G., and Thompson, D. J. (1952). A generalization of sampling without replacement from a finite universe. J. Am. Stat. Assoc. 47, 663–685. doi:10.1080/01621459.1952.10483446
Jambeck, J. R., Geyer, R., Wilcox, C., Siegler, T. R., Perryman, M., Andrady, A., et al. (2015). Plastic waste inputs from land into the ocean. Science 347 (6223), 768–771. doi:10.1126/science.1260352
Kaufmann, P.R., P., Levine, E.G., Robinson, C., Seeliger, and Peck, D.V. (1999). Quantifying physical habitat in wadeable streams. EPA/620/R-99/003. US Environmental Protection Agency. Corvallis, OR: Research Ecology Branch.
Kincaid, T. M., and Olsen, A. R. (2013). spsurvey: Spatial survey design and analysis. Avaliable At: http://www.epa.gov/nheerl/arm/.
Larsen, D. P., Olsen, A. R., and Stevens, D. L. (2008). Using a master sample to integrate stream monitoring programs. J. Agric. Biol. Environ. Statistics 13, 243–254. doi:10.1198/108571108x336593
Lebreton, L. C., Van Der Zwet, J., Damsteeg, J. W., Slat, B., Andrady, A., and Reisser, J. (2017). River plastic emissions to the world’s oceans. Nat. Commun. 8 (1), 15611. doi:10.1038/ncomms15611
Lebreton, L., Slat, B., Ferrari, F., Sainte-Rose, B., Aitken, J., Marthouse, R., et al. (2018). Evidence that the great pacific garbage patch is rapidly accumulating plastic. Sci. Rep. 8, 4666. doi:10.1038/s41598-018-22939-w
Lechnera, A., Keckeisa, H., Lumesberger-Loisla, F., Zensa, B., Kruscha, R., Tritthartb, M., et al. (2014). The Danube so colourful: A potpourri of plastic litter outnumbers fish larvae in europe's second largest river. Environ. Pollut. 188, 177–181. doi:10.1016/j.envpol.2014.02.006
Locher, R., and Ruckstuhl, A. (2012). IDPmisc: Utilities of institute of data analyses and process design.
Mazor, R. (2015). Bioassessment of perennial streams in southern California: A report on the first five years of the stormwater monitoring coalition’s regional stream survey. Costa Mesa, CA: Southern California Coastal Water Research Project.
Moore, C. J., Lattin, G. L., and Zellers, A. F. (2011). Quantity and type of plastic debris flowing from two urban rivers to coastal waters and beaches of Southern California. J. Integr. Coast. Zone Manag. 11, 65–73. doi:10.5894/rgci194
Moore, C. J., Moore, S. L., LeeCaster, M. K., and Weisberg, S. B. (2001a). A comparison of plastic and plankton in the north Pacific central gyre. Mar. Pollut. Bull. 42, 1297–1300. doi:10.1016/s0025-326x(01)00114-x
Moore, C. J., Moore, S. L., Weisberg, S. B., Lattin, G. L., and Zellers, A. F. (2002). A comparison of neustonic plastic and zooplankton abundance in southern California's coastal waters. Mar. Pollut. Bull. 44, 1035–1038. doi:10.1016/s0025-326x(02)00150-9
Moore, S. L., Carreon, M., Weisberg, S. B., and Leecaster, M. (2001b). Composition and distribution of beach debris in Orange County, California. Mar. Pollut. Bull. 42, 241–245. doi:10.1016/s0025-326x(00)00148-x
National Oceanic and Atmospheric Administration (1995). Coastal change analysis program (C-cap): Guidance for regional implementation. Technical Report NMFS 123. Department of Commerce.
National Oceanic and Atmospheric Administration (2001). Coastal change analysis program (C-cap): Guidance for regional implementation. Technical Report NMFS 123. Department of Commerce.
National Research Council (NRC) (2009). Tackling marine debris in the 21st century. Washington, DC: National Academies Press.
Nelms, S. E., Duncan, E. M., Patel, S., Badola, R., Bhola, S., Chakma, S., et al. (2021). Riverine plastic pollution from fisheries: Insights from the Ganges River system. Sci. Total Environ. 756, 143305. doi:10.1016/j.scitotenv.2020.143305
Ode, P.R. (2007). Standard operating procedures for collecting benthic macroinvertebrate samples and associated physical and chemical data for ambient bioassessment in California. Sacramento, CA: Surface Water Ambient Monitoring Program. Available from http://swamp.mpsl.mlml.calstate.edu
R Core Team (2014). R: A language and environment for statistical computing. Vienna, Austria: R Foundation for Statistical Computing.
Rehn, A. C., Mazor, R. D., and Ode, P. R. (2018). An index to measure the quality of physical habitat in California wadeable streams. SWAMP-TM-2018-0005.
Ribic, C., Sheavly, S. B., Rugg, D. J., and Erdmann, E. S. (2012). Trends in marine debris along the U.S. Pacific Coast and Hawai’i 1998–2007. Mar. Pollut. Bull. 64, 994–1004. doi:10.1016/j.marpolbul.2012.02.008
Rochman, C. M. (2018). Microplastics research: From sink to source. Science 360 (6384), 28–29. doi:10.1126/science.aar7734
Ryan, P. G., Moore, C. J., van Framneker, J. A., and Moloney, C. L. (2009). Monitoring the abundance of plastic debris in the marine environment. Philosophical Trans. R. Soc. B 364, 1999–2012. doi:10.1098/rstb.2008.0207
Schiff, K., McLaughlin, K., Moore, S., and Cao, Y. (2019). “Southern California Bight,” in World seas: An environmental evaluation (London, United Kingdom: Academic Press), 465–482.
Schlining, K., von Thun, S., Kuhnz, L., Schlining, B., Lundsten, L., Jacobsen Stout, N., et al. (2013). Debris in the deep: Using a 22-year video annotation database to survey marine litter in Monterey Canyon, central California, USA. Deep-Sea Res. I 79, 96–105. doi:10.1016/j.dsr.2013.05.006
Sheavly, S. B., and Register, K. M. (2007). Marine debris & plastics: Environmental concerns, sources, impacts and solutions. J. Polym. Environ. 15, 301–305. doi:10.1007/s10924-007-0074-3
Stevens, D. L., and Olsen, A. R. (2004). Spatially-balanced sampling of natural resources. J. Am. Stat. Assoc. 99 (465), 262–278. doi:10.1198/016214504000000250
Talley, T. S., Venuti, N., and Whelan, R. (2020). Natural history matters: Plastics in estuarine fish and sediments at the mouth of an urban watershed. Plos one 15 (3), 0229777. doi:10.1371/journal.pone.0229777
Thompson, R. C., Cjmoorevon Saal, F. S., and Swan, S. H. (2009). Plastics, the environment and human health: Current consensus and future trends. Philosophical Trans. R. Soc. B 364, 2153–2166. doi:10.1098/rstb.2009.0053
United Nations Environment Programme (2017). Exploring the potential for adopting alternative materials to reduce marine plastic litter. UN: United Nations Environment Programme.
United States Geological Survey and United States Environmental Protection Agency (2005). National Hydrography dataset plus. Reston, VA: United Nations Environment Programme.
van Emmerik, T., Kieu-Le, T. C., Loozen, M., van Oeveren, K., Strady, E., Bui, X. T., et al. (2018). A methodology to characterize riverine macroplastic emission into the ocean. Front. Mar. Sci. 5, 372. doi:10.3389/fmars.2018.00372
Wagner, S., Klöckner, P., Stier, B., Römer, M., Seiwert, B., Reemtsma, T., et al. (2019). Relationship between discharge and river plastic concentrations in a rural and an urban catchment. Environ. Sci. Technol. 53 (17), 10082–10091. doi:10.1021/acs.est.9b03048
Whitehead, J., Ghosal, S., and Arthur, C. (2010). State of the derwent estuary 2009: A review of pollution sources, loads and environmental quality data from 2003 –2009. Hobart, Tasmania: Derwent Estuary Program, DPIPWE.
Willis, K.A., Eriksen, R., Wilcox, C., and Hardesty, B.D. (2017). Microplastic distribution at different sediment depths in an urban estuary. Frontiers in Marine Science 4, 419.
Wickham, H., Averick, M., Bryan, J., Chang, W., McGowan, L.D.A., François, R., Grolemund, G., Hayes, A., Henry, L., Hester, J., and Kuhn, M. (2019). Welcome to the Tidyverse. Journal of Open Source Software, 4 (43),1686.
Keywords: trash, plastic, Southern California, streams, watersheds, trash mitigation
Citation: McLaughlin K, Mazor R, Sutula M and Schiff K (2023) Regional assessment of trash in Southern California coastal watersheds, United States. Front. Environ. Sci. 11:1210201. doi: 10.3389/fenvs.2023.1210201
Received: 21 April 2023; Accepted: 13 June 2023;
Published: 29 June 2023.
Edited by:
Nsikak U. Benson, Université Claude Bernard Lyon 1, FranceReviewed by:
Pierre Girard, Federal University of Mato Grosso, BrazilCopyright © 2023 McLaughlin, Mazor, Sutula and Schiff. This is an open-access article distributed under the terms of the Creative Commons Attribution License (CC BY). The use, distribution or reproduction in other forums is permitted, provided the original author(s) and the copyright owner(s) are credited and that the original publication in this journal is cited, in accordance with accepted academic practice. No use, distribution or reproduction is permitted which does not comply with these terms.
*Correspondence: Karen McLaughlin, S2FyZW5tQHNjY3dycC5vcmc=
Disclaimer: All claims expressed in this article are solely those of the authors and do not necessarily represent those of their affiliated organizations, or those of the publisher, the editors and the reviewers. Any product that may be evaluated in this article or claim that may be made by its manufacturer is not guaranteed or endorsed by the publisher.
Research integrity at Frontiers
Learn more about the work of our research integrity team to safeguard the quality of each article we publish.