
95% of researchers rate our articles as excellent or good
Learn more about the work of our research integrity team to safeguard the quality of each article we publish.
Find out more
ORIGINAL RESEARCH article
Front. Environ. Sci. , 06 July 2023
Sec. Environmental Informatics and Remote Sensing
Volume 11 - 2023 | https://doi.org/10.3389/fenvs.2023.1207882
 Xi Zhang1
 Ruoque Shen1
 Xiaolin Zhu2
 Baihong Pan3Yangyang Fu1Yi Zheng1Xuebing Chen1
 Qiongyan Peng1
 Wenping Yuan1*
Introduction: Timely and accurately mapping the spatial distribution of rice is of great significance for estimating crop yield, ensuring food security and freshwater resources, and studying climate change. Double-season rice is a dominant rice planting system in China, but it is challenging to map it from remote sensing data due to its complex temporal profiles that requires high-frequency observations.
Methods: We used an automated rice mapping method based on the Synthetic Aperture Radar (SAR)-based Rice Mapping Index (SPRI), that requires no samples to identify double-season rice. We used the Sentinel-1 SAR time series data to capture the growth of rice from transplanting to maturity in 2018, and calculated the SPRI of each pixel by adaptive parameters using cloud-free Sentinel-2 imagery. We extensively evaluated the methods performance at pixel and regional scales.
Results and discussion: The results showed that even without any training samples, SPRI was able to provide satisfactory classification results, with the average overall accuracy of early and late rice in the main producing provinces of 84.38% and 84.43%, respectively. The estimated area of double-season rice showed a good agreement with county-level agricultural census data. Our results showed that the SPRI method can be used to automatically map the distribution of rice with high accuracy at large scales.
Paddy rice is one of the world’s most important staple food crops, feeding half of the population (Kuenzer and Knauer, 2013). Globally, the planting area of rice reached 161 × 106 ha in 2018, accounting for 15% of the planting area of main crops, and 89.8% of paddy rice was planted in Asia (FAO Statistical Databases, 2018). As the world’s population continues to increase, the importance of rice as a food supply increases (Qin et al., 2015; Karthikeyan et al., 2020). Due to its special physiological structure, rice needs to be grown in flooded soils; therefore, rice cultivation has a crucial impact on the world’s freshwater resources (Bouman and Tuong, 2001; Bouman et al., 2007; Dong and Xiao, 2016). In addition, rice fields are one of the main sources of atmospheric methane, which contribute 12%–26% of global anthropogenic CH4 emissions and play an important role in global climate change (Sass et al., 1999; Dong and Xiao, 2016; Canadell and Monteiro, 2021). Therefore, timely and accurate information on rice planting areas is crucial for maintaining food security and freshwater resource stability and studying climate change. In addition, China has a vast rice planting area, and there are significant differences in temperature during the rice growing season in different regions. The impact of climate change on China’s rice yield will also have significant spatiotemporal differences (Saud et al., 2022). Therefore, understanding the exact growth location of rice is crucial for assessing the impact of climate change on rice yield.
Satellite-based methods are increasingly becoming the primary means for identifying and monitoring crop distributions, as they can provide accurate and timely information on crop phenology and growth (Atzberger, 2013; Zhang X. et al., 2018; Karthikeyan et al., 2020; Zhan et al., 2021). Most existing studies uses two types of remote sensing data: optical data and SAR data (Joshi et al., 2016; Zhao et al., 2021). Optical remote sensing data has been widely used to study the spatial distribution of rice at regional and local scales. For example, Jin et al. (2016) used normalized difference vegetation index (NDVI), land surface water index (LSWI), and enhanced vegetation index (EVI) data from multi-temporal Landsat to produce rice maps of the Sanjiang Plain in northeast China from 2010 to 2012, with a resolution of 30 m and user’s and producer’s accuracy of 90% and 94% respectively. Liu et al. (2018) established a paddy rice map of northeast China with high accuracy basing on a sub-pixel method using LSWI time series of MODIS products.
Although it is possible to use optical data for mapping rice in northeast China, where the longer growing seasons and fewer clouds allow for sufficient high-quality data availability (Dong et al., 2016), the frequent clouds and rain of the southeast make it much more challenging (Zhan et al., 2021). In this case, the use of SAR data is more effective. SAR signals are able to operate day and night independently of weather conditions (Rogan and Chen, 2004; Zhu et al., 2012). Early studies have found that SAR can accurately capture the flooding of rice, as the radar backscatter signal of rice fields is low during the transplanting stage (Kurosu et al., 1995; Shao et al., 2001). Kurosu et al. (1995) first tried to use ERS-1 C-band SAR data to monitor rice growth and found that SAR data could suitably capture the signal of the rice growth period. Later, common-polarization backscatter (e.g., HH) and common-polarization ratio (e.g., HH/VV) images became more common in rice mapping due to their high correlation with rice growth cycles (Bouvet et al., 2009). A recent study used VH backscatter data provided by Sentinel-1 to map rice in the Mekong Delta in 2015 and found that the VH backscatter is more sensitive than the VV backscatter to capture changes in the growth period of rice, with an overall accuracy of 87.2% (Nguyen, et al., 2016). Sun et al. (2023) produced a 20 m resolution rice region map of five countries in Southeast Asia in 2019, with an overall accuracy of 92.2%. Carrasco et al. (2022) created seven rice field maps of Japan from 1985 to 89, 1990 to 94, 1995 to 99, 2000 to 04, 2005 to 09, 2010 to 14, and 2015 to 19, with an overall accuracy of 83%–95%. Other studies have combined optical and SAR data for rice identification (Onojeghuo et al., 2018; Chen et al., 2020; He et al., 2021). For example, a phenology-based rice mapping study in Peninsular Malaysia using VH (capturing low backscatter signals in the rice transplanting stage) and NDVI (reflecting the differential growth conditions from rice growth to maturity) time series data of Sentinel-1/2 satellites has achieved good results with an overall accuracy of 95.95% (Fatchurrachman et al., 2022).
In the past few decades, a plethora of remote sensing-based crop identification methods, such as threshold-based methods (Bazzi et al., 2019; Li et al., 2020; Wei et al., 2022), phenology-based methods (Xiao et al., 2002; 2006; Xiao et al., 2021; Kobayashi and Ide, 2022), and machine learning-based methods have been developed (Ndikumana et al., 2018; Zhong et al., 2019; Chen et al., 2020). For instance, in a rice mapping study based on SAR data, researchers collected 50,000 ground sample sites and used a feature-based decision method to map the distribution of rice in Yunlin and Changhua counties in central Taiwan in 2017, with an overall accuracy of 91.9% (Chang et al., 2020). Fiorillo et al. (2020) collected about 400 sample sites per year from 2017 to 2019 and mapped the spatial distribution of rice in Senegal using Sentinel-1/2 imagery based on the random forest method, with a maximum accuracy of 87% and a kappa coefficient of 0.8. Despite the existence of different methods for rice mapping, most of them require massive samples and rely heavily on the selection of training samples. Obtaining large amounts of real-time samples is time-consuming and labor-intensive, which limits the application of these methods to update rice maps in real time over large areas (Mosleh et al., 2015; Dong et al., 2020).
As the world’s largest rice producer, China had 30 × 106 ha of rice planted area in 2018, accounting for 18% of the world’s total rice sown area (FAO Statistical Databases, 2018). Particularly the sown area of double-season rice in southern China was 10 × 106 ha, accounting for one-third of China’s total sown area, making it an important agricultural production area in China (National Bureau of Statistics of China, 2019). In hilly areas of southern China, the mixed patterns of cultivation and high fragmentation of cultivated land, resulting from abundant rainfall and heat, pose challenges for identifying rice planting areas (Qiu et al., 2003; Pan et al., 2021; Wei et al., 2022; Zheng et al., 2022). The backscattering coefficient of rice growth showed a V-shaped growth curve and the number of flood signals varied across rice cultivation systems (Pan et al., 2021). The VH time series of single-season rice theoretically shows a V-shaped valley, while double-season rice shows two. The accurate identification of flood signals is critical for mapping rice. However, due to the short growth period of double season rice and the weak flood signal intensity of late rice, it is challenging to fully capture the signals of two V-shaped valleys, making it difficult to identify double season rice using traditional methods (Xu et al., 2023).
In order to solve the problem of traditional machine learning relying on samples for identifying rice, we have developed a rice index that can be used to identify double season rice in a large area without the need for samples. In this study, we used a phenology-based sample-free identification method to map rice planting areas using time series SAR data provided by Sentinel-1. Using the proposed method, we mapped double-season rice in nine provinces in southern China (accounting for 99% of the total area) in 2018 with a spatial resolution of 10 m. To validate the accuracy of rice identification, we used county level statistics data obtained from various municipal statistical bureaus for regional scale verification. In the main producing provinces of double-season rice, field survey data were used to verify the accuracy at the pixel scale. Our results indicate that the proposed method is feasible for rice identification on a large scale without using samples, which is very helpful for large-scale crop recognition updates and backtracking identification.
In China, there are two main modes of rice cultivation, namely, single-season rice and double-season rice. Due to the differences in hydrothermal conditions, double-season rice is mainly distributed in southern China (Yang et al., 2022). We have identified nine provinces in southern China as planting areas of double-season rice. They are Hunan (HuN), Jiangxi (JX), Guangxi (GX), Guangdong (GD), Hainan (HaiN), Hubei (HB), Anhui (AH), Fujian (FJ), and Zhejiang (ZJ) (Figure 1), accounting for 99% of the double-season rice planting area in China.
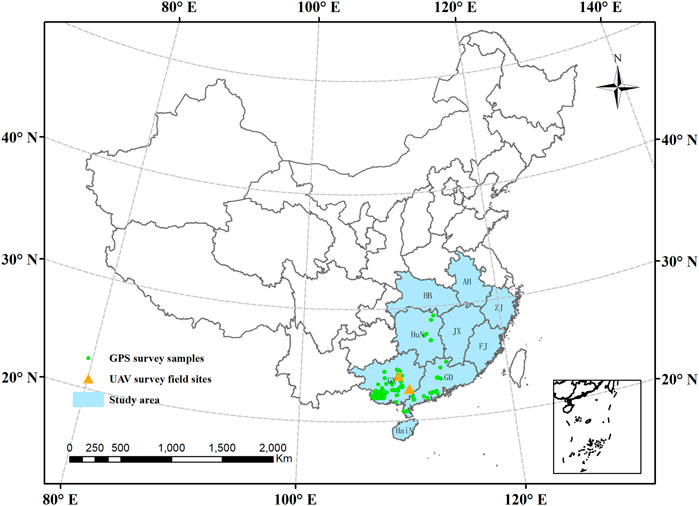
FIGURE 1. Study area of double season rice planting. The study area covers nine provinces in China (blue area). Solid black lines indicate the boundaries of provinces. Green dots represent field samples. Yellow triangles indicate field survey sites with UAV measurement covering 1 km2 area. The nine provinces are Hunan (HuN), Jiangxi (JX), Guangxi (GX), Guangdong (GD), Hainan (HaiN), Hubei (HuB), Anhui (AH), Fujian (FJ), and Zhejiang (ZJ), respectively.
The rice growth process can be divided into three main periods: sowing-transplanting, growing and harvesting (Le Toan et al., 1997). During the sowing-transplanting period, the paddy field is a mixed state of rice seedlings and ponded water. The main contribution to the satellite signal during this period comes from the surface water, which backscattering energy is weaker than that of rice seedlings. The surface water produces a specular reflection of the SAR signal, which weakens the pulse reflection to the radar and produces a low backscattering coefficient. Therefore, the VH value of paddy fields during the sowing-transplanting period is lower than that of other vegetation, which is critical to distinguish rice from other crops (Phan et al., 2018; Chang et al., 2020). During the growth period, rice has a higher backscattering value, and this value eventually approaches that of other vegetation. Based on the low backscattering value during the sowing-transplanting period, high backscattering value during the growing period and large dynamic range of backscattering value during the growth period, Xu et al. (2023) developed the SAR-based Paddy Rice Mapping index (SPRI) to distinguish rice from other crops.
Mapping rice with the SPRI algorithm includes three steps: 1) setting boundaries to define vegetation-water zones, with the upper boundary being the maximum intensity of local vegetation v) (hereinafter referred to as “V-line”) and the lower boundary representing the intensity of the local water surface w) (hereinafter referred to as “W-line”) (Figure 2); 2) using the formulae f(D), f(W), and f(V) to quantify the above three characteristics of rice growth, and the product of these formulas is defined as SPRI. Specifically, f(D) is the dynamic range of backscattering during the growth period, f(W) reflects the minimum backscattering and the proximity of the water body, and f(V) reflects the proximity of the maximum backscattering to natural vegetation. To amplify the differences between rice and other crops, f(D) is normalized using a sigmoid function so that its value ranges from 0 to 1. The equations are as follows:
and lastly 3) classify unknown pixels based on the SPRI index.
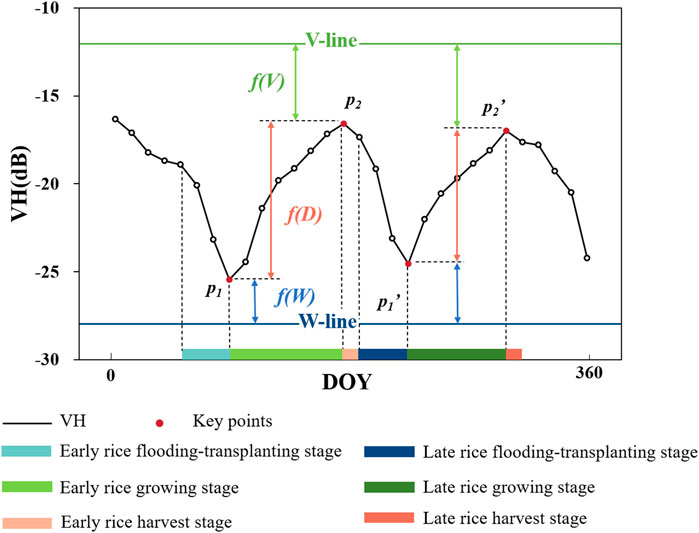
FIGURE 2. Schematics of SPRI method. f(D), f(W), f(V) characterize three features of rice growth process. p1, p2 are the key points of early rice and p1’, p2’ are the key points of late rice.
When calculating SPRI in different regions, it is necessary to determine the backscatter intensity of the two parameters of the V line and the W line. First, we used NDVI and the normalized difference water index (NDWI) synthesized by annual maxima to identify temporary water bodies and vegetated pixels. In this study, NDVI above 0.4 is considered to represent a vegetated pixel (Peng et al., 2019), while NDVI above 0.4 and NDWI greater than 0 are considered a temporary water body (McFEETERS, 1996). Then, we calculated the annual synthetic maximum for backscatter intensity for pixels covered by vegetation and the annual synthetic minimum for backscatter intensity for pixels covered by water. Finally, the values of the V and W lines were calculated as a pre-defined percentile for the maximum backscatter intensity and minimum scattering intensity respectively, and 10th percentile was selected for all regions in this study. The SPRI value indicates the probability of growing rice in an unknown pixel. The larger the value, the more likely the pixel is to be rice. We used agricultural statistics for early and late rice at the provincial level to determine the threshold for the SPRI value. Pixels with index values above the threshold were considered “rice”. Specifically, among the specified provinces, we selected the top N pixels with the highest index value, and the total area of all N pixels is equal to the area recorded in the rice statistics of the surveyed province. However, due to differences in topography, environment and planting systems, the timing of the flood transplantation phase of the same rice species varies throughout the region. Therefore, we obtained different VH time series in different provinces according to different flood transplanting and early growth stages of rice and limited the range of obtaining maximum and minimum values on that time series to reduce the influence of other crops on classification.
We first evaluated the results of double-season rice identification using reference samples from UAV imagery and ground survey. We assessed the pixel-level accuracy by calculating the producer accuracy (PA), user accuracy (UA), and overall accuracy (OA):
where, RR is the number of pixels in which both the ground survey and the identified results are rice. RN is the number of pixels where, although the actual ground object is rice, the result is non-rice. NR is the number of pixels recognized as rice although the actual ground object is non-rice, and NN represents the number of pixels where both the actual ground object and recognition results are non-rice.
Second, compared with county-level agricultural statistics, we calculated the coefficient of determination (R2), root mean square error (RMSE), and relative mean absolute error (RMAE) to assess the identification accuracy at the regional scale. The formulae are as follows:
where, IAi and SAi are the identified area and statistical area of the ith county respectively, and n represents the number of counties in a given province. The unit of RMSE is thousand hectares (103 ha).
We used Sentinel-1’s Ground Range Detected (GRD, Level 1), a calibrated and ortho-corrected product accessed through Google Earth Engine (GEE), to generate a 10 m SAR VH time series with a 12-day temporal resolution. First, we performed thermal noise cancellation, radiation calibration, and terrain correction on each acquired image. Then, to correct for speckle noise in SAR images, we applied a Savitzky-Golay (SG) filter with a window size of 5, order and polynomial degree of 2 to smooth the time series. In addition, we used all available Sentinel-2 TOA data from January to December 2018 and constructed a time series of 12-daycomposited 10 m NDVI and NDWI data using the GEE platform to reflect vegetation and water body land cover information.
We used ground sample data to verify the accuracy of the identification to test the performance of this method. We collected field samples in four main producing provinces growing double-season rice in southern China (Hunan, Jiangxi, Guangdong and Guangxi) in July and October 2018 to calculate a confusion matrix for accuracy verification at the pixel scale (Figure 1).
We used the Finer Resolution Observation and Monitoring of Global Land Cover (FROM-GLC) product with 10 m resolution to extract cropland locations (Gong et al., 2019). The total sown area of double-season rice in each province in 2018 was acquired from the official website of the National Bureau of Statistics of China. The 2018 county-level validation data was acquired from the statistical yearbooks of each province or municipality.
We produced a spatial distribution map of double-season rice at 10 m spatial resolution in nine provinces of China in 2018 using the SPRI method (Figure 3). To verify the stability and reliability of our method, we first conducted a verification in the four major producing provinces (85% of China’s total double-season rice area) using both GPS survey data and UAV farmland data. We randomly selected sample points in the UAV survey area and combined all GPS survey samples to assess pixel-level accuracy. Based on double-season rice and non-double-season rice survey samples, the overall identification accuracy across the four provinces ranged from 81.02% to 90.05% for early rice (Table 1) and between 79.7% and 88.89% for late rice (Table 2). Hunan is one of the largest double-season rice planting provinces in China, accounting for more than 28.38% of China’s double-season rice planting areas. The user’s, producer’s, and overall accuracy of early (late) rice in Hunan were 90.33% (76.91%), 88.28% (86.27%), and 90.05% (85.01%), respectively. Jiangxi is also one of the main double-season rice planting areas in China, with a planting area accounting for 25.28% of double-season rice in China. The user’s, producer’s, and overall accuracy of early (late) rice in Jiangxi were 73.84% (73.85%), 80.19% (86.56%), and 82.33% (79.70%), respectively.
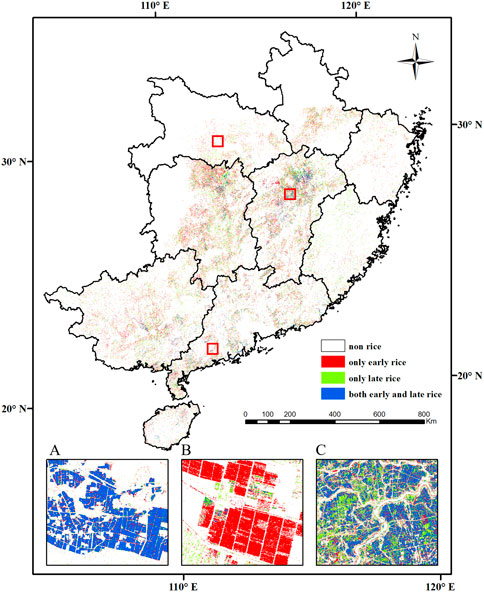
FIGURE 3. Identification map of double-season rice in southern China in 2018. (A–C) are enlarged maps showing local details of Guangdong, Hubei, and Jiangxi respectively.
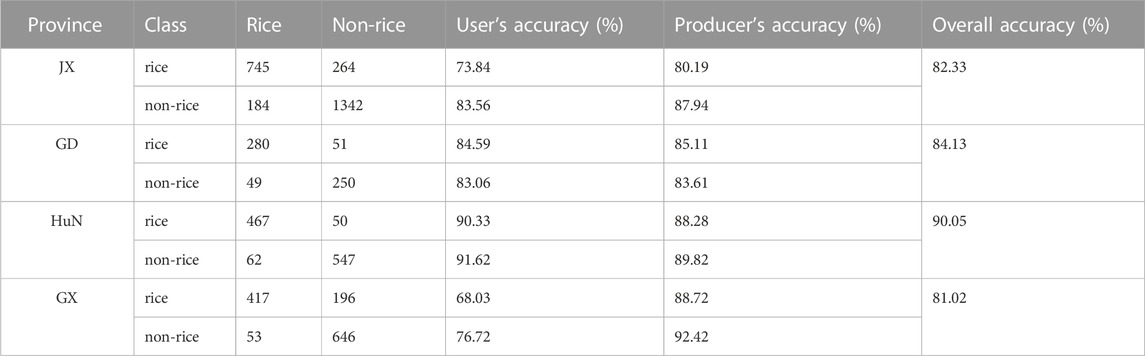
TABLE 1. Confusion matrix of early rice identification map in four main producing provinces in 2018.
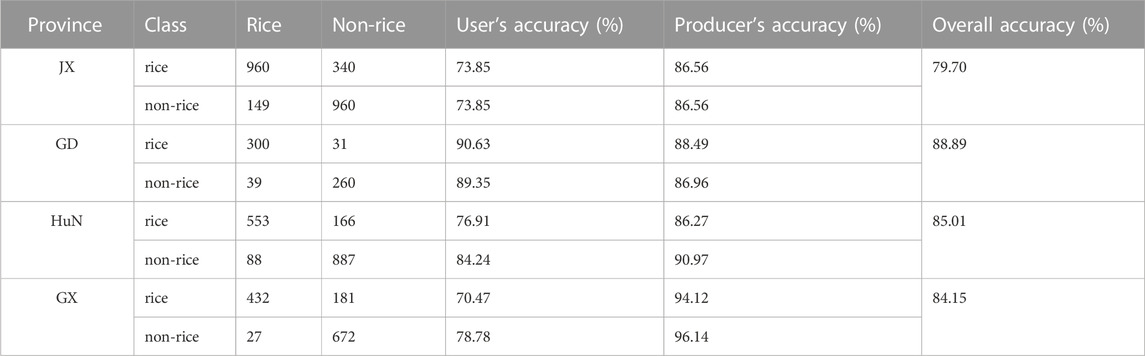
TABLE 2. Confusion matrix of late rice identification map in four main producing provinces in 2018.
Subsequently, the agricultural statistical data we gathered was utilized to assess the accuracy at the county level across all examined provinces (Figure 4). Our method exhibited satisfactory performance in accurately identifying both early and late rice within regions where county-level data was available. The statistical metrics, namely, R2, RMSE, and RMAE, were calculated to quantify the accuracy. For early rice, the R2, RMSE, and RMAE values were determined as 0.77, 4.52 (103 ha), and 0.35, respectively. Notably, the performance for late rice was even better, with R2, RMSE, and RMAE values of 0.82, 4.29 (103 ha), and 0.30, respectively.
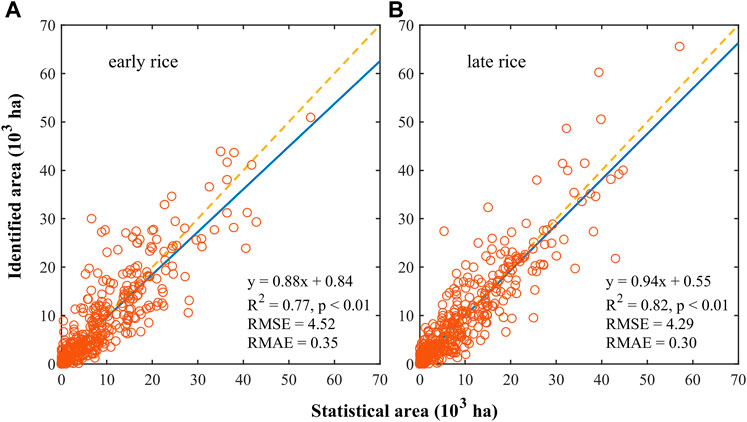
FIGURE 4. Comparison between the county-level identified area and statistical planting area in 2018. (A) early rice (B) late rice.
For each province, the R2 between the identified and agricultural statistical areas of early rice ranged from 0.63 to 0.82. The RMSE ranged from 1.21 to 5 .50 (103 ha), and RMAE ranged from 0.27 to 0.58 (Figure 5). For late rice in each province, the method performed better in some areas, with R2 ranging from 0.59 to 0.88, RMSE ranging from 1.72 to 6.12 (103 ha), and RMAE ranging from 0.20 to 0.55 (Figure 6). The accuracy of late rice identification in Hunan, Guangdong, Guangxi, Anhui, Hainan, and Hubei provinces was higher than that of early rice. For example, in Guangxi, the R2, RMSE, and RMAE of late rice were 0.78, 4.37 (103 ha), and 0.30, respectively while the R2, RMSE, and RMAE of early rice were 0.63, 5.14 (103 ha), and 0.43, respectively. For the two largest double-season rice cultivation areas (Hunan and Jiangxi) in China, the method showed good performance between identified and agricultural statistical areas for both early and late rice, where the R2, RMSE, and RMAE of early rice were 0.76, 5.50 (103 ha) and 0.28 in Hunan, and 0.82, 4.94 (103 ha), and 0.36 in Jiangxi, respectively. For late rice, the R2, RMSE, and RMAE were 0.88, 3.96 (103 ha), and 0.20 in Hunan, and 0.80, 6.12 (103 ha), and 0.37 in Jiangxi, respectively. Although there was a high R2 (0.64) between identified and agricultural statistical areas in Zhejiang, the identified area noticeably underestimated agricultural statistical areas. Zhejiang had the worst verification performance at the county level where the RMAE was 0.57 for early rice and 0.54 for late rice, with severe omission errors in areas where statistics were available.
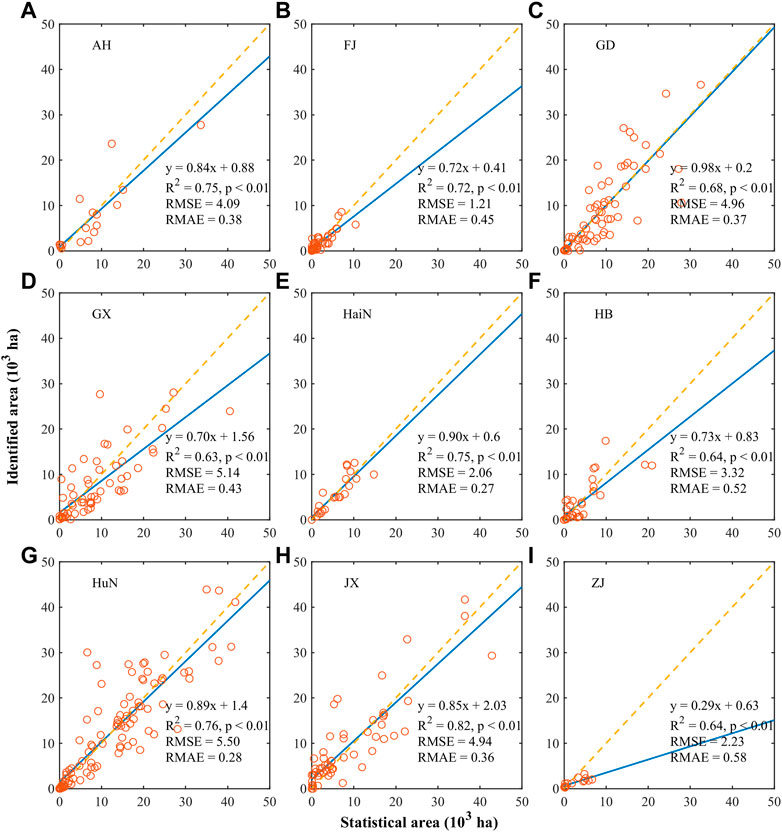
FIGURE 5. Comparison between the county-level identification area and statistical planting area of early rice in nine provinces in 2018. The abbreviation of province is same as Figure 1. The yellow dashed lines indicate the 1:1 line, and the blue solid lines indicate the regression lines.
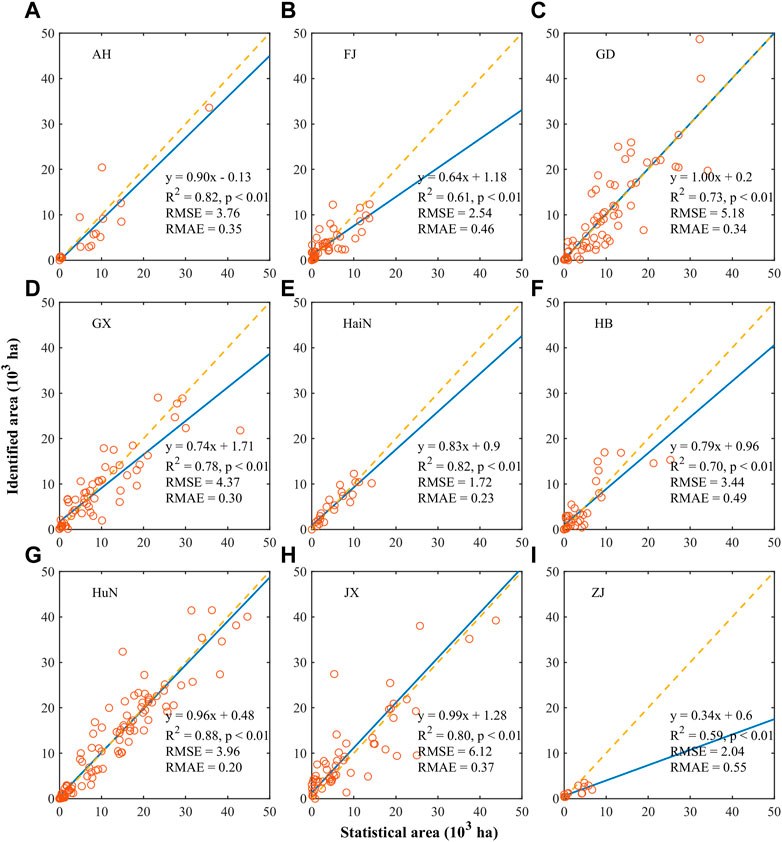
FIGURE 6. Comparison between the county-level identification area and statistical planting area of late rice in nine provinces in 2018. The abbreviation of province is same as Figure 1. The yellow dashed lines indicate the 1:1 line, and the blue solid lines indicate the regression lines.
In this study, we produced double-season rice maps with a spatial resolution of 10 m in southern China in 2018 based on the SPRI method. Validation using field sample data and agricultural statistics showed that the produced double-season rice maps have high accuracy at both the pixel and regional scales.
High spatial resolution rice maps can capture the distribution of rice fields more precisely and reduce the impact of mixed pixels on recognition accuracy (Xiao, 2003; Zhang et al., 2009). Compared to the 500 m resolution maps of Xiao et al. (2005) and Sun et al. (2009), the 10 m spatial resolution rice map produced in this study more accurately reflects the distribution of rice fields in southern China, especially in hilly areas with high fragmentation of planting. In addition, our method can automatically identify rice planting areas without sampling points, and has achieved good accuracy in major producing provinces. Compared with traditional machine learning algorithms (Zhang M. et al., 2018; Bazzi et al., 2019; Cai, et al., 2019; Zhang et al., 2020), our method also saves a lot of time and labor (Dong et al., 2020). Therefore, our method is more flexible in both large-scale applications and long-term retrospective mapping research. Recently, Pan et al. (2021) used the time-weighted dynamic time warping (TWDTW) method to produce the first large-scale maps of double-season rice in China, with a spatial resolution of 10 m. The overall accuracy of the map for four major producing provinces (HuN, JX, GD, GX) were 90.5%, 91.88%, 88.07%, and 88.17% for early rice, and 90.36%, 89.18%, 88.25%, and 88.40% for late rice, respectively. While our accuracy is slightly lower than that reported by Pan et al. (2021), we achieved satisfactory results without the need for any samples. Other studies have also used machine learning to classify double-season rice in smaller areas of Hunan Province and Jiangxi Province. He et al. (2021) achieved an overall accuracy of 85% and 96% for early and late rice, respectively, while Tian et al. (2018) achieved user’s accuracy of 97.9% and 96.3% for early and late rice, respectively. However, these studies were limited to regional-scale applications, and their results were uncertain when applied on a large scale due to the limitations of sample size.
Although our method can effectively and accurately identify large-scale rice areas, there are still some uncertainties in the identification process. Data quality affects the accuracy of classification. First, while SAR data is not affected by cloud or lighting conditions, its inherent noise makes classification results uncertain, and SAR backscattered signals are damaged by topographic effects, even when they are radiometric terrain corrected (Steele-Dunne et al., 2017; Fatchurrachman et al., 2022). Pan et al. (2021) found that rice paddies in mountainous areas are small and scattered, especially in Fujian province, where 64% of rice fields are in mountainous areas. Affected by topography, our classification results in Fujian province were relatively unsatisfactory, in which the RMAE of early and late rice was 0.45 and 0.46 respectively. Secondly, we used two optical indices, NDVI and NDWI, to determine the area of vegetation coverage and temporary water bodies. The W-line value is the value at the bottom 10% of the minimum backscattering value in all temporary water bodies, while the V-line value is the value in the top 10% of the maximum backscattering value in the vegetation-covered area. In southern China, due to the influence of the cloudy and rainy weather, the number of effective optical images is insufficient, which affects the determination of the final value of W and V lines, and ultimately the recognition accuracy (Wu et al., 2011). Finally, we calculated the quantity and proportion of data used for county-level validation (Figure 7). Our results performed poorly in Zhejiang Province, possibly due to the limited data available for county-level validation and the low rice planting area in the validation area, which cannot represent the identification of the main production area.
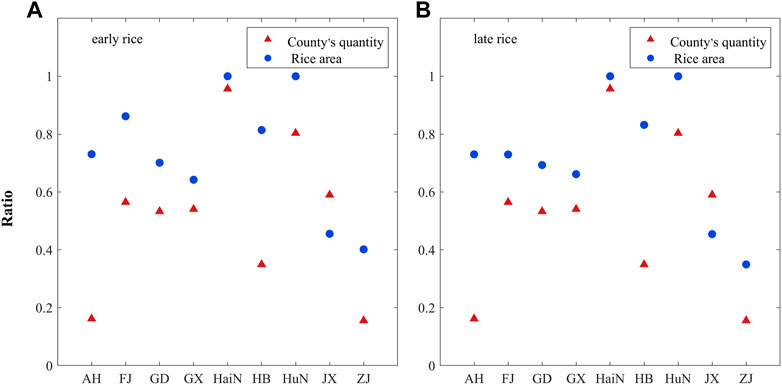
FIGURE 7. The ratio of counties with available statistical data to the total number of counties (triangles) and the ratio of corresponding statistical area to the total area (circles) of each province. (A) early rice (B) late rice.
In this study, a map of double season rice in southern China for the year 2018 was generated using a sample-free automatic method at a large scale. The study further validated the feasibility and adaptability of this method for large-scale applications, establishing its reliability and effectiveness. Our proposed method mainly distinguished rice from other crops by capturing and amplifying characteristics during growth. In future work, our method can be applied to the identification of other crops.
China is the world’s largest rice producer, accounting for 18% of the world’s rice-sown area in 2018. In this study, we used SAR data from the Sentinel-1 satellite to map double-season rice in southern China in 2018 based on SPRI, a sample-free identification method. In the main producing provinces, we use randomly generated samples based on UAV survey images and all samples from handheld GPS field expeditions for verification. The highest recognition accuracy of early rice was recorded in Hunan Province, where the producer’s accuracy, user’s accuracy, and overall accuracy of early rice were 88.28%, 90.33%, and 90.05%, respectively. By comparison, Guangdong Province had the highest recognition accuracy of late rice, in which the producer’s accuracy, user’s accuracy, and overall accuracy were 88.49%, 90.63%, and 88.89%, respectively. In addition, the sown area of early and late rice determined in this study showed a high correlation with the county-level agricultural statistics from the statistical bureaus of each city. The early and late rice areas of all surveyed provinces were compared with the existing county-level agricultural statistics, where the R2 of early and late rice were 0.77 and 0.82 respectively. More importantly, using the SPRI method for rice identification does not require ground samples, and larger-scale rice mapping can be performed by adjusting the W and V lines of rice in different regions. The results of this study provide support for subsequent research on rice yield estimation, and the method used in this study enables years of rice retrospective mapping.
The original contributions presented in the study are included in the article/Supplementary material, further inquiries can be directed to the corresponding author.
XZ, RS, and XZ contributed to conception and design of the study. WY provided theoretical guidance. XZ conducted the statistical analysis and wrote the first draft of the manuscript. WY and XZ reviewed and edited the manuscript. Field data collection was conducted by BP and QP, YZ, YF, and XC supervised the study. All authors contributed to the article and approved the submitted version.
This research was funded by Guangdong Province Basic and Application Key Project, grant number 2020B0301030004.
The authors would like to thank the editor and the reviewers for their valuable comments.
The authors declare that the research was conducted in the absence of any commercial or financial relationships that could be construed as a potential conflict of interest.
All claims expressed in this article are solely those of the authors and do not necessarily represent those of their affiliated organizations, or those of the publisher, the editors and the reviewers. Any product that may be evaluated in this article, or claim that may be made by its manufacturer, is not guaranteed or endorsed by the publisher.
Atzberger, C. (2013). Advances in remote sensing of agriculture: Context description, existing operational monitoring systems and major information needs. Remote Sens. 5 (2), 949–981. doi:10.3390/rs5020949
Bazzi, H., Baghdadi, N., El Hajj, M., Zribi, M., Minh, D. H. T., Ndikumana, E., et al. (2019). Mapping paddy rice using sentinel-1 SAR time series in camargue, France. Remote Sens. 11 (7), 887. doi:10.3390/rs11070887
Bouman, B. A. M., and Tuong, T. P. (2001). Field water management to save water and increase its productivity in irrigated lowland rice. Agric. Water Manag. 49 (1), 11–30. doi:10.1016/S0378-3774(00)00128-1
Bouman, B. A. M., Humphreys, E., Tuong, T. P., and Barker, R. (2007). “Rice and water,” in Advances in agronomy (Elsevier), 187–237. doi:10.1016/S0065-2113(04)92004-4
Bouvet, A., Le Toan, T., and Lam-Dao, N. (2009). Monitoring of the rice cropping system in the Mekong Delta using ENVISAT/ASAR dual polarization data. IEEE Trans. Geoscience Remote Sens. 47 (2), 517–526. doi:10.1109/TGRS.2008.2007963
Cai, Y., Lin, H., and Zhang, M. (2019). Mapping paddy rice by the object-based random forest method using time series Sentinel-1/Sentinel-2 data. Adv. Space Res. 64 (11), 2233–2244. doi:10.1016/j.asr.2019.08.042
Canadell, J. G., and Monteiro, P. M. S. (2021). “Global carbon and other biogeochemical cycles and feedbacks,” in Climate change 2021: The physical science basis. Contribution of working group I to the sixth assessment report of the intergovernmental panel on climate change. Editors V. Masson-Delmotte, P. Zhai, A. Pirani, S. L. Connors, C. Péan, S. Bergeret al. (Cambridge: Cambridge University Press), 673–816.
Carrasco, L., Fujita, G., Kito, K., and Miyashita, T. (2022). Historical mapping of rice fields in Japan using phenology and temporally aggregated Landsat images in Google Earth Engine. ISPRS J. Photogrammetry Remote Sens. 191, 277–289. doi:10.1016/j.isprsjprs.2022.07.018
Chang, L., Chen, Y. T., Wang, J. H., and Chang, Y. L. (2020). Rice-field mapping with sentinel-1A SAR time-series data. Remote Sens. 13 (1), 103. doi:10.3390/rs13010103
Chen, N., Yu, L., Zhang, X., Shen, Y., Zeng, L., Hu, Q., et al. (2020). Mapping paddy rice fields by combining multi-temporal vegetation index and synthetic aperture radar remote sensing data using Google Earth engine machine learning platform. Remote Sens. 12 (18), 2992. doi:10.3390/rs12182992
Dong, J., and Xiao, X. (2016). Evolution of regional to global paddy rice mapping methods: A review. ISPRS J. Photogramm. Remote Sens. 119, 214–227. doi:10.1016/j.isprsjprs.2016.05.010
Dong, J., Xiao, X., Menarguez, M. A., Zhang, G., Qin, Y., Thau, D., et al. (2016). Mapping paddy rice planting area in northeastern Asia with Landsat 8 images, phenology-based algorithm and Google Earth Engine. Remote Sens. Environ. 185, 142–154. doi:10.1016/j.rse.2016.02.016
Dong, J., Fu, Y., Wang, J., Tian, H., Fu, S., Niu, Z., et al. (2020). Early-season mapping of winter wheat in China based on Landsat and Sentinel images. Earth Syst. Sci. Data 12 (4), 3081–3095. doi:10.5194/essd-12-3081-2020
FAO Statistical Databases (2018). Available online: http://digital.library.wisc.edu/1711.web/faostat (accessed on November 12, 2022).
Fatchurrachman, , Rudiyanto, R., Che soh, N., Shah, R. M., Giap Goh, E., Setiawan, B. I., et al. (2022). High-resolution mapping of paddy rice extent and growth stages across peninsular Malaysia using a fusion of sentinel-1 and 2 time series data in Google Earth engine, Remote Sens. 14 (8), 1875. doi:10.3390/rs14081875
Fiorillo, E., Di Giuseppe, E., Fontanelli, G., and Maselli, F. (2020). Lowland rice mapping in sédhiou region (Senegal) using sentinel 1 and sentinel 2 data and random forest. Remote Sens. 12 (20), 3403. doi:10.3390/rs12203403
Gong, P., Liu, H., Zhang, M., Wang, J., and Huang, H. (2019). Stable classification with limited sample: Transferring a 30-m resolution sample set collected in 2015 to mapping 10-m resolution global land cover in 2017. Sci. Bull. 64 (6), 370–373. doi:10.1016/j.scib.2019.03.002
He, Y., Dong, J., Liao, X., Sun, L., Wang, Z., You, N., et al. (2021). Examining rice distribution and cropping intensity in a mixed single- and double-cropping region in South China using all available Sentinel 1/2 images. Int. J. Appl. Earth Observation Geoinformation 101, 102351. doi:10.1016/j.jag.2021.102351
Jin, C., Xiao, X., Dong, J., Qin, Y., and Wang, Z. (2016). Mapping paddy rice distribution using multi-temporal Landsat imagery in the Sanjiang Plain, northeast China. Front. Earth Sci. 10 (1), 49–62. doi:10.1007/s11707-015-0518-3
Joshi, N., Baumann, M., Ehammer, A., Fensholt, R., Grogan, K., Hostert, P., et al. (2016). A review of the application of optical and radar remote sensing data fusion to land use mapping and monitoring. Remote Sens. 8 (1), 70. doi:10.3390/rs8010070
Karthikeyan, L., Chawla, I., and Mishra, A. K. (2020). A review of remote sensing applications in agriculture for food security: Crop growth and yield, irrigation, and crop losses. J. Hydrology 586, 124905. doi:10.1016/j.jhydrol.2020.124905
Kobayashi, S., and Ide, H. (2022). Rice crop monitoring using sentinel-1 SAR data: A case study in saku, Japan. Remote Sens. 14 (14), 3254. doi:10.3390/rs14143254
Kuenzer, C., and Knauer, K. (2013). Remote sensing of rice crop areas. Int. J. Remote Sens. 34 (6), 2101–2139. doi:10.1080/01431161.2012.738946
Kurosu, T., Fujita, M., and Chiba, K. (1995). Monitoring of rice crop growth from space using the ERS-1 C-band SAR. IEEE Trans. Geosci. Remote Sens. 33 (4), 1092–1096. doi:10.1109/36.406698
Le Toan, T., Ribbes, F., Wang, L. F., Floury, N., Ding, K. H., Kong, J. A., et al. (1997). Rice crop mapping and monitoring using ERS-1 data based on experiment and modeling results. IEEE Trans. Geosci. Remote Sens. 35 (1), 41–56. doi:10.1109/36.551933
Li, H., Fu, D., Huang, C., Su, F., Liu, Q., Liu, G., et al. (2020). An approach to high-resolution rice paddy mapping using time-series sentinel-1 SAR data in the mun river basin, Thailand. Remote Sens. 12 (23), 3959. doi:10.3390/rs12233959
Liu, W., Dong, J., Xiang, K., Wang, S., Han, W., Yuan, W., et al. (2018). A sub-pixel method for estimating planting fraction of paddy rice in Northeast China. Remote Sens. Environ. 205, 305–314. doi:10.1016/j.rse.2017.12.001
McFEETERS, S. K. (1996). The use of the Normalized Difference Water Index (NDWI) in the delineation of open water features. Int. J. Remote Sens. 17 (7), 1425–1432. doi:10.1080/01431169608948714
Mosleh, M., Hassan, Q., and Chowdhury, E. (2015). Application of remote sensors in mapping rice area and forecasting its production: A review. Sensors 15 (1), 769–791. doi:10.3390/s150100769
National Bureau of Statistics of China (2019). National statistical yearbook. Beijing, China: China Statistics Press.
Ndikumana, E., Ho Tong Minh, D., Baghdadi, N., Courault, D., and Hossard, L. (2018). Deep recurrent neural network for agricultural classification using multitemporal SAR sentinel-1 for camargue, France. Remote Sens. 10 (8), 1217. doi:10.3390/rs10081217
Nguyen, D. B., Gruber, A., and Wagner, W. (2016). Mapping rice extent and cropping scheme in the Mekong Delta using Sentinel-1A data. Remote Sens. Lett. 7 (12), 1209–1218. doi:10.1080/2150704X.2016.1225172
Onojeghuo, A. O., Blackburn, G. A., Wang, Q., Atkinson, P. M., Kindred, D., and Miao, Y. (2018). Mapping paddy rice fields by applying machine learning algorithms to multi-temporal Sentinel-1A and Landsat data. Int. J. Remote Sens. 39 (4), 1042–1067. doi:10.1080/01431161.2017.1395969
Pan, B., Zheng, Y., Shen, R., Ye, T., Zhao, W., Dong, J., et al. (2021). High resolution distribution dataset of double-season paddy rice in China. Remote Sens. 13 (22), 4609. doi:10.3390/rs13224609
Peng, W., Kuang, T., and Tao, S. (2019). Quantifying influences of natural factors on vegetation NDVI changes based on geographical detector in Sichuan, Western China. J. Clean. Prod. 233, 353–367. doi:10.1016/j.jclepro.2019.05.355
Phan, H., Le Toan, T., Bouvet, A., Nguyen, L., Pham Duy, T., and Zribi, M. (2018). Mapping of rice varieties and sowing date using X-band SAR data. Sensors 18 (2), 316. doi:10.3390/s18010316
Qin, Y., Xiao, X., Dong, J., Zhou, Y., Zhu, Z., Zhang, G., et al. (2015). Mapping paddy rice planting area in cold temperate climate region through analysis of time series Landsat 8 (OLI), Landsat 7 (ETM+) and MODIS imagery. ISPRS J. Photogramm. Remote Sens. 105, 220–233. doi:10.1016/j.isprsjprs.2015.04.008
Qiu, J., Tang, H., Frolking, S., Boles, S., Xiao, X., Li, C., et al. (2003). Mapping single-, double-, and triple-crop agriculture in China at 0.5° × 0.5° by combining county-scale census data with a remote sensing-derived land cover map. Geocarto Int. 18 (2), 3–13. doi:10.1080/10106040308542268
Rogan, J., and Chen, D. (2004). Remote sensing technology for mapping and monitoring land-cover and land-use change. Prog. Plan. 61 (4), 301–325. doi:10.1016/S0305-9006(03)00066-7
Sass, R. L., Fisher, F. M., Ding, A., and Huang, Y. (1999). Exchange of methane from rice fields: National, regional, and global budgets. J. Geophys. Res. Atmos. 104 (D21), 26943–26951. doi:10.1029/1999JD900081
Saud, S., Wang, D., Fahad, S., Alharby, H. F., Bamagoos, A. A., Mjrashi, A., et al. (2022). Comprehensive impacts of climate change on rice production and adaptive strategies in China. Front. Microbiol. 13, 926059. doi:10.3389/fmicb.2022.926059
Shao, Y., Fan, X., Liu, H., Xiao, J., Ross, S., Brisco, B., et al. (2001). Rice monitoring and production estimation using multitemporal RADARSAT. Remote Sens. Environ. 76 (3), 310–325. doi:10.1016/S0034-4257(00)00212-1
Steele-Dunne, S. C., McNairn, H., Monsivais-Huertero, A., Judge, J., Liu, P. W., and Papathanassiou, K. (2017). Radar remote sensing of agricultural canopies: A review. IEEE J. Sel. Top. Appl. Earth Observ. Remote Sens. 10 (5), 2249–2273. doi:10.1109/JSTARS.2016.2639043
Sun, H., Huang, J. f., Huete, A. R., Peng, D. l., and Zhang, F. (2009). Mapping paddy rice with multi-date moderate-resolution imaging spectroradiometer (MODIS) data in China. J. Zhejiang University-Sci. A 10 (10), 1509–1522. doi:10.1631/jzus.A0820536
Sun, C., Zhang, H., Xu, L., Ge, J., Jiang, J., Zuo, L., et al. (2023). Twenty-meter annual paddy rice area map for mainland Southeast Asia using Sentinel-1 synthetic-aperture-radar data. Earth Syst. Sci. Data 15 (4), 1501–1520. doi:10.5194/essd-15-1501-2023
Tian, H., Wu, M., Wang, L., and Niu, Z. (2018). Mapping early, middle and late rice extent using sentinel-1A and landsat-8 data in the poyang lake plain, China. Sensors 18 (2), 185. doi:10.3390/s18010185
Wei, J., Cui, Y., Luo, W., and Luo, Y. (2022). Mapping paddy rice distribution and cropping intensity in China from 2014 to 2019 with Landsat images, effective flood signals, and Google Earth engine. Remote Sens. 14 (3), 759. doi:10.3390/rs14030759
Wu, F., Wang, C., Zhang, H., Zhang, B., and Tang, Y. (2011). Rice crop monitoring in south China with RADARSAT-2 quad-polarization SAR data. IEEE Geosci. Remote Sens. Lett. 8 (2), 196–200. doi:10.1109/LGRS.2010.2055830
Xiao, X., Boles, S., Frolking, S., Salas, W., Li, C., Moore, B., et al. (2002). Observation of flooding and rice transplanting of paddy rice fields at the site to landscape scales in China using VEGETATION sensor data. Int. J. Remote Sens. 23 (15), 3009–3022. doi:10.1080/01431160110107734
Xiao, X., Boles, S., Liu, J., Zhuang, D., Li, C., Frolking, S., et al. (2005). Mapping paddy rice agriculture in southern China using multi-temporal MODIS images. Remote Sens. Environ. 95 (4), 480–492. doi:10.1016/j.rse.2004.12.009
Xiao, X., Boles, S., Frolking, S., Babu, J. Y., Li, C., Salas, W., et al. (2006). Mapping paddy rice agriculture in South and Southeast Asia using multi-temporal MODIS images. Remote Sens. Environ. 100 (1), 95–113. doi:10.1016/j.rse.2005.10.004
Xiao, W., Xu, S., and He, T. (2021). Mapping paddy rice with sentinel-1/2 and phenology-object-based algorithm—a implementation in hangjiahu Plain in China using GEE platform. Remote Sens. 13 (5), 990. doi:10.3390/rs13050990
Xiao, X. (2003). Uncertainties in estimates of cropland area in China: A comparison between an AVHRR-derived dataset and a Landsat TM-derived dataset. Global Planetary Change. [preprint]. doi:10.1016/S0921-8181(02)00202-3
Xu, S., Zhu, X., Chen, J., Zhu, X., Duan, M., Qiu, B., et al. (2023). A robust index to extract paddy fields in cloudy regions from SAR time series. Remote Sens. Environ. 285, 113374. doi:10.1016/j.rse.2022.113374
Yang, J., Hu, Q., Wei, H., Cai, Z., Zhang, X., Song, Q., et al. (2022). Consistency analysis of classification results for single and double cropping rice in southern China based on Sentinel-1/2 imagery. Sci. Agric. Sin. 55, 3093–3109. doi:10.3864/j.issn.0578-1752.2022.16.003
Zhan, P., Zhu, W., and Li, N. (2021). An automated rice mapping method based on flooding signals in synthetic aperture radar time series. Remote Sens. Environ. 252, 112112. doi:10.1016/j.rse.2020.112112
Zhang, Y., Wang, C., Wu, J., Qi, J., and Salas, W. A. (2009). Mapping paddy rice with multitemporal ALOS/PALSAR imagery in southeast China. Int. J. Remote Sens. 30 (23), 6301–6315. doi:10.1080/01431160902842391
Zhang, W., Liu, H., Wu, W., Zhan, L., and Wei, J. (2020). Mapping rice paddy based on machine learning with sentinel-2 multi-temporal data: Model comparison and transferability. Remote Sens. 12 (10), 1620. doi:10.3390/rs12101620
Zhang, M., Lin, H., Wang, G., Sun, H., and Fu, J. (2018). Mapping paddy rice using a convolutional neural network (CNN) with Landsat 8 datasets in the dongting lake area, China. Remote Sens. 10 (11), 1840. doi:10.3390/rs10111840
Zhang, X., Wu, B., Ponce-Campos, G., Zhang, M., Chang, S., and Tian, F. (2018). Mapping up-to-Date paddy rice extent at 10 M resolution in China through the integration of optical and synthetic aperture radar images. Remote Sens. 10 (8), 1200. doi:10.3390/rs10081200
Zhao, R., Li, Y., and Ma, M. (2021). Mapping paddy rice with satellite remote sensing: A review. Sustainability 13 (2), 503. doi:10.3390/su13020503
Zheng, Y., Li, Z., Pan, B., Lin, S., Dong, J., Li, X., et al. (2022). Development of a phenology-based method for identifying sugarcane plantation areas in China using high-resolution satellite datasets. Remote Sens. 14 (5), 1274. doi:10.3390/rs14051274
Zhong, L., Hu, L., and Zhou, H. (2019). Deep learning based multi-temporal crop classification. Remote Sens. Environ. 221, 430–443. doi:10.1016/j.rse.2018.11.032
Keywords: double season rice mapping, SAR, sentinel-1, rice index, China
Citation: Zhang X, Shen R, Zhu X, Pan B, Fu Y, Zheng Y, Chen X, Peng Q and Yuan W (2023) Sample-free automated mapping of double-season rice in China using Sentinel-1 SAR imagery. Front. Environ. Sci. 11:1207882. doi: 10.3389/fenvs.2023.1207882
Received: 18 April 2023; Accepted: 29 June 2023;
Published: 06 July 2023.
Edited by:
Sawaid Abbas, University of the Punjab, PakistanCopyright © 2023 Zhang, Shen, Zhu, Pan, Fu, Zheng, Chen, Peng and Yuan. This is an open-access article distributed under the terms of the Creative Commons Attribution License (CC BY). The use, distribution or reproduction in other forums is permitted, provided the original author(s) and the copyright owner(s) are credited and that the original publication in this journal is cited, in accordance with accepted academic practice. No use, distribution or reproduction is permitted which does not comply with these terms.
*Correspondence: Wenping Yuan, eXVhbndwM0BtYWlsLnN5c3UuZWR1LmNu
Disclaimer: All claims expressed in this article are solely those of the authors and do not necessarily represent those of their affiliated organizations, or those of the publisher, the editors and the reviewers. Any product that may be evaluated in this article or claim that may be made by its manufacturer is not guaranteed or endorsed by the publisher.
Research integrity at Frontiers
Learn more about the work of our research integrity team to safeguard the quality of each article we publish.