 Edward Le
 Joseph Janssen
 John Hammond2,3
 Ali A. Ameli
94% of researchers rate our articles as excellent or good
Learn more about the work of our research integrity team to safeguard the quality of each article we publish.
Find out more
ORIGINAL RESEARCH article
Front. Environ. Sci., 14 July 2023
Sec. Freshwater Science
Volume 11 - 2023 | https://doi.org/10.3389/fenvs.2023.1207508
This article is part of the Research TopicHydrology, Ecology, and Nutrient Biogeochemistry at the Terrestrial-Aquatic InterfaceView all 8 articles
Snow persistence (SP) is a widely available remotely-sensed measure of snowpack accumulation and ablation, reflecting the duration of snow presence on the ground in a given year. Available local-scale studies showed that SP is associated with the average magnitude of streamflow. However, despite the intuitive relationship between SP and catchment storage/release functioning, the spatial and temporal links between the persistence of snow on the ground and the shape and functionality of streamflow hydrographs were not studied empirically and were not generalized to diverse climatic settings. This study empirically explores the spatial and temporal links that SP has with measures of hydrograph shape and variability during low-flow and high-flow conditions across continent-wide gradients of aridity and seasonality. In arid in-phase and wet out-of-phase climates, higher SP is spatially associated with a damper (i.e., less flashy) streamflow hydrograph during low-flow and high-flow conditions. This is shown by a larger ratio of baseflow to average flow, a larger ratio of extreme low-flow to average flow, lower low-flow variability, and lower high-flow variability. While SP is spatially associated with a damped hydrograph in both arid/in-phase and wet/out-of-phase climates, this effect is stronger in the former region. For example, the size of the nonlinear impact of SP on reducing low-flow and high-flow variabilities is larger in arid in-phase climates (−7.64, −3.44, respectively) than in wet out-of-phase climates (−4.34, −2.02, respectively). Temporal analyses for “typical snow-rich” catchments show that years with relatively higher SP may lead to relatively flashier streamflow hydrographs, with lower baseflow indices, lower ratios of extreme low-flow to average flow, higher ratios of extreme high-flow to average flow and higher high-flow variability. Such results 1) demonstrate the utility of SP as a globally available descriptor of streamflow hydrograph shape and variability in a wide diversity of climatic conditions, 2) highlight that climate-driven snow loss may lead to substantial changes to hydrograph form and functionality, and 3) indicate that space-time symmetry may not be a valid assumption in hydrology.
Streamflow is a critical part of water systems around the world (McKerchar, 2003; Milly et al., 2005; Wiche and Holmes, 2016). As a result of current and anticipated climate change, alterations to the general behavior of streamflow present key environmental, health, and economic challenges (IPCC, 2018; 2021; 2022). While some evidence has shown connections between anthropogenic climate change and water system transformations (IPCC, 2007; Tan and Gan, 2015; IPCC, 2018; USGCRP, 2018; Bush and Lemmen, 2019; Wester et al., 2019; IPCC, 2021; 2022; Zhang et al., 2023), linking streamflow characteristics with the abundance of observed climatic data has continued to be an interesting challenge (Addor et al., 2018; Addor et al., 2020; Adams et al., 2022). Despite snow being a well-known and critical part of the water cycle (Linsley et al., 1975; DeWalle and Rango, 2008; Shaw et al., 2011), it has been difficult to link snow and streamflow characteristics in a generalizable manner, mainly due to the complex physics of snow accumulation and ablation and their interactions with other catchment attributes (Addor et al., 2018). This paper aims to address such gaps by exploring potential links between a new measure of snow accumulation and ablation (snow persistence) and measures of streamflow hydrograph shape and variability. In doing so, we analyze such potential links across a wide diversity of climatic conditions, within the North American continent, and build a generalizable understanding of how snow impacts hydrograph shape at high flow and low flow conditions, over space and time. This understanding provides insights on flow variability and vulnerability to climatic change and can inform policymaking and conservation efforts that address the water-related needs of people and the environment.
Streamflow behavior can take diverse forms which can be summarized with streamflow signatures. Indeed, streamflow signatures compress streamflow time series to a form suitable for hydrologic process elucidation and regionalization, environmental decision-making, and land-use or climate change impact assessment (Smakhtin, 2001; Wagener et al., 2007; Sawicz et al., 2011; Coopersmith et al., 2014; Sawicz et al., 2014). Shape-based streamflow signatures—a type of signature that measures the flashiness and variability of streamflow hydrographs—can yield important insights into stream low-flow and high-flow duration, variability and vulnerability (Addor et al., 2018; McMillan, 2020; Janssen and Ameli, 2021; McMillan, 2021).
Snowpack duration and snowmelt timing influence the volume of stored water, timing of water release, and the duration of such flows (Barnett et al., 2005; Beniston and Stoffel, 2014). As a newly developed measure of snow, snow persistence (SP), combines information about snowpack accumulation and ablation as a simple integrated index. It is defined as the fraction of time that snow is present on the ground within a defined period of time, (Molotch and Meromy, 2014; Moore et al., 2015; Hammond et al., 2018a). Based on intuition and previous works, SP should influence various aspects of catchment hydrologic functioning, including water storage and release (Kampf and Lefsky, 2016; Hammond et al., 2018b; Eurich et al., 2021). Thus it can play a key role in controlling streamflow hydrograph shape and variability. Further enhancing its potential utility, SP can easily be derived globally (Hammond et al., 2018a). This is a key novelty as alternate snow indices, e.g., the fraction of precipitation that falls as snow (snow fraction), require meteorological data and local-scale calibration of temperature and humidity thresholds. Instead, SP can be reliably calculated from satellite-based remote sensing instruments, such as the Moderate-Resolution Imaging Spectroradiometer (MODIS) run by NASA (Hall et al., 2002). As continued climate change reduces seasonal snowpacks and alters snowmelt timing, snow persistence can easily be employed for tracking changes in catchment water storage and release functions and their hydrologic consequences (Nolin et al., 2021).
Existing work linking SP and hydrology has generally focused on localized analyses of SP in a limited range of North American climatic settings. For example, Kampf and Lefsky (2016) explored relationships between SP and peak flow magnitude over time within Colorado’s Front Range. Hammond et al. (2018b) identified relationships between SP and annual water yield in the western U.S. More recently, Eurich et al. (2021) used SP to predict monthly and annual streamflow values in Colorado. This highlights a significant research gap wherein data exists on a global scale but has only been used and interpreted at local or regional scales. Indeed, the general applicability of SP to diverse climates has not been explored. Furthermore, previous studies primarily focused on the linkages between SP and magnitude-based streamflow signatures such as peak flow magnitude (Kampf and Lefsky, 2016) or mean annual or monthly water yield (Hammond et al., 2018b; Eurich et al., 2021). Despite the important implications of average or peak flow magnitudes for water management and security, these streamflow signatures do not thoroughly explain the internal hydrologic functioning (e.g., storage and release) of catchments, nor streamflow hydrograph shape and low-flow or high-flow duration, variability and vulnerability. Insights on both hydrologic functioning in snow-dominated regions and snow’s behavioral linkages with streamflow hydrograph shape and variability are critically required for understanding and extrapolating hydrologic responses to climate-driven snow alteration over space and time (Hrachowitz et al., 2013; Evenson et al., 2018; Siirila-Woodburn et al., 2021).
In this study, we intend to build an understanding of the spatiotemporal linkages between SP and a) streamflow hydrograph shape, and b) high-flow and low-flow variability and duration, across several North American regions. To do this, we first quantify and compare SP’s spatial impacts on high-flow and low-flow shape-based signatures, across distinct climatic regions with varying seasonalities and aridities. Then, to understand such linkages over time, we explore inter-annual associations between SP and high-flow and low-flow shape-based signatures. Our overarching hypothesis is that SP’s spatiotemporal linkages with shape-based streamflow signatures will depend on the aridity and seasonality of the region. Specifically, we aim to explore the following questions.
1) Is snow persistence associated with low-flow and high-flow shape-based signatures over space and time?
2) Does aridity and seasonality alter the spatiotemporal relationship between SP and shape-based signatures?
There are two major categories of data used in this study: climatic data used to calculate catchment-scale annual and long-term average climatic indices (Section 2.1) and streamflow data (Section 2.2, 2.3). The streamflow data is then used to calculate catchment-scale annual and long-term streamflow signatures (Section 2.4). Finally, Section 2.5 describes the statistical methods used in this study. The study period covers the years 2001–2019 and the study sites represent catchments from across North America. Summary statistics and brief descriptions of the relevant indices and signatures are available in Supplementary Table S1.
We used globally available climate datasets to increase the generalizability of the research. Catchment-scale annual and long-term average Snow Persistence (SP), Aridity Index (AI), and Seasonality Index (SI) were calculated for each catchment. These indices’ spatial maps and summary statistics are provided in Figure 1 and Supplementary Table S1.
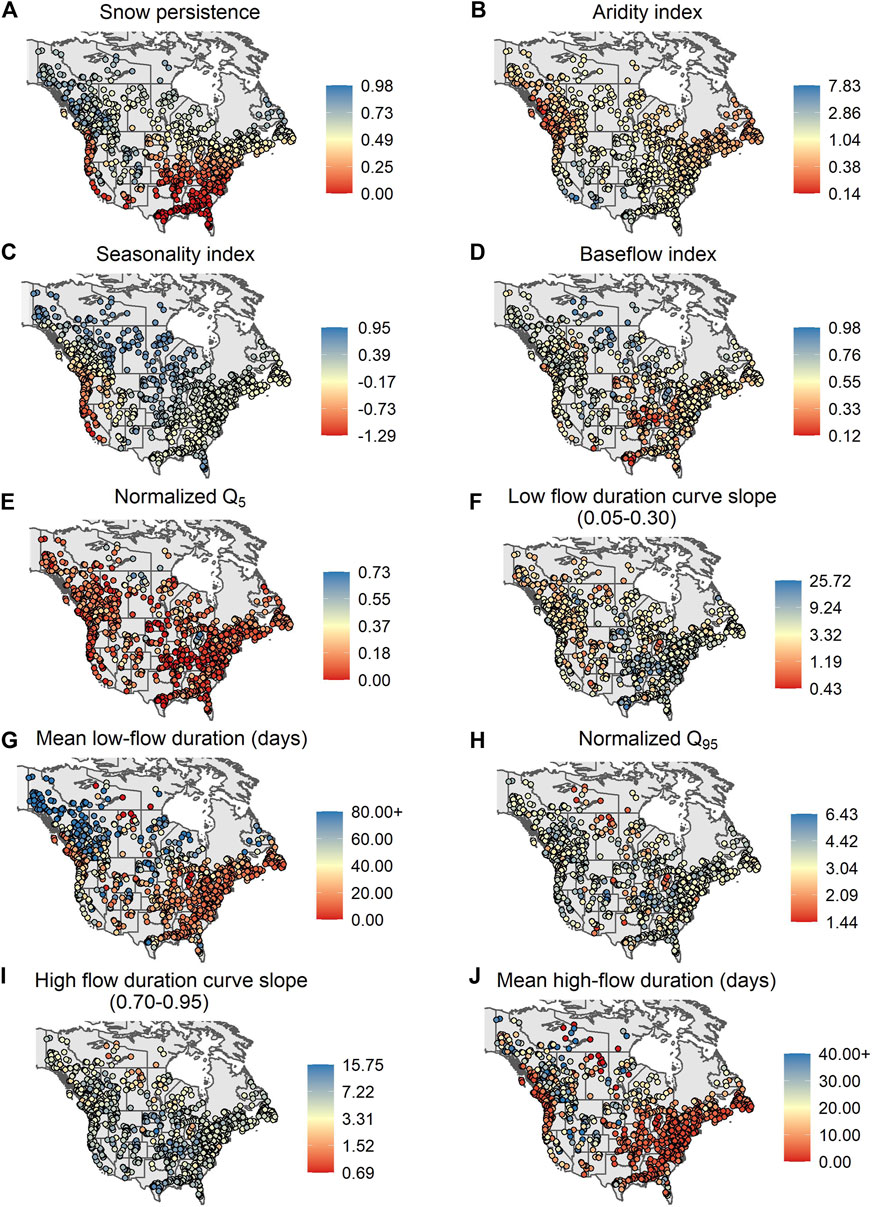
FIGURE 1. Maps of long-term values of climatic indices (A–C) and streamflow signatures (D–J) of the catchments used in this study. For all plots except snow persistence, the seasonality index, the baseflow index, low and high-flow duration, and normalized Q5, a natural log color bar transformation was used to emphasize the regional differences between catchments.
To calculate SP at each catchment during the study period, the 500 m resolution—MODIS/Terra 8-Day L3 Version 6— snow cover product (MOD10A2) was used (Hall and Riggs, 2016; Hammond, 2020b; a). This data source features improved snow cover detection accuracy and represents an iteration of NASA MODIS data that attempts to correct previously discovered issues (Riggs et al., 2016). At each 500 m resolution grid, the annual SP value was determined as the fraction of days with snow on the ground from January 1-July 3, generally covering peak snow accumulation and complete snow ablation for many parts of North America (Moore et al., 2015). Gridded annual SP data were then clipped using a catchment boundary polygon (Section 2.2) to calculate catchment-scale annual SP. The long-term average catchment-scale SP value for each catchment was then calculated by temporally averaging over the study period.
The aridity index (AI) is a measure of the relative “dryness” of a given region. It is defined by the ratio between potential evapotranspiration and total precipitation (Budyko, 1974). It can be interpreted by focusing on the critical value of 1. As defined in Budyko (1974), when AI is above 1, a region is considered “arid”. The aridity index has been shown in previous continental-scale work to be a key factor in classifying hydrologic behavior (Kuentz et al., 2017). The seasonality index (SI) is a dimensionless measure of the synchronicity between daily precipitation and temperature in a single variable, mathematically defined in Eq. 14 of Woods (2009). At the extremes, −1 (out-of-phase) signifies winter-dominant precipitation and +1 (in-phase) signifies summer-dominant precipitation (Berghuijs et al., 2014). Catchment-scale annual (and long-term average) aridity and seasonality indices were calculated using catchment boundary polygons (Section 2.2) with monthly and daily temperature and total precipitation data from the ERA5-Land database (Muñoz-Sabater et al., 2021) and monthly potential evapotranspiration data released as part of the TerraClimate database (Abatzoglou et al., 2018).
A well-distributed set of stream gauges across North America were selected for this study. We started with daily streamflow observations at 671 and 1,602 stream gauges across the United States and Canada, respectively. These daily streamflow observations were analyzed to generate annual and long-term values of streamflow signatures (see Section 2.4). The United States set of stream gauges and their corresponding catchment boundary polygons were obtained from the CAMELS dataset (Newman et al., 2015; Addor et al., 2017). Addor et al. (2017) developed and validated catchment boundary polygons for each gauge; with each catchment having two sets of area estimates based on two different area estimation methodologies. We queried the catchments listed in the CAMELS dataset to get updated data from the U.S. Geological Survey (2020). The Canadian gauges were derived from the HYDAT dataset released by Environment and Climate Change Canada (2021). We derived flow direction and flow accumulation and ultimately catchments’ area and boundary polygons for the Canadian gauges using the Watershed Tool in ArcGIS. The calculated areas of Canadian catchments were then compared against area information from topographic maps by the Water Survey of Canada (Environment and Climate Change Canada, 2021). Thus, like the United States catchments, there were two sets of area estimates available for the Canadian catchments. Note that differences in area estimation between two alternative approaches stem from different elevation data sources, as well as different algorithms to calculate the boundary polygons. Catchments used from both countries generally feature minimal human disruption (e.g., stream diversions and flow regulations).
From the original set of catchments, only catchments with the following criteria were selected and used in the statistical analyses.
a) Catchments with 15 or more years of acceptable streamflow records during the study period. “Acceptable” years have fewer than 10% of days with missing streamflow data.
b) Catchments with an area difference, between the two area calculation approaches, less than or equal to 30% (see Section 2.2 for more details about the two approaches).
c) Catchments with perennial flow records. Catchments with frequent zero flow days were excluded from the analysis.
Following this screening, a total of 1,187 out of 2,273 original catchments were selected, featuring a wide range of catchment sizes (from under 10 km2 to over 273,000 km2), elevations (from about 14 m to over 3,500 m), and precipitations (average annual precipitations of just below 0.3 m/year to about 3.17 m/year) from across North America (Janssen and Ameli, 2021). Most importantly, these catchments represent a variety of North American climatic regions across wide gradients of snow persistence, aridity, and seasonality (Figures 1A–C).
Shape-based streamflow signatures represent the shape and flashiness of streamflow hydrographs, providing insights into streamflow duration and variability at different streamflow levels (McMillan, 2020; Janssen and Ameli, 2021; McMillan, 2021). In this study, seven shape-based streamflow signatures were used to assess the ability of SP to inform streamflow shape and flashiness at low-flow and high-flow conditions. Baseflow index (BFI), normalized Q5, the slope of the flow duration curve at low-flow (Low-FDC), and low-flow event duration are used to represent low-flow conditions, while normalized Q95, the slope of the flow duration curve at high-flow (High-FDC), and high-flow event duration are used to represent high-flow conditions. Each signature reflects one aspect of low-flow or high-flow behavior, therefore, together these seven signatures reflect the form and functionality of hydrographs at high and low flows.
The baseflow index (BFI) describes the proportion of total flow that come from baseflow, where baseflow is defined as flow that is maintained between precipitation events (Addor et al., 2017). Note that an α of 0.925 was used to calculate the baseflow index using the Lyne and Hollick digital filter algorithm developed by Ladson et al. (2013), with the relevant methodological details contained in their paper. Having meaningful baseflow, especially during dry periods and meteorological droughts, supports ecosystems (Poff et al., 1997; Boulton, 2003) and human activities, especially in arid regions (Saedi et al., 2022).
Q5 represents the 5% quantile of flow (i.e., extreme low-flow) and Q95 represents the 95% quantile of flow (i.e., extreme high-flow). Here, these values were divided by Qmean to produce normalized Q5 and normalized Q95, respectively. Both signatures serve as dimensionless shape-based metrics that describe the relative values of extreme low-flow and extreme high-flow while being agnostic to the average flow magnitude of the catchment (Janssen and Ameli, 2021). Conceptually, they reflect the contributions from the deepest (or shallowest) flow paths to streamflow relative to the contributions from the remaining flow paths of a catchment. Thus, they measure the extreme behavior of catchments, directly translating to events such as droughts or floods in a given stream.
The flow duration curve (FDC) plots recorded streamflow values against their exceedance probability (Searcy, 1959). The slope of the FDC can then be taken within a given range of flow percentiles to describe the variability of streamflow within the specified range (Sawicz et al., 2011). We used two slopes to represent the flow variability during low-flow (Low-FDC) and high-flow (High-FDC). The former represents flow variability between the 5th and 30th flow percentiles and the latter represents flow variability between the 70th and 95th flow percentiles (see Supplementary Table S1 for further details). These flow percentiles reflect the behavior of low-flow and high-flow without capturing overlapping information from the middle portion of the flow duration curve (Sawicz et al., 2011). Large FDC slopes indicate more variable, unstable, and flashier streamflow within the given range of flow, whereas smaller slopes indicate damped and stable streamflow variability. Larger Low-FDC indicates a flashy low-flow hydrograph, implying that streamflow quickly becomes extremely low during dry periods. At the same time, a larger value of High-FDC reflects a flashy high-flow hydrograph, meaning that streamflow rises rapidly after water input events, leading to high-flow instability during wet periods.
High-flow and low-flow event durations express the average temporal length of high and low-flow events, respectively (Addor et al., 2017). We quantified the number of consecutive days with flow larger (smaller) than a flow threshold to calculate high-flow (low-flow) event duration in each year and along the entire time-series. Here, we used a threshold of 0.4x Qmean to detect low-flow events and a threshold of 4x Qmedian to detect high-flow events, where Qmean refers to average streamflow and Qmedian refers to median streamflow. Note that our high-flow detection algorithm is not limited to the detection of only extreme high-flow events. Similarly, our low-flow detection algorithm is not limited to the detection of only extreme low-flow events. Indeed, events with flow magnitudes much smaller than Q95 and much larger than Q5 can still be detected as high-flow events and low-flow events, respectively.
We calculated annual and long-term values of each signature for each catchment during the study period (2001–2019) using the code and methodology developed by Addor et al. (2017). Details of the mathematical/methodological basis of the code from Addor et al. (2017) are summarized in Table 3 of their study. The spatial maps of the long-term values of streamflow signatures used in our study are shown in Figure 1. Supplementary Table S1 reports some statistics on these signatures.
We conducted three major sets of statistical analyses in this paper. First, through an inter-catchment (spatial) analysis across the 1,187 study catchments, long-term average values of snow persistence (SP), aridity index (AI), seasonality index (SI) and long-term values of streamflow signatures were used to explore how the spatial linkages between SP and shape-based signatures at stream low and high-flow conditions differ among distinct climatic regions (Section 2.5.1). Secondly, through an inter-annual correlational analysis within each snow-rich study catchment and along the study period (2001–2019), annual values of SP and streamflow signatures were used to quantify the catchment-level temporal association between inter-annual variation of SP and inter-annual variation of each streamflow signature (Section 2.5.2). Thirdly, through a standardized inter-catchment and inter-annual correlational analysis across all snow-rich catchments and along the study period (2001–2019), we explored how in a “typical” snow-rich catchment, inter-annual variation of SP is associated with inter-annual variation of streamflow signatures, and how such associations differ between relatively arid/wet years or years with relatively in-phase/out of phase seasonalities (Section 2.5.3). As part of the Supplementary Material, we ranked the associations between SP and streamflow signatures compared to the associations between AI (and SI) and streamflow signatures. In doing so, correlational analyses with annual-level streamflow signatures and climatic indices (SP, AI, and SI) across all study catchments (∼20,000 datapoints for each streamflow signature/climatic index pair) were conducted (see Supplementary Figure S1). We believe that this combination of large sample sizes, climatic diversity, and a suite of statistical analyses can provide meaningful hydrological insights on the patterns between climatic indices and streamflow behavior (Sawicz et al., 2011; Addor et al., 2018; Janssen and Ameli, 2021; Anderson et al., 2022). All analyses were performed in R version 4.2.0 (R Core Team, 2022).
To understand the spatial linkages between SP and streamflow signatures, we calculated Spearman’s correlation coefficient ρ) between SP and each signature across the 1,187 study catchments (Spearman, 1904). Next, to gain an understanding of the association between SP and each signature across different climatic regions, we divided the catchments into four climatic regions according to their long-term average AI and SI values and perform Spearman correlational analysis within each climatic region.
- Arid In-Phase (AI ≥ third quartile of AI and SI ≥ third quartile of SI, 130 catchments)
- Arid Out-of-Phase (AI ≥ third quartile of AI and SI≤ first quartile of SI, 50 catchments)
- Wet In-Phase (AI ≤ first quartile of AI and SI ≥ third quartile of SI, 14 catchments)
- Wet Out-of-Phase (AI ≤ first quartile of AI and SI≤ first quartile of SI, 150 catchments)
Note that catchments across North America are generally wetter compared to the global norm. Indeed, the third quartile of AI across our study catchments is close to 1 which is the most common threshold for grouping arid catchments. Therefore, we designate any catchments with an aridity index above the third quartile of AI as arid. To ensure we are not capturing the overlapping information from somewhat wet and somewhat dry catchments, we selected the first quartile of AI (AI = 0.51) as the threshold below which catchments are defined as wet. The same quartiles were used to partition catchments by SI values, where −0.1 is the first quartile, and 0.29 is the third quartile of SI. Since a seasonality index of zero reflects a uniform seasonality, the selected thresholds allow catchments that exhibit strongly out-of-phase seasonality versus strongly in-phase seasonality to be partitioned. These classification criteria lead to only 14 catchments being classified as wet in-phase, which is consistent with our expectation that only a small part of North America experiences wet in-phase climates. Inferring processes from less than 20 samples have a high likelihood of leading to spurious results (Jackson and Somers, 1991; Bonett and Wright, 2000; Yue et al., 2002), therefore, we excluded the wet in-phase group from our analysis.
Finally, the Spearman correlation values for each climatic region were scaled according to the following formula to reduce the effect of within-group variability:
Here, in a given climatic group,
Pearson correlations between annual values of SP and streamflow signatures were used to quantify temporal associations at each catchment. Such analyses can reveal the direction (e.g., positive or negative) and strength of linear associations between SP and streamflow signatures (Galton, 1889; Pearson, 1896). The correlation coefficients for all catchments were then plotted to visualize the geographical patterns of the association between inter-annual variations of SP and streamflow signatures. To facilitate comparison and visual assessment, the geographical patterns are shown for two regions with distinct levels of snow richness: snow-rich and snow-poor catchments. Snow-rich catchments are those with a long-term average SP larger than 0.50 and snow-poor catchments have a long-term average SP smaller than 0.50. The chosen threshold of snow persistence to describe a catchment’s snow richness reflects previous research into the usage of SP in classifying regions (Moore et al., 2015). We generally found that the temporal correlations between SP and streamflow signatures were very poor in snow-poor catchments, thus they are not reported and discussed in this paper.
To complement the previous catchment-level analysis and to identify the temporal associations between SP and streamflow signatures in a “typical” snow-rich (or snow-poor) catchment, we performed an inter-catchment and inter-annual standardized Pearson correlational analysis. This analysis identifies how the temporal associations between SP and streamflow signatures in a typical snow-rich (or snow-poor) catchment vary between relatively wet/dry climatic years and between years with relatively in/out-of-phase seasonalities. In doing so, we used the annual values of indices and signatures across all catchments (∼20,000 datapoints for each signature/climatic index pair). Additionally, the annual climatic indices and streamflow signatures were standardized at a catchment level to a mean of 0 and a standard deviation of 1 to allow for inter-annual cross-catchment interpretation. Standardization removes catchment-level magnitude effects by placing all data points from different catchments on the same scale, leaving only the relative temporal variation, allowing a finer-tooth analysis of the temporal behavior of a typical snow-rich (or snow-poor) catchment. Again, we found that correlations in snow-poor catchments were generally weaker and not always statistically significant. Thus, results for snow poor catchments are not reported and discussed in this paper.
This section reports the inter-catchment and/or inter-annual linkages amongst SP and shape-based streamflow signatures at low-flow and high-flow conditions, using the three statistical analyses described in Sections 2.5.1–2.5.3. In addition, the results comparing the extent that SP is associated with streamflow signatures relative to the extent at which aridity index (AI) and seasonality index (SI) are associated with streamflow signatures are reported in Supplementary Figure S1.
Spatially, SP has a generally positive and statistically significant (p < 0.05) Spearman correlation with BFI across all study catchments (ρ = 0.45), across arid in-phase catchments (ρ = 0.52), and across wet out-of-phase catchments (ρ = 0.58; Figure 2A). When scaled, the impact of SP on BFI is larger across arid in-phase catchments (ρscaled = 0.44), compared to wet out-of-phase catchments (ρscaled = 0.25; Figure 2B). Indeed, in both climatic regions, catchments with higher SP sustain larger BFI values compared to the catchments with lower SP, while such SP’s effect is stronger in arid in-phase catchments.
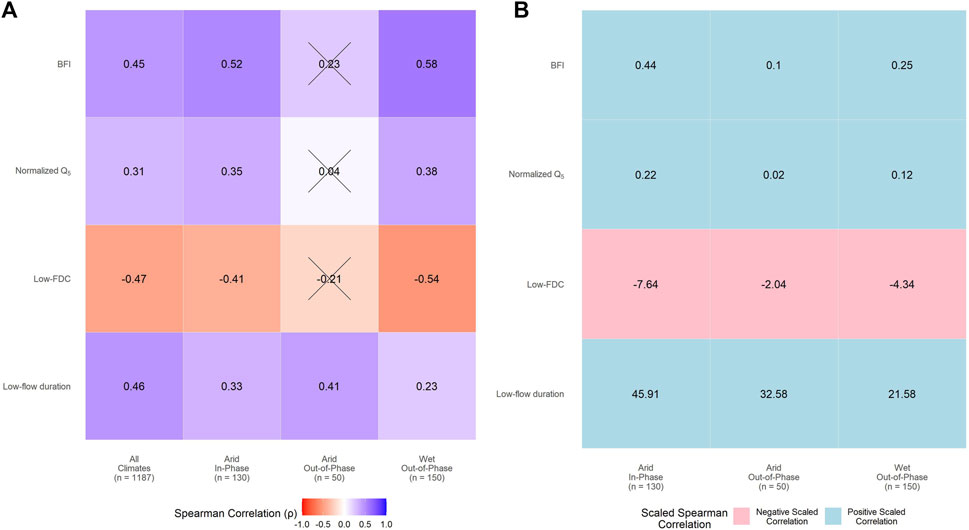
FIGURE 2. Correlations between Snow Persistence (SP) and low-flow signatures across all study catchments (all climates), and across catchments placed in arid in-phase climate, arid out-of-phase climate, and wet out-of-phase climates. Red indicates negative correlations (or negatively scaled correlations), and blue indicates positive correlations (or positively scaled correlations). Panel (A) focuses on Spearman correlations with “X” indicating statistically insignificant correlations (p ≥ 0.05) and the color intensity specifying the strength of such correlations. Panel (B) focuses on scaled Spearman correlations according to Eq. 6. Scaled Spearman correlation allows for inter-group comparability of the overall “impact” of SP on low-flow signatures (See Section 2.5.1 for more details).
Further exploration at the catchment-level through the inter-annual correlational analysis, reveals that a positive association between SP and BFI does not exist temporally in many catchments. For example, in snow-rich high-elevation catchments across the Rocky Mountains and southeastern Canada, temporal associations between SP and BFI are negligible to strongly negative (Figure 4A). The standardized correlational analysis further emphasizes that in a typical snow-rich catchment, there is a negative temporal correlation between SP and BFI, with consistent negative temporal correlation during relatively dry and wet years as well as during years with relatively in-phase and out-of-phase seasonalities (Figure 5A). In a typical snow-rich catchment, the correlation coefficients between standardized SP and standardized BFI are statistically significant (p < 0.01) and slightly differ between relatively dry and relatively wet years (R = −0.31 versus −0.24) as well as between years with relatively in-phase and out-of-phase seasonalities (R = −0.29 versus −0.26).
This evidence suggests that catchments with longer SP usually have larger baseflow indices, regardless of the aridity and seasonality of the region. However, this positive spatial association cannot be extrapolated over time in most catchments, especially in high-elevation snow-rich catchments, as they usually experience a smaller BFI during years with relatively higher SP, regardless of the relative dryness and seasonality of those years.
Generally, across all study catchments, SP has a positive and statistically significant (p < 0.05) Spearman correlation with normalized Q5 (ρ = 0.31; Figure 2A). In arid in-phase climates (ρ = 0.35) and wet out-of-phase climates (ρ = 0.38; Figure 2A), the correlation is also statistically significant. The overall impact of SP on normalized Q5 is slightly larger across arid in-phase catchments (ρscaled = 0.22) than wet out-of-phase catchments (ρscaled = 0.12; Figure 2B). Arid out-of-phase catchments also have a positive spatial correlation between SP and Q5, however, it is small and insignificant.
The catchment-level inter-annual correlational analysis reveals that the positive spatial association between SP and normalized Q5 does not exist temporally in most snow-rich catchments (Figure 4B). Although there are a handful of catchments in the Pacific Northwest with positive temporal correlations, and a handful of catchments in central Canada with near zero temporal correlation, almost all other catchments have a strongly negative temporal correlation. The standardized correlational analysis further clarifies that in a typical snow-rich catchment, in a year with longer SP, a lower normalized Q5 is more likely, especially when considering wetter years (Figure 5B). In a typical snow-rich catchment, the correlation coefficient between standardized SP and standardized normalized Q5 is −0.29 for relatively wet years compared to −0.18 for relatively dry years. The difference in correlation is less pronounced when partitioning by seasonality index (i.e., R = −0.28 for relatively in-phase years versus R = −0.25 for relatively out-of-phase years).
The combined evidence depicts that higher SP is spatially associated with a larger extreme low-flow to average flow ratio. However, this positive spatial association cannot be extrapolated over time in almost all catchments. For example, in high-elevation snow-rich catchments across the Rocky Mountains, years with relatively higher SP exhibit a smaller normalized Q5. Indeed, in snow-rich catchments during years with relatively higher SP, average flows may increase more than extreme low-flows.
Spatially, there are statistically significant negative (p < 0.05) Spearman correlations between SP and Low-FDC across all study catchments (ρ = −0.47), across arid in-phase catchments (ρ = −0.41), and across wet out-of-phase catchments (ρ = −0.54; Figure 2A). When scaled, the overall impact of SP on Low-FDC in arid in-phase catchments (ρscaled = −7.64) is larger than in wet out-of-phase catchments (ρscaled = −4.34; Figure 2B). This suggests that there is a general association between SP and decreased low-flow variability in North American catchments, with a particularly notable relationship between SP and decreased low-flow variability in arid in-phase catchments. While the studied relationship has the same sign for arid out-of-phase catchments, the relationship is not significant at the p < 0.05 level (ρ = −0.21).
The catchment-level inter-annual correlational analysis in snow-rich regions reveals that the temporal correlation between inter-annual variability of SP and Low-FDC does not seem to have a clear geographical pattern, with many areas having a mix of small positive and small negative temporal correlations (Figure 4C). Our standardized correlational analysis suggests that in a typical snow-rich catchment, there is a very weakly negative Pearson correlation between SP and Low-FDC, with R = −0.13 for relatively dry years and R = −0.09 for relatively wet years (and similarly for in-phase versus out-of-phase years; Figure 5C), though the correlations are still statistically significant.
These results suggest that SP is associated with mitigating low-flow variability over space, particularly in arid in-phase and wet out-of-phase regions. Our temporal findings generally agree with the spatial analysis, however, the temporal correlations are weak and appear to be insignificant and random across most individual catchments.
Spatially, there is a statistically significant positive (p < 0.05) Spearman correlation between SP and low-flow event duration across all study catchments (ρ = 0.46), across arid in-phase catchments (ρ = 0.33) and across arid out-of-phase catchments (ρ = 0.41), with weaker spatial correlation across wet out-of-phase catchments (ρ = 0.23; Figure 2A). When scaled, the overall impact of SP on low-flow event duration is the largest across arid in-phase catchments (ρscaled = 45.91), followed by arid out-of-phase catchments (ρscaled = 32.58), and wet out-of-phase catchments (ρscaled = 21.58; Figure 2B). This finding suggests that longer SP is linked with an increase in the average length of low-flow duration events across a wide diversity of climates in North America,.
The catchment-level inter-annual correlational analysis also reveals that the temporal Pearson correlation between inter-annual SP and low-flow event duration is strongly positive in most snow-rich catchments in North America, with some exceptions in the Pacific Northwest (Figure 4D). The standardized correlational analysis shows a statistically significant (p < 0.01) weakly positive Pearson correlation between standardized SP and standardized low-flow event duration (R = 0.16–0.23) that is slightly stronger in wetter/in-phase years (Figure 5D).
The combination of several different lines of evidence suggests that SP is associated with the lengthening of low-flow event durations, particularly in arid climates. Note that in the extraction of low-flow events, our algorithm is not limited to the extraction of only extreme low-flow events since events with flow magnitudes of consecutive days much larger than Q5 (but still smaller than the threshold of 0.4x Qmean) can be detected as low-flow events (see Section 2.4 for more details). In addition to a strong positive spatial association, positive temporal associative effects also exist in snow-rich catchments, albeit with some exceptions, implying a longer average length of low-flow durations in snow-rich years.
Spatially, there is a statistically significant positive (p < 0.05) Spearman correlation between SP and normalized Q95 across catchments in arid out-of-phase climates (ρ = 0.51) and a negative spatial correlation in wet out-of-phase climates (ρ = −0.3; Figure 3A). When scaled, the positive overall impact of SP on normalized Q95 in arid out-of-phase climates is 1.56 and the negative impact of SP on normalized Q95 in wet out-of-phase climates has a ρscaled of −0.69 (Figure 3B). Despite the negative spatial correlation between SP and normalized Q95 in arid in-phase climates, the correlation is small and not statistically significant.
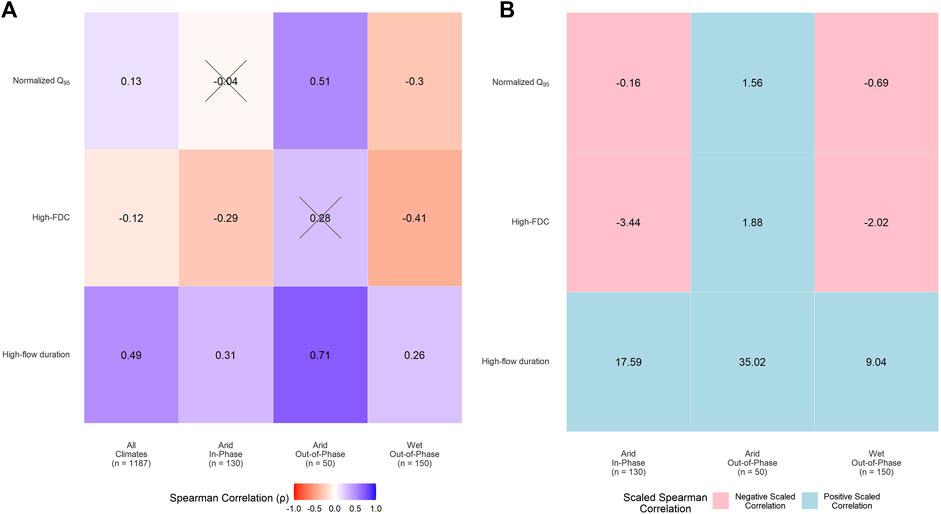
FIGURE 3. Correlations between Snow Persistence (SP) and high-flow signatures across all study catchments (all climates), and across catchments placed in arid in-phase climate, arid out-of-phase climate, and wet out-of-phase climates. Red indicates negative correlations (or negatively scaled correlations), and blue indicates positive correlations (or positively scaled correlations). Panel (A) focuses on Spearman correlations with “X” indicating statistically insignificant correlations (p ≥ 0.05) and the color intensity specifying the magnitude of such correlations. Panel (B) focuses on scaled Spearman correlations according to Eq. 6. Scaled Spearman correlation allows for inter-group comparability of the overall “impact” of SP on high-flow signatures (See Section 2.5.1 for more details).
The catchment-level inter-annual correlational analysis reveals that the temporal correlation between SP and normalized Q95 is strongly positive in most snow-rich catchments, with the strongest positive temporal association between SP and normalized Q95 across the Rockies and through parts of eastern Canada (Figure 4E). The standardized correlational analysis suggests that in a typical snow-rich catchment, there is a statistically significant (p < 0.01) positive association between SP and normalized Q95 with minor variations across drier/wetter years (R = 0.35 for drier years, R = 0.33 in wetter years) and minor variations across in-phase/out-of-phase years (R = 0.35 for more in-phase years, R = 0.30 for more out-of-phase years; Figure 5E).
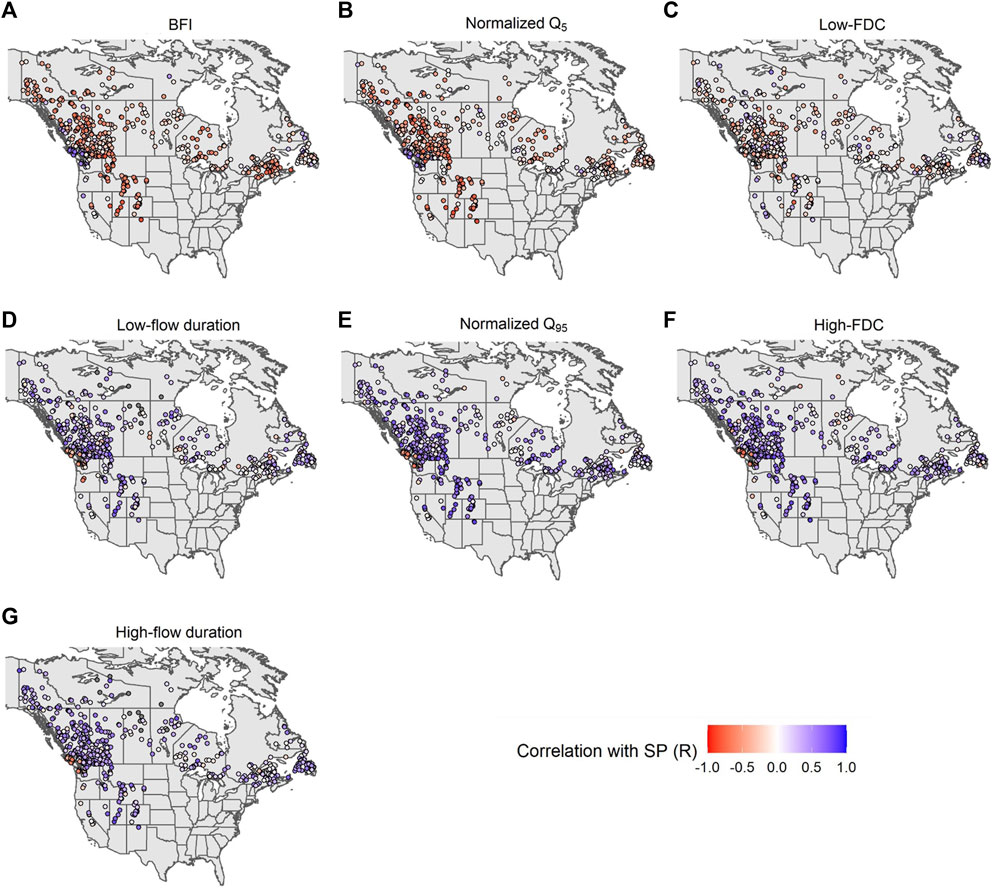
FIGURE 4. Spatial map of the temporal (inter-annual) associations between snow persistence (SP) and low-flow or high-flow shape-based streamflow signatures at snow-rich catchments (A–G). The associations were calculated through catchment-level inter-year correlation analysis (see Section 2.5.2). The color map refers to the inter-annual Pearson correlation coefficient (R) at each catchment. Blue dots imply positive correlations; red dots imply negative correlations. The intensity of the colors implies the strength of the correlations.
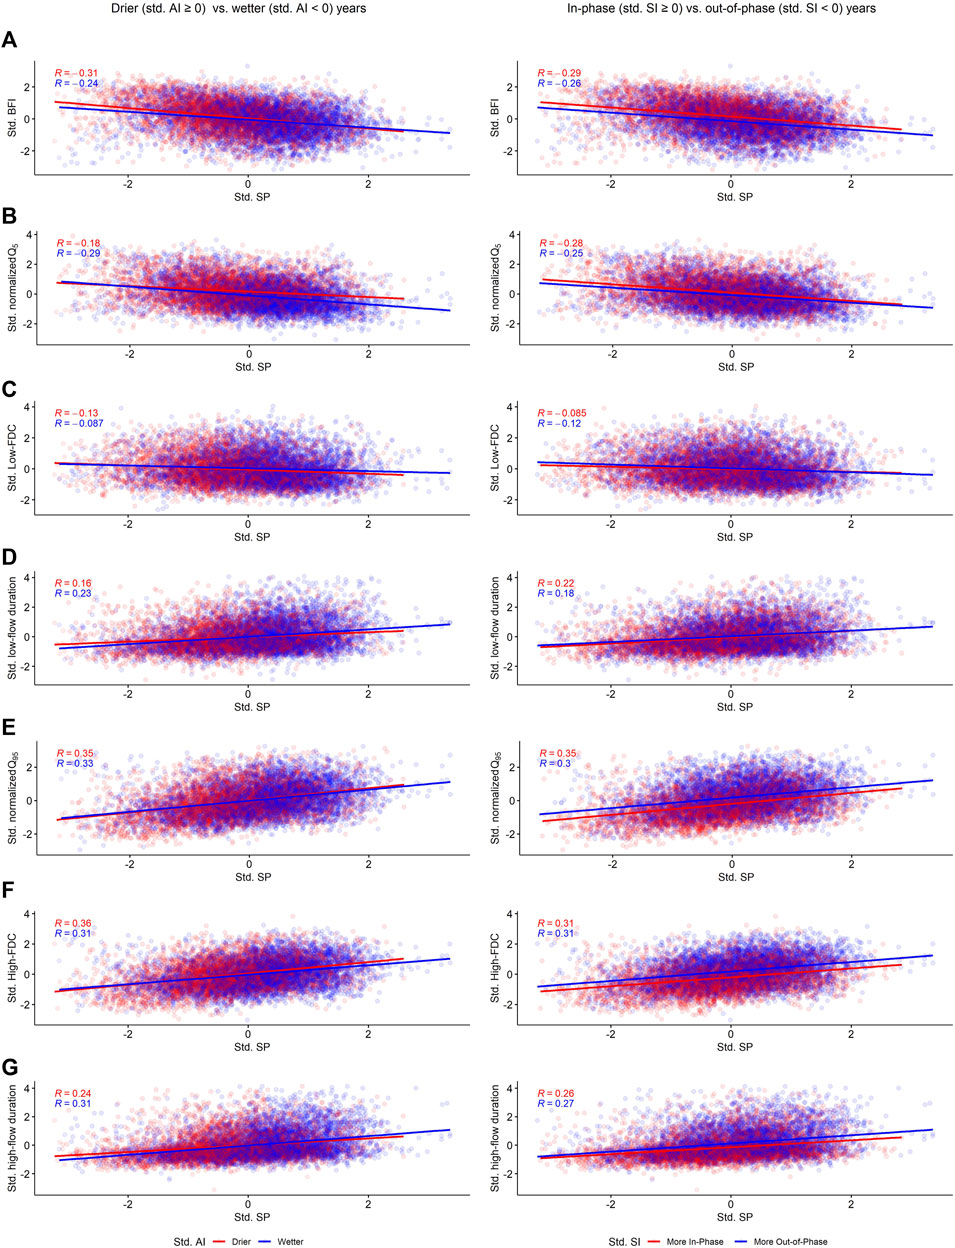
FIGURE 5. The association between standardized snow persistence (Std. SP) and standardized streamflow signatures for different levels of standardized AI (left column) and standardized SI (right column) in a typical snow-rich catchment (A–G). The association was calculated through inter-catchment and inter-annual standardized correlational analysis, using the standardized annual-level values of indices and signatures across all studied catchments (See Section 2.5.3). The annual climatic indices and streamflow signatures were standardized at a catchment level to a mean of 0 and a standard deviation of 1. “Std.” refers to the standardized transformation of each index/signature. Left column: blue dots and lines refer to relatively wetter years (Std. AI < 0) and red dots and lines refer to relatively dry years (Std. ≥ AI 0) of a given catchment. Right column: blue dots and lines refer to years with relatively out-of-phase seasonality (Std. SI < 0) and red dots and lines refer to years with relatively in-phase seasonality (Std. SI ≥ 0) of a given catchment. R refers to the Pearson correlation coefficient between standardized SP and standardized streamflow signatures for relatively wetter years (blue), relatively out-of-phase seasonality years (blue), relatively drier years (red), or relatively in-phase seasonality years (red). Catchment-level standardized snow persistence greater than zero (Std. SP > 0) refers to relatively snow-rich years and less than zero (Std. SP < 0) refers to relatively snow-poor years of a given catchment. All correlations are statistically significant (p < 0.01).
The results generally imply that in snow-rich catchments, years with relatively higher SP may exhibit a larger normalized Q95 compared to years with relatively lower SP. Indeed, for snow-rich catchments, during years with relatively higher SP, extreme high-flow could increase to a larger extent than average flow, due to a larger contribution of surface flow (or shallow subsurface flow) to streamflow relative to the contribution of deep groundwater flow. However, over space, the associations between SP and normalized Q95 could be positive or negative depending on the climatic aridity.
Spatially, there is a statistically significant negative (p < 0.05) Spearman correlation between SP and High-FDC across catchments located in arid in-phase climates (ρ = −0.29) and in wet out-of-phase climates (ρ = −0.41; Figure 3A). This suggests that SP has a role in reducing the variability of catchment high-flows in both arid in-phase and wet out-of-phase regions. When scaled, the overall impact of SP on High-FDC is slightly stronger in arid in-phase regions (ρscaled = −3.44) than in wet out-of-phase regions (ρscaled=−2.02; Figure 3B).
The catchment-level inter-annual correlational analysis reveals a strong positive temporal Pearson correlation between SP and High-FDC in most snow-rich catchments, with the strongest positive correlations appearing in the Rockies and Eastern Canada (Figure 4F). Similarly, the standardized correlational analysis suggests that in a typical snow-rich catchment, there is a statistically significant (p < 0.01) positive correlation between standardized SP and standardized High-FDC with little difference between relatively drier and wetter years (R = 0.36 for drier years, R = 0.31 in wetter years) and with no difference between relative seasonality levels (R = 0.31 for both relatively in-phase and out-of-phase years; Figure 5F).
These results suggest that a longer presence of snow on the ground from one catchment to another is associated with reduced high-flow variability, in both arid in-phase and wet out-of-phase regions. Over time, in snow-rich catchments, years with relatively higher SP may exhibit a larger variability of high-flow compared to years with relatively lower SP. Again, this might be due to a potentially higher contribution of fast and highly variable surface flow to streamflow relative to the contributions from other compartments to streamflow, in years with higher SP.
Spatially, there is a statistically significant positive (p < 0.05) Spearman correlation between SP and high-flow event duration across all study catchments (ρ = 0.49), across arid in-phase catchments (ρ = 0.31), across arid out-of-phase catchments (ρ = 0.71), and across catchments located in wet out-of-phase climates (ρ = 0.26; Figure 3A). The overall impact of SP on increasing the high-flow event duration is stronger in arid climates (for both in-phase, ρscaled = 17.59, and out-of-phase, ρscaled = 35.02, seasonalities) than in wet climates with out-of-phase seasonality (ρscaled = 9.04; Figure 3B).
Like the spatial analysis, the catchment-level inter-annual correlational analysis reveals a strong positive temporal Pearson correlation between SP and high-flow duration across much of North America with the strongest (Figure 4G) correlations in Western Canada and the Rockies, albeit with a few exceptions to this pattern in parts of the Pacific Northwest. Further exploration through the standardized correlational analysis depicts that in a typical snow-rich catchment, there are statistically significant (p < 0.01) positive Pearson correlations between SP and high-flow duration with only some differences between relatively drier and relatively wetter years (R = 0.31 in wetter years versus R = 0.24 in drier years) as well as between relatively in-phase and relatively out-of-phase years (R = 0.26 relatively in phase and R = 0.27 relatively out-of-phase; Figure 5G).
Generally, SP is associated with lengthening the duration of high-flow events over space and time. In particular, the spatial correlation and overall impact of SP on the lengthening of high-flow duration is stronger in arid regions than in wet regions. Note that in the extraction of high-flow events, our algorithm is not limited to the extraction of only events with extreme high-flow, since events with flow magnitudes much smaller than Q95 (but still larger than the threshold of 4x Qmedian) can be detected as high-flow events (see Section 2.4 for more details).
This paper focused on improving the understanding of the spatiotemporal linkages between snow persistence (SP) and streamflow hydrograph shape, flashiness, and variability at low-flow and high-flow conditions. Given that snow persistence is a globally available measure of snowpack duration and ablation, knowledge of such links between streamflow behavior and snow cover variabilities are useful to inform alterations in hydrograph shape at regional to global scales (as will be discussed in Section 4.1). Our results provide a new angle to interpret potential changes in streamflow behavior under global climate change, as will be discussed in Section 4.2. Our results also reiterate previously discovered warnings for practitioners of climate science seeking to find symmetry between the spatial and temporal behavior of hydrologic responses (Section 4.3). We also present the limitations and future potential directions of our work in Section 4.4. In the Supplementary Material we further discuss the process-based rationales of how SP affects streamflow characteristics during low and high flows and discuss some new hypotheses for future exploration.
Our results suggest that SP is spatially and temporally associated with most shape-based signatures related to low-flows across North America, extending links previously explored between annual SP and annual water yield for sites in Colorado and the western United States (Hammond et al., 2018b; Harrison et al., 2021). Our inter-catchment spatial analyses suggest that a higher persistence of snow on the ground could lead to a damper (less flashy) low-flow hydrograph through larger baseflow indices, larger extreme low-flow to average flow ratios, smaller low-flow variability, and more sustained low-flow event durations (Figure 2A). These analyses further show that snow persistence becomes a more impactful factor in increasing the ratios of baseflow (or extreme low-flow) to average flow, in reducing the variability of low-flow, and in lengthening low-flow events, within arid/in-phase regions (e.g., the central United States and Canada; Figures 1, 2) compared to wet/out-of-phase regions. Generally, our results suggest that, in arid/in-phase and wet/out-of-phase climates a catchment with a larger snow persistence may have a damper low-flow hydrograph and a longer duration of low-flow events. This effect is particularly strong when comparing catchments with different degrees of snow persistence within arid/in-phase climatic regions. This is similar to links found between SP and annual water yield for dry catchments in Hammond et al. (2018b).
Over time, the magnitudes of baseflow and extreme low-flow generally increase during years with higher SP. However, years with a higher SP may show smaller ratios of baseflow (or extreme low-flow) to average flow compared to years with a lower SP (Figures 4A, B, 5A, B). A disproportionate increase in the magnitude of high-flows during snowy years may decrease the baseflow index and decrease the ratio of extreme low-flow to average streamflow while still increasing overall low-flow magnitudes. This discussion is supported by our high-flow related findings which suggest that the ratio of extreme high-flow to average streamflow and high-flow variability increases during years with higher SP in typical snow-rich catchments (Figures 4E, F, 5E, F). Our results are in agreement with prior studies that have estimated greater surface and shallow subsurface partitioning of snowmelt, as compared to deeper flow-path partitioning, during rapid snowmelt events in particularly snowy years (Barnhart et al., 2016; Fuss et al., 2016; Gordon et al., 2022; Hale et al., 2022). Indeed, a typical snow-rich catchment—which can generally be characterized with a damped and smooth hydrograph at low-flow—can have a moderate swing toward a relatively flashier low-flow hydrograph during its very snowy years.
Results also suggest that SP is, to some extent, associated with shape-based streamflow signatures related to high-flows over both space and time. A larger snow persistence is spatially associated with a lower High-FDC (i.e., damper high-flow hydrographs) in both arid/in-phase and wet/out-of-phase climates (Figure 3A). In all three regions considered in our spatial analyses, a larger snow persistence is associated with a longer duration of high-flow events with flow magnitudes continuously larger than the 4× Qmedian threshold (Figure 3A). These analyses further show that snow persistence becomes a more impactful factor in decreasing high-flow variability (damping high-flow hydrograph), and in lengthening the duration of high-flow events, within arid/in-phase climatic regions (e.g., the central United States and Canada; see Figure 1) compared to wet/out-of-phase regions (Figure 3B). Generally, our results suggest that, in arid/in-phase and wet/out-of-phase climates a catchment with a larger snow persistence may have a damper high-flow hydrograph and a longer duration of events with large flow magnitudes. This effect is particularly strong when comparing catchments with different degrees of snow persistence within arid/in-phase climatic regions. On the other hand, our temporal analysis suggests that in a typical snow-rich catchment, snowier years are associated with a larger ratio of extreme high-flow to average flow and a larger high-flow variability, both reflecting a more flashy high-flow hydrograph. Indeed, in arid/in-phase and wet/out-of-phase climates, a typical snow-rich catchment—which can generally be characterized with a relatively damped high-flow hydrograph as explained above—can have a moderate swing toward a relatively flashier high-flow hydrograph during its snowier years. Please see the Supplementary Material and Supplementary Figure S2 for how SP could be linked to flow paths (and processes) that generate variability in high-flow and low-flow conditions.
Our results also suggest a stronger correlation between SP and most shape-based low-flow and high-flow signatures compared to AI and SI (Supplementary Figure S1). This simple analysis suggests that SP has stronger predictive capabilities compared to other widely used climatic indices. However, a more thorough assessment of the relative importance of these three climatic indices requires the use of a more sophisticated variable importance analysis such as those used in Addor et al. (2018), Li and Ameli (2022), or Janssen et al. (2023). Such a ranking is beyond the scope of this paper.
In sum, our findings validate that SP could be used as a new catchment descriptor for explaining shape-based low-flow and high-flow signatures over both space and time, and our findings suggest that SP could be useful globally in a variety of climate regimes. As a simple and widely available index of snow accumulation and ablation, SP can be used 1) in the development of parsimonious, large-scale, and spatially regionalized catchment hydrologic functioning frameworks and 2) in the temporal assessment of the impact of snow loss on low-flow and high-flow characteristics. Our findings also help to identify catchments with low-flow and high-flow vulnerabilities. For example, in arid/in-phase climates a catchment with a shorter persistence of snow may experience a relatively larger variability of both high-flows and low-flows and a relatively shorter duration of high-flow and low-flow events compared to a catchment with a higher persistence of snow. The former catchment would thus be less stable and more vulnerable in response to climate driven alterations. The same is true in wet/out-of-phase climates but with smaller differences among catchments in low-flow and high-flow vulnerabilities. In wet/out-of-phase climates, low and high-flows could be more dominantly sourced by rainfall, reducing the role that snow can play in maintaining sufficient and stable flow during high-flow and low-flow conditions.
Catchments in North America (and worldwide) are highly vulnerable to snow loss from climate change (Huning and AghaKouchak, 2018; IPCC, 2021; Shrestha et al., 2021; Siirila-Woodburn et al., 2021). Recent research studies suggest that within the next 35–60 years, snow-poor conditions resulting from unabated climate change could persist across large parts of western North America (Siirila-Woodburn et al., 2021). Furthermore, snowmelt timing on an annual level is expected to be earlier in the year (Musselman et al., 2021). All this paints a picture of a future with less persistence of snow on the ground if current warming trends continue. The growing aridification of large parts of North America (Overpeck and Udall, 2020) and potential changes in the annual precipitation timing (or seasonality) of large regions of the continent (Easterling et al., 2017; Gershunov et al., 2019; Zhang et al., 2019), along with the changes mentioned above in snow presence on the ground, emphasize the need for regionally-sensitive analytical tools built on the relationships among persistence of snow, aridity, seasonality, and streamflow characteristics. Such tools could help identify when and where snowpack alterations are most hydrologically influential (Siirila-Woodburn et al., 2021). Our paper takes a step in this regard by identifying the aridity and seasonality-dependent temporal associations between snow persistence and hydrograph shape (and variability) across North America.
Broadbent et al. (2021) recently showed that snowmelt is predicted to occur 50–130 days earlier in alpine regions due to climate change by 2100. Or, as Harpold and Brooks (2018) showed, Colorado snowpacks are melting as much as a month earlier than the historical norm. As a hypothetical example, an Alpine climatic catchment within North America (e.g., across the Rocky Mountains) could have a long-term snow persistence value of 0.75 (See Figure 1A). An illustrative ∼2-month decline in snow presence on the ground would imply a change in snow persistence from 0.75 to 0.40 (i.e., halving the time that snow is on the ground). While previous work might have been only able to comment that such a drop in SP would result in lower average flow (Hammond et al., 2018b; Eurich et al., 2021) and reduced peak flows (Kampf and Lefsky, 2016), we can now say that such a drop in SP can result in a substantial change in the hydrograph shape through alterations in the hydrograph’s flashiness, variability, and duration of low-flow and high-flow events.
For example, a typical snow-rich catchment such as those across the Rocky Mountains has relatively damp low-flow and high-flow hydrographs and relatively long durations of high-flow events with flow magnitudes larger than a prescribed flow threshold (see Section 4.1). Large climate-driven reductions in snow persistence for a typical snow-rich catchment may lead to significantly damped low-flow and high flow hydrographs over time and shortened durations of high-flow events (see Section 4.1 and Figure 5). This implies that climate-driven reductions in snow persistence could alter the historical functional shape and variability of streamflow hydrographs of typical snow-rich catchments. Thus, the historical functional form that surrounding ecosystems and human activities have adapted to may change drastically. Such alterations can be disruptive to ecosystems, water resources management practices and human life (Parasiewicz et al., 2019; Clarke et al., 2022; IPCC, 2022; Rodell and Li, 2023; Rohde, 2023).
In previous studies, such as with Zhou et al. (2015), it was thought that relationships from spatial analyses can be interchangeably used for temporal analyses (i.e., there is a symmetry between spatial and temporal associations). Berghuijs and Woods (2016), showed that such symmetry is not valid for assessing the association between the aridity index and the partitioning of precipitation into streamflow and evaporation (within the context of the Budyko framework). Our results also suggest that this symmetry is not valid for the linkages between snow persistence and many shape-based streamflow signatures. Although inter-catchment spatial analysis suggests a positive association between SP and BFI (and normalized Q5; Figure 2), inter-annual temporal analysis suggests a negative association between SP and BFI (and normalized Q5) in most snow-rich catchments (Figure 4) and for a typical snow-rich catchment (Figure 5). While inter-catchment spatial analysis suggests a moderately strong negative association between SP and Low-FDC, inter-annual analysis suggests a very weak temporal association between SP and Low-FDC in snow-rich catchments (Figures 2, 4). Such findings corroborate previous work and serve as another warning to practitioners seeking to switch the relationships across space and time. Because of the coevolution of catchment attributes (e.g., climate, topography, geology, soil, or land cover), focusing strictly on spatial analyses and extrapolating the spatial findings over time may be misleading unless the confounding effects are explicitly accounted for.
Despite the strong catchment-level temporal correlations within many snow-rich catchments (Figure 4), the correlation values in our spatial analyses and spatiotemporal “typical catchment” analyses are not strong between SP and some shape-based signatures (e.g., normalized Q5 and Q95). This was not surprising, as recent predictive models developed across a large sample of catchments also showed that shape-based signatures are very hard to predict (Addor et al., 2018). Janssen and Ameli (2021) used random forest modeling along with detailed climatic, geological, and topographical attributes to predict the shape-based signatures used in our paper across hundreds of catchments in the USA and Canada. They obtained low predictive capabilities (R2 < 0.40) when predicting shape-based signatures over space. As the goal of our paper was not prediction or identifying relative predictor importance, statistically significant p-values (Figures 2–5) allowed us to detect the linkages between SP and relevant streamflow signatures. The broad nature of our work—incorporating the climatic diversity present across North America with over a thousand catchments and almost 20,000 annual datapoints—helps to lend meaningful credence to the observed statistically significant results. Echoing previous work, large sample size studies are important for finding hydrological patterns (Sawicz et al., 2011; Addor et al., 2018; Janssen and Ameli, 2021; Anderson et al., 2022), as they guard against spurious correlations (Jackson and Somers, 1991; Bonett and Wright, 2000; Yue et al., 2002). Future work can leverage current and upcoming advances in open and accurate data, such as with catchment geology (Smelror, 2020), topography (Amatulli et al., 2018; Amatulli et al., 2020), or climatic data (Overpeck et al., 2011; Tang et al., 2021; Tang et al., 2022), and include snow persistence, along with other explanatory factors of stream low/high-flow behavior to improve the prediction of shape-based signatures.
Echoing previous work on the snow persistence product, it is known that cloud cover can disrupt snow detection (especially in winter months) of daily snowfall data by up to 22%–50% (Molotch and Meromy, 2014). Similarly, forest cover can disrupt snow detection in densely forested regions (Rittger et al., 2013). To reduce these impacts, this study used newly developed remotely sensed data that attempts to better algorithmically correct snowfall detection errors (Riggs et al., 2016). Further research and corrections may be required to create higher-quality global SP products, particularly for regions such as Asia, Europe, or South America (Hammond et al., 2018a). Such improved data could be used to evaluate the association between snow persistence and streamflow signatures at the global scale across a larger spectrum of aridity and seasonality than was considered in our paper.
There are limitations with using BFI in snow-dominated catchments. Notably, there are known issues with the estimation of baseflow values, and BFI calculations can be highly sensitive to parameterization (Voutchkova et al., 2019). This paper sought to use consistent methodologies to calculate BFIs for comparability between catchments, and we mitigated the bias in our results by using other low-flow behavior signatures (e.g., normalized Q5, Low-FDC, and low-flow event duration). Sensitivity analyses with a variety of parameterizations can be done in the future to dig deeper into the exact relationships between SP and BFI.
Our results are limited to the associations between SP and streamflow signatures at perennial streams. We acknowledge it may be a fruitful area of future research to identify the effects that snowpack variability may have on streamflow signatures in intermittent streams across different climatic regions of North America (Eng et al., 2016). Recent research has shown that snow water equivalent was an essential descriptor of non-perennial streamflow signatures in the western United States (Hammond et al., 2021), but further research is needed to evaluate these relations in greater detail and in the context of declining snowpacks. Indeed, given that SP itself is a relatively new measure of snow behavior for hydrologic applications (Kampf and Lefsky, 2016; Hammond et al., 2018a; b;Eurich et al., 2021), such research into intermittent streams can be very insightful for inferring generalizable knowledge.
Future work can also use snow persistence, along with ecologically important metrics of catchment biological viability (McMillan, 2020), to inform catchment management efforts (Siirila-Woodburn et al., 2021) by creating thresholds, models, or even practical guidelines for levels of snow persistence required to sustain catchment ecosystems and anthropogenic activities. This can provide direct and actionable advice and insights for practitioners responsible for managing such natural resources. Another fruitful area of research could be to explore the relationships between snow persistence and hydrologic behavior in response to higher-order impacts of climate change. For example, greater wildfire risk or tree mortality in many catchments in North America (Westerling et al., 2006; Whitman et al., 2015; Abatzoglou and Williams, 2016) are likely to have effects on forest snow ablation (Gleason et al., 2013), snow persistence, and ultimately on streamflow characteristics (Siirila-Woodburn et al., 2021). Such interactions could prove informative for generating knowledge of climate change’s effects on hydrology.
Publicly available datasets were analyzed in this study. This data can be found here: https://github.com/hgwm.
EL: Data Curation, Investigation, Software, Visualization, Writing (Draft Preparation, Editing, and Review), Formal Analysis. JJ: Formal Analysis, Investigation, Software, Validation, Writing (Editing and Review). JH: Data Curation, Software, Writing (Editing and Review). AAA: Conceptualization, Funding Acquisition, Project Administration, Resources, Supervision, Data Curation, Writing (Editing, and Review). All authors contributed to the article and approved the submitted version.
This research was funded by the NSERC Discovery grant as well as an Environment and Climate Change Canada grant awarded to AAA. In addition, JJ was supported by an NSERC PhD Scholarship.
The authors declare that the research was conducted in the absence of any commercial or financial relationships that could be construed as a potential conflict of interest.
All claims expressed in this article are solely those of the authors and do not necessarily represent those of their affiliated organizations, or those of the publisher, the editors and the reviewers. Any product that may be evaluated in this article, or claim that may be made by its manufacturer, is not guaranteed or endorsed by the publisher.
The Supplementary Material for this article can be found online at: https://www.frontiersin.org/articles/10.3389/fenvs.2023.1207508/full#supplementary-material
Abatzoglou, J. T., Dobrowski, S. Z., Parks, S. A., and Hegewisch, K. C. (2018). TerraClimate, a high-resolution global dataset of monthly climate and climatic water balance from 1958–2015. Sci. Data 5, 170191. doi:10.1038/sdata.2017.191
Abatzoglou, J. T., and Williams, A. P. (2016). Impact of anthropogenic climate change on wildfire across Western US forests. Proc. Natl. Acad. Sci. 113, 11770–11775. doi:10.1073/pnas.1607171113
Adams, K. H., Reager, J. T., Rosen, P., Wiese, D. N., Farr, T. G., Rao, S., et al. (2022). Rc. Water Resour. Res. 58, e2022WR032219.
Addor, N., Do, H. X., Alvarez-Garreton, C., Coxon, G., Fowler, K., and Mendoza, P. A. (2020). Large-sample hydrology: Recent progress, guidelines for new datasets and grand challenges. Hydrological Sci. J. 65, 712–725. doi:10.1080/02626667.2019.1683182
Addor, N., Nearing, G., Prieto, C., Newman, A., Le Vine, N., and Clark, M. (2018). A ranking of hydrological signatures based on their predictability in space. Water Resour. Res. 54, 8792–8812. doi:10.1029/2018wr022606
Addor, N., Newman, A. J., Mizukami, N., and Clark, M. P. (2017). The CAMELS data set: Catchment attributes and meteorology for large-sample studies. Hydrology Earth Syst. Sci. (HESS) 21, 5293–5313. doi:10.5194/hess-21-5293-2017
Amatulli, G., Domisch, S., Tuanmu, M.-N., Parmentier, B., Ranipeta, A., Malczyk, J., et al. (2018). A suite of global, cross-scale topographic variables for environmental and biodiversity modeling. Sci. Data 5, 180040. doi:10.1038/sdata.2018.40
Amatulli, G., Mcinerney, D., Sethi, T., Strobl, P., and Domisch, S. (2020). Geomorpho90m, empirical evaluation and accuracy assessment of global high-resolution geomorphometric layers. Sci. Data 7, 162. doi:10.1038/s41597-020-0479-6
Anderson, B. J., Slater, L. J., Dadson, S. J., Blum, A. G., and Prosdocimi, I. (2022). Statistical attribution of the influence of urban and tree cover change on streamflow: A comparison of large sample statistical approaches. Water Resour. Res. 58, e2021WR030742. doi:10.1029/2021wr030742
Barnett, T. P., Adam, J. C., and Lettenmaier, D. P. (2005). Potential impacts of a warming climate on water availability in snow-dominated regions. Nature 438, 303–309. doi:10.1038/nature04141
Barnhart, T. B., Molotch, N. P., Livneh, B., Harpold, A. A., Knowles, J. F., and Schneider, D. (2016). Snowmelt rate dictates streamflow. Geophys. Res. Lett. 43, 8006–8016. doi:10.1002/2016gl069690
Beniston, M., and Stoffel, M. (2014). Assessing the impacts of climatic change on mountain water resources. Sci. Total Environ. 493, 1129–1137. doi:10.1016/j.scitotenv.2013.11.122
Berghuijs, W. R., Sivapalan, M., Woods, R. A., and Savenije, H. H. G. (2014). Patterns of similarity of seasonal water balances: A window into streamflow variability over a range of time scales. Water Resour. Res. 50, 5638–5661. doi:10.1002/2014wr015692
Berghuijs, W. R., and Woods, R. A. (2016). Correspondence: Space-time asymmetry undermines water yield assessment. Nat. Commun. 7, 11603. doi:10.1038/ncomms11603
Bonett, D. G., and Wright, T. A. (2000). Sample size requirements for estimating pearson, kendall and spearman correlations. Psychometrika 65, 23–28. doi:10.1007/bf02294183
Boulton, A. J. (2003). Parallels and contrasts in the effects of drought on stream macroinvertebrate assemblages. Freshw. Biol. 48, 1173–1185. doi:10.1046/j.1365-2427.2003.01084.x
Broadbent, A. A., Snell, H. S., Michas, A., Pritchard, W. J., Newbold, L., Cordero, I., et al. (2021). Climate change alters temporal dynamics of alpine soil microbial functioning and biogeochemical cycling via earlier snowmelt. ISME J. 15, 2264–2275. doi:10.1038/s41396-021-00922-0
Budyko, M. I. (1974). “VI climatic factors of geographical zonality,” in International geophysics (Cambridge: Academic Press), 317–370.
Bush, E., and Lemmen, D. S. (Editors) (2019). Canada’s changing climate report (Ottawa, ON: Government of Canada).
Clarke, B., Otto, F., Stuart-Smith, R., and Harrington, L. (2022). Extreme weather impacts of climate change: An attribution perspective. Environ. Res. Clim. 1, 012001. doi:10.1088/2752-5295/ac6e7d
Coopersmith, E. J., Minsker, B. S., and Sivapalan, M. (2014). Patterns of regional hydroclimatic shifts: An analysis of changing hydrologic regimes. Water Resour. Res. 50, 1960–1983. doi:10.1002/2012wr013320
Dewalle, D. R., and Rango, A. (2008). Principles of snow hydrology. Cambridge: Cambridge University Press.
Easterling, D. R., Arnold, J. R., Knutson, T., Kunkel, K. E., Legrande, A. N., Leung, L. R., et al. (2017). “Ch. 7: Precipitation change in the United States,” in Climate science special report: Fourth national climate assessment, volume I (Washington, DC: U.S. Global Change Research Program).
Eng, K., Wolock, D. M., and Dettinger, M. D. (2016). Sensitivity of intermittent streams to climate variations in the USA. River Res. Appl. 32, 885–895. doi:10.1002/rra.2939
Environment and Climate Change Canada, (2021). HYDAT.mdb. Government of Canada. Available at: https://www.canada.ca/en/environment-climate-change/services/water-overview/quantity/monitoring/survey/data-products-services/national-archive-hydat.html
Eurich, A., Kampf, S. K., Hammond, J. C., Ross, M., Willi, K., Vorster, A. G., et al. (2021). Predicting mean annual and mean monthly streamflow in Colorado ungauged basins. River Res. Appl. 37, 569–578. doi:10.1002/rra.3778
Evenson, G. R., Golden, H. E., Lane, C. R., Mclaughlin, D. L., and D'amico, E. (2018). Depressional wetlands affect watershed hydrological, biogeochemical, and ecological functions. Ecol. Appl. 28, 953–966. doi:10.1002/eap.1701
Fuss, C. B., Driscoll, C. T., Green, M. B., and Groffman, P. M. (2016). Hydrologic flowpaths during snowmelt in forested headwater catchments under differing winter climatic and soil frost regimes. Hydrol. Process. 30, 4617–4632. doi:10.1002/hyp.10956
Galton, F. (1889). I. Co-relations and their measurement, chiefly from anthropometric data. Proc. R. Soc. Lond. 45, 135–145. doi:10.1098/rspl.1888.0082
Gershunov, A., Shulgina, T., Clemesha, R. E. S., Guirguis, K., Pierce, D. W., Dettinger, M. D., et al. (2019). Precipitation regime change in western NorthNorth America: The role of atmospheric rivers. Sci. Rep. 9, 9944. doi:10.1038/s41598-019-46169-w
Gleason, K. E., Nolin, A. W., and Roth, T. R. (2013). Charred forests increase snowmelt: Effects of burned woody debris and incoming solar radiation on snow ablation. Geophys. Res. Lett. 40, 4654–4661. doi:10.1002/grl.50896
Gordon, B. L., Brooks, P. D., Krogh, S. A., Boisrame, G. F. S., Carroll, R. W. H., Mcnamara, J. P., et al. (2022). Why does snowmelt-driven streamflow response to warming vary? A data-driven review and predictive framework. Environ. Res. Lett. 17, 053004. doi:10.1088/1748-9326/ac64b4
Hale, C. A., Carling, G. T., Nelson, S. T., Fernandez, D. P., Brooks, P. D., Rey, K. A., et al. (2022). Strontium isotope dynamics reveal streamflow contributions from shallow flow paths during snowmelt in a montane watershed, Provo River, Utah, USA. Hydrol. Process. 36, e14458. doi:10.1002/hyp.14458
Hall, D. K., and Riggs, G. A. (2016). MODIS/Terra snow cover 8-day L3 global 500m SIN grid. Boulder, Colorado USA: NASA National Snow and Ice Data Center Distributed Active Archive Center. Version 6. Collection 6.
Hall, D. K., Riggs, G. A., Salomonson, V. V., Digirolamo, N. E., and Bayr, K. J. (2002). MODIS snow-cover products. Remote Sens. Environ. 83, 181–194. doi:10.1016/s0034-4257(02)00095-0
Hammond, J. C., Saavedra, F. A., and Kampf, S. K. (2018a). Global snow zone maps and trends in snow persistence 2001–2016. Int. J. Climatol. 38, 4369–4383. doi:10.1002/joc.5674
Hammond, J. C., Saavedra, F. A., and Kampf, S. K. (2018b). How does snow persistence relate to annual streamflow in mountain watersheds of the western U.S. With wet maritime and dry continental climates? Water Resour. Res. 54, 2605–2623. doi:10.1002/2017wr021899
Hammond, J. (2020a). Contiguous U.S. annual snow persistence and trends from 2001-2020. U.S. Geological Survey data release. doi:10.5066/P9U7U5FP
Hammond, J. (2020b). MODIS snow persistence for Canada and Alaska 2001-2019. HydroShare. doi:10.4211/hs.82326ee6288241f3a85ed1d01a3083d0
Hammond, J. C., Zimmer, M., Shanafield, M., Kaiser, K., Godsey, S. E., Mims, M. C., et al. (2021). Spatial patterns and drivers of nonperennial flow regimes in the contiguous United States. Geophys. Res. Lett. 48, e2020GL090794. doi:10.1029/2020gl090794
Harpold, A. A., and Brooks, P. D. (2018). Humidity determines snowpack ablation under a warming climate. Proc. Natl. Acad. Sci. 115, 1215–1220. doi:10.1073/pnas.1716789115
Harrison, H. N., Hammond, J. C., Kampf, S., and Kiewiet, L. (2021). On the hydrological difference between catchments above and below the intermittent-persistent snow transition. Hydrol. Process. 35, e14411. doi:10.1002/hyp.14411
Hrachowitz, M., Savenije, H. H. G., Blöschl, G., Mcdonnell, J. J., Sivapalan, M., Pomeroy, J. W., et al. (2013). A decade of predictions in ungauged basins (PUB)—A review. Hydrological Sci. J. 58, 1198–1255. doi:10.1080/02626667.2013.803183
Huning, L. S., and Aghakouchak, A. (2018). Mountain snowpack response to different levels of warming. Proc. Natl. Acad. Sci. 115, 10932–10937. doi:10.1073/pnas.1805953115
IPCC (2007). Synthesis report. Contribution of working groups I, II and III to the fourth assessment report of the intergovernmental panel on climate change. Geneva, Switzerland: IPCC.
IPCC (2018). “Global warming of 1.5°C,” in An IPCC Special Report on the impacts of global warming of 1.5°C above pre-industrial levels and related global greenhouse gas emission pathways, in the context of strengthening the global response to the threat of climate change, sustainable development, and efforts to eradicate poverty. Editors V. Masson-Delmotte, P. P. Zhai, H. O. Pörtner, D. Roberts, J. Skea, P. R. Shuklaet al. (Cambridge, UK and New York, NY: IPCC).
IPCC (2021). “Summary for policymakers,” in Climate change 2021: The physical science basis. Contribution of working group I to the sixth assessment report of the intergovernmental panel on climate change. Editors V. Basson-Delmotte, P. Zhai, A. Pirani, S. L. Connors, C. Péan, S. Bergeret al. (Cambridge, UK and New York, NY: IPCC).
IPCC (2022). in Climate change 2022: Impacts, adaptation and vulnerability. Editors H.-O. Pörtner, D. C. Roberts, M. Tignor, E. S. Poloczanska, K. Mintenbeck, A. Alegríaet al. (Cambridge, UK and New York, NY: IPCC).
Jackson, D. A., and Somers, K. M. (1991). The spectre of 'spurious' correlations. Oecologia 86, 147–151. doi:10.1007/bf00317404
Janssen, J., and Ameli, A. A. (2021). A hydrologic functional approach for improving large-sample hydrology performance in poorly gauged regions. Water Resour. Res. 57, e2021WR030263. doi:10.1029/2021wr030263
Janssen, J., Guan, V., and Robeva, E. (2023). “Ultra-marginal feature importance: Learning from data with causal guarantees,” in International Conference on Artificial Intelligence and Statistics. PMLR.
Kampf, S. K., and Lefsky, M. A. (2016). Transition of dominant peak flow source from snowmelt to rainfall along the Colorado Front Range: Historical patterns, trends, and lessons from the 2013 Colorado Front Range floods. Water Resour. Res. 52, 407–422. doi:10.1002/2015wr017784
Kuentz, A., Arheimer, B., Hundecha, Y., and Wagener, T. (2017). Understanding hydrologic variability across Europe through catchment classification. Hydrol. Earth Syst. Sci. 21, 2863–2879. doi:10.5194/hess-21-2863-2017
Ladson, A. R., Brown, R., Neal, B., and Nathan, R. (2013). A standard approach to baseflow separation using the Lyne and Hollick filter. Australas. J. Water Resour. 17, 25–34. doi:10.7158/w12-028.2013.17.1
Li, H., and Ameli, A. (2022). A statistical approach for identifying factors governing streamflow recession behaviour. Hydrol. Process. 36, e14718. doi:10.1002/hyp.14718
Linsley, R. K., Kohler, M. A., and Paulhus, J. L. H. (1975). Hydrology for engineers. New York Toronto London: McGRAW-HILL BOOK COMPANY, INC.
Mckerchar, A. I. (2003). “Streamflow,” in Encyclopedia of physical science and technology. Editor R A Meyers. Third Edition (New York: Academic Press), 129–142.
McMillan, H. K. (2021). A review of hydrologic signatures and their applications. WIREs Water 8, e1499. doi:10.1002/wat2.1499
McMillan, H. (2020). Linking hydrologic signatures to hydrologic processes: A review. Hydrol. Process. 34, 1393–1409. doi:10.1002/hyp.13632
Milly, P. C. D., Dunne, K. A., and Vecchia, A. V. (2005). Global pattern of trends in streamflow and water availability in a changing climate. Nature 438, 347–350. doi:10.1038/nature04312
Molotch, N. P., and Meromy, L. (2014). Physiographic and climatic controls on snow cover persistence in the Sierra Nevada Mountains. Hydrol. Process. 28, 4573–4586. doi:10.1002/hyp.10254
Moore, C., Kampf, S., Stone, B., and Richer, E. (2015). A GIS-based method for defining snow zones: Application to the Western United States. Geocarto Int. 30, 62–81. doi:10.1080/10106049.2014.885089
Muñoz-Sabater, J., Dutra, E., Agustí-Panareda, A., Albergel, C., Arduini, G., Balsamo, G., et al. (2021). ERA5-Land: A state-of-the-art global reanalysis dataset for land applications. Earth Syst. Sci. Data 13, 4349–4383. doi:10.5194/essd-13-4349-2021
Musselman, K. N., Addor, N., Vano, J. A., and Molotch, N. P. (2021). Winter melt trends portend widespread declines in snow water resources. Nat. Clim. Change 11, 418–424. doi:10.1038/s41558-021-01014-9
Newman, A. J., Clark, M. P., Sampson, K., Wood, A., Hay, L. E., Bock, A., et al. (2015). Development of a large-sample watershed-scale hydrometeorological data set for the contiguous USA: Data set characteristics and assessment of regional variability in hydrologic model performance. Hydrol. Earth Syst. Sci. 19, 209–223. doi:10.5194/hess-19-209-2015
Nolin, A. W., Sproles, E. A., Rupp, D. E., Crumley, R. L., Webb, M. J., Palomaki, R. T., et al. (2021). New snow metrics for a warming world. Hydrol. Process. 35, e14262. doi:10.1002/hyp.14262
Overpeck, J. T., Meehl, G. A., Bony, S., and Easterling, D. R. (2011). Climate data challenges in the 21st century. Science 331, 700–702. doi:10.1126/science.1197869
Overpeck, J. T., and Udall, B. (2020). Climate change and the aridification of North America. Proc. Natl. Acad. Sci. 117, 11856–11858. doi:10.1073/pnas.2006323117
Parasiewicz, P., King, E. L., Webb, J. A., Piniewski, M., Comoglio, C., Wolter, C., et al. (2019). The role of floods and droughts on riverine ecosystems under a changing climate. Fish. Manag. Ecol. 26, 461–473. doi:10.1111/fme.12388
Pearson, K. (1896). VII. Mathematical contributions to the theory of evolution.—III. Regression, heredity, and panmixia. Philosophical Trans. R. Soc. Lond. Ser. A, Contain. Pap. a Math. or Phys. Character 187, 253–318. doi:10.1098/rsta.1896.0007
Poff, N. L., Allan, J. D., Bain, M. B., Karr, J. R., Prestegaard, K. L., Richter, B. D., et al. (1997). The natural flow regime. BioScience 47, 769–784. doi:10.2307/1313099
R Core Team (2022). R: A language and environment for statistical computing. Vienna, Austria: R Foundation for Statistical Computing.
Riggs, G. A., Hall, D. K., and Roman, M. O. (2016). MODIS snow products collection 6 user guide. Boulder, Colorado USA: N.N.S.a.I.D.C.D.a.A. Center.
Rittger, K., Painter, T. H., and Dozier, J. (2013). Assessment of methods for mapping snow cover from MODIS. Adv. Water Resour. 51, 367–380. doi:10.1016/j.advwatres.2012.03.002
Rodell, M., and Li, B. (2023). Changing intensity of hydroclimatic extreme events revealed by GRACE and GRACE-FO. Nat. Water 1, 241–248. doi:10.1038/s44221-023-00040-5
Rohde, M. M. (2023). Floods and droughts are intensifying globally. Nat. Water 1, 226–227. doi:10.1038/s44221-023-00047-y
Saedi, J., Sharifi, M. R., Saremi, A., and Babazadeh, H. (2022). Assessing the impact of climate change and human activity on streamflow in a semiarid basin using precipitation and baseflow analysis. Sci. Rep. 12, 9228. doi:10.1038/s41598-022-13143-y
Sawicz, K. A., Kelleher, C., Wagener, T., Troch, P., Sivapalan, M., and Carrillo, G. (2014). Characterizing hydrologic change through catchment classification. Hydrology Earth Syst. Sci. 18, 273–285. doi:10.5194/hess-18-273-2014
Sawicz, K., Wagener, T., Sivapalan, M., Troch, P., and Carrillo, G. (2011). Catchment classification: Empirical analysis of hydrologic similarity based on catchment function in the eastern USA. Hydrology Earth Syst. Sci. 15, 2895–2911. doi:10.5194/hess-15-2895-2011
Shrestha, R. R., Bonsal, B. R., Bonnyman, J. M., Cannon, A. J., and Najafi, M. R. (2021). Heterogeneous snowpack response and snow drought occurrence across river basins of northwestern North America under 1.0°C to 4.0°C global warming. Clim. Change 164, 40. doi:10.1007/s10584-021-02968-7
Siirila-Woodburn, E. R., Rhoades, A. M., Hatchett, B. J., Huning, L. S., Szinai, J., Tague, C., et al. (2021). A low-to-no snow future and its impacts on water resources in the Western United States. Nat. Rev. Earth Environ. 2, 800–819. doi:10.1038/s43017-021-00219-y
Smakhtin, V. U. (2001). Low flow hydrology: A review. J. Hydrology 240, 147–186. doi:10.1016/s0022-1694(00)00340-1
Smelror, M. (2020). Geology for society in 2058: Some down-to-Earth perspectives. Geol. Soc. Lond. Spec. Publ. 499, 17–47. doi:10.1144/sp499-2019-40
Spearman, C. (1904). The proof and measurement of association between two things. Am. J. Psychol. 15, 72–101. doi:10.2307/1412159
Tan, X., and Gan, T. Y. (2015). Contribution of human and climate change impacts to changes in streamflow of Canada. Sci. Rep. 5, 17767. doi:10.1038/srep17767
Tang, G., Clark, M. P., and Papalexiou, S. M. (2022). EM-Earth: The ensemble meteorological dataset for planet earth. Bull. Am. Meteorological Soc. 103, E996–E1018. doi:10.1175/bams-d-21-0106.1
Tang, G., Clark, M. P., Papalexiou, S. M., Newman, A. J., Wood, A. W., Brunet, D., et al. (2021). Edina: An ensemble meteorological dataset for North America. Earth Syst. Sci. Data 13, 3337–3362. doi:10.5194/essd-13-3337-2021
U.S. Geological Survey (2020). USGS water data for the nation. National Water Information System. Available at: http://nwis.waterdata.usgs.gov/nwis
USGCRP (2018). in Impacts, risks, and adaptation in the United States: Fourth national climate assessment, volume II. Editors D. R. Reidmiller, C. W. Avery, D. R. Easterling, K. E. Kunkel, K. L. M. Lewis, T. K. Maycocket al. (Washington, DC, USA: USGCRP).
Voutchkova, D. D., Miller, S. N., and Gerow, K. G. (2019). Parameter sensitivity of automated baseflow separation for snowmelt-dominated watersheds and new filtering procedure for determining end of snowmelt period. Hydrol. Process. 33, 876–888. doi:10.1002/hyp.13369
Wagener, T., Sivapalan, M., Troch, P., and Woods, R. (2007). Catchment classification and hydrologic similarity. Geogr. Compass 1, 901–931. doi:10.1111/j.1749-8198.2007.00039.x
Wester, P., Mishra, A., Mukherji, A., and Shrestha, A. B. (Editors) (2019). The hindu kusha himalaya assessment: Mountains, climate change, sustainability and people (Berlin, Germany: Springer Nature).
Westerling, A. L., Hidalgo, H. G., Cayan, D. R., and Swetnam, T. W. (2006). Warming and earlier spring increase Western US forest wildfire activity. Science 313, 940–943. doi:10.1126/science.1128834
Whitman, E., Sherren, K., and Rapaport, E. (2015). Increasing daily wildfire risk in the Acadian Forest Region of Nova Scotia, Canada, under future climate change. Reg. Environ. Change 15, 1447–1459. doi:10.1007/s10113-014-0698-5
Wiche, G. J., and Holmes, R. R. (2016). “Chapter 13 - streamflow data,” in Flood forecasting. Editors T. E. Adams, and T. C. Pagano (Boston: Academic Press), 371–398.
Woods, R. A. (2009). Analytical model of seasonal climate impacts on snow hydrology: Continuous snowpacks. Adv. Water Resour. 32, 1465–1481. doi:10.1016/j.advwatres.2009.06.011
Yue, S., Pilon, P., and Cavadias, G. (2002). Power of the Mann–Kendall and Spearman's rho tests for detecting monotonic trends in hydrological series. J. Hydrology 259, 254–271. doi:10.1016/s0022-1694(01)00594-7
Zhang, X., Flato, G., Kirchmeier-Young, M., Vincent, L., Wan, H., Wang, X., et al. (2019). “Changes in temperature and precipitation across Canada,” in Chapter 4 in Canada's changing climate report. Editors E. Bush, and D. S. Lemmen (Ottawa, Ontario: Government of Canada), 112–193.
Zhang, Y., Zheng, H., Zhang, X., Leung, L. R., Liu, C., Zheng, C., et al. (2023). Future global streamflow declines are probably more severe than previously estimated. Nat. Water 1, 261–271. doi:10.1038/s44221-023-00030-7
Keywords: snow persistence, remote sensing, correlational analysis, North America, low-flow signatures, high-flow signatures, space-time symmetry, hydrograph shape
Citation: Le E, Janssen J, Hammond J and Ameli AA (2023) The persistence of snow on the ground affects the shape of streamflow hydrographs over space and time: a continental-scale analysis. Front. Environ. Sci. 11:1207508. doi: 10.3389/fenvs.2023.1207508
Received: 17 April 2023; Accepted: 22 June 2023;
Published: 14 July 2023.
Edited by:
Dipankar Dwivedi, Berkeley Lab (DOE), United StatesReviewed by:
Ping Wang, Chinese Academy of Sciences (CAS), ChinaCopyright © 2023 Le, Janssen, Hammond and Ameli. This is an open-access article distributed under the terms of the Creative Commons Attribution License (CC BY). The use, distribution or reproduction in other forums is permitted, provided the original author(s) and the copyright owner(s) are credited and that the original publication in this journal is cited, in accordance with accepted academic practice. No use, distribution or reproduction is permitted which does not comply with these terms.
*Correspondence: Ali A. Ameli, YWFtZWxpQGVvYXMudWJjLmNh
Disclaimer: All claims expressed in this article are solely those of the authors and do not necessarily represent those of their affiliated organizations, or those of the publisher, the editors and the reviewers. Any product that may be evaluated in this article or claim that may be made by its manufacturer is not guaranteed or endorsed by the publisher.
Research integrity at Frontiers
Learn more about the work of our research integrity team to safeguard the quality of each article we publish.