 Rentian Shu
 Jingyi Xiao1,2*
- 1School of Geographical Sciences, Qinghai Normal University, Xining, China
- 2Key Laboratory of Natural Geography and Environmental Processes of Qinghai Province, Xining, China
- 3College of Tea Science and Tea Culture, Zhejiang Agriculture and Forestry University, Hangzhou, China
In the context of the “Internet plus” era, the study of tea industry online attention is a new perspective in research on the tea industry and an opportunity for the sustainable and high-quality development of this industry. Based on the Baidu index, this paper obtains web attention data from 2012 to 2021, analyzes the spatial and temporal evolution characteristics of online attention using the seasonal concentration index and geographic concentration index, and quantitatively discusses the influencing factors using correlation analysis and GeoDetector. The results show the following: The interannual change in China’s tea industry online attention shows “rapid growth, high level of stability, slow decline,” the monthly distribution has an intense concentration, mainly in March-April and October, and the interday distribution of attention peaks on weekdays. The spatial distribution shows an intense geographical concentration, with an overall trend of “light concentration first, then light dispersion.” The migration trajectory of the center of attention is tilted toward the southwest. Economic development status, residents’ income, the natural environment of tea growing, the leisure time of followers, and the price level of tea are the essential factors affecting the of the tea industry online attention. In contrast, the other factors we have chosen have a weaker impact on online attention compared to the few factors just mentioned.
1 Introduction
1.1 Background and literature review
China is the birthplace of tea (Meegahakumbura et al., 2017), and tea culture has a long history. Tea is an essential traditional economic crop in China. Over the past 40 years, China’s modern tea industry has been developing rapidly, with tea plantation area, tea production, and domestic tea consumption ranking first globally. However, with “Internet plus” and globalization vision, the traditional model of the tea industry is facing unprecedented challenges. With the rapid development of network applications, “Internet plus” is becoming a catalyst for dramatic changes in various fields and industries. The development of the “Internet plus tea industry” model is a crucial way to promote regional development, improve the living standards of residents, and support rural revitalization and industrial integration and is a typical example of the transformation of the development of traditional industries and a new opportunity for the high-quality development of the tea industry.
Online attention (OA) refers to the users’ degree of concern and demand for information through online searches for relevant information (He et al., 2017), which reflects the degree of concern and request of users according to the search volume, and its data sample size is large and time-sensitive (Sun et al., 2017). Chinese users mainly use the search engines Baidu, Bing, and Google, of which Baidu accounts for approximately 72.4%, so the Baidu index, as one of the big data indicators for studying online attention, can broadly reflect the temporal and spatial characteristics of Chinese users in regard to the tea industry online attention (Abbreviated as TIOA). Producers release information to the public through online platforms. Consumers, in turn, follow, understand and access information through Internet channels to inform their decisions. Online attention on the one hand becomes an important channel for followers to obtain information and assist in decision-making. On the one hand, researchers and some industry personnel can use big data technology to analyze and mine the historical data and dynamic evolution, summarize industrial development laws, patterns and predict development trends. The study of the spatial and temporal characteristics of network attention and its influencing factors has certain guiding significance for production information management and online marketing.
Research on online attention was first started by Western scholars (Katz and Aspden, 1997; Kwan et al., 2006), mainly exploring topics such as search behavior and consumer decision-making based on Google Trends. It is found that Internet search data reflect users’ attention to a certain phenomenon or thing to a certain extent, and to a certain extent there is a correlation with real social behavior (Ginsberg et al., 2008). In recent years, global scholars have focused their research on online attention in tourism (Yang et al., 2015; Zhang et al., 2022), media (Holt et al., 2013), disease surveillance (Hu et al., 2022), hazard monitoring (Guo et al., 2022), finance and trade (Jue et al., 2017; Cheraghali et al., 2022). This research is mainly concerned with the spatiotemporal characteristics (Zhang et al., 2016), marketing strategies (Cai et al., 2016), and empirical coupling studies (Ju et al., 2017) of online attention.
Research on “Internet plus” in the tea industry has focused on the following areas. Hu’s research review provides an outlook on Internet + tea through concept definition, overview framework, and application prospects (Hu, 2015). In terms of empirical research, Shen conducted a sample of respondents through in-depth interviews in the field. It was concluded that the media and the Internet provide opportunities for the development of small and medium scale, pointing out the contribution made to the economy of the tea industry and rural revitalization (Shen and Chou, 2022). Paul developed a conceptual model of a BCT-driven tea supply chain by integrating BCT into the tea supply chain and investigated its positive impact on the tea supply chain based on the structural equation of partial least squares regression (Paul et al., 2021). Dou et al. (2021) used data from yearbooks, statistical handbooks, etc. An evaluation index system affecting the price of pu-erh tea was established and an empirical study was conducted using TOPSIS method. It was pointed out that economic development factors and Internet development level factors have a great influence on the price, so it proposed that the need to use Internet thinking is an important work for the tea industry in the future (Dou et al., 2021). Liu et al., studied an IoT-aware machine learning (ML) approach for early prediction of disease probability in agricultural environment, which plays an active role in the application of precision agriculture (Liu K. et al., 2022). Xu adopted a mixed-method approach and conducted a questionnaire survey of key practitioners, the public sector, and domestic and international tourists during fieldwork in the West Lake Longjing tea region, with the aim of analyzing the problems and proposing countermeasures for the development of tea tourism in China in the era of the experience economy (Xu, 2022). KHAN used a structured questionnaire and constructed a structural equation model. The extent of customers’ decision to purchase tea was studied in terms of social influence, shared vision, psychological evaluation and mutual trust, concluding that internet always has a crucial role in individuals’ decision to purchase, use and change their perception. (Khan et al., 2021). For concern people, information was usually obtained through TV, radio, books, and conversations, but nowadays, the Internet can be used to obtain a large amount of information easily and quickly. For researchers and practitioners, data are usually obtained through field research, in-depth interviews, volunteer experiments, statistical yearbooks, etc., which is more difficult to obtain information and the amount of data is limited. Compared with traditional information dissemination methods, Internet+ and big data have convenient and efficient features, which make up for these problems very well.
Internet data is rich in value, which helps to discover the development rules of the industry and provide information for industry decision-making. Baidu index is used to conduct statistics and analysis of internet search attention of the tea industry, with a view to providing reference for tea industry producers to better understand and grasp market demand. It has certain significance for the tea industry to formulate regionalized, seasonal and precise marketing strategies and deploy transportation resources, revealing the precursor effect and spatio-temporal characteristics of online attention, and providing scientific reference for the layout of the tea industry. The application of Internet + helps the transformation and optimization of the tea industry, a traditional industry, to upgrade.
From the research method, the current research is mostly qualitative research, and the results of quantitative research are relatively few. From the data sources, it is mostly questionnaire interviews, statistical data and yearbook data, and the data types are mostly cross-sectional data. In terms of research content, the fields involved are relatively broad, and there are fewer studies combining Internet + tea with geography. Therefore, compared with previous studies, this paper is innovative in terms of research design.
In the context of “Internet + tea industry”, there are more achievements in other fields, but there are fewer studies on the tea industry online networks, and the tea industry “Internet+" has not been studied quantitatively using big data. Studies of the tea online attention perspective based on internet big data are even rarer. Thus, As for the innovation point of this paper, a cross-disciplinary study of the spatial and spatiotemporal distribution characteristics and influencing factors of China’s tea industry online attention is conducted based on a multidisciplinary perspective and geographic spatiotemporal thinking and using internet big data. In addition, in the research of influencing factors, compared with the same type of research, qualitative analysis, GWR model and correlation analysis are mostly used, and we introduce GeoDetector to detect factors and interact with influencing factors, which are less used in the same type of research. The aim of this paper is to provide data support for the marketing decisions of the tea industry, which is helpful for accurately understanding demand so that targeted products and services can be offered and is greatly significant for the high-quality and sustainable development of the tea industry.
1.2 Study area overview
The research object of this paper is the tea industry online attention in 31 provincial administrative regions in China, excluding Hong Kong, Macao and Taiwan. In this paper, China is divided into tea production and marketing areas according to the production status of the tea industry (Xiao et al., 2018). The production and marketing area, that is, the tea production area, is mainly distributed in the latitude range of 18°N∼37°N and the longitude range of 95°E∼122°E. It is primarily classified into four tea regions, namely, the North Yangtze, South Yangtze, South China and Southwest tea regions. Warm weather, suitable ground that is acid and not alkali, and shade, not Sun, are best for growing tea, so the tea industry and the distribution of tea-producing areas and the geographical environment of tea growth are closely linked. The tea production distribution map of China was drawn based on tea production data from 2012 to 2021 (Figure 1). The spatial distribution of the tea industry reflects the tea production of each province. Provinces with high production include Hubei, Zhejiang, Yunnan, Fujian, Anhui, Jiangsu, Sichuan and Henan. These provinces are the main tea-producing areas in China and have more complete supportive industrial chains, with higher production and marketing value and a more intensive tea industry. Other provinces such as Shaanxi and Shandong also have a small amount of tea industry distribution. The above areas are the production and marketing areas of China’s tea industry, and other areas are the sales areas of China’s tea industry. In general, the distribution of China’s tea industry has a “dense south and sparse north” pattern.
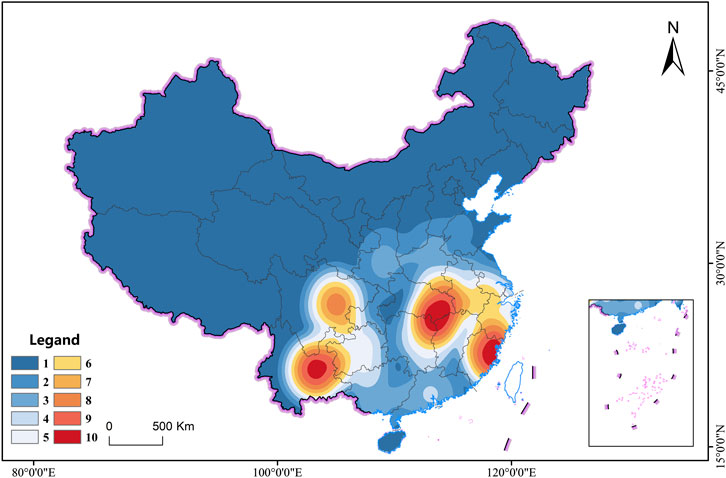
FIGURE 1. Tea-producing areas and production distribution in China.
2 Theoretical framework
The theory of limited attention is derived from psychology and was first applied to research in the field of investment. It focuses on the relationship between asset prices and investor behavior. Scholars have concluded in their research that people can only pay attention to one thing within a time period, and it is difficult to pay attention to more than one thing at the same time (Cherry, 1953). People cannot obtain and understand information in a timely manner due to limited time and energy and can only analyze and judge the information that attracts their attention. For followers and potential followers, there is a large amount of information about the tea industry on the Internet, and usually only a limited amount of attention will be directed to attractive content at a certain time. This also leads to differences in the degree of attention received by different regions at different times, which provides the basis for this paper to analyze the spatial and temporal differences in the online attention of the tea industry in China and the influencing factors.
Spatio-temporal thinking is one of the characteristics of geographic research. Temporal thinking is reflected as ephemeral research, cotemporal research and anticipatory research; spatial thinking is reflected as spatial distribution, spatial structure and spatial relationship (Yao-feng et al., 2011). The organic combination of spatial thinking and temporal thinking reflects the unity of ephemerality and co-occurrence. In this paper, the use of Spatio-temporal thinking helps to enhance the depth and scientificity of research on issues such as spatial evolution and temporal research.
As a new subdiscipline of geography, cyberspace geography is an extension of real space to virtual space, which transforms the traditional human-land relationship into a new human-land-net relationship (Gao et al., 2019). Big data technology has “6 V″ characteristics: volume, variety, velocity, veracity, value, and valence. Based on the principle of big data visualization to visualize abstract data in visual graphics, geospatial thinking is used to present the information and Spatio-temporal dynamic laws implied in the data.
Hypotheses H1. and H2 were proposed based on limited attention theory and Spatio-temporal thinking theory, and the hypotheses were verified using geospatial statistical methods, correlation analysis and geographic detectors.
H1. Chinese tea industry network attention has significant divergent characteristics in Spatio-temporal distribution.
H2. Natural factors, economic factors and social factors have a significant influence on the spatial pattern of attention.
To study the distribution characteristics of network attention, first, hypothesis H1H2 is proposed based on theories such as limited attention theory, Spatio-temporal thinking and network spatial geography theory. Second, the Spatio-temporal pattern of Chinese tea industry network attention is analyzed with the theoretical framework of the scale-pattern-process-mechanism; geospatial statistical methods, correlation analysis and geographic detectors are used to study the influencing factors to verify the hypothesis of H1H2 (Figure 2).
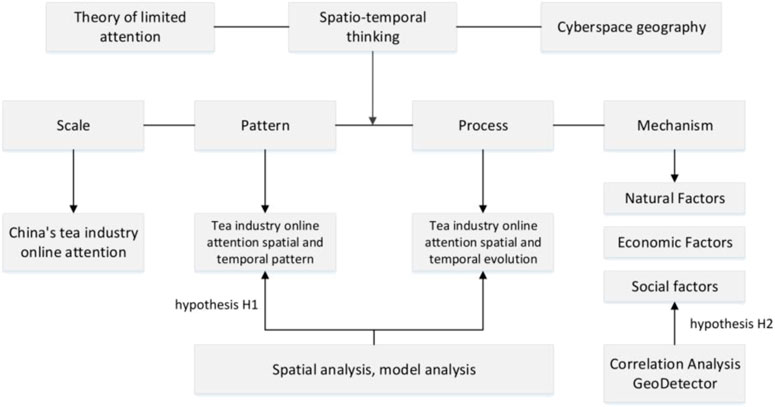
FIGURE 2. Theoretical framework.
3 Materials and methods
3.1 Data source
Since the study area of this paper is China, we used the Baidu index, which is owned by Baidu, the world’s largest Chinese search engine, with the aim of improving the accuracy of the study. For this paper, we use “cha (tea)" and “cha ye (tea leaf)" as keywords in the Baidu index platform to obtain daily, monthly and yearly data on the internet attention of 31 provincial-level administrative regions (Hong Kong, Macao and Taiwan are not included in the study because the values for these areas are too low). The Baidu index data for this term started in February 2011. For the sake of data integrity, 2012 is taken as the starting year of data, and 2021 is taken as the cutoff year of data. The climate data and socioeconomic statistics from 2012 to 2021are obtained from the statistical yearbooks, statistical bulletins and government work reports of each province (autonomous region).
3.2 Research methods
3.2.1 Interannual variation index
The interannual variation index is an index that describes the interannual variation in web attention based on the average value of web attention over many years, where Yv is the interannual variation index, Ni is the value of web attention in year i, and n represents the number of study years. The closer to 100% the value of Yv tends to be, the less the interyear variation of online attention is, and the more stable the online attention is, and vice versa. A Yv value greater than 100% indicates that the web concern of the place is higher than the overall average. A Yv value less than 100% indicates that it is lower than the overall average (Bao and Chen, 2017; Wang et al., 2022; Yan, 2023).
3.2.2 Seasonal concentration index
This index is used to reflect the concentration of the research subjects in monthly time (Zhang et al., 2016). In this index, xi is the proportion of the attention of each month in the whole year, and R is the seasonal concentration index. The more R tends to zero, the more uniform the monthly online attention distribution and the smaller the seasonal concentration; the more significant the R value is, the more dispersed the attention distribution and the greater the seasonal concentration (Ma and Long, 2017; Tang and Bao, 2018; Guan et al., 2022).
3.2.3 Geographical concentration index
This index is an indicator of the degree of geographical concentration of an economic activity (Xiao et al., 2018), reflecting the concentration or dispersion of the regional distribution of the tea industry online attention. In the formula, pj indicates the tea industry online attention in region j; p indicates the total amount of tea industry online attention, and G is the geographical concentration index, n represents the number of regions. The closer G is to 100, the more concentrated the online attention is in a particular region, and vice versa, the more dispersed it is (Frandsen, 2005; Wren, 2012).
3.2.4 Intra-weekly distribution skewness index
This index is used to measure the concentrated distribution characteristics of the tea industry online attention on the micro time scale within weeks. The calculation formula is:
In the formula, ifi is the ratio of online attention on day i to online attention in the week. If W < 0, the online attention is distributed in the early part of the week; if W > 0, the attention is mostly concentrated in the late part of the week; and if W = 0, the attention is symmetrically distributed throughout the week (Liu et al., 2010; Qiu and Zheng, 2017; Rosselló and Sansó, 2017).
3.2.5 GeoDetector
GeoDetector (GD) is a model that is used to detect spatial heterogeneity, explain the explanatory strength of the differential driving forces behind its influencing factors, and reveal factor interactions (Wang et al., 2016). In this paper, we use the factor detection and interaction detection functions to clarify the explanatory strength of each influencing factor on the attention of the tea industry online and to detect the interaction between each influencing factor indicator.
The q in the formula is the impact factor impact strength detection value, Nh is the number of cells contained in the probe element and the whole area, and N is the variance between the element layer h and the Y value of the whole area, L is the stratification (Strata) of variable Y or factor X, representing the classification or partition. q has a value range between 0 and 1 if the stratification is generated by the independent variable X; the larger the q value is, the more substantial the explanatory power of the independent variable X on the attribute Y, and vice versa (Liao et al., 2021; Liu Z. et al., 2022).
4 Results
According to the theoretical analysis framework of “scale - pattern - process - mechanism”, the research results mainly illustrate three academic issues: firstly, to explore the temporal characteristics of the Chinese tea industry online attention; secondly, to explore the evolution of the spatial distribution pattern of the Chinese tea industry online attention; thirdly, to establish the index system of the influencing factors of the tea industry online attention, and to study the influencing factors based on qualitative and quantitative analysis and geographic detectors.
4.1 Temporal distribution trends of TIOA
There are various scales for analyzing the temporal characteristics of online attention, and this study aims to analyze the temporal characteristics of online attention in detail and specifically through three time scales: annual, monthly, and intra-weekly, and to provide reference for production operators to develop seasonal and seasonal production and marketing strategies through temporal characteristics.
4.1.1 Inter-annual characteristics
The interannual variation index was used to quantify the interannual variation in tea industry online attention (Figure 3). The resulting Yv values all ranged from 50% to 120%. When Yv is closer to 100%, it indicates that the interannual variation in online attention is more stable. A Yv value greater than 100% indicates a good development trend. Yv rose from 2012 to 2017 and peaked in 2017. From 2017 to 2019, the online attention remained relatively stable at a high level, and after 2019, the online attention gradually declined. Among these years, the one with the most significant increase in online attention is 2013–2014, with a rise of 32.12%, and the largest decline is 2019–2020, with a decrease of 12.98%; the rate of decline for 2020–2021 is 2.89%, slowing down the rate of decline. Yv values after 2014 are more significant than 100%, and the overall development trend of the tea industry online degree is good. The 2017 tea industry online attention peaked, which may be related to the professional qualification certificate of tea artisan “return”, China’s first discovery of the tea tree genome, the death of tea industry titan Zhang Tianfu and other public opinion events related to the tea industry. The inter-year characteristics show us the trend of concern in different years.
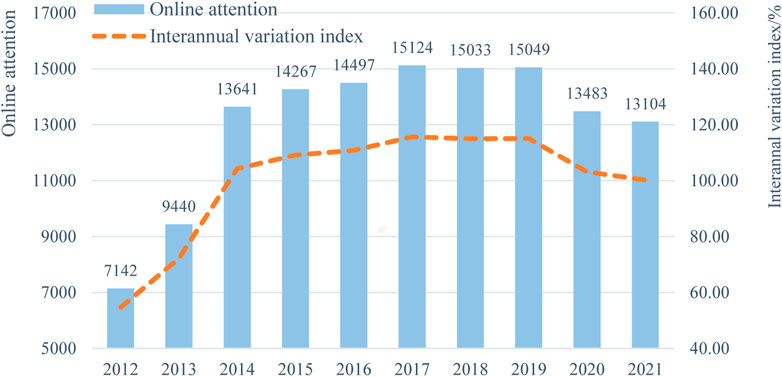
FIGURE 3. Interannual change index of China’s TIOA from 2012 to 2021.
4.1.2 Monthly characteristics
Online attention is a reflection of consumer demand and search behavior on the internet. Visualize the monthly distribution of online attention in China’s tea industry from 2012–2021, roughly showing a bimodal pattern (Figure 4). The peak periods are March to May and October every year. The rest of the months have a more even distribution of tea industry online attention, which is the trough period of attention. Overall, the tea industry online attention has more obvious seasonal characteristics, with the highest attention in spring, followed by autumn, and the lowest online attention in winter. It is initially speculated that the monthly change in tea industry online attention may be related to the climate, which will be verified later.
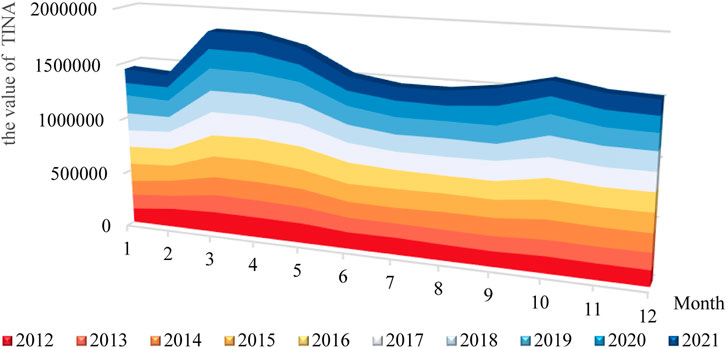
FIGURE 4. Monthly distribution characteristics of China’s TIOA from 2012 to 2021.
Mathematical model analysis was used to enhance the accuracy of the study, based on the visual presentation of monthly characteristics, the seasonal intensity index R is used to analyze the degree of temporal concentration of the Chinese tea industry online attention. A larger value of R indicates more significant monthly differences, and vice versa, it tends to be evenly distributed. As shown in Table 1, the R values of Chinese tea industry online attention are all concentrated between 8.2 and 8.3, and the seasonal concentration index is relatively stable. Among them, the R-value of 2021 is the largest, indicating that the monthly variation in tea industry online attention is the largest in 2021, and the R-value of 2017 is the smallest, which means that the monthly variation in 2017 is the smallest. This indicates that the distribution characteristics of tea industry online attention have a strong monthly concentration. Through the monthly distribution characteristics analysis, we can see a “bimodal”, indicating that the tea industry online attention in a year there are 2 periods of higher attention.
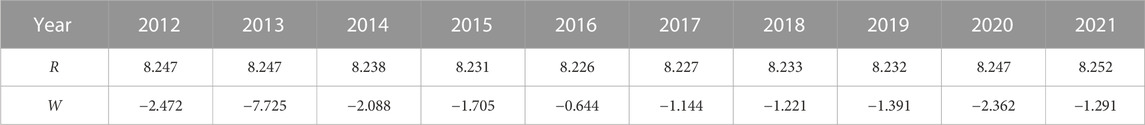
TABLE 1. Seasonal intensity index and intraweekly distribution skewness index of China’s tea industry online attention from 2012 to 2021.
4.1.3 Interday characteristics
The intraweekly distribution of tea industry online attention was further analyzed using the intraweekly distribution skewness index W. The results are shown in Table 1. The results show that W < 0 from 2012 to 2021, and the value of W does not vary significantly, indicating that the intraweekly distribution of tea industry online attention is skewed toward the front part of the week and that the degree of skewness does not vary significantly. Among them, the smallest W value in 2013 indicates that the degree of intraweek bias is the largest, and the largest W value in 2016 tends to 0, indicating that the intraweek distribution bias in that year is the weakest and tends to the average intraweek distribution.
The data superimposed on daily attention from 2012 to 2021 are superimposed, and the average value is needed to obtain the distribution of online attention within each year. Its distribution is consistent and generally manifests as the characteristics of high working days and low weekends. The highest value is Monday, and the minimum attention value is Saturday (Figure 5). Therefore, it is speculated that the distribution characteristics of the tea industry online may be related to work needs. The intra-week distribution study aims to explore whether weekends have an impact on the attention of the tea network.
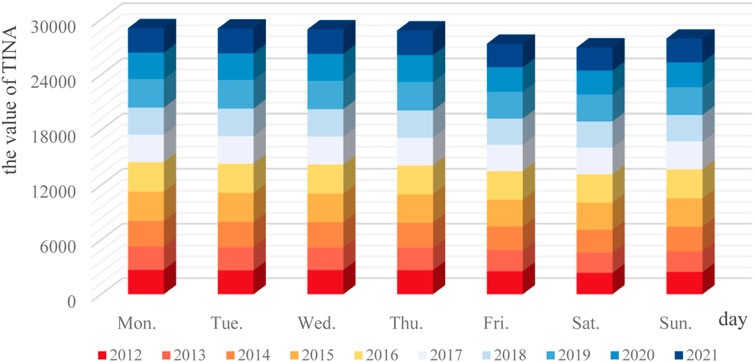
FIGURE 5. Intra-week distribution characteristics of China’s TIOA from 2012 to 2021.
4.2 Spatial distribution characteristics of TIOA
This section aims to explore, through visualization, whether there are spatially concentrated characteristics of online attention, how differences are presented, what kind of differences are presented, and how the center of gravity of spatial distribution is shifted in direction.
4.2.1 Spatial aggregation characteristics
To analyze the spatial distribution clustering characteristics of China’s TIOA, a quantitative analysis with the geographical concentration index was conducted.
First, the geographical concentration index was used to measure the spatial concentration degree of tea industry online attention. Assuming that tea industry online attention is uniformly distributed across 31 provincial administrative regions, the geographical concentration index ‾G was calculated as 17.96. As shown in Table 2, the geographical concentration index of attention from 2012 to 2021 is greater than ‾G, indicating that the degree of concentration of attention distribution is greater than the concentration when it is uniformly distributed. From 2012 to 2021, the degree of attention G first showed an overall increase and then decreased. In 2016, the geographical concentration index was the highest, indicating that the degree of attention was most concentrated at this time. Overall, the spatial distribution of online attention shows a trend of mild concentration and then slight dispersion, and there is no drastic change in the attention of each year, indicating that the spatial distribution is relatively stable. It is preliminarily speculated that the changes in the geographical concentration index after 2016 may be related to factors such as the popularity of regional internet and the rise of the concept of “health preservation” in recent years, making tea popular in more regions, so the attention tends to be scattered. The study of "Spatial aggregation characteristics" based on the geographical concentration index aims to initially determine whether the Chinese tea industry network attention is spatially clustered.

TABLE 2. 2012‒2021 China’s TIOA geographic concentration index.
4.2.2 Spatial divergence characteristics
Using ArcGIS 10.8, the spatial distribution characteristics of China’s tea industry online attention were visualized and analyzed. The values of tea industry online attention in each province in 2012, 2015, 2018 and 2021 were selected for stratified coloring, and the results are shown in Figure 6.
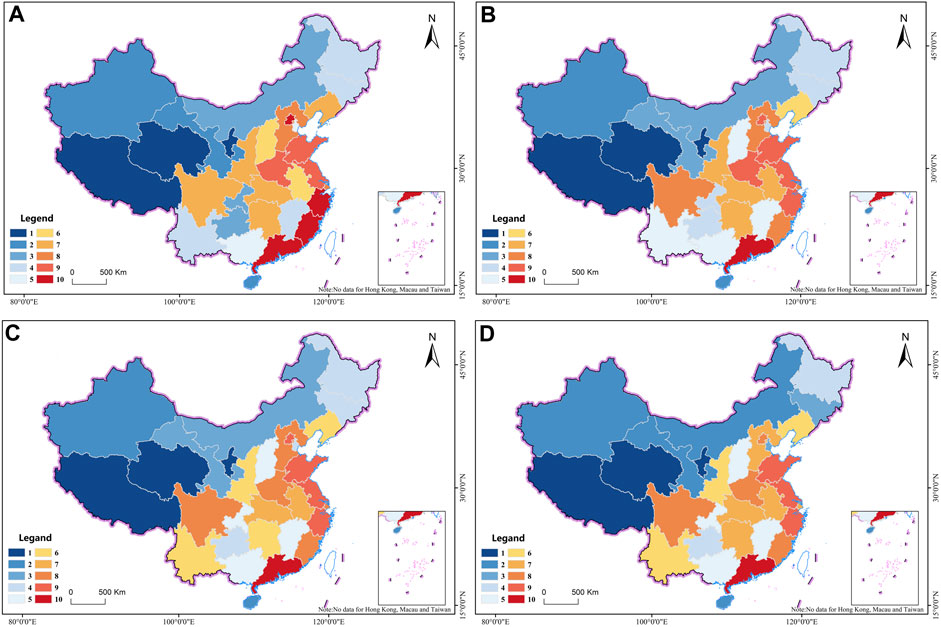
FIGURE 6. (A) is 2012’s spatial interpolation chart of China’s TIOA, (B) is 2015’s spatial interpolation chart of China’s TIOA, (C) is 2018’s spatial interpolation chart of China’s TIOA, (D) is 2021’s spatial interpolation chart of China’s TIOA.
The overall spatial distribution of the TIOA shows the characteristics of “China’s east more west less, coastal high inland low”. The north and south have high value area distributions, and the difference between the north and south is not significant. From a spatial point of view, the TIOA is the highest in Guangdong Province, and Jiangsu, Zhejiang, and Shandong also have a high degree of concern. The provinces with the lowest attention are Tibet, Qinghai and Ningxia. In addition, the online attention of Sichuan is higher than that of surrounding provinces, forming an island of high values; the online attention of Shanxi, Chongqing, Guangxi and Jiangxi is also significantly lower than that of neighboring provinces, forming a low value area. From a regional point of view, the value of online attention in each year by regional summation from high to low, in order, are as follows: East China, followed by North China, Southwest China, South China, Central China, Northwest China and Northeast China, with the overall spatial distribution of tea industry online attention around those that are more stable. It is preliminarily speculated that East China may have the highest ranking because of the degree of economic development in the region. The regional economic status and material conditions largely determine the level and volume of regional consumption, determine the development scale of the industry, and thus affect online attention. The lower TIOA in Northwest China is presumed to be related to the local dietary habits and preferences as well as the smaller population and lack of enough people to pay attention and search.
Referring to the research method of scholars (Tang and Xu, 2021). The rank order of online attention in each province and region was divided into cold spot and hot spot areas (Figure 7). The 1st-15th place of attention ranking is the hot spot area, and the 16th-31st place is the cold spot area. Meanwhile, the ranking changes are divided into growing, stable and declining. The average rank order and rank order change rate of online attention of each province and region from 2012 to 2021 were visualized, and the rank order and change rate were divided into six types. In terms of bit order characteristics, the top ten provinces in terms of online attention are Guangdong, Zhejiang, Jiangsu, Shandong, Beijing, Henan, Fujian, Sichuan, Hebei and Shanghai, in that order. In terms of the rate of change, provinces and regions with faster growth in rank order include Jiangsu, Yunnan, Anhui and Chongqing; provinces and regions with faster decline in rank order include Beijing, Fujian and Tianjin. Provinces and regions such as Guangdong, Zhejiang, Fujian and Hunan have a stable ranking while maintaining a high level of online attention. Provinces and regions such as Tibet, Qinghai, Hainan and Ningxia have lower and more stable attention. In addition, among the top 10 provinces of China’s TIOA, 7 provinces are the production areas of China’s tea industry and have better development of this industry and related industries. The spatial pattern of China’s tea industry reality has a certain coupling with the spatial pattern of online attention. Based on the Spatial Interpolation Chart and rank order change diagram of China’s tea industry online attention, the aim is to clarify which provinces have high attention and which provinces have low attention, and to analyze the overall trend of change in the attention of these provinces.
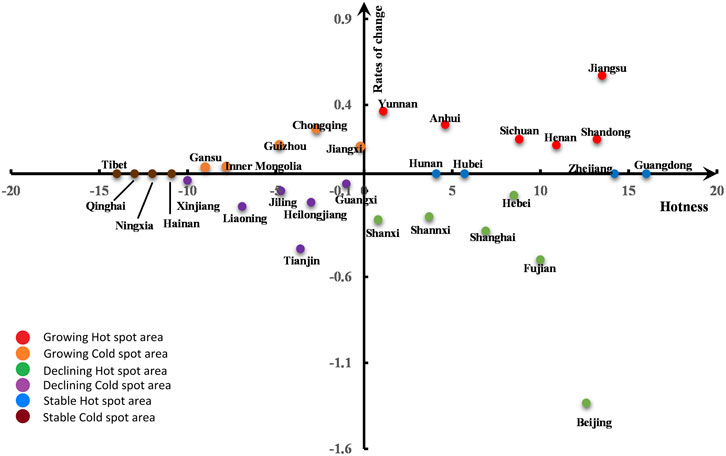
FIGURE 7. Average rank order and change rate of TIOA by provinces and regions from 2012 to 2021.
4.2.3 Spatial orientation characteristics
The standard deviation ellipse tool (SDE) and the center of gravity model tool in ArcGIS 10.8 were used to visualize and analyze the center of gravity of the distribution of TIOA, and the results are shown in Figure 8. The standard deviation ellipse distribution of China’s TIOA from 2012 to 2021 is relatively stable, and its long axis, short axis, flatness and distribution direction have not changed significantly, which indicates that the geographical space of the tea industry online attention distribution is also relatively stable. The mean center tool was used to determine that the center of gravity of the Chinese tea industry online attention is located in Henan Province. From 2012 to 2013, the center of gravity of attention was located in the Yicheng District of Henan Province, in 2020, it was located in Tongbai County, and for the rest of the years, it was located in Biyang County. The migration trajectory of the center of attention shows a shift from the northeast to the southwest, Combining the direction of change of the long axis of the SDE, i.e., the Chinese tea industry online attention tends to the southwest of China. In the study of the ranking characteristics above, among the 11 provinces that have risen in the ranking of China’s tea industry, the southwest region accounts for 4 places. Since 2012, tea production and sales, planting area and other indicators in Yunnan, Guizhou and Sichuan have grown rapidly. The reality of the rapid development of the tea industry in Southwest China in recent years is consistent with the fact that the center of gravity of China’s tea industry online attention is shifting to the southwest. Spatial orientation characteristics aims to explore which part of China’s regions are developing faster in terms of online attention from a more macro perspective, and to explore whether there is a coupling between the online attention situation and reality.
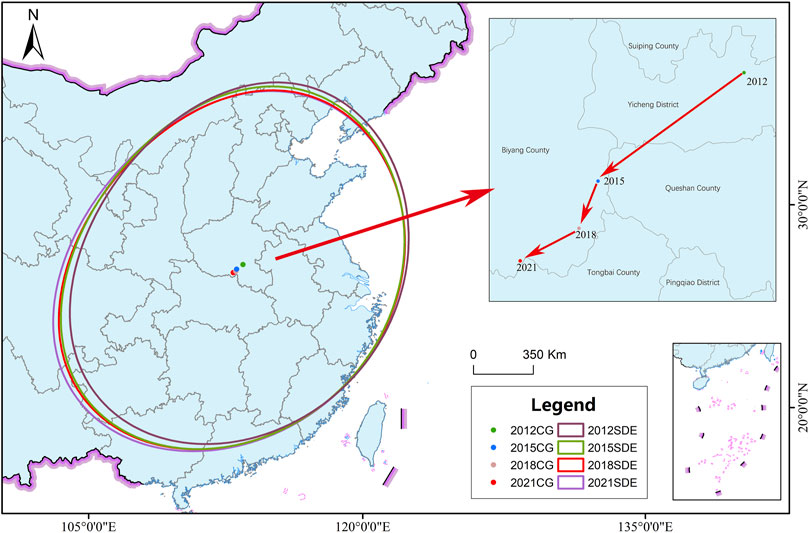
FIGURE 8. The SDE of TIOA distribution and the migration trajectory of center of gravity from 2012 to 2021.
4.3 Influencing factors of TIOA
Scholars believe that any factor that can influence the needs and access to information of followers is a factor that affects online attention (Dann, 1977; Tang and Xu, 2021). Based on the research of scholars (Zhang et al., 2016; Li et al., 2019; Mei et al., 2020; Hu et al., 2022), combined with the spatial and temporal characteristics of TIOA, this paper uses a combination of quantitative and qualitative approaches to explore the influencing factors that may affect tea industry online attention in natural, economic and social dimensions and uses a geographic detector to validate the influencing factors and measure the degree of influence of different factors.
4.3.1 Selection and analysis of influencing factors
This section aims to make a preliminary exploration of the influencing factors by correlation analysis of the influencing factors. in order to prepare for the geographic probe in the latter part.
4.3.1.1 Natural factors
Natural factors are the fundamental factors that affect attention. Tea is the material basis of the tea industry. If we only study the influencing factors of the tea industry from economic and social perspectives, we will split the natural attributes of the tea industry. The spatial distribution of tea industry online attention is closely related to the distribution of tea-producing areas and the geographical environment of tea growth. The environmental factors that affect the distribution of tea mainly include moisture, accumulated temperature, light, soil pH, drought and flood disasters. A good climate and natural environment are conducive to the growth of tea, while unsuitable natural environmental conditions make it difficult for the tea industry to develop, which in turn affects attention to the tea industry on the internet. Considering the availability of national-scale data, precipitation, temperature, sunshine and humidity were selected as indicators of natural factors affecting the attention of the TIOA (Lu et al., 2018; Shimei et al., 2018; Guo et al., 2022), and Pearson correlation analysis was conducted with the online attention of the tea industry. The results are shown in Table 3.

TABLE 3. Correlation analysis of influencing factors of TIOA.
The tea season is the best period for natural conditions and tea growth and is therefore an important factor influencing the attention of the TIOA. According to the monthly distribution characteristics of the tea industry, two peaks of attention are formed in March to April and October every year. March to April coincides with the tea season dates of spring tea every year, while October corresponds with the autumn tea season every year. Every year, when a large number of new teas are listed in the tea season, it is not only the peak of consumers’ attention to the tea industry but also the peak time for each tea production operator to obtain information, which drives up the TIOA under the joint action of production and consumer demand. The correlation analysis initially showed that natural factors are one of the factors influencing online attention.
4.3.1.2 Economic and social factors
Economic and social factors are the direct factors affecting the attention of the TIOA. Referring to the relevant literature, GDP, income, industrial base, and output were selected as the indicators to measure economic factors (Liu and Liao, 2021; Liu et al., 2023). For consumers, the economic level determines the income consumption level and purchasing power of residents. The more developed the economy is, the stronger the potential willingness to buy, and the higher the demand for information, which in turn affects online attention. Tea is a nonessential good, and tea consumption can also reflect its income consumption level to a certain extent. Second, for producers, the economic level determines the level of tea industry funds, technical base and related supporting facilities. The industrial base determines the integrity of the upstream and downstream industrial chain of the tea industry, which in turn affects the level of development of the tea industry and ultimately affects the yield and healthy development of the tea industry. Combined with the actual situation in China, the level of economic development and marketization of the eastern coastal region is higher than that of the central and western regions during the same period, which is also one of the reasons for the divergence between east and west in the presentation of tea industry network attention (Sang et al., 2023).
In terms of social factors, the factors that affect the TIOA mainly include the online penetration rate, brand density, tea price index, education level and age of the followers (Lin, 2021; Wenjing and Gang, 2021; Zhao et al., 2022; Chen et al., 2023). Since population bases and internet user bases vary among different places, it is not accurate enough to adopt the number of internet users as the influencing factor, as the online attention penetration rate can directly affect the number of users who can search for information about the tea industry through the internet.
Brand density can reflect the level of development of the tea industry and the level of awareness of property rights protection in a certain place, and this paper uses the number of “China’s top ten famous teas” and geographical indication products as the basis for measuring brand density. Third, price is a reflection of demand, which can have an impact on the production arrangement of producers and the consumption intention of residents, which in turn can convey the degree of attention to information about the tea industry. In addition, demographic characteristics are also important factors that influence the online attention of the tea industry. For example, the age and education level of the followers are important factors that affect the degree of users’ usage of the online and the way they use it. Pearson correlation analysis was conducted between the above influencing factors and tea industry online attention, and the results are shown in Table 3. Most of the factors showed moderate correlation, and the p values of all factors passed the significance test.
The correlation analysis initially showed that Economic and social factors are one of the factors influencing online attention.
4.3.1.3 Other factors
The intraweekly distribution skewness characteristics above show that weekdays and nonworking days have an impact on tea online attention. Since leisure time is difficult to quantify, on the basis of reference to scholars’ assignments (Lijun et al., 2011; Zhang et al., 2016; Wang and Meng, 2023), a social virtual index (Hi) was used to assign a value between 0 and 1 to the degree of leisure in the intraweekly distribution from 2012 to 2021. 1 is busy, and 0 is leisure. Correlation analysis was performed between Hi and the mean value of online attention from 2012 to 2021, and the Pearson correlation coefficient was 0.901 and p < 0.001, which passed the consistency test (Table 4).
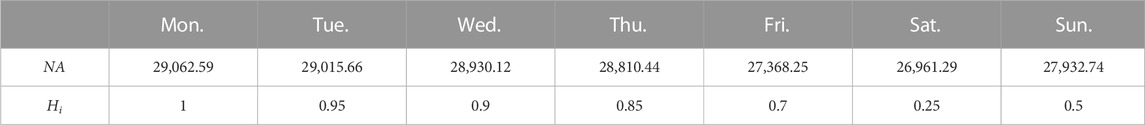
TABLE 4. Intra-week TIOA and social virtual indicators table.
The second factor is the impact of festival activities or special events on the tea industry online attention. Relevant studies by scholars show that public opinion events and events also have a significant impact on online attention (Luo et al., 2011). For example, in March 2018, on the day when the “first bamboo tea” of Mengdingshan tea was launched, the attention of the tea industry online increased significantly. Major events not only drive the development of related industries but also play a positive role in stimulating demand, and some factors are not easily quantifiable. Examples include the personal preferences, living habits, consumption habits, and regional cultural background of the followers. The formation of living habits is a product of the natural climate, economy, culture and other factors formed under long-term effects. For example, the difference between the northern and southern tea drinking habits, the difference between coastal and inland areas, the demand for tea and the demand for tea types, clear drinking and blending and other drinking methods are also different, and these individual preferences also have an impact on attention. The correlation analysis tentatively showed that other factors were one of the factors influencing network attention, but we did not include other factors in the GeoDetector because they were not easily quantifiable.
4.3.2 Validation of impact factors based on geodector
The methods that scholars have used to research influencing factors mainly include correlation analysis, multiple linear regression (Xiao et al., 2017), and GWR models (He et al., 2018) among others. GeoDetector is an effective tool for studying and analyzing driving factors. Since GeoDetector can only detect the intensity of the impact factor and cannot discern the direction of the impact, correlation analysis needs to be performed first, and then GeoDetector can be used to verify the impact factor.
4.3.2.1 Factor detection
As shown in Table 5, all factors passed the Pearson correlation analysis as well as the p-value significance test. The data mean value was processed, and the influence factor data were clustered and discretized based on the Jenks natural break method to generate type data. Finally, each influence factor was imported into the geographic detector for influence q-value measurement to analyze the strength of the explanatory power between the influence factors and attention values of Chinese tea industry online attention. A total of 3 major categories and 12 index systems were established.
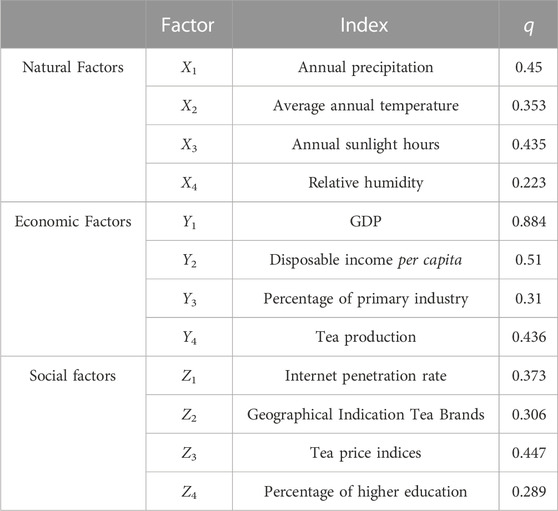
TABLE 5. TIOA influence factor detection results.
Referring to the classification method of scholars on the q-value of influencing factors (Ruan et al., 2019), the influencing factors were classified into three categories: core influencing factors (q ≥ 0.5), important influencing factors (0.4 ≤ q < 0.5) and general influencing factors (q < 0.4). Among them, Y1 (GDP) and Y2 (per capita disposable income) are core influencing factors, X3 (annual sunshine hours), Y4 (tea yield), and Z3 (tea price index) are important influencing factors, other detection factors have relatively low q values, and the relative humidity (X4) and the education level of followers (Z4) have a weak degree of influence on the attention of the TIOA. The factor detection aims to know which factors have a strong influence on the attention and which factors have a weak influence on it.
4.3.2.2 Interaction detection
Interaction detection is mainly used to analyze whether there are interactions among the factors that influence tea industry attention. The interactions are classified into the following five categories according to the relevant definitions. If q(X1∩x2)<Min (q(X1), q(X2)), the interaction shows nonlinear weakening; if Min (q(X1), q(X2))< q(X1∩X2)<Max (q(X1), q(X2)), it shows one-factor nonlinear weakening; when q(X1∩X2)>Max (q(X1), q(X2)), both show bifactor enhancement; when q(X1∩X2) = q(X1)+q(X2), it exhibits independence; and finally, when q(X1∩X2))> q(X1)+ q(X2), it exhibits nonlinear enhancement. Interaction detection aims to analyze whether the joint effect between factors presents a positive or negative effect on attention.
As shown in Table 6, the interaction types of each main influencing factor were two types of two-factor enhanced and nonlinear enhanced. Among them, there were 51 groups of the two-factor enhanced type and 27 groups of each nonlinear enhanced type. The interaction detection results show that there is an interaction between any two influencing factors, and the results all show that the interaction enhances the strength of the explanation of the TIOA. That is, the two-factor interaction is stronger than the single-factor effect strength. This indicates that the spatial and temporal characteristics of tea industry online attention are influenced not only by the natural environment, society and economy but also by the joint effect of the interaction of each factor that finally forms the spatial and temporal distribution pattern of TIOA.

TABLE 6. TIOA influence factor interaction detection results.
5 Discussion
At present, some progress has been made in the research on online attention, but there are few research results with a certain industry or a certain product as the research object, and it does not involve the tea industry for the time being, so further research is needed. In addition, due to the dual natural and social attributes of the tea industry, this paper differs from those of scholars in terms of influencing factors regarding online attention, so the selection of indicators has been innovated. Unlike most scholars who only analyze 1 year or individual years, we focus on Chinese tea industry online attention from 2012 to 2021 as the data source, which has a longer time span and helps to better reveal the spatial and temporal divergence pattern of tea industry online attention. This paper takes internet big data as the data source, which enriches the perspective of tea industry research from geographic spatiotemporal thinking and provides a useful reference for the high-quality development of the tea industry under the perspective of “Internet+".
Since natural factors are the innate and limiting factors affecting the attention of the tea industry network, natural conditions such as climate, precipitation are difficult to change, therefore the optimization measures in this study are mainly from economic and social factors. As agriculture, disorderly development must be avoided and attention needs to be paid to the ecological harmony between human and nature. In the context of the “Internet +" era, the following suggestions are proposed based on the optimization of China’s TIOA and the sustainable and high-quality development of the tea industry:
Economic factors are important elements that influence the attention of the tea industry network. We propose suggested measures based on Y1-Y4, GDP, disposable income, share of primary production, and tea production from the perspective of product, culture, and industry. (1) First, for the product side, the technological content of tea production should be improved, the product system should be further developed, and product quality should be optimized to create the core competitiveness of the tea industry. (2) Second, for the cultural aspect, the tea industry is a traditional industry with thousands of years of heritage and should involve the active inheritance and promotion of traditional tea culture and the enhancement of the cultural connotation of products in this industry. (3) For industrial integration, the new “Internet + tea” and “tea + tourism” business models should be actively promoted. Relying on internet technology, through the Internet + agricultural e-commerce model, there is a direct connection between consumers and tea industry business entities, extending the tea industry chain, broadening the distribution channels, and promoting the transformation of traditional agricultural industries to modern agriculture. Combined with tea resources and seasonal characteristics, local conditions are used to create a tea tourism area and develop tea tourism, study, experience and other forms to achieve the interactive development of the tea industry and tourism. (4) For the spatial and temporal characteristics of online attention and Price Index (Z3), a differentiated and accurate marketing strategy should first be developed. Spatially, for the lower attention to the northwest and northern regions, the tea industry market should be actively explored, new channels should be developed, potential markets should be targeted, etc. At the same time, the eastern and central advantageous markets should be consolidated, and products and services should be improved; in terms of time, the tea industry online attention has strong seasonal characteristics. Therefore, off-season marketing, differentiated marketing, anti-seasonal promotion and other measures can be carried out; in terms of population characteristics, as preferences for tea vary across different regions and age groups, product differentiation and precision strategies should be implemented to provide diversified and multiple price options. At the same time, for the trend of tea drinking younger, traditional marketing methods should also be adjusted. (5) For the spatial and temporal characteristics and geographical indication tea brand (Z2), followed by the strengthening of publicity efforts. In the context of the Internet +, a combination of online and offline marketing should be utilized. For online publicity, the internet and new media platforms should be actively employed for publicity and promotion to enrich the channels of information understanding. Offline publicity can be organized through the tea industry fair, “National Tea Day” and other high-quality activities to promote the local tea industry and representative industry brands to enhance the visibility of the industry. At the meantime, it should actively declare geographical indication products and do a good job of brand protection. It also improves customer satisfaction by increasing brand reputation and loyalty, and in the long term (Gong et al., 2021). (6) Internet penetration (Z1) is an important indicator that affects online attention, based on this, the internet can be used to build a comprehensive information service platform for the tea industry. In the context of Internet +, the internet has become an important platform for information elements. First, the construction of web infrastructure should be improved, and internet platforms should be well built and maintained. The second step is to build a wisdom platform for the tea industry based on internet big data. Big data, cloud computing, the Internet of Things and other technologies can be used to support tea industry production and processing, sales promotion of agricultural products, consumer shopping and other preproduction and postproduction digital information sharing and linkage to provide producers and consumers with intelligent services. At the same time, agricultural big data application services should be put to good use. This includes using agricultural environment big data, production and marketing big data, etc., to provide scientific and efficient technical support for decision-making and high-quality development in the tea industry. (7) At the government level, the relevant departments should do a top design, while giving production operators to develop “Internet + tea industry” funding and policy support (Cui and Xu, 2022). In addition, the proportion of higher education (Z4) is also an important factor affecting the online attention, and “Internet +" should be used to train highly qualified personnel in modern agriculture and improve the literacy level of practitioners through continuing education. At the same time to strengthen cross-regional collaboration in the tea industry, the integration of the advantages of local resources, to achieve resource sharing, complementary advantages, mutual benefit and win-win.
This paper has some shortcomings. Due to the use of different keywords and different search engines, the presented results are not the same. In addition, the Baidu index does not comprehensively reflect the demographic attributes of users, so future research can integrate online and offline data in terms of data sources to improve the completeness and reliability of the data. In addition, the factors influencing online attention are complex and multifaceted, and this paper is not sufficiently comprehensive in selecting the index system. In terms of research scale, further small-scale, microlevel, and refined research on tea industry online attention, as well as comparative research at different regional levels, can be carried out in the future to enrich the depth and breadth of research.
6 Conclusion
(1) In terms of temporal characteristics, the interannual characteristics of China’s tea industry online attention from 2012 to 2021 show a trend of rapid growth, a high and stable period, and then a slow decline. In 2017, tea industry online attention reached its highest peak. In terms of monthly characteristics, the seasonal intensity index of attention is 8.2, with a strong monthly concentration. March to April and October in each year are the two peaks of TIOA, which coincides with the tea seasons of spring tea and autumn tea. In terms of intraweekly distribution, the intraweekly distribution skewness index is negative, indicating that the online attention is mainly concentrated in the first part of the week, i.e., weekdays, and the TIOA is significantly lower on Fridays and weekends.
(2) In terms of spatial characteristics, the geographic concentration index G of online attention from 2012 to 2021 is approximately 19, and the overall value is stable, showing a trend of mild concentration first and then mild dispersion. The interprovincial differences in online attention are relatively obvious. The migration trajectory of the center of attention shows a shift from the northeast to the southwest, and the online attention of China’s tea industry has a tendency to tilt toward the southwest.
(3) In terms of influencing factors, the core factors of TIOA are economic development and residents’ income. The natural environmental conditions of tea growth, leisure time of followers and tea price level are important factors affecting attention but are less influential. Each factor presents nonlinear enhancement and dual-factor enhancement, and the dual-factor interaction is stronger than the single-factor effect. Under the joint action of each factor, the spatiotemporal distribution pattern of TIOA is finally formed.
Data availability statement
The raw data supporting the conclusion of this article will be made available by the authors, without undue reservation.
Author contributions
Conceptualization, RS. Formal analysis, RS. Methodology, RS. and JX. Investigation, RS. and ZS. Writing—original draft preparation, RS. Writing—review and editing, JX and ZS. Visualization, RS. Supervision, JX. Funding acquisition, JX and ZS. All authors contributed to the article and approved the submitted version.
Funding
This research was supported by the Key Project of Zhejiang Province Philosophy and Social Science Planning (grant No.17NDJC040Z), the Social Science Planning Project of Qinghai Province (grant No. 19027), the Social Science Planning Project of Qinghai Province (grant No. 2022ZCY033).
Conflict of interest
The authors declare that the research was conducted in the absence of any commercial or financial relationships that could be construed as a potential conflict of interest.
Publisher’s note
All claims expressed in this article are solely those of the authors and do not necessarily represent those of their affiliated organizations, or those of the publisher, the editors and the reviewers. Any product that may be evaluated in this article, or claim that may be made by its manufacturer, is not guaranteed or endorsed by the publisher.
References
Bao, F. H., and Chen, Y. (2017). Research on the spatial-temporal distribution characteristics of China’s outbound tourism in the past 10 years. World Reg. Stud. 26, 127–139. doi:10.3969/j.issn.1004-9479.2017.02.014
Cai, W. M., Peng, J., and Qin, J. J. (2016). A study on national network attention heat matrix and promotion strategy in shaoshan. Tour. Sci. 30, 61–72. doi:10.16323/j.cnki.lykx.2016.04.005
Chen, J., Sun, H., Wu, Y. C., Chou, T. Y., and Cheng, Y. C. (2023). Network attention and carbon dioxide emission performance of agricultural enterprises: Empirical evidence from China’s baidu search index. Front. Environ. Sci. 11, 198–205. doi:10.1016/j.lungcan.2023.02.015
Cheraghali, H., Igeh, S. A., Lin, K. H., Molnar, P., and Wijerathne, I. (2022). Online attention and mutual fund performance: Evidence from Norway. Finance Res. Lett. 49, 103139. doi:10.1016/j.frl.2022.103139
Cherry, E. C. (1953). Some experiments on the recognition of speech, with one and with two ears. J. Acoust. Soc. Am. 25, 975–979. doi:10.1121/1.1907229
Cui, X., Xu, B., and Razzaq, A. (2022). Can application of artificial intelligence in enterprises promote the corporate governance? Front. Environ. Sci. 980. doi:10.3389/fenvs.2022.944467
Dann, G. M. (1977). Anomie, ego-enhancement and tourism. Ann. Tour. Res. 4, 184–194. doi:10.1016/0160-7383(77)90037-8
Dou, Z. W., Ji, M. X., Shao, Y. N., and Wang, M. (2021). Research on the price impact mechanism of Pu'er tea under Internet + environment. Acta Agric. Scand. Sect. B-Soil Plant Sci. 71, 17–27. doi:10.1080/09064710.2020.1840619
Frandsen, T. F. (2005). Geographical concentration - the case of economics journals. Scientometrics 63, 69–83. doi:10.1007/s11192-005-0204-4
Gao, C., Guo, Q., Jiang, D., Wang, Z., Fang, C., and Hao, M. (2019). Theoretical basis and technical methods of cyberspace geography. J. Geogr. Sci. 29, 1949–1964. doi:10.1007/s11442-019-1698-7
Ginsberg, J., Mohebbi, M. H., Patel, R. S., Brammer, L., Smolinski, M. S., and Brilliant, L. (2008). Detecting influenza epidemics using search engine query data. Nature 457, 1012–1014. doi:10.1038/nature07634
Gong, X., Razzaq, A., and Wang, W. (2021). “More haste, less speed: How update frequency of mobile apps influences consumer interest,” in Journal of theoretical and applied electronic commerce research.
Guan, H., Li, W., Zhao, J., and Fan, Y. (2022). Implications of tourism seasonal intensity for the development of ice and snow tourism in the south. Tour. Manag. Technol. Econ. 5, 6–10.
Guo, X. J., Yao, H. L., Chen, X. P., and Li, Y. (2022). A study on the online attention of emergency events of torrential rain in shanxi and henan. Water 14, 2183. doi:10.3390/w14142183
He, X. Q., Liu, Y., and Wu, F. M. (2017). Analysis on temporal and spatial characteristics of network attention of hot spring tourism based on baidu index. Areal Res. Dev. 36, 103–108. doi:10.3969/j.issn.1003-2363.2017.01.019
He, C., Halik, W., and Zhu, Y. (2018). Spatial-temporal differences of xinjiang tourism attention and its influencing factors. J. Nat. Sci. Hunan Normal Univ. 41, 16–24. doi:10.7612/j.issn.2096-5281.2018.03.003
Holt, K., Shehata, A., Stromback, J., and Ljungberg, E. (2013). Age and the effects of news media attention and social media use on political interest and participation: Do social media function as leveller? Eur. J. Commun. 28, 19–34. doi:10.1177/0267323112465369
Hu, F., Qiu, L. P., Xia, W., Liu, C. F., Xi, X., Zhao, S., et al. (2022). Spatiotemporal evolution of online attention to vaccines since 2011: An empirical study in China. Front. Public Health 10, 949482. doi:10.3389/fpubh.2022.949482
Ju, S. L., Tao, Z. M., and Hang, Y. L. (2017). Coupling coordination degree between rural scenic tourist network attention and gravity in nanjing city. Econ. Geogr. 37, 220–228. doi:10.15957/j.cnki.jjdl.2017.11.027
Jue, W., Lanyi, H. U., and Chen, Q. I. (2017). Prediction of bulk commodities based on internet concerns. Syst. Engineer. Theory Pract. 37, 1163–1171.
Katz, J., and Aspden, P. (1997). Motivations for and barriers to internet usage: Results of a national public opinion survey. Internet Res. Electron. Netw. Appl. Policy 7, 170–188. doi:10.1108/10662249710171814
Khan, T. H., Yuzhen, D., Ali, S., and Ariyesti, F. R. (2021). Tea culture and industry: Customer tea buying decision-making power shaped by social capital in the presence of mutual trust. J. Public Aff. 21, e2127. doi:10.1002/pa.2127
Kwan, I., Fong, J., and Wong, H. K. (2006). An e-customer behavior model with online analytical mining for internet marketing planning. Decis. Support Syst. 41, 189–204. doi:10.1016/j.dss.2004.11.012
Li, H., Li, D., Dong, X., and Xu, N. (2019). Spatial patterns of 5a-level tourist attractions and their network attention degrees in China. J. Arid. Land Resour. Environ. 33, 178–184. doi:10.13448/j.cnki.jalre.2019.305
Liao, J. J., Yu, C. Y., Feng, Z., Zhao, H. F., Wu, K. N., and Ma, X. (2021). Spatial differentiation characteristics and driving factors of agricultural eco-efficiency in Chinese provinces from the perspective of ecosystem services. J. Clean. Prod. 288, 125466. doi:10.1016/j.jclepro.2020.125466
Lijun, M., Gennian, S., and Yunma, H. (2011). A correlative analysis on the relationship between domestic tourists and network attention. Econ. Geogr. 31, 680–685. doi:10.15957/j.cnki.jjdl.2011.04.026
Lin, M. (2021). Influencing factors of social service satisfaction of the elderly under the background of internet attention. Complexity 2021, 1–10. doi:10.1155/2021/9985280
Liu, Y. W., and Liao, W. (2021). Spatial characteristics of the tourism flows in China: A study based on the baidu index. Isprs Int. J. Geo-Inf. 10, 378. doi:10.3390/ijgi10060378
Liu, Z., Li, H., Shi, C., Wang, X., and Zhang, H. (2010). The response of short term tourist flows to spatial structure of regional tourism: A case study of tourist flows of yunnan in golden weeks. Acta Geogr. Sin. 65, 1624–1632.
Liu, Y., Chen, Y., and Han, F. (2023). Exploring temporal and spatial structure of tourism market through a big data approach: Whether geographic distance still matters? J. Hosp. Tour. Manag. 55, 292–299. doi:10.1016/j.jhtm.2023.03.017
Liu, K., Xue, Y. T., Lan, Y., and Fu, Y. X. (2022). Agricultural water utilization efficiency in China: Evaluation, spatial differences, and related factors. Water 14, 684. doi:10.3390/w14050684
Liu, Z., Bashir, R. N., Iqbal, S., Shahid, M. M. A., Tausif, M., and Umer, Q. (2022). Internet of things (iot) and machine learning model of plant disease prediction–blister blight for tea plant. Ieee Access 10, 44934–44944. doi:10.1109/access.2022.3169147
Lu, L., Yi-ran, W., Yan, Y. U., Shu-yu, Y. I., Shi-mei, P., and Chen, Z. (2018). Optimal data partitioning, multispecies coalescent and Bayesian concordance analyses resolve early divergences of the grape family (Vitaceae). J. Southwest China Normal Univ. Nat. Sci. Ed. 43, 57–77. doi:10.1111/cla.12191
Luo, Q., Pang, J., and Jin, W. (2011). An empirical study on the economic impact of the events with input-output model: A case study of canton fair, China. Acta Geogr. Sin. 4, 57–73. doi:10.11821/xb201104006
Ma, L. J., and Long, Y. (2017). Spatiotemporal characteristics of residents tourism demand for typical scenic spots in hunan province based on network attention. Econ. Geogr. 37, 201–208. doi:10.15957/j.cnki.jjdl.2017.02.027
Meegahakumbura, M. K., Wambulwa, M. C., Li, M. M., Thapa, K. K., Sun, Y. S., Möller, M., et al. (2017). Domestication origin and breeding history of the tea plant (camellia sinensis) in China and India based on nuclear microsatellites and cpDNA sequence data. Front. Plant Sci. 8, 2270. doi:10.3389/fpls.2017.02270
Mei, D., Xiu, C., and Feng, X. (2020). Analysis on the evolution characteristics and driving factors of urban information network structure in China. World reg. Stud 29, 717–727. doi:10.3969/j.issn.1004-9479.2020.04.2019284
Paul, T., Mondal, S., Islam, N., and Rakshit, S. (2021). The impact of blockchain technology on the tea supply chain and its sustainable performance. Technol. Forecast. Soc. Change 173, 121163. doi:10.1016/j.techfore.2021.121163
Qiu, Q., and Zheng, T. (2017). Study on the spatial-temporal distribution of tourist flow in the scenic spots: Taking golden weeks as examples. J. Tour. Hosp. 6. doi:10.4172/2167-0269.1000330
Rosselló, J., and Sansó, A. (2017). Yearly, monthly and weekly seasonality of tourism demand: A decomposition analysis. Tour. Manag. 60, 379–389. doi:10.1016/j.tourman.2016.12.019
Ruan, W., Zhang, S., Li, Y., and Zheng, X. (2019). Spatiotemporal differentiation and influencing factors of Chinese's tourism demand to Thailand. Tour. Trib. 34, 76–89. doi:10.19765/j.cnki.1002-5006.2019.05.010
Sang, X., Luo, X., Razzaq, A., Huang, Y., and Erfanian, S. (2023). Can agricultural mechanization services narrow the income gap in rural China? Heliyon 9, e13367. doi:10.1016/j.heliyon.2023.e13367
Shen, J., and Chou, R. (2022). Rural revitalization of xiamei: The development experiences of integrating tea tourism with ancient village preservation. J. Rural Stud. 90, 42–52. doi:10.1016/j.jrurstud.2022.01.006
Shimei, P., Yi, S., Wang, Y., Sun, S., and Jiang, H. (2018). Climate change and its impacts on tourism in yantai. J. Agric. 8, 60.
Sun, Y., Zhang, H., Liu, P. X., and Zhang, J. (2017). Forecast of tourism flow volume of tourist attraction based on degree of tourist attention of travel network: A case study of baidu index of different clients. Hum. Geogr. 32, 152–160.
Tang, H. J., and Bao, J. G. (2018). Spatio-temporal characteristics and influencing factors of tourists from main inbound tourist source for mainland China. Econ. Geogr. 38, 222–230.
Tang, H., and Xu, C. X. (2021). Spatio-temporal evolution and influencing factors of Chinese red tourism classic scenic spots network attention. J. Nat. Resour. 36, 1792–1810. doi:10.31497/zrzyxb.20210712
Wang, G., and Meng, Y. (2023). The clustering characteristics and driving mechanisms of tourist preference for 5a scenic spots from the dynamic spatio-temporal perspective: A case of jiangsu in eastern coastal area of China. Sustainability 15, 1626. doi:10.3390/su15021626
Wang, J., Zhang, T., and Fu, B. (2016). A measure of spatial stratified heterogeneity. Ecol. Indic. 67, 250–256. doi:10.1016/j.ecolind.2016.02.052
Wang, S., Fang, Z., and Wu, D. (2022). Internet of things-enabled tourism economic data analysis and supply chain modeling. Technol. Econ. Dev. Econ., 1–18. doi:10.3846/tede.2022.17120
Wenjing, Z., and Gang, Z. (2021). “Temporal and spatial attention network model based evolution model for bulk commodity price fluctuation risk,” in 2021 IEEE International Conference on Big Data (Big Data) (IEEE).
Wren, C. (2012). Geographic concentration and the temporal scope of agglomeration economies: An index decomposition. Regional Sci. Urban Econ. 42, 681–690. doi:10.1016/j.regsciurbeco.2012.03.004
Xiao, W. U., Shaozhi, C., and Rong, Z. (2017). Analysis of impact factors on forest park passenger flow based on baidu index. For. Resour. Wanagement, 27–30. doi:10.13466/j.cnki.lyzygl.2017.01.006
Xiao, Z., Huang, X., Zang, Z., and Yang, H. (2018). Spatio-temporal variation and the driving forces of tea production in China over the last 30 years. J. Geogr. Sci. 28, 275–290. doi:10.1007/s11442-018-1472-2
Xu, J. (2022). Tea tourism development in China entering experience economy era under the strategic background of rural revitalization: A case study of West Lake longjing tea area and damushan tea garden area in zhejiang province. Universitat de les Illes Balears.
Yan, H. (2023). Study on the evolution of the temporal and spatial structure of inbound tourist market in shaanxi province. Acad. J. Manag. Soc. Sci. 2, 36–42. doi:10.54097/ajmss.v2i2.7530
Yang, X., Bing, P., Evans, J. A., and Lv, B. (2015). Forecasting Chinese tourist volume with search engine data. Tour. Manag. 46, 386–397. doi:10.1016/j.tourman.2014.07.019
Yao-feng, M. A., Jun, G., and Chuang-xin, L. I. (2011). On tourism research and application of time-space-thinking principle and its enlightenment. Tour. Tribune/Lvyou Xuekan 26.
Zhang, X. M., Cheng, S. W., Liu, X. L., Wang, Q., and Zhao-Hong, L. I. (2016). Spatial-temporal characteristics and influencing factors of network attention to ancient city destination: A case of pingyao. Econ. Geogr. 36, 196–202.
Zhang, Y., Jin, X., Wang, Y. W., Liu, R. T., and Jing, Y. (2022). Characterizing spatial-temporal variation of cultural tourism internet attention in Western triangle economic zone, China. Land 11, 2221. doi:10.3390/land11122221
Keywords: internet plus, tea industry, online attention, influencing factors, GeoDetector, baidu index, spatiotemporal trends
Citation: Shu R, Xiao J and Su Z (2023) Spatiotemporal trends and factors influencing online attention for China’s tea industry. Front. Environ. Sci. 11:1206705. doi: 10.3389/fenvs.2023.1206705
Received: 16 April 2023; Accepted: 31 May 2023;
Published: 13 June 2023.
Edited by:
Salvador García-Ayllón Veintimilla, Technical University of cartagena, SpainReviewed by:
Zheng Shiyong, Guilin University of Electronic Technology, ChinaAmar Razzaq, Huanggang Normal University, China
Copyright © 2023 Shu, Xiao and Su. This is an open-access article distributed under the terms of the Creative Commons Attribution License (CC BY). The use, distribution or reproduction in other forums is permitted, provided the original author(s) and the copyright owner(s) are credited and that the original publication in this journal is cited, in accordance with accepted academic practice. No use, distribution or reproduction is permitted which does not comply with these terms.
*Correspondence: Jingyi Xiao, eGlhb2ppbmd5aUBxaG51LmVkdS5jbg==; Zhucheng Su, MjAwNzAxNzNAemFmdS5lZHUuY24=