 Patrik Nagy1
 Katarzyna Kubiak-Wójcicka
 Daniela Káposztásová
 Martina Zeleňákova
- 1Department of Environmental Engineering, Faculty of Civil Engineering, Institute of Environmental Engineering, Technical University of Kosice, Kosice, Slovakia
- 2Department of Hydrology and Water Management, Faculty of Earth Sciences and Spatial Management, Nicolaus Copernicus University, Toruń, Poland
- 3Department of Building Engineering, Faculty of Civil Engineering, Institute of Architectural Engineering, Technical University of Kosice, Kosice, Slovakia
The aim of the study is to analyse the monthly and annual variability of the flow of the Hornad River in the years 1973–2020. The research showed that an upward trend in annual air temperature, precipitation and flows was recorded throughout the catchment area. The analysis of the annual Richard-Baker Index (RBI) and flow variability (Cv) showed a clear downward trend in the variability indexes Cv and Richard-Baker Index in the analyzed multi-year period only at the Kysak station, which is located downstream of the dam. No such changes were observed at the remaining Margecany and Spisska Nova Ves stations, which are located above the dam. The analysis of average monthly Richard-Baker Index values over the course showed greater variation. Between 1973 and 2020, the Richard-Baker Index values ranged from 0 to 0.49 at the Spisska Nova Ves and Margecany hydrological stations, while at the Kysak station, the Richard-Baker Index ranged from 0 to 0.57, indicating large changes in short-term flows. The maximum Richard-Baker Index value occurred in June 1973 (0.57) at the Kysak station. At the hydrological stations above the Ruzin reservoir, the maximum RBI values were recorded in as well as in July 2008 (0.49) at the Margecany station (0.49) and at the Spisska Nova Ves station (0.48), which was the result of very high precipitation (above 170 mm during a month). The values of the Richard-Baker Index at the Kysak station depended on the possibility of water retention in the Ružín I and Ružín II reservoirs and flow control below the dam.
1 Introduction
Research conducted around the world shows that extreme hydrological phenomena, i.e., floods and low flows, are appearing more and more often, and the main reason is climate change (Panagoulia and Dimonu, 1997; The Intergovernmental Panel on Climate Change, 2013; Tabari, 2020; Kubiak-Wójcicka et al., 2021; Huang and Swain, 2022). In addition to climatic factors, changes in flow in rivers may be caused by many other factors, such as the regulation of flow through dams, land use and water abstraction for the needs of the population and the economy (Hanel et al., 2012; Hall et al., 2014; Bisselink et al., 2018; Guzha et al., 2018; Kubiak-Wójcicka and Machula, 2020; Chalise et al., 2021; Gessesse et al., 2021; Papadaki and Dimitriou, 2021; Tram et al., 2021). Thus, the flow rate in rivers is the product of many variables that include complex physical geographic features as well as the socio-geographical development of the area. A comprehensive review of how a change in the natural flow regime due to hydroelectricity can affect various aspects of the river ecosystem is presented by Kuriqi et al. (2021). Therefore, there is a need for studies that will allow river runoff, in particular its variability in time and space, to be understood. This issue is extremely important for the sustainable management of water resources and the establishment of strategic river basin management plans (Croke and Jakeman, 2001). This problem particularly affects people living in mountainous areas located in close proximity to rivers, which are particularly exposed to changing hydrological conditions. The need to know the flow regime has led to the determination of over 200 indicators that are used to assess the flow variability. The most common characteristics of the hydrological regime of rivers include the time and frequency of extreme events, such as floods and droughts, in daily, monthly and annual terms (Oueslati et al., 2010). These indicators are statistically based to help select from a large number of different hydrological indices that will represent the main aspects of the flow regime (Olden and Poff, 2003; Assani et al., 2006). Existing research methods for determining the hydrological regime are most often based on the analysis of measured data or, in the absence of such a measurement base, on simulation methods (Gao et al., 2009; Pardo-Loaiza et al., 2021). The selection of the appropriate method often depends on the available hydrological data and the possibility of combining them with other indicators, e.g., water quality (Onwuka et al., 2021). The use of simpler and more cost-effective models results in a reduction of the time necessary for practical applications, also due to the typical low availability of some data (Pumo et al., 2018).
One of the most commonly used metrics to quantify flashiness in a catchment is the Richard-Baker-RBI flashiness Index. The indicator is dimensionless and allows the comparison of results between different rivers. Research by Baker et al. (2004) for 1144 watershed in the United States showed that the size of the RBI index depends on the size of the watershed, i.e., the smaller watersheds show greater flashiness, while the larger watersheds show greater stability of the flow regime.
Studies by other researchers have shown that the variability of the RBI depends on other characteristics of the catchment, including land use. In addition, the strength and direction of the relationship with the catchment area varied depending on the hydroclimatic regions (Holko et al., 2011; Mogollón et al., 2016). Flow regulating elements (e.g., best management practices) and artificial reservoirs influenced the variation in the RBI (Rosburg et al., 2017). The RBI is extremely useful as it provides information on the impact of climate intensification on the dynamics of river systems. River flashiness is a measure of how quickly and how high the flow rises and falls in response to the catchment input (Gannon et al., 2022). It is particularly visible in the area of small mountain catchments, which are sensitive to changes in meteorological conditions. Therefore, the Hornad river basin was adopted for the analysis, for which no analyzes were carried out based on the river flood index. The novelty of this work is the use of simple hydrological indicators in combination with meteorological data, which have not been jointly analyzed so far.
The aim of this study was to analyse the long-term changes in flows of the Hornad River (Slovakia) at three water gauge stations: Kysak, Margecany and Spisska Nova Ves during the hydrological years 1973–2020. The degree of monthly variability of flows was carried out based on the Cv flow variability index and the flashiness index (RBI), which characterises the short duration of the phenomenon. The analysis of flows was supplemented by the meteorological conditions, such as precipitation and air temperature, that prevailed in each catchment. Trends and differences in flows, as well as precipitation and air temperature, were investigated using the Mann-Kendall test for data from the hydrological years 1973–2020. This study will allow for the assessment of the adopted water management strategies in the Hornad river basin based on changing meteorological conditions. This cutting-edge research is expected to help improve policy and decision-making by policymakers in the future.
2 Materials and methods
2.1 Study area
The study area covers the mountain basin of the Hornad River in eastern Slovakia (Figure 1). There are 3 hydrological stations on the river: Spisska Nova Ves, Margecany and Kysak. Daily flow observations are made at these stations.
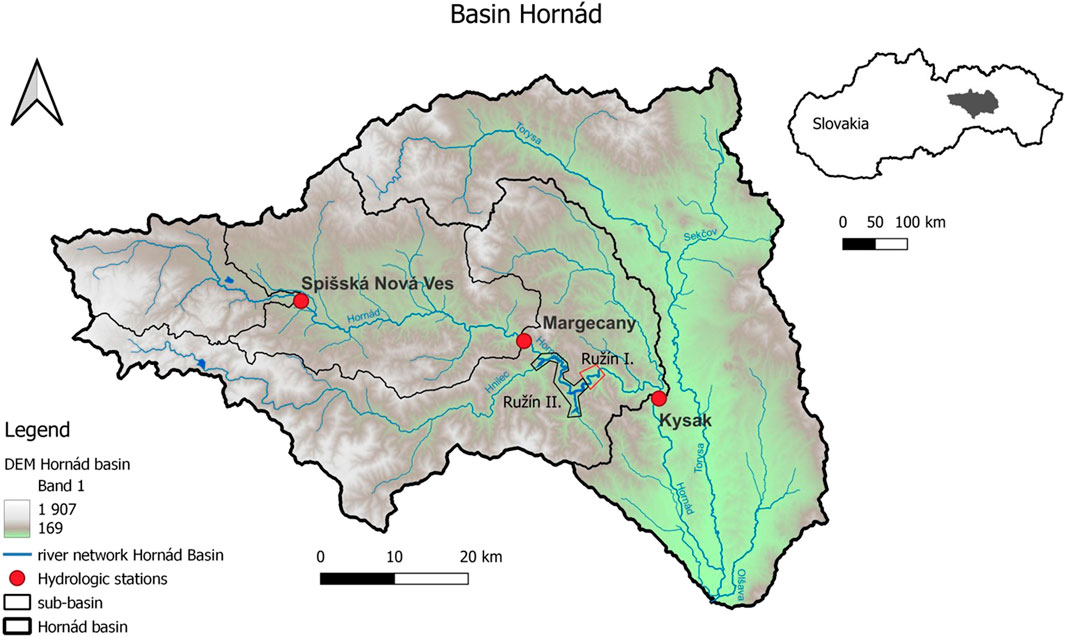
FIGURE 1. Study area.
The catchment area of the Hornad river to the Kysak hydrological station is 2337.01 km2 and constitutes 55% of the total catchment area of the Hornad river. The river catch-ment is located at an altitude of 1549.9.7 m above sea level. Up to 235.1 m above sea level (Table 1).
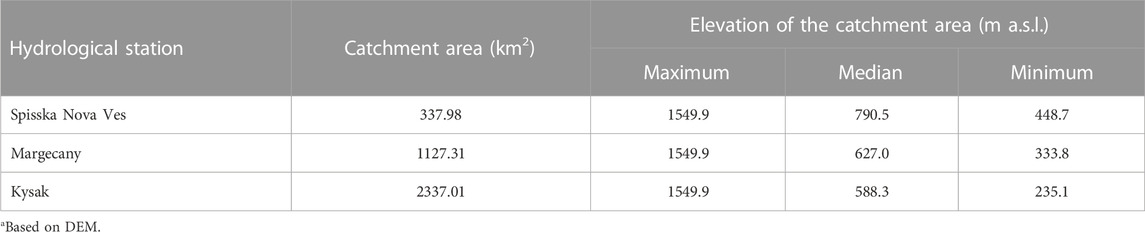
TABLE 1. Parameters of the catchment area.
In the structure of land use in the Hornad catchment, closed by the Kysak hydrological post, forest areas had the highest share (57.8% of the area), while arable land constituted only 18% of the basin area. Built-up areas occupied 3.4% (own calculations based on Corine 2018 (CLC, 2018). Over the years 1990–2018, the land use within the Hornad River catchment area has not changed significantly, with the exception of the catchment area enclosed by the Spisska Nova Ves hydrological post. The Spisska Nova Ves outpost closes the highest part of the Upper Hornad catchment area, the area of which is only 337.98 km2. In 1990, forests covered 60.5% of the catchment area, while the area of arable land was 21.0%. In 2018, a change in land use is visible, as the share of forest areas decreased and accounted for 46.8% of the catchment area. The area of arable land, urban and industrial lands has increased. Details of use are shown in Table 2 and Figure 2.
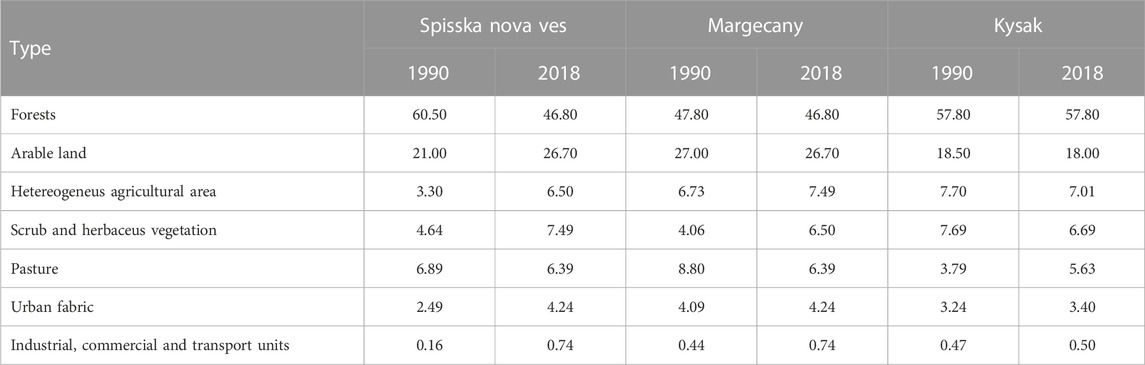
TABLE 2. Land use in % of the catchment area—based on (CLC, 2018).
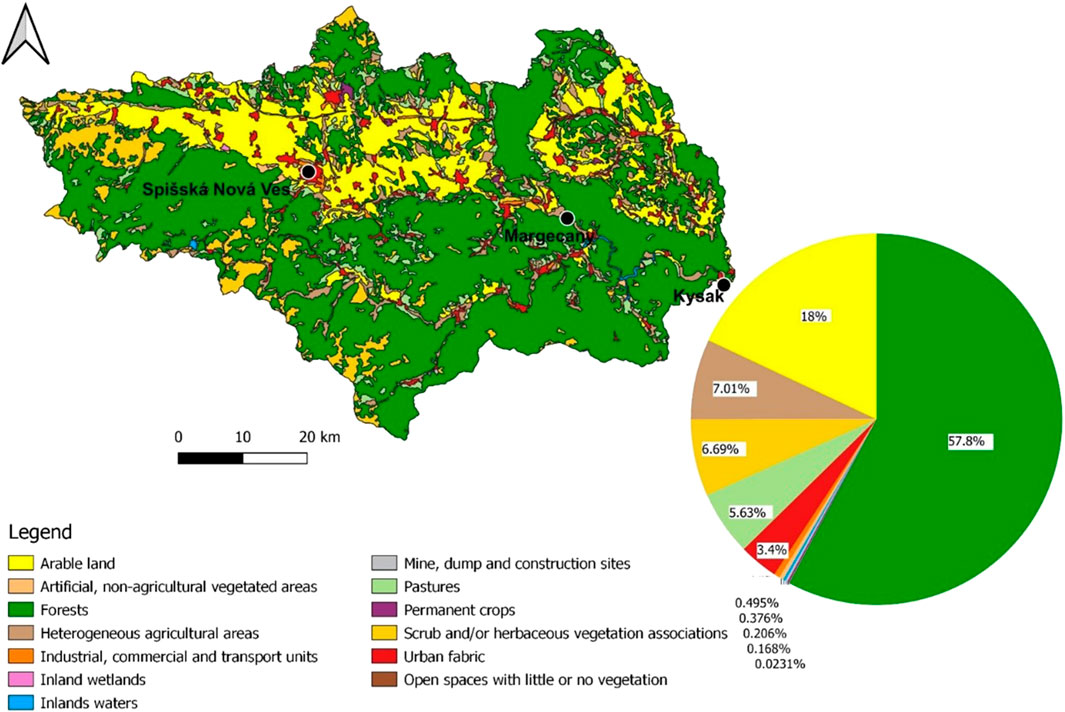
FIGURE 2. Land use (CLC, 2018).
The system of two water reservoirs, Ružín I and Ružín II, has a significant impact on the hydrological regime of the Hornád River. These reservoirs are located on the Hornad River between the Kysak and Margecany hydrological stations. The Ružín I and II reservoir system was built in 1963–1970, while its energy part was not fully operational until 1973. The system consists of two facilities: the Ružín I facility at km 78.35 of the river, which forms an accumulation reservoir, and the Ružín II facility at km 68.24 of the river, which forms an expansion tank that also enables the repumping of the processed streams. Ružín I consists of an accumulative reservoir, a stone dam with a height of 64.0 m and a hydroelectric power plant. The total capacity through the Ružín I barrage is 700 m3/s. There are two reversible Francis turbines installed in the power plant, operating in the gradient range from 30 to 52.7 m. The installed capacity of the hydropower plant is 60 MW, and the annual energy production is 136.0 GWh.
The power plant works in a pumped storage system. Ružín II has a 27 m high concrete dam that forms an expansion tank with a total volume of 3.7 million m3. The total capacity through the Ružín II barrage is 752 m3/s. The hydroelectric power plant operates continuously with one horizontal turbine, which operates in the range of slopes from 7.5 to 13.6 m. The installed power of this turbine is 1.9 MW. The task of the water reservoir is to equalise the flows caused by the operation of the pumped storage power plant at the Ružín I reservoir.
2.2 Data and methods
The variability of the flows of the upper section of the Hornad River was presented using data obtained from the Slovak Hydrometeorological Institute. The data included the daily values of flows obtained for three hydrological stations: Spisska Nova Ves, Margecany and Kysak from the hydrological years 1973–2020. Data on precipitation and air temperature were obtained from the website Intersucho (2022). Based on the daily values, monthly and annual values were calculated. The degree of volatility of flows in months and annual terms was carried out on the basis of the volatility of the Cv flows and the flashiness index, i.e., the Richard-Bakers Index (RBI), which characterises the short duration of the phenomenon. The flow variation index Cv was calculated as the standard deviation of all daily flow values divided by the average annual flow. The flashiness index proposed by Baker et al. (2004) was used to determine the rate of changes in short-term flows, which is called the RB Index (RBI) after the authors.
Where: q–average daily flow, i–day, n = 365 (366)
The RBI is a dimensionless index that ranges from 0 to 2 (Královec et al., 2016; Fiala et al., 2020). The index expresses how the flow changes between two units of time (days). Zero represents a constant flow, while a higher index value indicates increased flow frequency. Streams that rise and fall quickly are considered faster than those that maintain a smoother flow (Fongers, 2008).
In addition to the RBI index, the paper also calculated the trend of annual flows over a multi-year period, which is commonly used for the hydrological characteristics of rivers (Kliment and Matoušková, 2009; Zelenakova et al., 2014; Déry et al., 2016; Gudmundsson et al., 2021; Kubiak-Wójcicka et al., 2021; Nagy, 2021). The correlation coefficient r was used to determine the relationship between the RBI, Cv and flow rates. Statistical calculations were performed using the programme ‘R'.
The analysis of MK trends for precipitation, air temperature and flows is presented in Table 3.
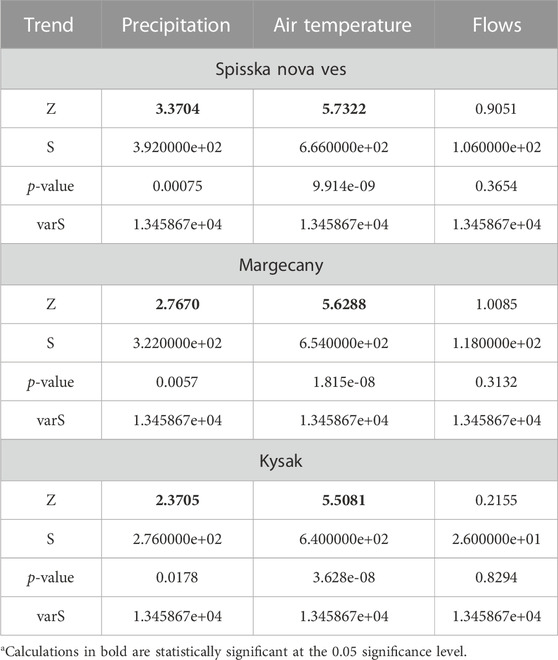
TABLE 3. The Mann–Kendall MK-S statistics for annual flows, precipitation and air temperature, identification of trends in the period 1973–2020.
3 Results and discussion
3.1 Precipitation over the 1973–2020 period
The mean annual sum of precipitation in the Hornad River basin was 761.9 mm, while the average annual air temperature was 6.9°C during the multi-year period 1973–2020. The highest precipitations was recorded in 2010—1219.2 mm, while the lowest in 1993—541.9 mm. The distribution of precipitation during the year is highly diversified. The highest average monthly sums in the analyzed period were recorded in June (103.4 mm) and July (107 mm), while the lowest in January (32.3 mm) and February (34.5 mm). The greatest variability of monthly precipitation occurred in October. The hottest year was 2007 (8.6°C), while the coldest was 1996 (5.1°C). During the analysed multi-year period 1973–2020, a statistically significant upward trend in air temperature is visible (Figure 3; Tab. 3). The warmest months of the year are July and August (16.6°C), while the coldest is January (−4.0°C).
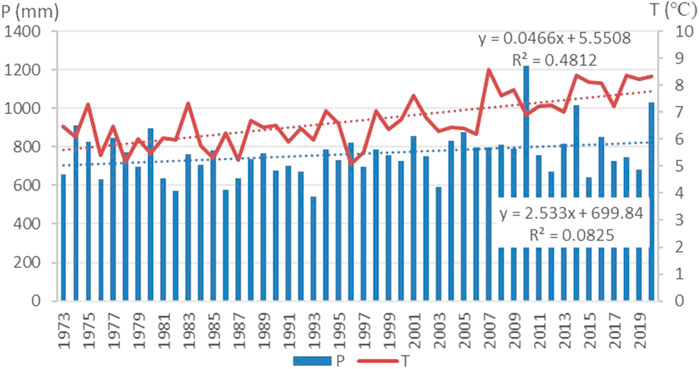
FIGURE 3. Precipitation (P) and air temperature (T) in the hydrological years 1973–2020.
3.2 Flows of the hornad river in 1973–2020 additional requirements
The course of the average annual flows of the Hornad River is shown in Figure 4. The average annual flow in the analyzed multi-year period at the Spisska Nova Ves hydrological station was 2.96 m3/s), at the Margecany station it was 7.85 m3/s, and at the Kysak station (17.38 m3/s). The increase in flows at the Margecany and Kyska stations is due to a more than doubling of the catchment area. The highest annual flows were recorded at all three hydrological stations in 2010, which was caused by high rainfall. The lowest annual flows were recorded at the Spisska Nova Ves hydrological station in 1982 (1.35 m3/s), at the Margecany hydrological station in 1993 (3.36 m3/s) and at the Kysak station in 2012 (7.62 m3/s). In the analysed multi-year period, an upward trend in flows is visible, the highest being at the Margecany station (above the Ružín Reservoir) and Kysak (below the Ružín reservoir), while the lowest trend was recorded at the Spisska Nova Ves hydrological station, but this is not a statistically significant increasing trend. On an annual level, the highest average monthly flows were recorded in April, while the lowest in January. Low flows in January are associated with the amount of precipitation during the month (the lowest precipitation totals), the type of precipitation (most often snowfall) and negative air temperature. High flows in April are associated with an increase in air temperature (above 0°C), which contributes to the melting of the snowpack.
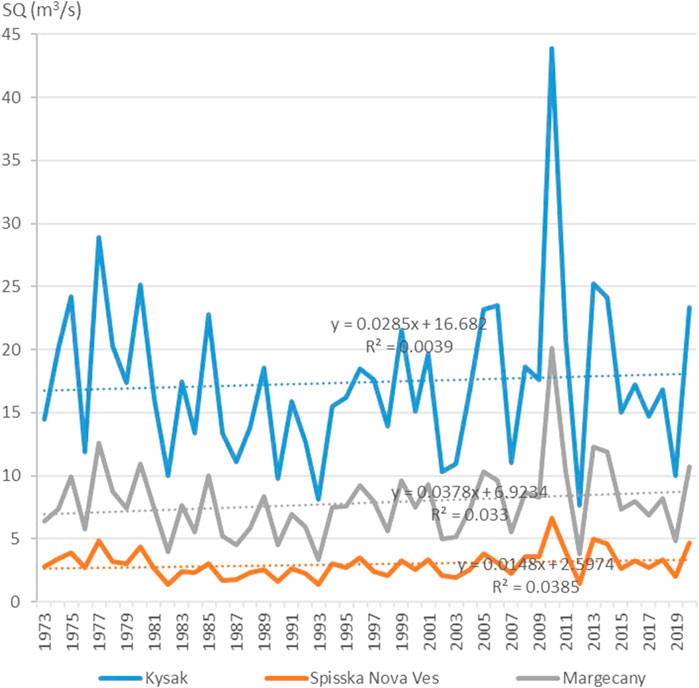
FIGURE 4. The average annual flow of the Hornad River at the Spisska Nova Ves, Margecany and Kysak station in the hydrological years 1973–2020.
3.3 Annual RBI and Cv
The annual RBI index at the Spisska Nova Ves hydrological station ranged from 0.08 (1999, 2003) to 0.20 (2010), while at the Margecany hydrological station these values ranged from 0.09 (1986, 1999) to 0.17 (2010) (Figures 5, 6). The higher amplitude of the RBI values was recorded at the Kysak station, i.e., from 0.06 (2012) to 0.24 (1973) (Figure 7). The high value of the RBI index at the Kysak station in 1973 resulted from the start-up of the hydroelectric power plant, as well as from the high sums of precipitation recorded in June and July 1973. Compared to other lowland watercourses, the obtained RBI values are higher, which proves the variable flows in the analysed multiannual period. A higher amplitude of the RBI values was recorded at the Kysak station than at the Margecany and Spisska Nova Ves stations, which is related to the large area of the basin closed by the Kysak station and the work of the water reservoir.
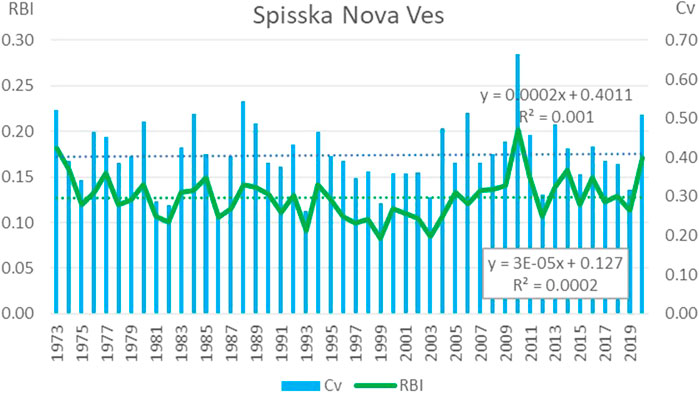
FIGURE 5. Annual RBI and Cv values at the hydrological station Spisska Nova Ves in the years 1973–2020.
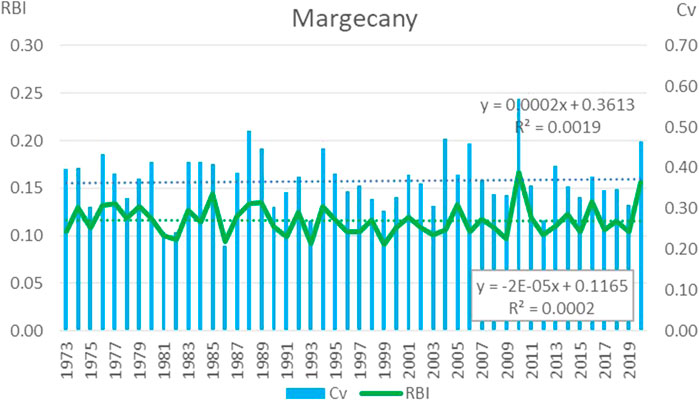
FIGURE 6. Annual RBI and Cv values at the Margecany hydrological station in 1973–2020.
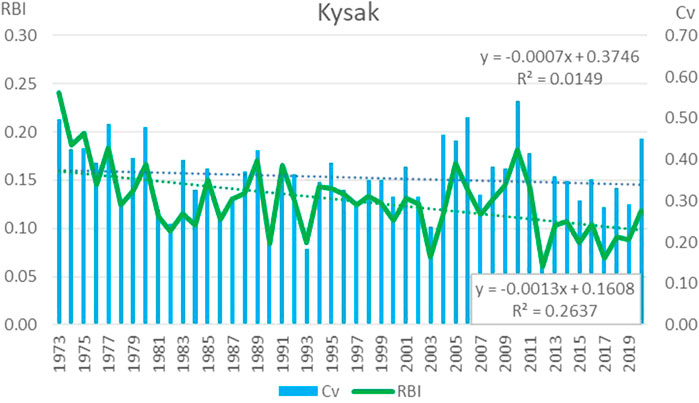
FIGURE 7. Annual RBI and Cv values at the Kysak hydrological station in 1973–2020.
In the period of 1973–2020, there no upward or downward trend appears in the RBI and Cv index at the hydrological stations Spisska Nova Ves and Margecany, despite visible slight fluctuations over time.
The analysis of the annual values of the Cv index showed that for the Spisska Nova Ves stations the Cv value ranged from 0.25 to 0.66 (amplitude 0.41), for Margecany stations from 0.21 to 0.57 (amplitude 0.36), and Kysak from 0.16 to 0.54 (amplitude 0.38). The highest Cv value was recorded at all three hydrological stations in 2010. The lowest Cv value at the Kysak station was recorded in 2012 (0.16), while at the Spisska Nova Ves station in 1986 (0.25) and at the Margecany station in 1986 (0.21). The Kysak station showed a clear downward trend in the Cv and RBI variability index in the analysed period 1973–2020, which may be related to the operation of the Ružín I and Ružín II reservoirs.
3.4 Monthly RBI and Cv values
Analysis of the monthly mean RBI values showed that in the period 1973–2020 the RBI values ranged from 0 to 0.49 at the hydrological stations Spisska Nova Ves and Margecany, while at the Kysak station the RBI indicator ranged from 0 to 0.57, which indicated high changes in short-term flows. The maximum value of the RBI index was recorded in June 1973 (0.57) at the Kysak station and in July 2008 at the Margecany station (0.49) and the Spisska Nova Ves station (0.48). The high RBI values were associated with high precipitation, which was one of the highest sums of monthly precipitation in the analysed multiannual period (with a monthly sum of precipitation above 170 mm). The sum of monthly precipitation in June 1973 for the catchment area closed by the Kysak post was 181.9 mm. In July 2008, the rainfall in the catchment closed by the Margecany post was 211.6 mm, while in the Spisska Nova Ves catchment it was 197.6 mm. In addition, rainfall in July was preceded by precipitation of 50–70 mm in the period from March to June. In the analysed multi-year period 1973–2020, the highest RBI values were recorded in the summer half-year (May–October), mainly in July and August, which accounted for about 70%–75% of the analysed multi-year period. In the winter half of the year (November-April), the share of maximum RBI values accounted for 25%–30% of the analysed multi-year period.
Figures 8–10 show the distribution of the Cv and RBI index in a monthly approach. A wide interquartile range with the range of interquartile deviations of the Cv index was recorded at the Spisska Nova Ves and Margecany stations, while a slightly smaller one is seen at the Kysak station. The most outlier maximum values of Cv were recorded in March at the Spisska Nova Ves and Margecany stations, while at the Kysak station the maximum values were recorded in July. The large range of deviations in the Cv index may be due to the small catchment area, which responds quickly to changing meteorological conditions. In the case of the RBI distribution, the most outlier maximum values (RBI> 0.4) were recorded in November, December, February, June and July at the Spisska Nova Ves station, while in November, February and July at the Margecany station. The most outlier maximum RBI values (>0.4) at the Kysak station were recorded in June, July and August, while in the remaining months there was a narrow interquartile range, which indicates a smaller flood range resulting from the regulation of flows through the water reservoir. In the event of very extreme floods, it is not possible to control the flows through the reservoir due to its limited capacity, which results in an exceptionally large change in daily flows during the month.
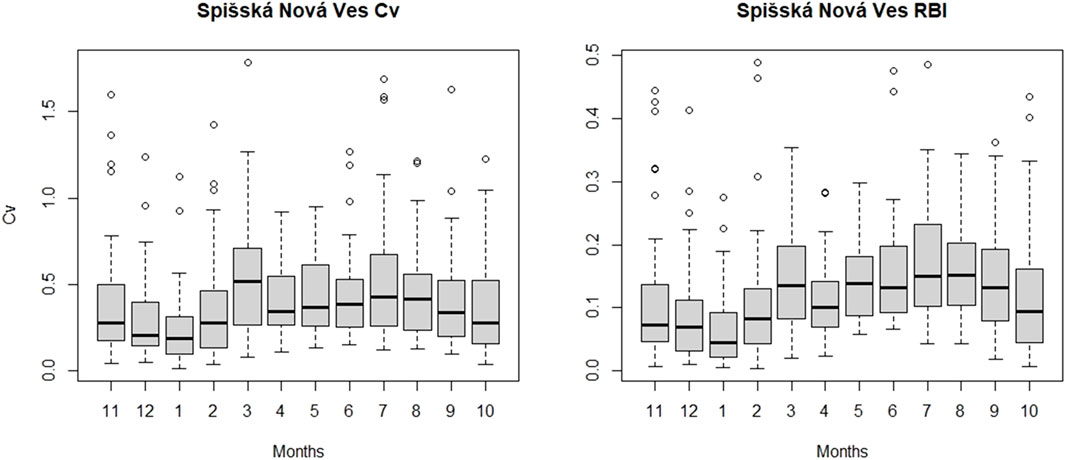
FIGURE 8. Distribution of the RBI and Cv index by month at the Spisska Nova Ves hydrological station in the years 1973–2020.
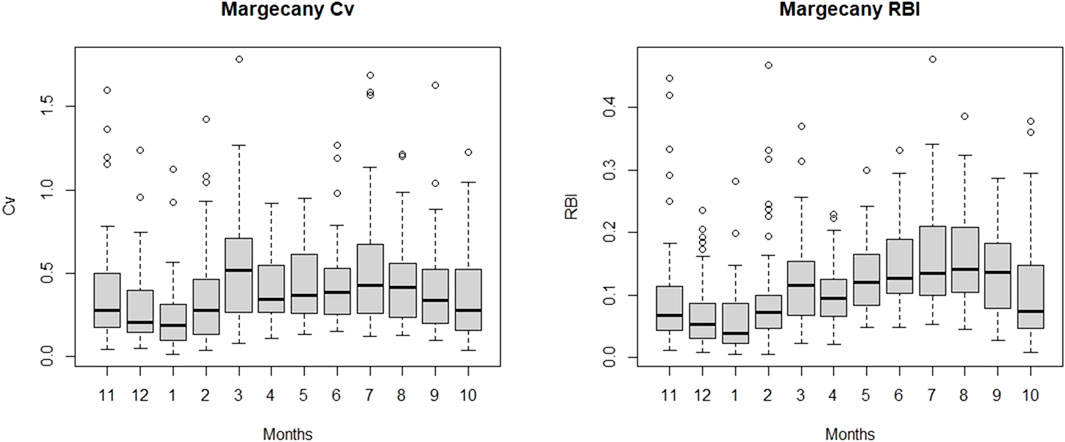
FIGURE 9. Distribution of the RBI and Cv index by month at the Margecany hydrological station in the years 1973–2020.
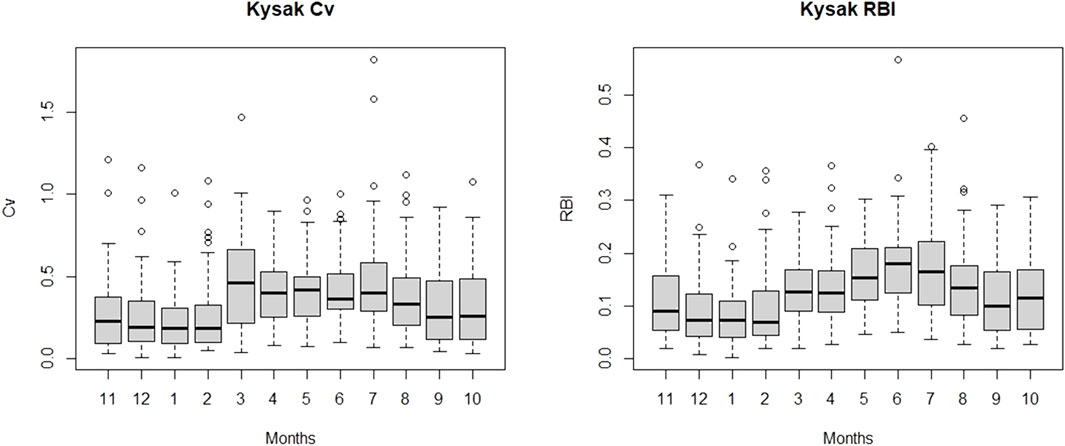
FIGURE 10. Distribution of the RBI and Cv index by month at the Kysak hydrological station in the years 1973–2020.
3.5 Correlation coefficient
Determining the size of the mutual relations between rainfall and hydrological conditions at all stations consisted in calculating the values of the correlation coefficients r between the RBI and Cv and between the RBI and monthly precipitation totals. The results show good relations between the RBI and Cv throughout the year at the Spisska Nova Ves and Magrecany stations, for which the r correlation value was higher than 0.77, and in October, November and December it was over 0.9 (Figure 11). Weaker correlations were obtained at the Kysak station, which is particularly visible in the period from April to July (r ranges from 0.58 to 0.73).
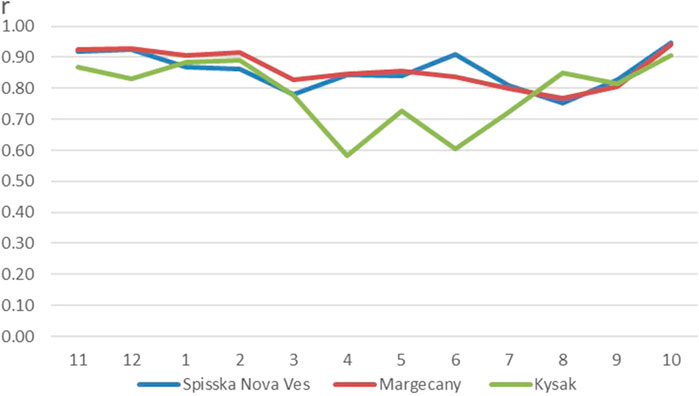
FIGURE 11. Correlation coefficient r between monthy values of the RBI and Cv index in the years 1973–2020.
Diversified results were obtained in the study of the relationship between the RBI index and monthly rainfall totals. The conducted analysis showed that a greater differentiation of the RBI index is seen between the posts located above the Ružín reservoir (Spisska Nova Ves and Magrecany) and the post located below the reservoir (Kysak). The correlation coefficient r between the RBI and monthly rainfall totals shows a high correlation for the Spisska Nova Ves and Magrecany stations. The correlation coefficient r is at a level of 0.8 in November, December and October for the Spisska Nova Ves and Magrecany stations (Figure 12). Low correlation values were recorded in February and March, which is the effect of feeding the river as a result of the thaw. Weak correlation between the RBI and rainfall at the Kysak station is visible in September (r = 0.34) and May (r = 0.41), which may be due to the regulation of flows in the river by the operation of the water reservoirs.
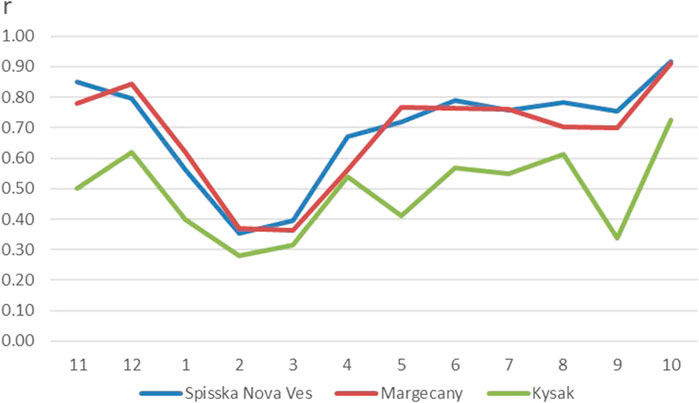
FIGURE 12. Correlation coefficient r between monthly value of the RBI and monthly precipitation in the years 1973–2020.
3.6 Discussion
In the analysed period of 1973–2020, a statistically significant upward trend in precipitation and air temperature in the individual catchments was recorded. An upward trend in flows was also recorded at all hydrological stations, but it was not statistically significant. The annual RBI flood rates showed slight RBI differences between the catchments, which are affected by the catchment’s physical properties and the operation of the Ružín Reservoir. At the hydrological stations of Spisska Nova Ves and Margecany, RBI values ranged from 0.08 to 0.20, while greater fluctuations in the RBI index were recorded at the Kysak station (from 0.06 to 0.24). Greater variation of the RBI index was recorded on a monthly basis. The RBI values ranged from 0 to 0.49 at the Spisska Nova Ves and Margecany hydrological stations, while at the Kysak station, the RBI ranged from 0 to 0.57, which indicated large changes in short-term flows. The obtained RBI values are characteristic of a mountain region. The RBI for the mountainous rivers of Slovakia and Austria ranges between 0.06 and 0.43 (Holko et al., 2011). For example, the RBI spread for rivers in the central part of the United States averaged 0.006 to 0.3 per year (Fongers, 2008). On the other hand, the RBI values for the rivers of Ethiopia were much higher and ranged from 0.011–1.113 (Berhanu et al., 2015). Studies conducted for four drainage basins in Indonesia showed that the average annual flood rate ranged between 0.29 and 0.39, and high RBI values occurred during the dry and transitional seasons (Pratama et al., 2018). For comparison, the RBI values for a lowland river in Poland (the Vistula in the estuary section) were definitely lower and ranged from 0.02 to 0.156 (Kubiak-Wójcicka, 2018). The diversified values of the RBI index are visible in the monthly approach at the individual hydrological stations. The analysis of data for the mountain section of the Hornad River in Slovakia showed that high RBI values in monthly terms were recorded at the Kysak hydrological station, which was under the influence of the Ružín I and Ružín II reservoirs. In the case of average flow values, the RBI index is higher at the Ružín post located below the water reservoir (Kysak) compared to the posts located above the reservoir (Spisska Nova Ves and Margecany). At higher flow rates due to heavy rainfall (over 80 mm per month), there was an increase in the RBI value, which was related to the limited possibilities of water collection by the reservoir. On the other hand, in months with rainfall amounts below 30 mm, the flows recorded at the post located below the water reservoir are evenly distributed over time, which is regulated by the reservoir’s operation. In this situation, there were slight changes in the RBI. According to Johnson et al. (2022), the RBI indicator should not be used in small mountain streams due to the inability to capture the fluctuations that occur over short periods of time, e.g., from hour to hour. Rainfall in first-order drainage is closely related to the response stream due to high connectivity in the landscape. The new RBI index, unlike many other hydrological parameters, has a low annual variation tolerance. Consequently, fewer flux years are required to quantify flux flash. Based on our findings, the RBI indicator is useful for detecting gradual changes in the flow regime, which may be related to the operation of water bodies, changes in the water management in the basin (Kubiak-Wójcicka, 2018) or land use. A specific case study for the Hornad River in Slovakia captured the details that are important for water management strategies within a mountain catchment area. For more detailed analyses of the impact of a water reservoir on the hydrological regime of a river, additional hydrological indicators should be used, which will allow regime changes to be determined in a long-term perspective. One has to agree with other authors (Kubiak-Wójcicka and Kornaś, 2015; Bonato et al., 2019) that interdisciplinary research involving various stakeholders is important. Extensive research and community engagement should be reflected in local actions and development strategies.
4 Conclusion
The annual RBI and Cv values show an even distribution of values over the analysed period 1973–2020 at the hydrological stations Spisska Nova Ves and Margecany. At the Kysak station, there was a clear downward trend in the Cv and RBI variability index in the analysed period 1973–2020, which may be related to the operation of the Ružín I and Ružín II reservoirs.
- Higher annual amplitudes of RBI values were recorded at the Kysak post below the Ružín II water reservoir, which results from the nature of the work of water reservoirs, while lower amplitudes of RBI values at the posts located above the reservoir.
- The analysis of monthly mean RBI values showed that in the period from 1973 to 2020 the RBI values ranged from 0 to 0.49 at the hydrological stations Spisska Nova Ves and Margecany, while at the Kysak station, the RBI indicator ranged from 0 to 0.57, which indicated large changes in short-term flows.
- The maximum value of the RBI index occurred in June 1973 (0.57) at the Kysak station and in July 2008 (0.49) at the Margecany station (0.49) and the Spisska Nova Ves station (0.48), which was the result of very high precipitation (over 170 mm in a month).
- The correlation coefficient r between the RBI index and the monthly sum of rainfall shows that the highest correlation was in October, November and December (r > 0.8) at the hydrological stations Spisska Nova Ves and Margecany, while at the Kysak hydrological station the highest value of r was recorded in October (r = 0.73). The lowest r values were recorded in February and March at all stations, and they ranged from 0.28 to 0.39 and were related to thaws, which could cause fluctuations in flows.
- The possibilities of water retention in the Ružín reservoir are limited, which is visible in the case of very high precipitation.
- The information obtained may be useful for water management strategies and protection of society against floods.
- There is a need to conduct similar research for other areas with similar physical and geographical conditions, which may be helpful in identifying the decisive factors affecting the hydrological regime of the river, and thus limiting the negative social and environmental effects.
The authors declare that the research was conducted in the absence of any commercial or financial relationships that could be construed as a potential conflict of interest. (Kliment and Matoušková, 2009; The Intergovernmental Panel on Climate Change, 2013; Hall et al., 2014; Déry et al., 2016; Bisselink et al., 2018; Guzha et al., 2018; Tabari, 2020; Chalise et al., 2021; Gessesse et al., 2021; Nagy, 2021; Papadaki and Dimitriou, 2021; Tram et al., 2021; Huang and Swain, 2022; Ullah et al., 2023).
Data availability statement
The original contributions presented in the study are included in the article/supplementary material, further inquiries can be directed to the corresponding author.
Author contributions
Conceptualization, KK-W, PN, and MZ; methodology, KK-W and PN; software, KK-W, PN, and MZ; validation, KK-W and PN; formal analysis, KK-W, PN, and MZ; investigation, KK-W and PN; resources, KK-W, PN, and MZ; data curation, KK-W, PN, MZ, and FV; writing-original draft preparation, KK-W; writing—review and editing, KK-W, PN, DK, MZ, and FV; visualization, KK-W and PN; supervision, KK-W, PN, DK, and MZ; project administration, KK-W; funding acquisition, KK-W, PN, DK, MZ, and FV. All authors contributed to the article and approved the submitted version.
Acknowledgments
This work was supported by the project run by the Slovak Research and Development Agency APVV-18-0360 “Active hybrid infrastructure towards to a sponge city”.
Conflict of interest
The authors declare that the research was conducted in the absence of any commercial or financial relationships that could be construed as a potential conflict of interest.
Publisher’s note
All claims expressed in this article are solely those of the authors and do not necessarily represent those of their affiliated organizations, or those of the publisher, the editors and the reviewers. Any product that may be evaluated in this article, or claim that may be made by its manufacturer, is not guaranteed or endorsed by the publisher.
References
Assani, A. A., Tardif, S., and Lajoie, F. (2006). Statistical analysis of factors affecting the spatial variability of annual minimum flow characteristics in a cold temperate continental region (southern Québec, Canada). J. Hydrology 328, 753–763. doi:10.1016/j.jhydrol.2006.01.015
Baker, D. B., Richards, R. P., Loftus, T. T., and Kramer, J. W. (2004). A new flashiness index: Characteristics and applications midwesterns rivers and streams. J. Am. Water Resour. Assoc. 40, 503–522. doi:10.1111/j.1752-1688.2004.tb01046.x
Berhanu, B., Seleshi, Y., Demisse, S. S., Assefa, M., and Melesse, A. M. (2015). Flow regime classification and hydrological characterization: A case study of Ethiopian rivers. Water 7, 3149–3165. doi:10.3390/w7063149
Bisselink, B., Bernhard, J., Gelati, E., Adamovic, M., Jacobs, C., Mentaschi, L., et al. (2018). Impact of a changing climate, land use, and water usage on water resources in the Danube river basin. Luxembourg, Europe: EUR 29228 EN, Publications Office of the European Union. doi:10.2760/89828JRC1118
Bonato, M., Ranzani, A., Patro, E. R., Gaudard, L., and De Michele, C. (2019). Water-energy nexus for an Italian storage hydropower plant under multiple drivers. Water 11, 1838. doi:10.3390/w11091838
Chalise, D. R., Sankarasubramanian, A., and Ruhi, A. (2021). Dams and climate interact to alter river flow regimes across the United States. Earth's Future 9, e2020EF001816. doi:10.1029/2020EF001816
Croke, B. F. W., and Jakeman, A. J. (2001). Predictions in catchment hydrology: An Australian perspective. Mar. Freshw. Res. 52, 65–79. doi:10.1071/mf00045
Déry, S. J., Stadnyk, T. A., MacDonald, M. K., and Gauli-Sharma, B. (2016). Recent trends and variability in river discharge across northern Canada. Hydrol. Earth Syst. Sci. 20, 4801–4818. doi:10.5194/hess-20-4801-2016
Fiala, R., Podhrázská, J., Konečná, J., Kučera, J., Karásek, P., Zahradníček, P., et al. (2020). Changes in a river’s regime of a watercourse after a small water reservoir construction. Soil Water Res. 15 (1), 55–65. doi:10.17221/23/2019-SWR
Fongers, D. (2008). Thornapple River watershed flashiness report. http://www.barrycd.org/TRWP/Appendix%202%20Flashiness%20Report.pdf.
Gannon, J. P., Kelleher, C., and Zimmer, M. (2022). Controls on watershed flashiness across the continental US. J. Hydrology 609, 127713. doi:10.1016/j.jhydrol.2022.127713
Gao, Y., Vogel, R. M., Krol, C. N., LeRoy Poff, N., and Olden, J. D. (2009). Development of representative indicators of hydrologic alteration. J. Hydrology 374 (1-2), 136–147. doi:10.1016/j.jhydrol.2009.06.009
Gessesse, A. A., Melesse, A. M., and Abiy, A. Z. (2021). Land use dynamics and base and peak flow responses in the Choke mountain range, Upper Blue Nile Basin, Ethiopia. Int. J. River Basin Manag. 19 (1), 109–121. doi:10.1080/15715124.2019.1672700
Gudmundsson, L., Boulange, J., Do, H. X., Gosling, S. N., Grillakis, M. G., Koutroulis, A. G., et al. (2021). Globally observed trends in mean and extreme river flow attributed to climate change. Science 371 (6534), 1159–1162. doi:10.1126/science.aba3996
Guzha, A. C., Rufino, M. C., Okoth, S., Jacobs, S., and Nóbrega, R. (2018). Impacts of land use and land cover change on surface runoff, discharge and low flows: Evidence from East Africa. J. Hydrology Regional Stud. 15, 49–67. doi:10.1016/j.ejrh.2017.11.005
Hall, J., Arheimer, B., Borga, M., Brázdil, R., Claps, P., Kiss, A., et al. (2014). Understanding flood regime changes in europe: A state-of-the-art assessment. Hydrol. Earth Syst. Sci. 18, 2735–2772. doi:10.5194/hess-18-2735-2014
Hanel, M., Vizina, A., Máca, P., and Pavlásek, J. (2012). A multi-model assessment of climate change impact on hydrological regime in the Czech Republic. J. Hydrol. Hydromech. 60 (3), 152–161. doi:10.2478/v10098-012-0013-4
Holko, L., Parajka, J., Kostka, Z., Skoda, P., and Bloschl, G. (2011). Flashiness of mountain streams in Slovakia and Austria. J. Hydrology 405, 392–401. doi:10.1016/j.jhydrol.2011.05.038
Huang, X., and Swain, D. L. (2022). Climate change is increasing the risk of a California megaflood. Sci. Adv. 8, eabq0995. doi:10.1126/sciadv.abq0995
Johnson, B. G., Morris, C. S., Mase, H. L., Whitehouse, P. S., and Paradise, C. J. (2022). Seasonal flashiness and high frequency discharge events in headwater streams in the North Carolina Piedmont (United States). Hydrol. Process. 36, e14550. doi:10.1002/hyp.14550
Kliment, Z., and Matoušková, M. (2009). Runoff changes in the šumava mountains (black forest) and the foothill regions: Extent of influence by human impact and climate change. Water Resour. Manage 23, 1813–1834. doi:10.1007/s11269-008-9353-6
Královec, V., Kliment, Z., and Matoušková, M. (2016). Evaluation of runoff response on the basis of a comparative paired research in mountain catchments with the different land use. Case study of the Blanice River, Czechia. Geografie 121 (2), 209–234. doi:10.37040/geografie2016121020209
Kubiak-Wójcicka, K. (2018). “Flow characteristics of the Vistula River at the tczew gauging station in 1951–2010 based on flashiness index,” in Water resources and wetlands, 4th international conference water resources and wetlands, 5-9 september 2018. Editors P. Gastescu, P. Bretcan, and edit (Tulce, Rome: WRW), 119–129.
Kubiak-Wójcicka, K., and Kornaś, M. (2015). Impact of hydrotechnical structures on hydrological regime of the Gwda and Drawa rivers. Quaest. Geogr. 34 (1), 99–110. doi:10.1515/quageo-2015-0009
Kubiak-Wójcicka, K., and Machula, S. (2020). Influence of climate changes on the state of water resources in Poland and their usage. Geosciences 10, 312. doi:10.3390/geosciences10080312
Kubiak-Wójcicka, K., Zeleňáková, M., Blištan, P., Simonová, D., and Pilarska, A. (2021). Influence of climate change on low flow conditions. Case study: Laborec River, eastern Slovakia. Ecohydrol. Hydrobiology 21 (4), 570–583. doi:10.1016/j.ecohyd.2021.04.001
Kuriqi, A., Pinheiro, A. N., Sordo-Ward, A., Bejarano, M. D., and Garrote, L. (2021). Ecological impacts of run-of-river hydropower plants—current status and future prospects on the brink of energy transition. Renew. Sustain. Energy Rev. 142, 110833. doi:10.1016/j.rser.2021.110833
Mogollón, B., Frimpong, E. A., Hoegh, A. B., and Argermeier, P. L. (2016). Recent changes in stream flashiness and flooding, and effects of flood management in North Carolina and Virginia. J. Am. Water Resour. Assoc. (JAWRA) 52 (3), 561–577. doi:10.1111/1752-1688.12408
Nagy, P. (2021). Assessment of streamflows in the Hornád river basin and analysis of trends. IOP Conf. Ser. Mater. Sci. Eng. 1209, 012022. doi:10.1088/1757-899X/1209/1/012022
Olden, J. D., and Poff, N. L. (2003). Redundancy and the choice of hydrologic indices for characterizing streamflow regimes. River Res. applic. 19, 101–121. doi:10.1002/rra.700
Onwuka, A. S., Scinto, L. J., and Mazdeh, A. M. (2021). Comparative use of hydrologic indicators to determine the effects of flow regimes on water quality in three channels across southern Florida, USA. Water 13, 2184. doi:10.3390/w13162184
Oueslati, O., De Girolano, A. M., Abouabdillah, A., and La Porto, A. (2010). “Attempts to flow regime classification and characterisation in Mediterranean stream using multivariate analysis,” in International workshop advances in statistical hydrology (Taormina, Italy: John Wiley).
Panagoulia, D., and Dimonu, G. (1997). Sensitivity of flood events to global climate change. J. Hydrology 191 (1-4), 208–222. doi:10.1016/S0022-1694(96)03056-9
Papadaki, C., and Dimitriou, E. (2021). River flow alterations caused by intense anthropogenic uses and future climate variability implications in the balkans. Hydrology 8, 7. doi:10.3390/hydrology8010007
Pardo-Loaiza, J., Solera, A., Bergillos, R. J., Paredes-Arquiola, J., and Andreu, J. (2021). Improving indicators of hydrological alteration in regulated and complex water resources systems: A case study in the duero River Basin. Water 13, 2676. doi:10.3390/w13192676
Pratama, G., and Kusratmoko, E. (2018). Flashiness index of several rivers in the citarum basin, west java. IOP Conf. Ser. Earth Environ. Sci. 145, 012107. doi:10.1088/1755-1315/145/1/012107
Pumo, R. D., Francipane, A., Cannarozzo, M., Antinoro, C., and Noto, L. V. (2018). Monthly hydrological indicators to assess possible alterations on rivers’ flow regime. Water Resour. Manage 32, 3687–3706. doi:10.1007/s11269-018-2013-6
Rosburg, T. T., Nelson, P. A., and Bledose, B. P. (2017). Effects of urbanization on flow duration and stream flashiness: A case study of puget sound streams western Washington, USA. J. Am. Water Resour. Assoc. 53 (2), 493–507. doi:10.1111/1752-1688.12511
Tabari, H. (2020). Climate change impact on flood and extreme precipitation increases with water availability. Sci. Rep. 10, 13768. doi:10.1038/s41598-020-70816-2
The Intergovernmental Panel on Climate Change (IPCC) (2013). “Climate change 2013: The physical science basis,” in Contribution of working group I to the 5th assessment report of the intergovernmental Panel on climate change (New York, NY, USA: Cambridge University Press).
Tram, V. N. Q., Somura, H., and Moroizumi, T. (2021). The impacts of land-use input conditions on flow and sediment discharge in the dakbla watershed, central highlands of vietnam. Water 13, 627. doi:10.3390/w13050627
Ullah, E. I., Ahmad, S., Khokhar, M. F., Azmat, M., Khayyam, U., and Qaiser, F. R. (2023). Hydrological and ecological impacts of run off river scheme; a case study of Ghazi Barotha hydropower project on Indus River, Pakistan. Heliyon 9, e12659. doi:10.1016/j.heliyon.2022.e12659
Keywords: flashiness index, flows, Richard-Baker Index, trends, Hornad river, Slovakia
Citation: Nagy P, Kubiak-Wójcicka K, Káposztásová D, Zeleňákova M and Vranay F (2023) Flow characteristics of the Hornád River and the anthropogenic impact of the Ružín dam for the period 1973–2020. Front. Environ. Sci. 11:1203965. doi: 10.3389/fenvs.2023.1203965
Received: 11 April 2023; Accepted: 17 July 2023;
Published: 10 August 2023.
Edited by:
Isa Ebtehaj, Université Laval, CanadaReviewed by:
Alban Kuriqi, University of Lisbon, PortugalBimlesh Kumar, Indian Institute of Technology Guwahati, India
Copyright © 2023 Nagy, Kubiak-Wójcicka, Káposztásová, Zeleňákova and Vranay. This is an open-access article distributed under the terms of the Creative Commons Attribution License (CC BY). The use, distribution or reproduction in other forums is permitted, provided the original author(s) and the copyright owner(s) are credited and that the original publication in this journal is cited, in accordance with accepted academic practice. No use, distribution or reproduction is permitted which does not comply with these terms.
*Correspondence: Martina Zeleňákova, bWFydGluYS56ZWxlbmFrb3ZhQHR1a2Uuc2s=