 Jianyuan Li
- 1State Key Laboratory of Simulation and Regulation of Water Cycle in River Basin, China Institute of Water Resources and Hydropower Research, Beijing, China
- 2College of Hydraulic and Environmental Engineering, China Three Gorges University, Yichang, China
- 3Huaneng Yarlung Zangbo Hydropower Development Co., Ltd., Chengdu, China
Introduction: Changes in fish phenotypes during aquaculture must be monitored to improve the quality of fishery resources. Therefore, a method for segmenting and measuring phenotypes rapidly and accurately without harming the fish is essential. This study proposes an intelligent fish phenotype segmentation method based on the residual network, ResNet50, and atrous spatial pyramid pooling (ASPP).
Methods: A sufficient number of fish phenotypic segmentation datasets rich in experimental research was constructed, and diverse semantic segmentation datasets were developed. ResNet50 was then built as the backbone feature extraction network to prevent the loss of fish phenotypic feature information and improve the precision of fish phenotypic segmentation. Finally, an ASPP module was designed to improve the phenotypic segmentation accuracy of different parts of fish.
Results: The test algorithm based on the collected fish phenotype segmentation datasets showed that the proposed algorithm (RA-UNet) yielded the best results among several advanced semantic segmentation models. The mean intersection over union (mIoU) and mean pixel accuracy (mPA) were 87.8% and 92.3%, respectively.
Discussion: Compared with the benchmark UNet algorithm, RA-UNet demonstrated improvements in the mIoU and mPA by 5.0 and 1.8 percentage points, respectively. Additionally, RA-UNet exhibited superior fish phenotype segmentation performance, with a low false detection rate and clear and complete edge segmentation. Conclusively, the RA-UNet proposed in this study has high accuracy and edge segmentation ability and can, therefore, directly improve the efficiency of phenotypic monitoring in fish farming.
1 Introduction
As a vital component of aquaculture (Wang et al., 2022), fish are essential for ensuring national food security. Phenotypic information represents the primary measurable attribute and is an important parameter for monitoring fish growth. The phenotypic frequency distribution interval can represent the number and proportion of individual fish in different growth stages (Zhang et al., 2020). This information also helps aquaculture managers better monitor the growth curve, optimize water quality regulation, manage the feed quantity (Kong et al., 2022), and improve the economic benefits of aquaculture (Xu et al., 2020; Zhao S. et al., 2022).
Previous studies used manual contact measurement methods, such as reading relevant index data using a measuring ruler, to measure fish phenotypes (Zhou et al., 1995). However, manual measurement requires considerable human and material resources and easily harms the fish (Li X. et al., 2022). Moreover, the results depend on the experience and subjective awareness of the surveyors, possibly resulting in errors. Therefore, performing intelligent fish phenotype monitoring without harming the fish by establishing a noncontact phenotype segmentation method to rapidly and accurately segment phenotypes and analyze fish phenotype proportion relationships in aquaculture is essential for intelligence-driven development of the aquaculture industry (An et al., 2021).
2 Noncontact phenotype segmentation methods
2.1 Phenotype segmentation methods based on low-level visual information
Fish segmentation using noncontact phenotypic segmentation methods was previously studied primarily based on the low-order visual information of image pixels in fuzzy segmentation algorithms (Otsu, 1979), such as image information and pixel extraction using color space conversion, color component extraction, and median filter processing (Kitschier et al., 2011; Cherkassky and Ma, 2004; van den Heuvel et al., 2008; Saifullah et al., 2021). Ma et al. (2016) divided the color image vector-valued pixel points into three single-channel pixel points (R, G, and B) and used a K-means clustering algorithm to obtain the fish phenotypes. Chen Y. Y. et al. (2019) implemented a shape feature extraction method based on Fisher’s discriminant function to segment fish and backgrounds quickly. Taheri-Garavand et al. (2019) combined artificial bee colony and neural network algorithms for fish feature extraction in specific scenarios and achieved better phenotypic segmentation results. Sun L. Q. et al. (2019) used a simple and fast-structured forest method to extract the edge information from fish images. These image segmentation methods are relatively less computationally intensive, simple, and convenient. However, the fuzzy image segmentation algorithm based on lower-level shallow visual information to distinguish the target from the background lacks higher-level semantic target feature information. Furthermore, this method has limitations in matching target-specific information (Liao et al., 2021), and segmentation is poor. Moreover, the generalization ability of fuzzy image segmentation algorithms is weak (Shao et al., 2022), and the parameters need to be continuously adjusted by humans to adapt to the segmentation scene (Zhou et al., 2022). Therefore, these methods cannot achieve automatic target segmentation, affecting the segmentation efficiency and hindering the application of these methods to actual complex scenes. Intelligent detection and accurate segmentation methods for fish phenotype edges must be further established.
2.2 Species detection method based on deep learning information
With the recent progress in computer vision technology (Zhang & Zhang, 2021), object detection methods based on deep learning have been rapidly developed and widely used for fish detection and analysis (Yang et al., 2021; Li J. et al., 2022). Sun et al. (2021) proposed a DRN-Faster R-CNN-based multi-target fish detection model for complex backgrounds with limited generalization capability, which reduces missed and false detections. Chen J. et al. (2019) identified fish based on an FTVGG16 convolutional neural network with an average precision of 97.66% and high recognition precision and robustness. Zhao T. et al. (2022) proposed a lightweight YOLOv4 algorithm to detect dead fish with an accuracy of 95.47%. Abinaya et al. (2022) used YOLOv4 to segment fish to assess biomass. The species detection method based on deep learning information is accurate and efficient (Klapp et al., 2018; Mei et al., 2022) and can recognize the species and locate the object (Zhang et al., 2019; Zhang & Zhang, 2019). However, this method still lacks morphological phenotypic feature recognition of specific object parts, hindering the complete phenotypic and shape segmentation. Therefore, developing methods for fish phenotype refinement segmentation is needed.
2.3 Phenotype segmentation method based on semantic segmentation
Compared with the traditional image segmentation methods, semantic segmentation uses higher-order visual information with higher accuracy and robustness. Therefore, specific object contours can be quickly and accurately recognized to segment target morphological features, avoiding problems caused by manual observation, such as disturbing the fish and poor performance (Li W. et al., 2022; Raei et al., 2022; Vayssade et al., 2022; Zou et al., 2022). This study used the semantic segmentation method to segment fish phenotypes because the specific shape and size of fish phenotypes can be accurately obtained without interference to better monitor the fish growth curve and regulate the aquacultural environment in real time. Deng et al. (2019) proposed segmenting beef cattle images based on an RGB-D full convolutional network and improved the precision of this network by optimizing the segmentation effect on detailed parts of the cattle. Zhu et al. (2022) optimized and trimmed the UNet network, and the updated model had an excellent segmentation effect and response speed for banana bunch edges and stalks in a self-built banana bunch dataset. Liu et al. (2020) improved this network to address the low image recognition precision of the target muscle region for intelligent fine segmentation of lamb, reaching an average precision of 98.2%.
In terms of fish phenotype segmentation, Lin et al. (2022) proposed a SUR-Net, which could better segment fish using a limited dataset. Furthermore, Rafael et al. (2019) used an example segmentation method to obtain fish body contours and measured fish size by estimating the contours. Alshdaifat et al. (2020) proposed a new framework for underwater video fish instance segmentation with higher performance under the same conditions than other state-of-the-art algorithms. Liu et al. (2021) used a semantic segmentation model to classify fish parts into seven categories and used video images to analyze fish behavior and improve aquaculture conservation quantitatively. However, current studies have focused less on fine-scale segmentation of local fish phenotypes. Because of the limited number of publicly available datasets, researchers need to collect large amounts of data in natural aquaculture environments and annotate them manually, which is time-consuming and laborious. Semantic segmentation models enable fine-grained recognition of the target morphology; however, the direct application of these models to fish phenotype segmentation in aquaculture faces the following problems: 1) Segmentation of each fish phenotype requires a sufficient number of high-resolution fish phenotype datasets as training support for semantic segmentation models, and limited research on fish phenotype segmentation is available for existing deep learning algorithms, directly affecting the quality of the datasets; 2) The conventional convolution and downsampling operations in the semantic segmentation model are prone to the loss of fish phenotypic feature information and blurred boundaries. Furthermore, some targets are small, such as fins and eyes, easily causing missed segmentation; thus, segmentation precision must be improved; 3) Fish fins are similar in shape; dorsal, ventral, pectoral, and anal fins are easily confused, causing inaccuracy or even incorrect segmentation of fish edges; thus, the accuracy of segmentation needs to be improved.
Given the above problems, this study built a ResNet network with 50 layers of depth instead of the original backbone feature extraction network based on the UNet semantic segmentation algorithm, designed a multilayer parallel cavity convolution module (ASPP), and proposed an intelligent RA-UNet fish phenotype segmentation method based on residual network (ResNet50) and multilayer parallel cavity convolution, which can be used in aquaculture. Our method can monitor and measure fish phenotypes in aquaculture and obtain information on their shape and size. Compared with the manual observation and traditional segmentation methods, this method can quickly and accurately perform fish phenotype segmentation without harming the fish. Furthermore, this method can be applied to fish phenotype monitoring and measurement in natural aquaculture scenarios as an alternative or complementary method for fish phenotype segmentation. The main contributions of this study are as follows.
(1) To address limited high-quality datasets, a self-constructed fish phenotype segmentation dataset with a sufficient quantity and rich background was used for aquaculture fish phenotype segmentation and detection by collecting data on various fish species. All dataset images were manually annotated to ensure the quality of the dataset and promote the expandability and diversity of the semantic segmentation dataset.
(2) To address model omission, ResNet50 is proposed as the backbone feature extraction network, thus increasing the depth of the model, improving the network extraction ability for target information, improving the fish phenotype segmentation precision through the feature extraction method of the residual module, and reducing information loss of fish phenotype features that occur in conventional convolution and downsampling operations.
(3) To address model misdetection, an ASPP module expanded the perceptual field of the model, improved the accuracy of fish phenotypic edge segmentation, and reduced discontinuous edge regions after the proposed fish segmentation.
3 Materials and methods
3.1 Fish phenotypic segmentation dataset
Deep learning algorithms require large datasets to support training. Data quality impacts model training, especially regarding the richness of the data samples and the data annotation precision. Therefore, acquiring large amounts of data as training samples for semantic segmentation models is crucial. Most domestic and international research on phenotype segmentation analysis targets human targets. Such investigations rely on publicly available datasets, such as Look into Person (Liang et al., 2018) and Crowd Instance-level Human Parsing (Gong et al., 2018), and a comparable public dataset is not available for fish phenotype segmentation. Therefore, we created a self-built fish phenotype segmentation dataset in this study by designing a data production scheme and customizing the data sources acquisition.
3.1.1 Fish collection sites
The dataset collection sites for fish phenotype segmentation included a Tibetan aquatic research institute and a fish proliferation and releasing station at 29°64′N, 91°04′E (Figure 1). The two test sites have various fish species and imaging contexts, and the fish were easily accessible.
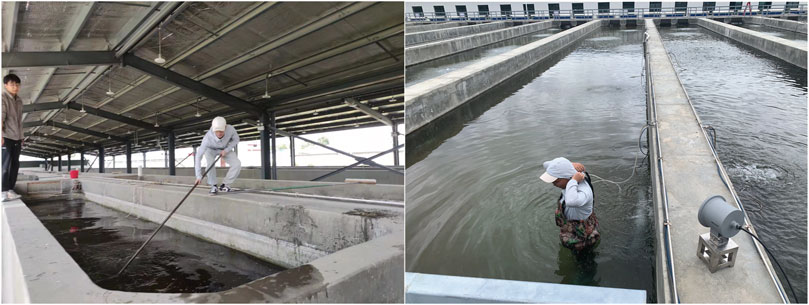
FIGURE 1. Dataset collection site.
3.1.2 Image data acquisition
Three primary methods were used for image acquisition. 1) Acquiring images of fish underwater through an underwater camera. A slide rail was set up so that the camera could shoot at any position inside the edge of the tank to acquire multi-angle images (Figure 2A). 2) Acquiring images of fish underwater through external filming equipment (Figure 2B). 3) Placing the fish on the experimental bench to manually film still images (Figure 2C).
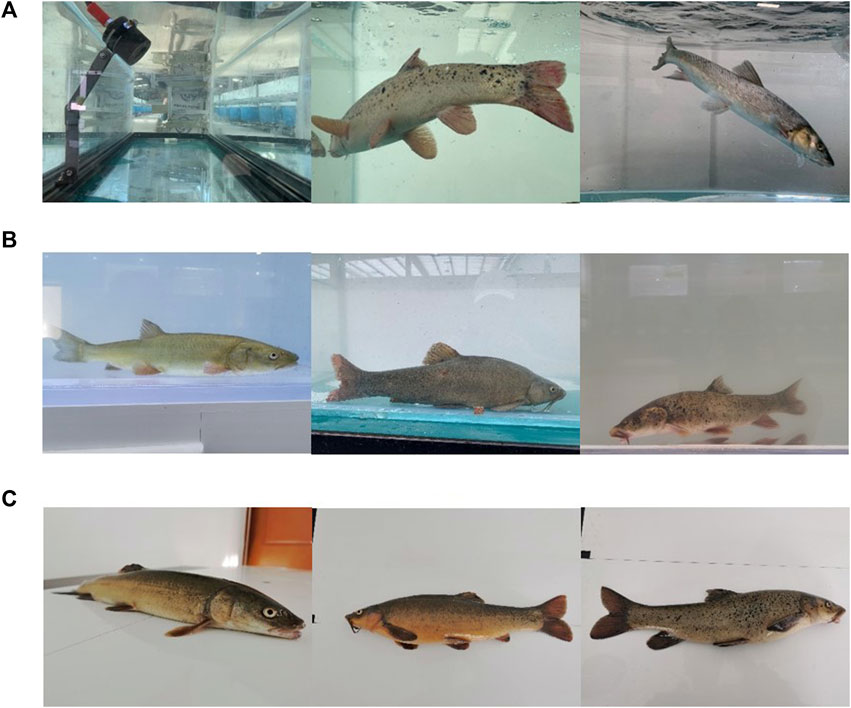
FIGURE 2. Fish image acquisition (A) Underwater cameras to capture dynamic images of fish, (B) External filming equipment to capture dynamic images of fish, and (C) still images of fish.
The fish images obtained had rich background conditions (different scenes, conditions, light intensities, etc.), effectively preventing over-fitting training and guaranteeing good semantic segmentation model robustness. A total of 1,200 data images were collected. After manually removing images that were redundant, blurry, or of poor quality and those with a similarity >0.7, 500 dynamic and static fish images were retained to guarantee the quality of the fish phenotype segmentation dataset.
3.1.3 Dataset expansion and construction
Too little data limit the learning ability of the model. Therefore, this study further expanded the number and diversity of the datasets to improve the generalization ability of the model and reduce over- and under-fitting. The dataset was expanded to 1,200 images using image enhancement algorithms (Clahe (Reza, 2004), Dark Channel Prior (He et al., 2010), GBdehazingRCorrection (Li et al., 2016)), and spatial variations (rotation, flipping) (Figure 3).
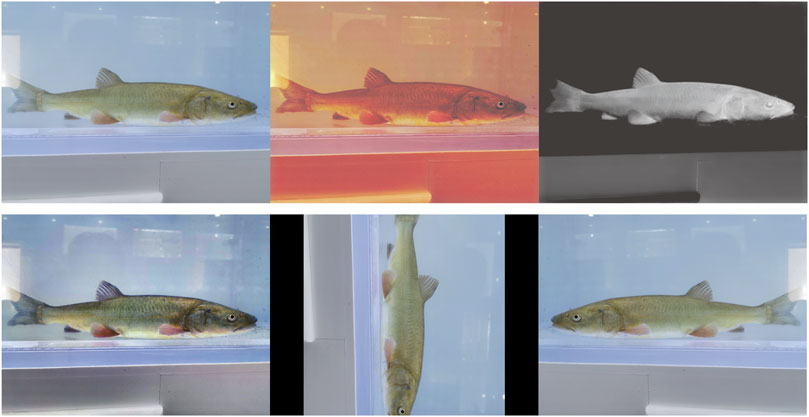
FIGURE 3. Example of dataset expansion. The first row from left to right shows the original image, Clahe enhancement, and Dark Channel Prior enhancement, whereas the second row from left to right shows the GBdehazingRCorrection enhancement, rotation, and flip.
The fish phenotypes were segmented into eight parts: body, eye, dorsal fin, pelvic fin, anal fin, caudal fin, pectoral fin, and head. The data images were manually annotated at the pixel level using Labelme annotation software to generate JSON files to store the tagging information and segment the information into label files by scripting. The dataset was randomly divided into a training and validation set with an 8:2 ratio. The labeled fish phenotype masks are shown in Figure 4, and the ratio of each phenotypic pixel in the fish phenotype segmentation dataset is shown in Figure 5.
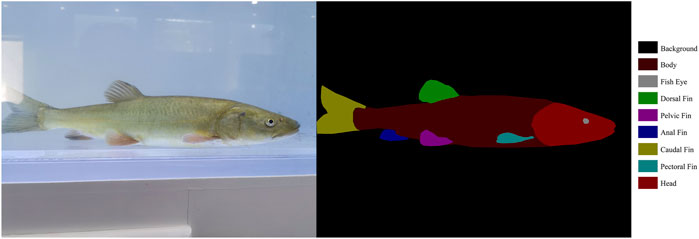
FIGURE 4. Fish phenotype mask.
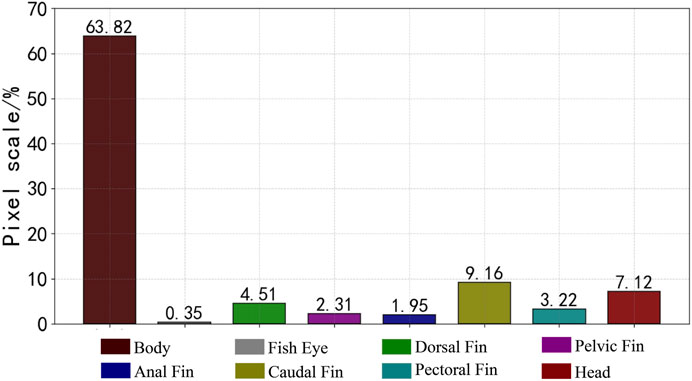
FIGURE 5. Histogram of fish phenotypic pixels.
3.2 Fish phenotype segmentation methods
3.2.1 UNet model
UNet (Ronneberger et al., 2015) is a fully convolutional neural network with U-shaped symmetry. The first half is a feature extraction network (encoder) comprising four downsampling modules, each going through two 3 × 3 ReLU convolutional layers and a 2 × 2 maxpooling layer to extract local features and obtain the target semantic information. The second half is the feature fusion network (decoder), comprising four upsampling modules. The feature maps of high-level semantic information generated by upsampling were stitched and fused with the feature maps of shallow-level semantic information generated in the corresponding phase of the first half through skip connection, thereby fully exploiting context information and enabling good segmentation results, even with limited image data. Therefore, the UNet semantic segmentation algorithm was chosen as the basis of this study and improved for fish phenotype segmentation for high-precision and fast segmentation of fish phenotypes.
3.2.2 Improved fish phenotypic segmentation model (RA-UNet)
Due to its advantages, the UNet semantic segmentation model can achieve higher image segmentation results. However, fish phenotype segmentation is often more complex than pedestrian and animal segmentation because different fin types are easily confused, and the size of each phenotype varies, causing poor segmentation of fish edges or missed segmentation of small-sized phenotypes. Therefore, the UNet network needs further improvement to enhance the ability to extract phenotypic features and improve detection precision. This improved network was named RA-UNet (Figure 6). Specific measures to improve the network were: 1) ResNet50 was adopted as the backbone feature extraction network, the network depth was increased, the feature information extraction ability of the model was enhanced, and the model performed more fine-grained segmentation of fish phenotypes. Moreover, the output layer of each ResNet module and the corresponding stage of the latter part of the decoder extended through the skip connection for feature splicing, ensuring shallow and deep information fusion of the network and improving the segmentation precision. 2) After completing each upsampling stage, the ASPP module was introduced in the second half of UNet to allow atrous convolution of four different sampling rates at 1, 6, 12, and 18. The features extracted from each sampling rate were processed in a separate branch and fused to maintain the same resolution of the feature map while extracting different scale perceptual fields to obtain multi-scale fish phenotypic information, which is conducive to localizing small-size phenotypes and edge recognition of large-size phenotypes. This process solved the problems of complex multi-scale target segmentation and inaccurate boundary prediction of different fin categories and improved the accuracy of model edge segmentation.
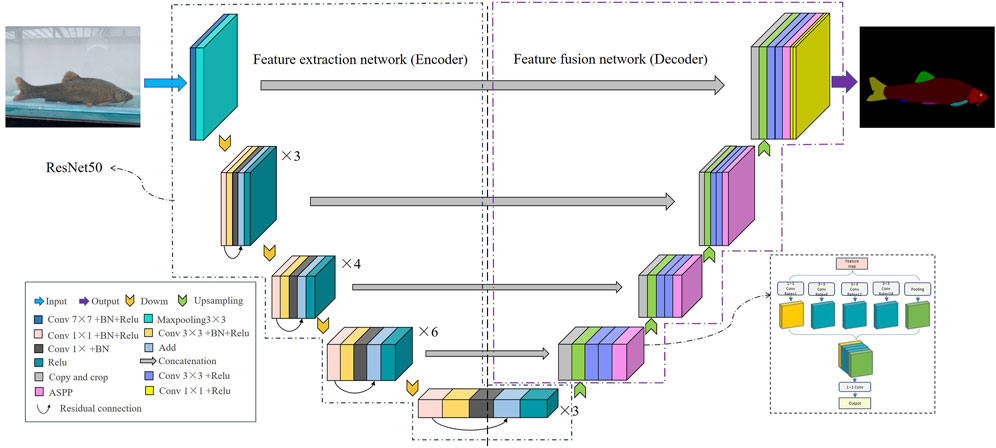
FIGURE 6. RA-UNet model structure.
3.2.2.1 Residual network structure module
ResNet has a residual module structure (He et al., 2016) and can form a deep network model by stacking multiple residual blocks. Additionally, ResNet can effectively avoid gradient disappearance and explosion while extracting features in depth. During model training, the deep network usually extracts high-level semantic information; therefore, an appropriate backbone network depth is critical. Two residual block types exist (Figure 7). Type A is when the number of input feature map channels matches the number of output channels. Type B is when the number of input channels does not match the number of output channels, and convolution is required to adjust the channel number. Each residual block comprises three convolutional layers of 1 × 1, 3 × 3, and 1 × 1, which are concatenated together. The residual block introduces the input data x directly into the output part of the later data layer by skipping F(x), thus preserving feature information of the previous layer in the feature map H(x) of the last layer. This process protects the integrity of the information and reduces the loss of fish phenotype feature information that arises from the conventional convolution and downsampling operations of UNet. Therefore, ResNet was built as the backbone extraction network of the coding region to improve the precision of fish phenotype segmentation.
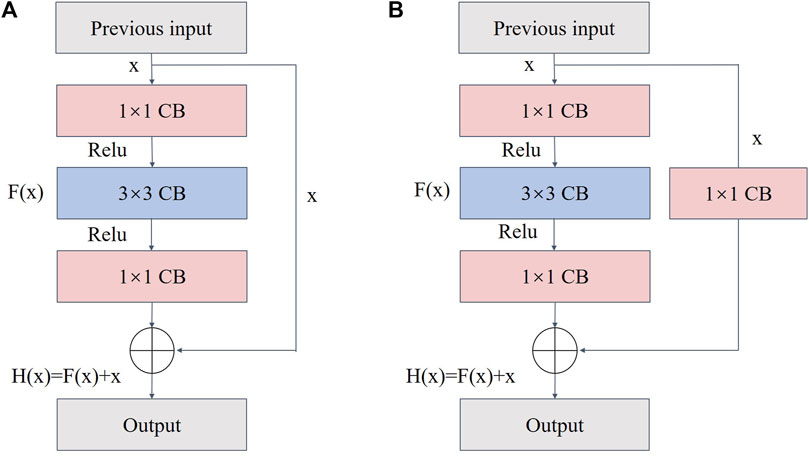
FIGURE 7. Structure of the residual block: (A) when the number of input channels matches the number of output channels and (B) when the number of input channels does not match the number of output channels.
3.2.2.2 Atrous spatial pyramid pooling
Fish phenotypes have different scales, causing unsatisfactory fish edge segmentation. To improve fish phenotype segmentation accuracy, we introduced ASPP into the UNet decoder to prevent information loss after convolution, achieve multi-scale feature extraction (Zhang and Zhang, 2022a; Zhang and Zhang, 2022b), and improve the accuracy of model edge segmentation. ASPP extracts multi-resolution feature responses in single-resolution branches using expansion convolution with different expansion rates. This feature extraction based on multi-resolution analysis enhances the multi-scale description capability of the network and expands the network field of view to focus on the contextual information around fish phenotypes, which is beneficial for discriminating different phenotypes (Zhang, 2022). ASPP comprises multiple parallel cavity convolution layers, which perform convolution and pooling operations on the input feature maps at four sampling rates of 1, 6, 12, and 18 (Figure 8). The results are then stitched together to fuse multi-scale semantic information and expand the number of channels. Subsequently, the number of channels is changed by 1 × 1 convolution for output, enabling the feature map to expand the perceptual field while ensuring high resolution and allowing each convolution output to contain an extensive range of feature information. This provides a complement for information missed after fish edge convolution and increases the accuracy and completeness of edge segmentation.
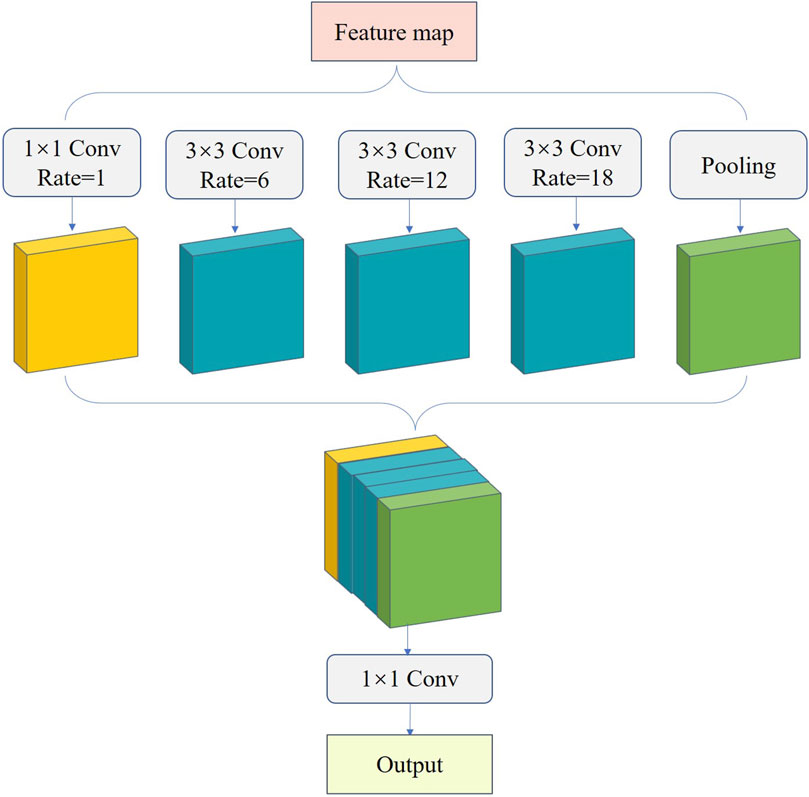
FIGURE 8. Atrous spatial pyramid pooling module.
4 Experimental and evaluation index
4.1 Experimental platform
The experimental platform was based on the Windows 10 operating system, and the computing equipment included an Intel(R) i7-11800H processor, GeForce RTX3080 GPU computing graphics card with 16 GB of video memory, CUDA version 11.3, and Python 3.7 programming language to perform a more accurate qualitative analysis of the experiments. The network was trained using the Pytorch 1.9 deep learning framework, and the training image size was standardized to 512 × 512. The model parameters are shown in Table 1.
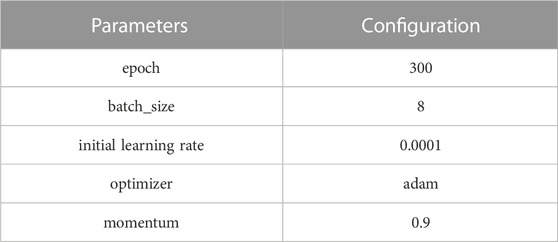
TABLE 1. Training model parameters.
4.2 Evaluation index
The Parameters, Giga Floating Point Operations (GFLOPs), mean intersection over union (mIoU) and mean pixel accuracy (mPA) were used as the evaluation indices to evaluate the segmentation performance of different semantic segmentation models objectively. The mIoU is the calculated and averaged intersection ratio (IoU) of actual and predicted values for each category, whereas the mPA is the sum of the proportion of correctly classified pixels to all pixels for each category. The mean values are calculated and averaged to determine the accuracy of the respective classification for each category,
where k+1 denotes the predicted category plus a background, and pij denotes the number of pixels in category i that are predicted to be in category j. Therefore, pii is a positive sample, pij is a false negative sample, and pji is a false positive sample.
5 Results analysis and discussion
5.1 Model comparison experiments
The same fish phenotype segmentation dataset was used for training and evaluation with current mainstream semantic segmentation models, namely, FCN (Long et al., 2015), PSPNet (Zhao et al., 2017), HRNet (Sun K. et al., 2019), Deeplabv3+ (Chen et al., 2018), UNet, Segformer (Xie et al., 2021), on the same experimental platform to reflect the advancements of the proposed algorithm and to verify that the performance of the proposed algorithm for fish phenotype segmentation is better than that of other semantic segmentation algorithms.
Table 2 shows the results of comparing different models for fish phenotypic segmentation precision. The FCN model had the lowest mIoU and mPA of 59.3% and 64.7%, respectively. The PSPNet and Deeplabv3+ semantic segmentation models did not perform as well as expected using limited datasets and shallow and deep semantic information on the segmentation targets. The better segmentation accuracy of the HRNet, UNet, and Segformer semantic segmentation models showed that these models had stable segmentation abilities even with small datasets and complex scenarios. However, the algorithm built in this study generally achieved the best precision index. The mIoU was 87.8% higher than that of the FCN, PSPNet, HRNet, Deeplabv3 +, UNet, and Segformer models, with increases of 28.5, 18.7, 7.5, 16.3, 5.0, and 3.5 percentage points, respectively. Moreover, the mAP was 92.3% higher than the FCN, PSPNet, HRNet, Deeplabv3 +, UNet, and Segformer models, with increases of 27.6, 17.5, 5.7, 13.5, 1.8, and 2.2 percentage points, respectively. The above results show that the algorithm model proposed in this study effectively improves the precision and accuracy of fish phenotype segmentation and is more adaptable than the other models to fish phenotype segmentation with limited datasets and complex scenarios so that each fish phenotype can be measured more accurately.
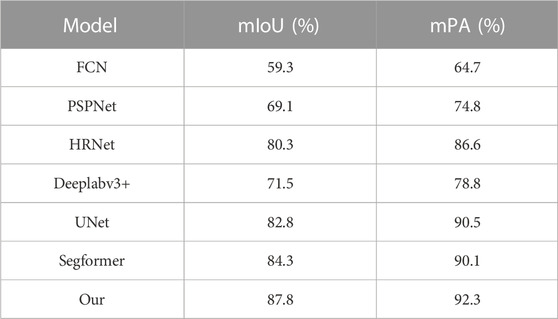
TABLE 2. Comparing the results of the different semantic segmentation models.
5.2 Experiments on the validity of model segmentation
To further verify the effectiveness and segmentation effect of the algorithm on fish phenotypes, the test set images were randomly selected as the prediction dataset to represent the actual segmentation effect of different models on each fish phenotype more intuitively. The target fish in Figure 9A is in the swinging state. FCN, PSPnet, and DeepLabv3 + did not recognize the small-scale fish eyes in the figure, and the anal fin phenotype was missed and misidentified. HRNet, UNet, and Segformer performed better, but none identified the small-scale pectoral fin on the other side of the fish. However, the algorithm built in this study was able to identify its edges. In Figures 9B,C, the FCN, PSPnet, HRNe, DeepLabv3 +, UNet, and Segformer segmentation algorithms suffered from a loss of fish phenotype feature information and blurred boundaries, e.g., the giant whiskers of the fish head in Figure 9C could not be segmented. However, the algorithm designed in this study could better segment the overall outline of each fish phenotype. The six semantic segmentation models could not identify the highly similar dorsal, pelvic, pectoral, and anal fin phenotypes and omitted small-scale fish eyes during segmentation (Figure 9D). In contrast, the algorithm built in this study could accurately identify and segment each fish phenotype. The six semantic segmentation models in Figure 9E were relatively rough in handling the details of each phenotype, with the two pectoral fins sticking together. However, the algorithm built in this study was clearer, more detailed, and complete in handling the edge details.
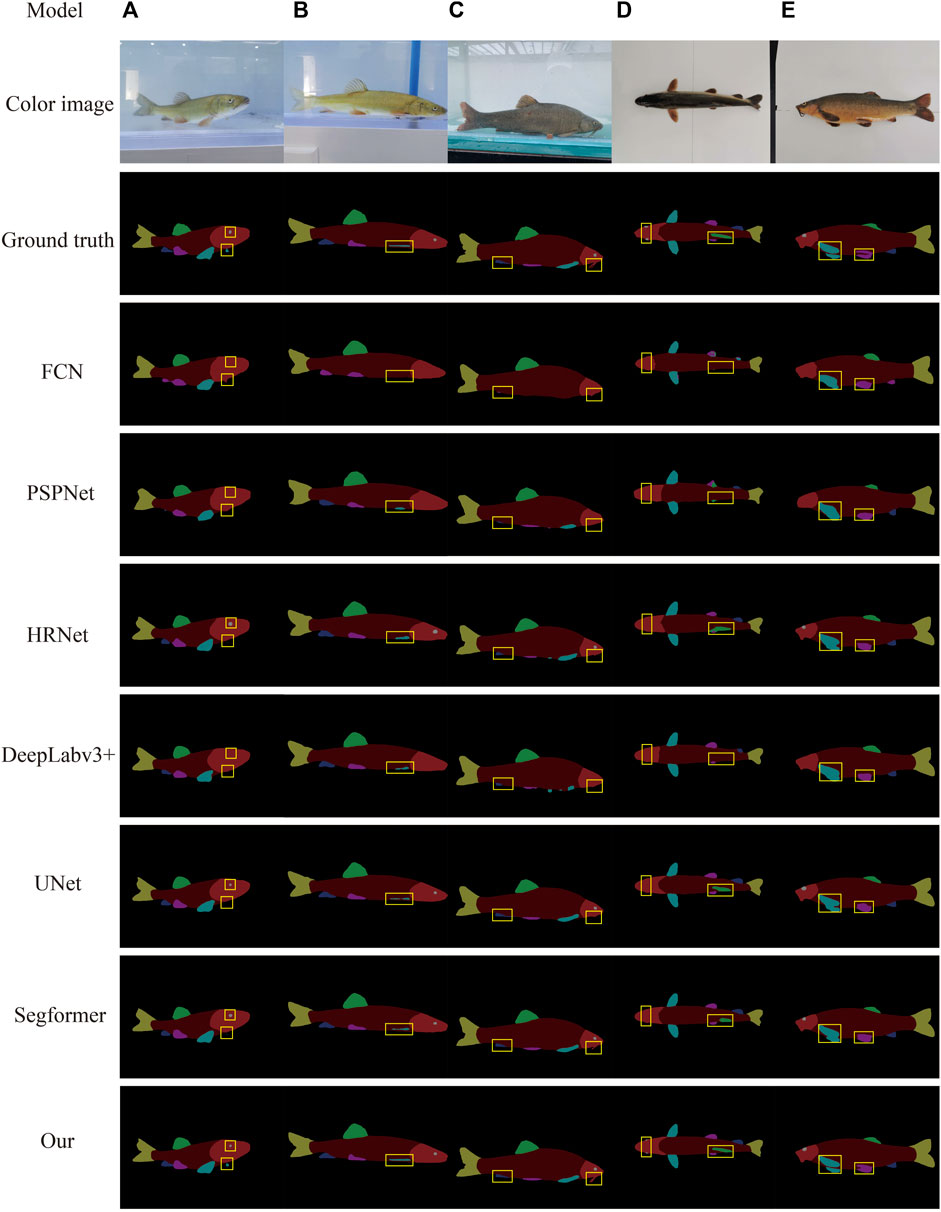
FIGURE 9. Different model segmentations. The first column in the figure shows the method. Columns (A–C) show the dynamic images, and columns (D–E) show the static images.
In summary, the method developed in this study improved the encoder and decoder parts of the UNet semantic segmentation algorithm by constructing the Resnet50 network as an encoder to extract image information. This resulted in a more pronounced improvement in the segmentation results and enhanced the segmentation precision of each phenotypic edge. The ASPP module was added to the decoder to highlight key features, reduce misclassification and omissions, and improve accuracy. Thus, the segmentation effect of the proposed algorithm was substantially better than that of the other methods regarding the prediction results. The proposed method can identify, segment fish phenotypes efficiently and accurately, and quickly obtain phenotype shape and size information, enabling aquaculture managers to monitor fish growth conditions promptly.
5.3 Ablation experiment
Four ablation experiments were performed with the same fish phenotype segmentation dataset in the same environment, and PA and IOU were calculated for each dataset category to analyze the different improvement strategies on each fish phenotype segmentation and to evaluate the complexity of the model to verify the algorithm improvement. Tables 3, 4 show the results of the model accuracy and complexity evaluation for the four groups of ablation experiments, respectively. Different improvement strategies had different enhancements to the baseline UNet semantic segmentation algorithm. After using the ResNet network as the encoder of the UNet algorithm, the IoU and mPA of each fish phenotype were improved. Although the mPA improvement was unnoticeable, compared with the Unet + ASPP algorithm, the IoU index for each phenotype improved substantially. The FLOPs were only 184.1G, 64.1 percentage points less than that of UNet, resulting in a 47.6 percentage point improvement in model inference speed owing to the reduced model computation, as most of the ResNet50 convolutional kernels were 1 × 1. Therefore, the ResNet module can improve fish phenotype segmentation accuracy and reduce the complexity of the model. Adding the ASPP module to the UNet decoder improved mIoU by 1.6 percentage points, improving the integrity of the target segmentation profile. Furthermore, mPA increased considerably by 1.4 percentage points, demonstrating that the improvement increases segmentation accuracy and reduces false detections at the cost of detection time. Overall, the comprehensive ability of the model in this study reached the optimum, with mIoU and mPA of 87.8% and 92.3%, respectively, 5.0 and 1.8 percentage points higher than the UNet model, and the computation required by the model in this paper is 47.2 percentage points lower. The inference speed was 15.1 percentage points higher than that of the UNet model, proving that the model in this study had better fish phenotype segmentation performance, could reduce noncontact fish phenotype measurement errors, and could more accurately analyze the fish phenotype proportion relationship in aquaculture.
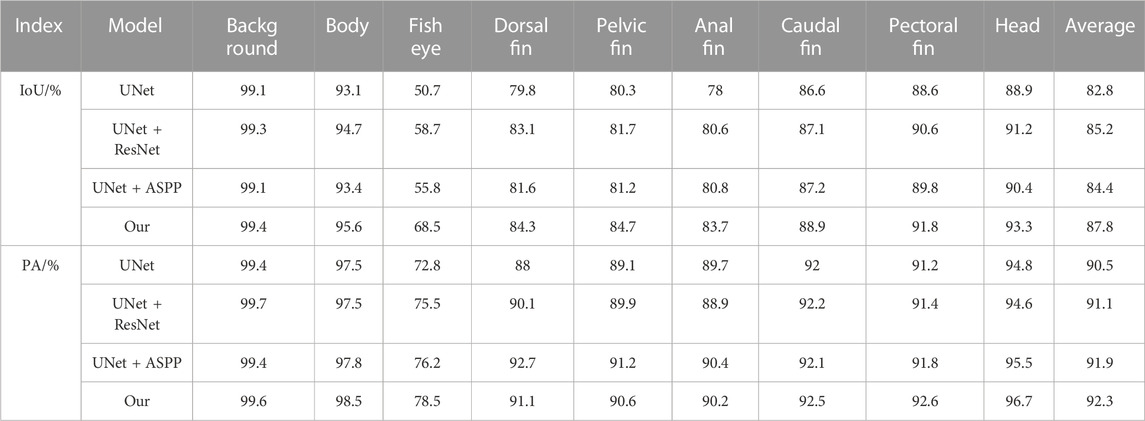
TABLE 3. Assessment table for model segmentation accuracy.
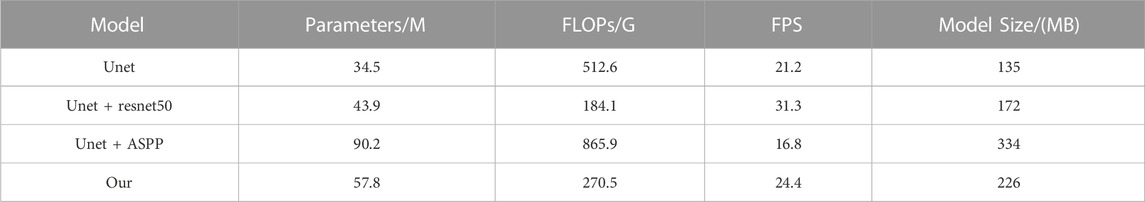
TABLE 4. Assessment table for model complexity.
5.4 Discussion
5.4.1 Index analysis
As the mainstream target semantic segmentation algorithms, the FCN, PSPNet, and Deeplabv3 + methods were unsatisfactory regarding the mIoU and mPA evaluation indices and had poor segmentation results for fish phenotypes. In contrast, HRNet, UNet, Segformer, and the proposed algorithm obtained a relatively satisfactory segmentation effect; therefore, we profiled the seven semantic segmentation algorithms on each phenotype metric. Figure 10A shows the IoU and PA indexes for each phenotype of the FCN algorithm. The FCN algorithm was better trained for the body, dorsal fin, caudal fin, and head phenotypes, presenting a high segmentation accuracy. However, the index values for the eye, pelvic fin, anal fin, and pectoral fin were relatively low, indicating that the FCN algorithm cannot segment these small targets, leading to incorrect and incomplete segmentation. Figures 10B,D show the IoU and PA indexes for each phenotype of the PSPNet and DeepLabv3 + algorithms, respectively. The two algorithms had better segmentation ability for the body, dorsal fin, pelvic fin, anal fin, caudal fin, pectoral fin, and head. However, the fish eye index had an extremely low value, with IoU values of 6.4% and 10.2% and IoU values of 6.5% and 10.5%, respectively. The FCN, PSPNet, and Deeplabv3 + algorithms are better at recognizing larger-sized phenotypic structures; however, slight variations in detail were observed within the pixel blocks between the fins when segmenting the pelvic fin, anal fin, pectoral fin, and eye. Moreover, the limited available information resulted in poor segmentation. Thus, the lower mIoU and mPA values were due to the weak segmentation recognition of small-scale phenotypes. This resulted in poor phenotypic evaluations for the fish eye, which decreased the mean values. From the pixel histogram of each phenotype, the fish eye had the lowest proportion of pixel points in the dataset, likely because of the uneven proportion of data across phenotypes. This likely led to the imbalance in the segmentation target recognition ability of the FCN, PSPNet, and Deeplabv3 + algorithms, illustrating the importance of a balanced sample size of different kinds of data. Image imbalance has also been studied (Zhang et al., 2021), and this aspect can be explored in the future to ensure the effectiveness of algorithm training.
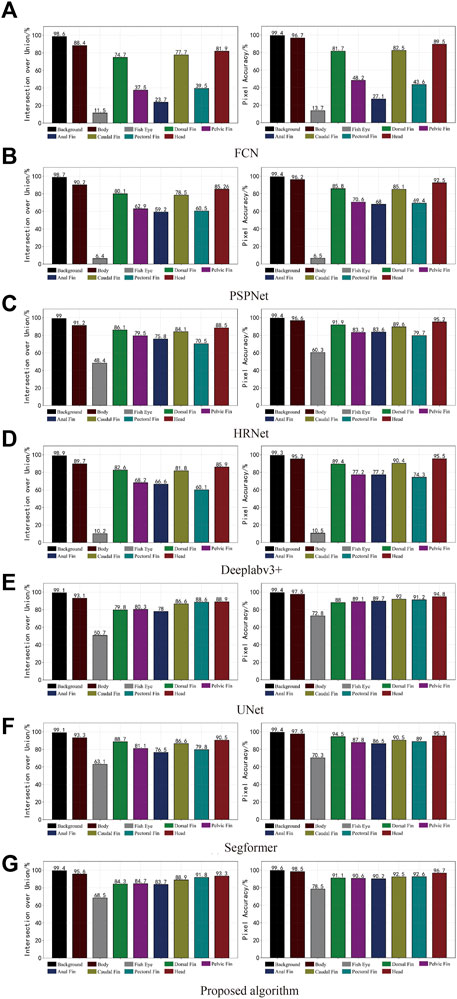
FIGURE 10. Phenotype indices for the different semantic segmentation models. The IoU for each fish phenotype is shown on the left, and the mPA for each is on the right.
Figure 10C, E, F show that the HRNet, UNet, and Segformer segmentation algorithms performed well overall. However, these algorithms were still problematic regarding missing edge information, especially a lack of useful semantic information in the graph. Because of the conventional convolution and downsampling processes used to reduce the feature map, the extracted semantic information was lost, fish eye and small-sized phenotypic data segmentation were more rounded, and the fins were connected. Thus, the angular shape of each fish phenotype could not be captured well, and a considerable amount of edge information on the phenotype was missing. Figure 10G shows that the algorithm presents an equilibrium state for each phenotype indicator, indicating that the algorithm has excellent segmentation ability for small- and large-scale phenotypes and can better handle fish phenotype segmentation with a limited dataset.
5.4.2 Generalization ability of the proposed model
Table 5 shows the experiments related to UNet and the algorithms using the PASCAL VOC 2012 benchmark dataset, a public dataset for world-class computer vision challenge image classification, detection, or semantic segmentation. This dataset included 1,464 images in the training set and 1,449 images in the validation set and contained 20 categories and 1 background. The algorithm proposed in this study had good generalization capability, with increased mIoU and mPA of 5.7 and 5.4 percentage points, respectively, compared to those of UNet. The proposed model also improved segmentation precision and accuracy in all categories and could obtain high-precision results for large-scale categories, such as aircraft, buses, and cars, indicating that the improved model can handle contour details better. The most significant improvement was achieved for small-scale targets, such as bicycles, bottles, dining tables, and horses. The mIoU and mPA improved by 6.2 and 6.5 percentage points for small-scale targets, respectively, compared with the UNet algorithm, indicating that the improved strategy of the algorithm built in this study can improve the accuracy and precision of small-scale category segmentation and increase the integrity of edges.
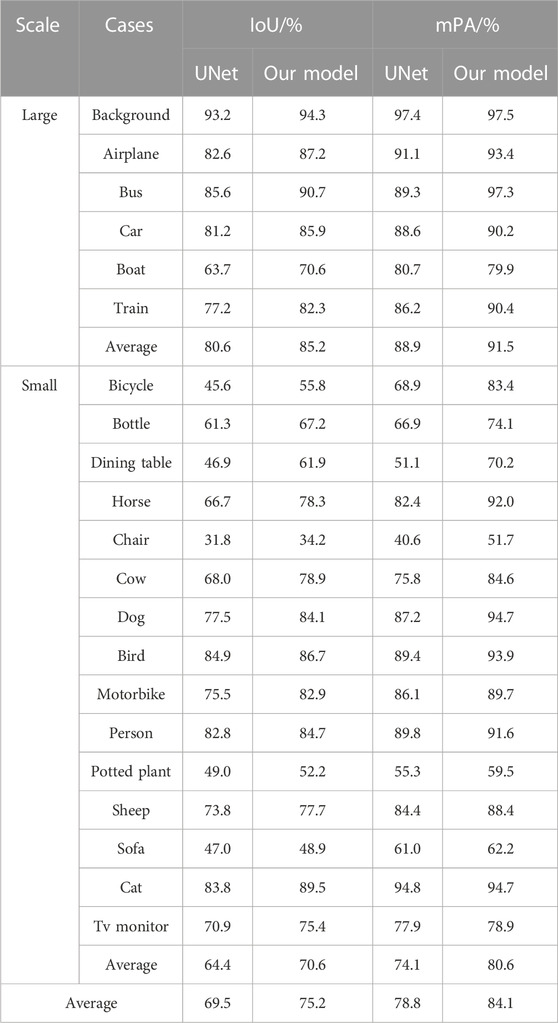
TABLE 5. PASCAL VOC 2012 comparison results.
The RA-UNet model had better segmentation ability and robustness and achieved high accuracy and precision due to optimizing the backbone feature extraction network and enhancing the decoder. Moreover, RA-UNet had a high generalization ability. Therefore, this can be applied to different scenes and datasets.
6 Conclusion
Existing segmentation methods cannot segment fish phenotypes quickly and accurately. Furthermore, manual observation causes problems such as consuming human and material resources, easy damage to fish, and high subjective influence. We propose an intelligent RA-UNet fish phenotype segmentation method based on residual network and multilayer parallel cavity convolution to improve the efficiency and accuracy of fish phenotype segmentation and reduce the perturbation to fish.
The RA-UNet feature extraction network comprises ResNet50, which reduces the loss of fish phenotypic feature information and boundary-blurring caused by conventional convolution and other operations and greatly reduces the network parameters, improving the detection speed. In addition, the ASPP module is integrated to expand the perceptual model field and improve the segmentation accuracy of fish phenotypic edges. We validated the feasibility and effectiveness of this method on a self-constructed fish phenotype segmentation dataset. The proposed method has higher accuracy than other semantic segmentation methods. With mIoU and mPA reaching 87.8% and 92.3%, respectively. We conducted fish phenotype segmentation experiments to verify the effectiveness of the proposed model in practice. The algorithm used in this study has the highest segmentation completeness, clear and complete phenotypic edges, and can quickly obtain phenotypic shape and size information. We also conducted an extensive ablation study to confirm the effectiveness of each technique. Finally, we discuss the generalization ability of the proposed model using the PASCAL VOC 2012 dataset for researchers in other directions. In the future, the model can be lightly processed and deployed in intelligent robots for directly measuring the phenotypic parts in an underwater environment, estimating weights, and assessing the distribution of fish growth stages in farms to promote the transformation of aquaculture to intelligence.
Data availability statement
The raw data supporting the conclusion of this article will be made available by the authors, without undue reservation.
Author contributions
JL: Conceptualization, Methodology, Software, Writing–original draft, Writing–review and editing. CL: Data curation, Investigation. ZY: Supervision, Conceptualization. XL and BW: Writing–review and editing. All authors contributed to the article and approved the submitted version.
Funding
This research was funded by the Key projects of intergovernmental international scientific and technological innovation cooperation (2022YFE0117400), the China Institute of Water Resources and Hydropower Research “Five Talents” special project (SD0145B032021), and the Youth Program of the National Natural Science Foundation of China (51809291).
Acknowledgments
Moreover, we would like to thank Tibet Fisheries Institute and a breeding and releasing station for their support in sample collection for dataset production.
Conflict of interest
Author ZY was employed by the company Huaneng Yarlung Zangbo Hydropower Development Co., Ltd.
The remaining authors declare that the research was conducted in the absence of any commercial or financial relationships that could be construed as a potential conflict of interest.
Publisher’s note
All claims expressed in this article are solely those of the authors and do not necessarily represent those of their affiliated organizations, or those of the publisher, the editors and the reviewers. Any product that may be evaluated in this article, or claim that may be made by its manufacturer, is not guaranteed or endorsed by the publisher.
References
Abinaya, N. S., Susan, D., and Sidharthan, R. K. (2022). Deep learning-based segmental analysis of fish for biomass estimation in an occulted environment. Comput. Electron. Agric. 197, 106985. doi:10.1016/j.compag.2022.106985
Alshdaifat, N. F. F., Talib, A. Z., and Osman, M. A. (2020). Improved deep learning framework for fish segmentation in underwater videos. Ecol. Inf. 59, 101121. doi:10.1016/j.ecoinf.2020.101121
An, D., Huang, J., and Wei, Y. (2021). A survey of fish behaviour quantification indexes and methods in aquaculture. Rev. Aquac. 13, 2169–2189. doi:10.1111/raq.12564
Chen, J., Zhang, Q. F., Zhang, A. Q., and Cai, D. S. (2019b). An in situ autonomous observation method based on abyssal fish identification. J. Jilin Univ. Eng. Ed. (03), 953–962. doi:10.13229/j.cnki.jdxbgxb20180160
Chen, L. C., Zhu, Y., Papandreou, G., Schroff, F., and Adam, H. (2018). “Encoder-decoder with atrous separable convolution for semantic image segmentation,” in Proceedings of the European conference on computer vision (Munich, Germany: Springer), 833–851.ECCV.
Chen, Y. Y., Gong, C. Y., Liu, Y. Q., and Fang, X. M. (2019a). Fish identification method based on FTVGG16 convolutional neural network. J. Agric. Mach. 05, 223–231. doi:10.6041/j.issn.1000-1298.2019.05.026
Cherkassky, V., and Ma, Y. (2004). Practical selection of SVM parameters and noise estimation for SVM regression. Neural Netw. 17, 113–126. doi:10.1016/S0893-6080(03)00169-2
Deng, H. B., Zhou, Y. C., Xu, T. Y., Miao, T., and Xu, J. (2019). Optimization of full convolutional network semantic segmentation of beef cattle images based on RGB-D. J. Agric. Eng. 18, 151–160. doi:10.11975/j.issn.1002-6819.2019.18.019
Gong, K., Liang, X., Li, Y., Chen, Y., Yang, M., and Lin, L. (2018). “Instance-level human parsing via part grouping network,” in Proceedings of the European conference on computer vision (Germany: ECCV), 805–822. doi:10.1007/978-3-030-01225-0_47
He, K., Sun, J., and Tang, X. (2010). Single image haze removal using dark channel prior. IEEE Trans. Pattern Anal. Mach. Intell. 33, 2341–2353. doi:10.1109/TPAMI.2010.168
He, K., Zhang, X., Ren, S., and Sun, J. (2016). “Deep residual learning for image recognition,” in Proceedings of the IEEE conference on computer vision and pattern recognition, 770–778.
Klapp, I., Arad, O., Rosenfeld, L., Barki, A., Shaked, B., and Zion, B. (2018). Ornamental fish counting by non-imaging optical system for real-time applications. Comput. Electron. Agric. 153, 126–133. doi:10.1016/j.compag.2018.08.007
Kong, Q., Du, R., Duan, Q., Zhang, Y., Chen, Y., Li, D., et al. (2022). A recurrent network based on active learning for the assessment of fish feeding status. Comput. Electron. Agric. 198, 106979. doi:10.1016/j.compag.2022.106979
Kontschieder, P., Rota Bulo, S. R., Bischof, H., and Pelillo, M. (2011). “Structured class-labels in random forests for semantic image labelling,” in In international conference on computer vision, Spain, 06-13 November 2011 (IEEE), 2190–2197.
Li, C., Quo, J., Pang, Y., Chen, S., and Wang, J. (2016). “Single underwater image restoration by blue-green channels dehazing and red channel correction,” in IEEE International Conference on Acoustics, Speech and Signal Processing, China, 20-25 March 2016 (IEEE), 1731–1735. doi:10.1109/ICASSP.2016.7471973
Li, J., Liu, C., Lu, X., and Wu, B. (2022b). CME-YOLOv5: An efficient object detection network for densely spaced fish and small targets. Water 14, 2412. doi:10.3390/w14152412
Li, W., Chakraborty, M., Fenner, D., Faber, J., Zhou, K., Rümpker, G., et al. (2022c). EPick: Attention-based multi-scale UNet for earthquake detection and seismic phase picking. Front. Earth Sci. 10, 2075. doi:10.3389/feart.2022.953007
Li, X., Hao, Y., Zhang, P., Akhter, M., and Li, D. (2022a). A novel automatic detection method for abnormal behavior of single fish using image fusion. Comput. Electron. Agric. 203, 107435. doi:10.1016/j.compag.2022.107435
Liang, X., Gong, K., Shen, X., and Lin, L. (2018). Look into person: Joint body parsing and pose estimation network and a new benchmark. IEEE Trans. Pattern Anal. Mach. Intell. 41, 871–885. doi:10.1109/TPAMI.2018.2820063
Liao, J., Chen, M. H., Zhang, K., Zou, Y., Zhang, S., and Zhu, D. Q. (2021). A crop seedling plant segmentation model based on regional semantics and edge information fusion. J. Agric. Mach. 12, 171–181. doi:10.6041/j.issn.1000-1298.2021.12.018
Lin, H. Y., Tseng, S. L., and Li, J. Y. (2022). SUR-Net: A deep network for fish detection and segmentation with limited training data. IEEE Sens. J. 22, 18035–18044. doi:10.1109/JSEN.2022.3195365
Liu, B., Wang, K. G., Li, X. M., Hu, C. H., Liu, Y., Cong, X., et al. (2021). Molecular evolution and characterization of hemagglutinin and neuraminidase of influenza A(H1N1)pdm09 viruses isolated in Beijing, China, during the 2017-2018 and 2018-2019 influenza seasons. J. Agric. Eng. 03, 179–189. doi:10.1007/s00705-020-04869-z
Liu, K. D., Xie, B., Zhai, Z. Q., Wen, C. K., Hou, S. T., and Li, J. (2020). Recognition of target muscle regions in sheep hind leg segmentation based on R2U-Net and cavity convolution. J. Agric. Mach. S2, 507–514. doi:10.6041/j.issn.1000-1298.2020.S2.063
Long, J., Shelhamer, E., and Darrell, T. (2015). “Fully convolutional networks for semantic segmentation,” in Proceedings of the IEEE conference on computer vision and pattern recognition (Boston, MA: IEEE), 3431–3440. doi:10.1109/TPAMI.2016.2572683
Ma, G. Q., Tian, Y. C., and Li, X. L. (2016). Application of K-mean clustering algorithm in color image segmentation of grouper with seawater background. Comput. Appl. Softw. 05, 192–195. doi:10.3969/j.issn.1000-386x.2016.05.048
Mei, Y., Sun, B., Li, D., Yu, H., Qin, H., Liu, H., et al. (2022). Recent advances of target tracking applications in aquaculture with emphasis on fish. Comput. Electron. Agric. 201, 107335. doi:10.1016/j.compag.2022.107335
Otsu, N. (1979). A threshold selection method from gray-level histograms. IEEE Trans. Syst. Man. Cybern. 9, 62–66. doi:10.1109/tsmc.1979.4310076
Raei, E., Akbari Asanjan, A. A., Nikoo, M. R., Sadegh, M., Pourshahabi, S., and Adamowski, J. F. (2022). A deep learning image segmentation model for agricultural irrigation system classification. Comput. Electron. Agric. 198, 106977. doi:10.1016/j.compag.2022.106977
Rafael, G., Ricard, P., Josep, Q., Alexander, T., Nuno, G., Shale, R., et al. (2019). Automatic segmentation of fish using deep learning with application to fish size measurement. ICES J. Mar. Sci. 4, 4. doi:10.1093/icesjms/fsz186
Reza, A. M. (2004). Realization of the contrast limited adaptive histogram equalization (CLAHE) for real-time image enhancement. J. VLSI SIG. Proc. Syst. 38, 35–44. doi:10.1023/B:VLSI.0000028532.53893.82
Ronneberger, O., Fischer, P., and Brox, T. (2015). “U-net: Convolutional networks for biomedical image segmentation,” in International Conference on Medical image computing and computer-assisted intervention (Cham: Springer), 234–241. doi:10.1016/j.compbiomed.2021.104699
Saifullah, S., Suryotomo, A. P., and Yuwono, B. (2021). Fish detection using morphological approach based-on K-means segmentation. Compiler 10. doi:10.28989/compiler.v10i1.946
Shao, Z., Zhang, X., Zhang, T., Xu, X., and Zeng, T. (2022). RBFA-Net: A rotated balanced feature-aligned network for rotated sar ship detection and classification. REMOTE Sens. 14 (14), 3345. doi:10.3390/rs14143345
Sun, K., Xiao, B., Liu, D., and Wang, J. (2019b). “Deep high-resolution representation learning for human pose estimation,” in Proceedings of the IEEE/CVF conference on computer vision and pattern recognition (Long Beach, CA: IEEE), 5686–5696. doi:10.1109/CVPR.2019.00584
Sun, L. Q., Liu, T., Chen, S. H., and Wu, Y. H. (2019a). Research on multi-objective fish object proposal detection algorithm. J. Agric. Mach. 12, 260–267. doi:10.6041/j.issn.1000-1298.2019.12.030
Sun, L. Q., Sun, X. B., Wu, Y. H., and Luo, B. (2021). A DRN-Faster R-CNN based multi-target fish detection model for complex backgrounds. J. Agric. Mach. 52, 245–251. + 315. doi:10.6041/j.issn.1000-1298.2021.S0.030
Taheri-Garavand, A., Fatahi, S., Banan, A., and Makino, Y. (2019). Real-time nondestructive monitoring of common carp fish freshness using robust vision-based intelligent modeling approaches. Comput. Electron. Agric. 159, 16–27. doi:10.1016/j.compag.2019.02.023
van den Heuvel, M., Mandl, R., and Hulshoff Pol, H. (2008). Normalized cut group clustering of resting-state FMRI data. PLOS ONE 3, e2001. doi:10.1371/journal.pone.0002001
Vayssade, J. A., Jones, G., Gée, C., and Paoli, J. N. (2022). Pixelwise instance segmentation of leaves in dense foliage. Comput. Electron. Agric. 195, 106797. doi:10.1016/j.compag.2022.106797
Wang, H., Zhang, S., Zhao, S., Lu, J., Wang, Y., Li, D., et al. (2022). Fast detection of cannibalism behavior of juvenile fish based on deep learning. Comput. Electron. Agric. 198, 107033. doi:10.1016/j.compag.2022.107033
Xie, E., Wang, W., Yu, Z., Anandkumar, A., Alvarez, J. M., and Luo, P. (2021). SegFormer: Simple and efficient design for semantic segmentation with transformers. Adv. Neural Inf. Process Syst. 34, 12077–12090. doi:10.48550/arXiv.2105.15203
Xu, W., Zhu, Z., Ge, F., Han, Z., and Li, J. (2020). Analysis of behavior trajectory based on deep learning in ammonia environment for fish. Sensors 20, 4425. doi:10.3390/s20164425
Yang, L., Yu, H., Cheng, Y., Mei, S., Duan, Y., Li, D., et al. (2021). A dual attention network based on efficientNet-B2 for short-term fish school feeding behavior analysis in aquaculture. Comput. Electron. Agric. 187, 106316. doi:10.1016/j.compag.2021.106316
Zhang, L., Wang, J., and Duan, Q. (2020). Estimation for fish mass using image analysis and neural network. Comput. Electron. Agric. 173, 105439. doi:10.1016/j.compag.2020.105439
Zhang, T. (2022). Research on SAR image ship detection and recognition technology based on deep learning [D]. China: University of Electronic Science and Technology.
Zhang, T., and Zhang, X. (2022b). A full-level context squeeze-and-excitation ROI extractor for SAR ship instance segmentation. IEEE GEOSCIENCE REMOTE Sens. Lett. 19, 1–5. doi:10.1109/LGRS.2022.3166387
Zhang, T., and Zhang, X. (2022a). A mask attention interaction and scale enhancement network for SAR ship instance segmentation. IEEE Geoscience Remote Sens. Lett. 19, 1–5. doi:10.1109/LGRS.2022.3189961
Zhang, T., and Zhang, X. (2021). A polarization fusion network with geometric feature embedding for SAR ship classification. Pattern Recognit. 123, 108365. doi:10.1016/j.patcog.2021.108365
Zhang, T., and Zhang, X. (2019). High-speed ship detection in sar images based on a grid convolutional neural network. Remote Sens. 11 (10), 1206. doi:10.3390/rs11101206
Zhang, T., Zhang, X., Liu, C., Shi, J., Wei, S., Ahmad, I., et al. (2021). Balance learning for ship detection from synthetic aperture radar remote sensing imagery. ISPRS J. Photogrammetry Remote Sens. 182, 190–207. doi:10.1016/j.isprsjprs.2021.10.010
Zhang, T., Zhang, X., Shi, J., and Wei, S. (2019). Depthwise separable convolution neural network for high-speed sar ship detection. Remote Sens. 11, 2483. doi:10.3390/rs11212483
Zhao, H., Shi, J., Qi, X., Wang, X., and Jia, J. (2017). “Pyramid scene parsing network,” in Proceedings of the IEEE conference on computer vision and pattern recognition (Hawaii, United States: IEEE), 6230–6239. doi:10.1109/CVPR.2017.660
Zhao, S., Zhang, S., Lu, J., Wang, H., Feng, Y., Shi, C., et al. (2022a). A lightweight dead fish detection method based on deformable convolution and YOLOV4. Comput. Electron. Agric. 198, 107098. doi:10.1016/j.compag.2022.107098
Zhao, T., Shen, Z., Zou, H., Zhong, P., and Chen, Y. (2022b). Unsupervised adversarial domain adaptation based on interpolation image for fish detection in aquaculture. Comput. Electron. Agric. 198, 107004. doi:10.1016/j.compag.2022.107004
Zhou, B., Lu, G., and Li, S. (1995). Measurement method of body length of freshwater cultured fish. J. Shanghai Aquac. Univ. 02, 147–151.
Zhou, C., Zhang, J. J., Gong, C. C., and Ding, H. H. (2022). Intelligent identification of tunnel water leakage based on deep semantic segmentation. J. Rock Mech. Geotech. Eng. 10, 2082–2093. doi:10.13722/j.cnki.jrme.2022.0016
Zhu, L. X., Wu, R. D., Fu, G. P., Zhang, S. A., Yang, D. Y., Chen, T. C., et al. (2022). Lightweight UNet banana image segmentation based on multi-scale tandem cavity convolution. J. Agric. Eng. 13, 194–201.
Keywords: fish phenotypic segmentation, RA-UNet, fishery resources, Resnet50, ASPP
Citation: Li J, Liu C, Yang Z, Lu X and Wu B (2023) RA-UNet: an intelligent fish phenotype segmentation method based on ResNet50 and atrous spatial pyramid pooling. Front. Environ. Sci. 11:1201942. doi: 10.3389/fenvs.2023.1201942
Received: 07 April 2023; Accepted: 14 July 2023;
Published: 13 September 2023.
Edited by:
Isa Ebtehaj, Université Laval, CanadaReviewed by:
Xiaoling Zhang, University of Electronic Science and Technology of China, ChinaHaiping Liu, Southwestern University, China
Copyright © 2023 Li, Liu, Yang, Lu and Wu. This is an open-access article distributed under the terms of the Creative Commons Attribution License (CC BY). The use, distribution or reproduction in other forums is permitted, provided the original author(s) and the copyright owner(s) are credited and that the original publication in this journal is cited, in accordance with accepted academic practice. No use, distribution or reproduction is permitted which does not comply with these terms.
*Correspondence: Chunna Liu, liucn@iwhr.com