 Dandan Wang
 Lingyan Xu
 Jianguo Du
94% of researchers rate our articles as excellent or good
Learn more about the work of our research integrity team to safeguard the quality of each article we publish.
Find out more
ORIGINAL RESEARCH article
Front. Environ. Sci., 28 July 2023
Sec. Environmental Economics and Management
Volume 11 - 2023 | https://doi.org/10.3389/fenvs.2023.1197048
This article is part of the Research TopicLow-Carbon Transformation for Sustainable DevelopmentView all 14 articles
Introduction: Economic development is not simply the accumulation of elements, but the improvement of efficiency, which is supported by infrastructure construction. In particular, the urban green and smart development (UGSD) in recent years has put forward higher requirements for infrastructure, and domestic trade as well as opening-up are of great significance during the process.
Methods: Based on the panel data of 221 prefecture-level cities in China from the year of 2005 to 2019, this paper adopts the undesirable SBM model and GML index to measure the level of UGSD. Then the spatial Durbin model is conducted to explore the direct spatial spillover effects and the spatial decomposition effects of energy, transportation, and information infrastructure on UGSD. Considering the context of dual cycle, the indirect effects of domestic trade and opening-up between infrastructures and UGSD are further analyzed.
Results: Results show that UGSD demonstrates strong spatial agglomeration and maintains a stable spatial positive correlation with different spatial matrices. In general, energy and transportation infrastructure show positive spatial spillover effects on UGSD. By contrast, information infrastructure presents positive spatial spillover effect on UGSD on the whole, while shows insignificant and negative spatial spillover effect with geographical distance matrix. Furthermore, the mediation effect indicates that both transportation and information infrastructure mainly promote local and adjacent cities’ UGSD through domestic trade with economic distance matrix. By contrast, energy infrastructure exerts positive spatial spillover effect on UGSD through weakening the negative impact of opening-up.
Discussion: The conclusions of the research show that it is necessary to construct infrastructure in a reasonable way, strengthen the positive spillover effect of intercity factors, and promote the two-wheel driving effect of domestic trade and opening-up on the relationship between infrastructure and UGSD.
China’s current economic model is shifting to the stage of high-quality development (Xu et al., 2022); carbon peaking and carbon neutralization have put forward higher requirements for the green and low-carbon transformation of the economy. Green and smart development which includes resource conservation, ecological protection, and environmental governance (Du et al., 2020; Xu et al., 2021; Liao and Li, 2022) has become the crucial means to solve the contradiction between rapid economic growth and environmental problems (Li et al., 2019; Shamsuzzoha et al., 2021). Furthermore, as an important carrier, great importance has been attached to the role of infrastructures in achieving high-quality development. Under the dual background of the accelerated development of infrastructure and low-carbon economic transformation, it is urgent to explore the logical framework between infrastructures and urban green and smart development (UGSD), which responds to the realistic demand of China’s high-quality economic development.
UGSD is a sustainable development mode, considering the constraint of resource and environmental capacity, which includes economic, energy, and other elements (Hao and Zhu, 2019; Moura and Silva, 2019; Jiang et al., 2021; Liao and Li, 2022). As such, many comprehensive evaluation indexes from multi-dimensional and multi-level perspectives were conducted to analyze the level and evolution characteristics of UGSD, and the data envelopment analysis (DEA) was primarily adopted to measure UGSD (Hao and Zhu, 2019; Du et al., 2020). Furthermore, the green total factor productivity (GTFP) containing energy consumption and undesirable output could estimate the efficiency of DMU (Decision-Making Unit) from the perspective of input-output, which is an objective and effective method (Liu et al., 2016; Jiang et al., 2021). Therefore, it has become an important criterion to measure UGSD due to its stronger inclusiveness (Yuan and Liu, 2019; Xu et al., 2022). As for the influencing factors of UGSD, existing literature mainly explored the impact of FDI (Gao et al., 2022; Xu et al., 2022), economic agglomeration (Hao et al., 2022), environmental regulation (Feng et al., 2021), and technological progress (Sun et al., 2022) on UGSD. Additionally, the technological innovation and information level would also effectively promote urban governance and service efficiency besides the energy element and release their supporting role for UGSD (Xu et al., 2021; Han et al., 2023).
UGSD also requires carriers to achieve corresponding goals, among which infrastructures are fundamental (Nondo, 2018). As the balanced growth theory points out, infrastructure is a prerequisite for economic growth (Chen et al., 2020), and it could promote urban transformation through the optimization of industrial structure and the structure upgrading of energy consumption (Xu et al., 2021). Studies have shown that infrastructure plays an important role in promoting urban development, especially in regional innovation, economic growth, and green development (Bronzini and Piselli, 2009; Bresson et al., 2016; Wang J et al., 2022; Zhang and Zhou, 2023), and the positive effect is more significant in lagging areas (Odongo and Kalu, 2016). As the representative scholar Aschauer (1989) pointed out, the stock of infrastructure such as highways and airports has a strong explanation for economic growth, which has been largely supported in later research. For instance, Bronzini and Piselli (2009) and Álvarez-Ayuso et al. (2011) found that infrastructure showed a positive impact on total factor productivity, and this conclusion worked well in both Italy and Mexico. Nondo (2018) focused on 26 African countries and found that infrastructure development is conducive to economic growth. With a large population and uncompleted urbanization, infrastructure construction is an inherent demand for economic and social development in China. As such, China’s cities have actively deployed key infrastructure construction related to energy, transportation, and information, recently, to provide fundamental support for UGSD. Demurger et al. (2001) found that the stock of infrastructure, especially transportation infrastructure, is an important factor affecting the difference in economic growth performance among regions in China. Liu and Hu (2010) also affirmed the positive role of infrastructure on economic growth. Furthermore, infrastructure could release spatial spillover effects by promoting the flow of the production factor and extending the externality to the development of adjacent regions (McCartney, 2022). Additionally, infrastructure could also promote urban accessibility and facilitate technological innovation, which is conducive to evoking spatial preferences and agglomeration (Xie, 2018; Zeng et al., 2019). Konno et al. (2021) empirically analyzed the productivity effects of road infrastructure incorporating spatial spillover effects using a global database, and the statistical tests suggest that the direct impact of road infrastructure is significantly negative, the spatial spillover effect is significantly positive, and the overall effect is positive but insignificant. Marinos et al. (2022) applied a dynamic Durbin spatial model to estimate the spatial spillover effect of transportation infrastructures in the Greek economy, and results showed that the spillover effects of transport infrastructures are present and statistically significantly affect the regional product. Wang J et al. (2022) took the traffic infrastructure of 41 prefecture-level cities in the Yangtze River Delta as research objects and found that the transportation infrastructure of each city not only drives its own economic growth but also has a positive spatial spillover effect on the economic growth of adjacent areas. Previous research has given large evidence for the significance of infrastructure, which provided valuable experiences for our studies. However, the element input of infrastructure construction and the waste brought by reproduction may lead to more pollution, and the scale economy caused by factor agglomeration might also result in resource allocation distortion and inefficient utilization (Kong et al., 2018; Akbar et al., 2021; Yang et al., 2021), which would cause potential inhibition on UGSD. For example, Puga (2002) pointed out that the growth of infrastructure such as energy and transportation aggravated environmental pollution, which further threatened the health of residents. Furthermore, transportation infrastructure could reduce logistics costs and promote resource circulation, while also accelerating the resource flow to large cities. In consequence, the siphon effect and the differentiation degree of the regional economy would be deepened (Zhang et al., 2018).
Except for the direct effect, scholars have also explored the indirect effect from multiple perspectives. Li and Yao (2022) found that digital infrastructure investment mainly promotes the green growth of manufacturing by promoting technological progress and technological efficiency. Moreover, the mechanism of industrial and talent agglomeration (Cheng and Hu, 2019; Liu et al., 2022) and international trade (Peng et al., 2021) have also been explored between infrastructure and UGSD. As a result, infrastructure could enhance the intercity connections by factor flow, and the spatial spillover effect of infrastructure on UGSD would be further strengthened. The report of the 20th National Congress of the Communist Party of China further emphasized the construction of transportation and network infrastructure as an important direction for the “double cycle” development pattern. However, the roles of domestic trade and opening-up, especially under the dual circulation development mode of international and domestic markets, have not been given enough attention.
Accordingly, existing literature mainly explores the influencing factors of UGSD from the perspective of the economy, environmental regulation, and innovation, which ignores the important role that infrastructure may play. Furthermore, previous literature provides abundant evidence for understanding the direct impact of specific infrastructure on UGSD and provides a preliminary analysis of its spatial spillover effects. However, it is worth emphasizing that these studies have neglected the spatial spillover impacts of different infrastructures on UGSD from both direct and indirect perspectives. As for the influencing mechanism, previous literature mostly focused on innovation or international trade. Under the context of the double cycle, urban green development has ushered in a new opportunity; however, the roles of domestic trade and opening-up between infrastructure and UGSD have not been explored in depth. Therefore, a more comprehensive perspective considering both domestic and international lenses needs to be deeply explored. Finally, in existing related research, few works of literature consider the heterogeneous spatial correlation of variables, which may lead to bias in the conclusion.
Compared with existing studies, the possible marginal contributions of this study are as follows. First, we expand the research framework for the analysis of the influencing factors of UGSD from the perspective of different infrastructures. Figuring out the comprehensive roles of infrastructure construction and UGSD is the production basis for understanding the transformation of the economic development model. Second, we provide reliable empirical support for understanding the important role of domestic trade and opening-up in the process of transitioning to green and smart development. Furthermore, we expand the spatial empirical model, taking into account the geographical adjacency matrix, geographical distance matrix, and economic distance matrix to explore the heterogeneous relation between infrastructure and UGSD. The remaining parts of this study are organized as follows. Section 2 provides a theoretical analysis and research hypotheses. Section 3 introduces the research design and variable description of this research. Section 4 shows the empirical results and detailed analysis of the spatial spillover effects, decomposition effects, and mediation effects of domestic trade and opening-up. Furthermore, the discussion and robustness test are shown. Section 5 presents the conclusions, implications, limitations, and future work of this study.
Due to the complex economic relations among cities, adjacent cities often interact with each other in the process of social and economic development. Meanwhile, adjacent cities are more likely to learn about others’ successful governance experience, which is conducive to strengthening the circulation and integration of resources and elements among them. As the critical foundation of UGSD, infrastructure could affect UGSD through trade exchange, learning by imitation, and innovation spillover among regions. According to the functional standards, infrastructure can be divided into three types: economic infrastructure, social infrastructure, and administrative infrastructure. Considering the research characteristics of this paper, such as externality and network properties, and the availability of data, the economic infrastructure including energy, transportation, and information was selected.
Energy infrastructure provides important public products such as thermal power stations and hydroelectric stations for social production and operation. It is the foundation of social production and is of great significance to the sustainable development of cities (Xie, 2018). Energy supply and demand among cities are mostly constrained by resource endowment, geographical conditions, and other factors. As such, energy infrastructure, especially the construction of renewable energy, could optimize energy consumption structure and ease the imbalance of energy supply and demand among cities (Guo et al., 2021), which is beneficial to releasing the positive spatial spillover effect among cities. In addition, there is heterogeneity in industrial structure among cities, and the intensity impact of energy infrastructure on different industries is also heterogeneous (Gao and Yue, 2020). For example, energy infrastructure projects such as power transmission from the West to the East in China could deliver clean and high-quality power to the eastern region, driving the economic development of western cities while promoting industrial adjustment and easing the energy shortage in the eastern cities (Han et al., 2020). Therefore, energy infrastructure is beneficial in promoting the complementation of resources and realizing the mutual development of the economy and environment among regions.
Transportation infrastructure is characterized by the network’s external characteristics, which have a radiation effect on the development of adjacent areas. The construction of transportation logistics is constantly strengthened and the social division of labor is refined, which is conducive to regional economic growth, and transportation infrastructure directly promotes economic growth through the amplification of the investment multiplier (Wang L et al., 2022). On the one hand, transportation infrastructure could improve the accessibility and attraction of cities, and promote the flow of urban resources and elements (Xie, 2018; Wang L et al., 2022), which creates opportunities to learn advanced technology for urban green transformation. On the other hand, transportation infrastructure could also strengthen regional integration and optimize resource allocation among cities, thus promoting scale economics and improving urban productivity and living efficiency (Hao and Zhang, 2021). Therefore, transportation infrastructure would initiate a positive spatial spillover effect, which is conducive to achieving mutual development of local and adjacent cities.
Information infrastructure could extend the width and breadth of information sharing and reduce the cost of information acquisition. The improvement of information infrastructure is conducive to breaking regional market restrictions and reducing coordination costs of enterprises, which is crucial to regional integrated market construction and beneficial to improving production efficiency through scale and intensive economy (Zhao et al., 2020). Furthermore, the upgrading and optimization of information infrastructure could break through temporal-spatial boundaries to promote resource matching degree and industrial agglomeration (Han et al., 2022). Also, information infrastructure provides a platform for joint technological innovation, which is conducive to achieving complementation of green technology and service among cities and improving the conversion rate of scientific and technological achievements (He and Ren, 2018; Yang and Liu, 2018). Therefore, information infrastructure creates favorable conditions for the flow of elements, enhancing the spatial spillover effect on adjacent cities.
Based on the above analysis, the following hypotheses are proposed:
H1. Energy infrastructure has a positive spatial spillover effect on UGSD.
H2. Transportation infrastructure has a positive spatial spillover effect on UGSD.
H3. Information infrastructure has a positive spatial spillover effect on UGSD.
In recent years, the Chinese government has built a new development pattern with the domestic great circulation as the main body and the domestic and international double circulation promoting each other. In domestic circulation, supply-side reform, industrial structure optimization, and scientific and technological innovations are the fulcrum to smoothen the internal circulation system and provide an inexhaustible driving force for economic development. At the same time, great importance has been attached to the support and guarantee function of the international circulation for the “double cycle,” promoting a higher-level opening strategy by deeply integrating into the global value division of the labor system. However, the roles of domestic trade and opening-up between infrastructure and UGSD have not been explored in depth. As such, domestic trade and opening-up are selected to analyze the indirect effect of infrastructure on UGSD.
Economic infrastructure provides the foundation for urban production and factor flow, which create favorable conditions for mutual development among cities (Xu et al., 2021). From the perspective of trade costs, infrastructure could lower transportation costs, reduce losses caused by information asymmetry, and improve resource allocation efficiency (Liu et al., 2020). As such, the domestic trade scale could be expanded and the trade structure could be optimized. Moreover, infrastructure also promotes product trade through the complementation of supply-demand among cities, enhancing the coordinated development of the regional economy and optimizing the spatial distribution of domestic industries.
The impact of domestic trade on UGSD could be reflected in the following aspects. First, domestic trade could affect UGSD through the spatial spillover effect. Inter-city trade provides opportunities to gain advanced knowledge, technology, and governance experience, which might affect cities’ industrial structure, economic growth, and competitive advantage. Furthermore, the element introduction from other cities could strengthen the positive effect of technological innovation on UGSD through the spillover effect (Zhang, 2021). Second, domestic trade could affect UGSD through the scale effect. That means domestic trade could affect UGSD by broadening the trade scale, enhancing intercity connection and economic integration, thus promoting urban productivity efficiency (Ma et al., 2019). Third, domestic trade could affect UGSD through the competitive effect. In a market-oriented economy, cities as supposed to improve productivity and reduce costs by encouraging product and technological innovation and reducing outdated manufacturing facilities, which is conducive to maintaining their competitiveness in domestic and overseas. Therefore, the level of UGSD could be improved.
Infrastructure could promote domestic trade based on its carrier function, which further makes a difference to UGSD. For example, energy and transportation infrastructure could reduce logistic costs and enhance the complementation of supply-demand (Xie, 2018; Guo et al., 2021). As such, UGSD could be promoted through element conversion and industry upgrading. Furthermore, information infrastructure lays a solid foundation for information sharing, providing basic support for promoting the scope and speed of information exchange among cities (Ma et al., 2019). Thereby, green economic growth could be achieved through the spillover effect of knowledge as well as productive elements (Huang et al., 2019; Zhao et al., 2020).
Based on the above analysis, the following hypotheses are proposed:
H4. Infrastructure promotes UGSD through domestic trade.
H4a. Energy infrastructure promotes UGSD through domestic trade.
H4b. Transportation infrastructure promotes UGSD through domestic trade.
H4c. Information infrastructure promotes UGSD through domestic trade.
Well-designed infrastructure could reduce the hidden cost and risk for foreign investors in transportation distance, informational island, and energy supply, thus improving the possibility of project operation profitability. The improvement of infrastructure is conducive to accelerating industrial agglomeration, promoting production convergence, reducing innovation costs, and attracting high-quality foreign investment (Tian and Li, 2019; Hao et al., 2022). For instance, information infrastructure could break market restrictions among cities, optimize the structure of opening-up, and enhance the attractiveness of international resources (Huang et al., 2019). Additionally, the development and application of information technology would reduce the revenue loss caused by time delay, which is beneficial to deepening the global division of labor and cooperation, promoting international trade interaction, and absorbing advanced experience (He and Ren, 2018).
Research has tested that expanding openness could exert bilateral impacts on China’s environment and economy. Proponents of the “Pollution Paradise Hypothesis” argue that local governments are inclined to lower environmental standards to attract foreign investment (Zhang, 2016), which may lead to environmental pollution problems. However, the opening economy could also bring advanced technologies, promote local industrial structure, and unleash knowledge spillover effects (Gao et al., 2022), which help to facilitate urban green transformation through technological innovation as well as the upgrading of production elements (Yoon and Nadvi, 2018). These findings support the “Pollution Halo Hypothesis.”
Opening economies emphasize the utilization and interaction of foreign resources, and infrastructure provides a convenient condition and fundamental support for element flow (Mao, 2012). For instance, energy infrastructure is conducive to increasing the proportion of clean energy, adjusting the energy consumption structure, and improving the efficiency of asset operation. Transportation infrastructure could enhance inter-regional cooperation as well as innovation (Xie, 2018). Therefore, adjacent cities’ UGSD would be promoted through clean raw materials usage and collaborative innovation. Furthermore, information infrastructure provides a platform for internationalization and improves the efficiency of transnational communication (Huang et al., 2019). Meanwhile, transnational investment could promote the technological progress and economic growth of the host country (Ma et al., 2019). As such, advanced technology and governance experience brought by opening-up could accelerate the spillover effect of production elements, which favors UGSD.
Based on the above analysis, the following hypotheses are proposed:
H5. Infrastructure promotes UGSD through opening-up.
H5a. Energy infrastructure promotes UGSD through opening-up.
H5b. Transportation infrastructure promotes UGSD through opening-up.
H5c. Information infrastructure promotes UGSD through opening-up.
The theoretical framework is constructed based on the above analysis, as shown in Figure 1.
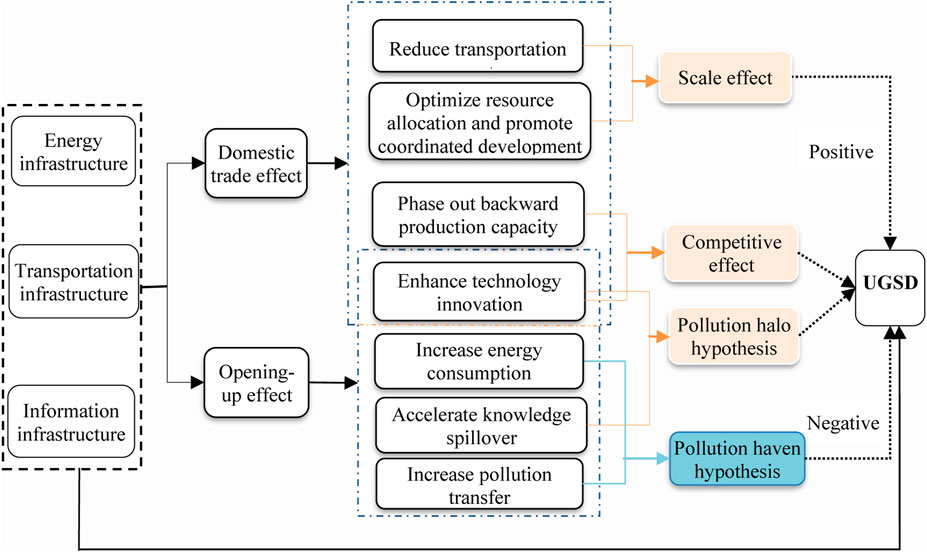
FIGURE 1. Theoretical framework diagram.
The spatial model mainly consists of the spatial auto-regressive model (SAR), spatial error model (SEM), and spatial Durbin model (SDM). Among them, SAR is established as follows:
SEM is constructed as follows:
In Eqs 1, 2, Xit represents the independent variable, Yit denotes the dependent variable, β is the coefficient of the corresponding independent variable, ρ is the coefficient of the dependent variable, εit represents the random disturbance term, and δit represents the unobservant factor.
Based on SAR and SEM, SDM is extended by comprehensively considering the spatial lag factors of independent and dependent variables, which is constructed as follows:
Where i denotes the region, t represents time, and Xit represents core independent variables, namely, energy, transportation, and information infrastructure. Economic development level, industrial structure, human capital level, and government size are selected as control variables. Additionally, Yit represents the dependent variable of UGSD, W represents the spatial weight matrix, WXit represents the space-dependent explanatory variable, and WYit is the space-dependent explained variable.
Referring to Wen and Ye (2014), this paper adopts the step-by-step regression method to test the mediation effects of domestic trade and opening-up on the relationship between infrastructure and UGSD. The regression model combined with the spatial weight matrix is expressed as follows:
Where X denotes the independent variable, Y represents the dependent variable, M represents the mediator variable, and e1, e2, and e3 represent the regression residual.
The spatial weight matrix denotes the spatial dependence characteristics of elements, which mainly consists of the geographical adjacency matrix, geographical distance matrix, and economic distance matrix. Accordingly, this paper adopts these three matrices to construct the spatial regression model and the geographical adjacency matrix is expressed as follows:
Where the items of i and j represnet city i and city j, respectively.
The geographical distance matrix is constructed as follows:
Where dij represents the longitude and latitude of city i and city j, which is obtained from the National Center for Basic Geographical Information. In this paper, the inverse of the square distance between city i and city j was adopted to depict their geographical distance.
The economic distance matrix is constructed as follows:
Where pgdp is the per capita GDP. To make the spatial lag term include the meaning of a weighted mean, all the spatial matrices were row-normalized, and their diagonal elements were zero.
The Global Moran Index (Moran’s I) is widely adopted to test whether the variables have spatial agglomeration characteristics, which is calculated as follows:
Where
UGSD is calculated by the undesirable SBM model and the GML (Global Malmquist-Luenberger) index referring to Xu et al. (2021). The non-angular and non-radial SBM model containing the undesired output is as follows:
Where
Referring to Tone (2001), a production possibility set (PPS) containing both desired output and undesired output is constructed. Assuming that N factors
Where

TABLE 1. Input-output indicators of UGSD.
According to the research by Zhang et al. (2004), the capital stock from 2005 to 2019 is calculated by the perpetual inventory method, and the regional GDP is represented by the real GDP, in which the year 2005 is taken as the base period. Furthermore, the entropy value method with the time variable is adopted to calculate the desired output indicator by the harmless disposal rate of domestic garbage, sewage treatment rate, green coverage rate of built-up area, and undesired output indicator by discharge of industrial wastewater, industrial smoke, dust emissions, and industrial SO2 emissions, respectively.
Considering that social infrastructure and administrative infrastructure involve the departments that provide intangible products such as culture, the relevant content cannot be defined accurately, and the data is limited, so this paper only studies the economic infrastructure. Referring to Fang et al. (2020), this paper chooses three infrastructures. ①Energy infrastructure (ener) is measured by the total amount of gas supply, referring to Xie (2018). ②Transportation infrastructure (traff). As 70% of domestic freight is transported by highway in China, the highway mileage is expressed by the proxy index of transportation infrastructure. ③Information infrastructure (infor). Given that telecommunication service revenue is a comprehensive index reflecting the output of information infrastructure (Liu and Hu, 2010), this paper adopts it to represent infor.
Under the context of the double cycle, the long-term development of the economy needs to explore and expand the consumer demand of the domestic market and strengthen the domestic market trade scale. At the same time, it is necessary to promote the coordinated development of domestic trade and opening-up to optimize resource allocation and promote international cooperation, which could provide new sources of impetus for UGSD. Therefore, this paper selected domestic trade and opening-up to analyze the indirect effect of infrastructure on UGSD referring to previous research (Fan et al., 2017; Gao et al., 2022). Specifically, domestic trade (trade) is denoted by the ratio of total retail sales of consumer goods to GDP, and opening-up (open) is represented by the ratio of actually utilized foreign capital to GDP in the year.
Cities with high economic development levels will have greater support for technological innovations and more investment in pro-environmental issues and infrastructure construction. As a consequence, the urban GSDL would be enhanced (Xu et al., 2021). Furthermore, industrial emissions are the main sources of pollution, which directly restrict urban green development; therefore, it is necessary to enhance the urban GSDL by innovating and upgrading the industrial structure (Xu et al., 2022). Additionally, the optimization of human capital elements is conducive to accelerating innovation and technology accumulation, and the development of the city cannot be separated from the financial support of the government. As such, based on the existing literature, this paper adopts the economic development level (pgdp), industrial structure (str), human capital level (hc), and government size (gover) to control the influence of external factors on UGSD, which are measured by per capital GDP, the proportion of the tertiary industry, the number of college students (Du et al., 2020), and the ratio of government fiscal expenditure to GDP, respectively. Table 2 shows the descriptive results of all variables adopted in this paper.

TABLE 2. Descriptive results of data.
The data adopted in this paper were mainly obtained from the “China Urban Statistics Yearbook,” “Statistical Yearbook,” and “Science and Technology Yearbooks” of provinces and cities from the year 2006 to 2020 as well as the “Statistical Bulletin” of provinces and cities from the year 2005 to 2019. To ensure the credibility of the research results, samples with many missing data were excluded, and some missing data in the samples were supplemented by the linear interpolation method based on the variation trend. As such, these balanced panel data of 221 prefecture-level cities in China from the year 2005 to 2019 were obtained, and all the data were truncated by 1% front and back to overcome the influence of extreme data.
Based on the tools of Geoda10.1 and Stata15, the results of the global Moran index for UGSD from the year 2006 to 2019 (the year 2005 is missing because it is the default base period) were obtained, which is shown in Figure 2.
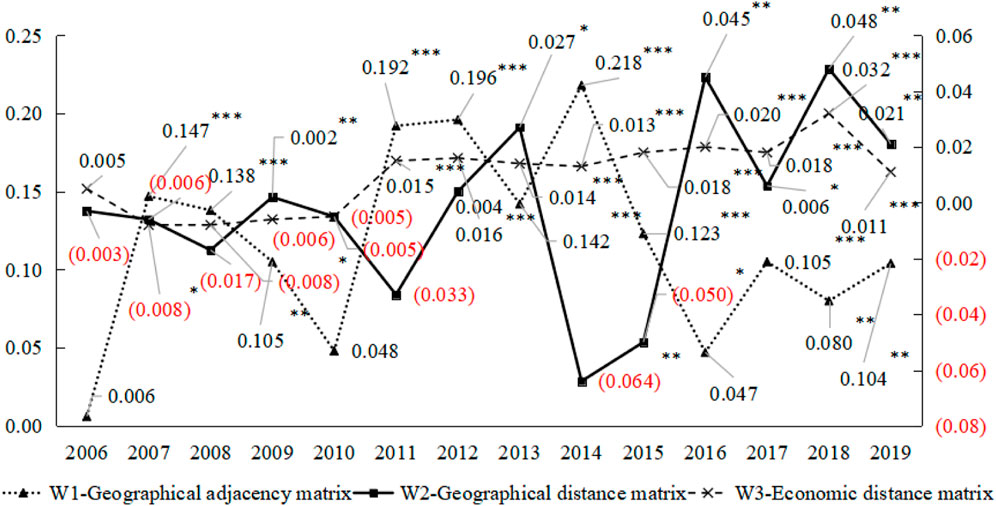
FIGURE 2. The Global Moran Index of UGSD and its significance level.
Figure 2 shows that most of the results of the global Moran index are significant with these three spatial matrices, indicating that UGSD is spatially correlated. The spatial correlation coefficients show a fluctuating and upward trend on the whole.
Furthermore, the Wald and LR tests are adopted to test the rationality of SDM, as shown in Table 3.
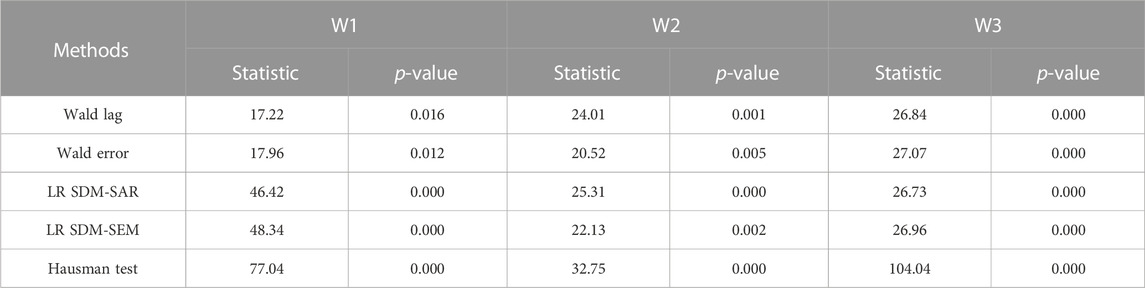
TABLE 3. Spatial model tests.
Theoretically, if the null hypothesis is significantly rejected, then the SDM should be adopted in further spatial regression. Table 3 shows that the results of Wald and LR tests are all significant at the level of 5% (p < 0.05), indicating that the SDM should be adopted in further research. Moreover, the Hausman test results show that the p-values are less than 0.01, indicating that SDM with fixed effects should be adopted.
As such, Table 4 shows the spatial regression results with the geographical adjacency matrix, geographical distance matrix, and economic distance matrix.
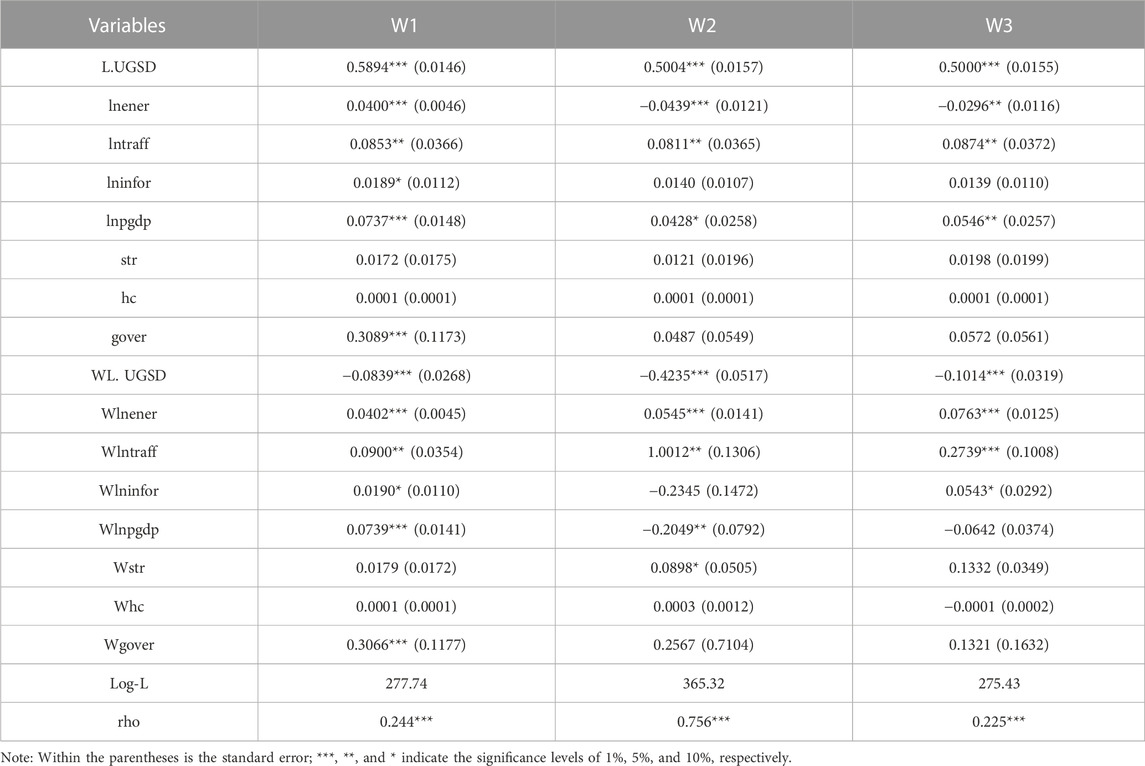
TABLE 4. Spatial spillover effect regression results.
As shown in Table 4, there are positive spatial spillover effects of energy and transportation infrastructure on urban green and smart development in general. Among them, the positive spatial correlations between transportation infrastructure and urban green and smart development are more significant. The results are consistent with previous research (Liu and Hu, 2010). Transportation infrastructure could improve the accessibility and resource flow of cities, which provide opportunities to share advanced technology and deepen cooperation in production (Wang J et al., 2022). As a result, the positive spatial spillover effect of transportation infrastructure could be magnified. However, the result of the positive spillover effect of energy infrastructure on urban green and smart development is contrary to the research findings of Xie (2018). This is mainly because of the continuously optimized energy consumption structure and the development of smart energy technologies in China, which have provided a good foundation for urban sustainable development. In contrast to energy and transportation infrastructure, the positive spatial spillover effect of information infrastructure on urban green and smart development is only significant at the level of 10% with the geographical adjacency matrix and economic distance matrix, and the coefficients are 0.0190 and 0.0543, respectively. Moreover, the spatial spillover effect of information infrastructure on urban green and smart development with a geographical distance matrix is insignificant and negative. The possible reason is that as the integration rate of information infrastructures, such as 5G base stations, and hardware facilities, such as computers, continues to increase, the large-scale use of electrical equipment will increase power and energy consumption (Pothitou et al., 2017), thus exacerbating environmental pollution. Zhang et al. (2022) pointed out that information infrastructure can effectively improve air quality though its spatial spillover effect is not obvious, which is consistent with the findings of this paper.
As for the control variables, the economic development level shows a positive spatial spillover effect on urban green and smart development with the geographical adjacency matrix, while showing an inhibitory effect with the geographical distance matrix, which is consistent with the research findings of Yuan and Liu (2019). The government size only significantly promotes adjacent cities’ green and smart development with the geographical adjacency matrix, while the positive spillover effect could not be effectively released when there is a long geographical and economic distance. This is mainly because, with the increase in geographical and economic distance, less technical support and resource sharing could be obtained from cities with a larger government size, which is not conducive to the formation of a positive spatial spillover effect (Tang and Wang, 2015). Moreover, the spillover effect of the human capital level on urban green and smart development is not significant, which is mainly due to the mismatch between the structural demand for economic development and the supply of human capital (Zhang et al., 2018; Zhang and Hu, 2020).
Based on the results of benchmark regression, the influence effects of energy, transportation, and information infrastructure on urban green and smart development could be further decomposed into average direct effect, average indirect effect, and average total effect. Table 5 shows the results of spatial effect decomposition with the three spatial matrices.
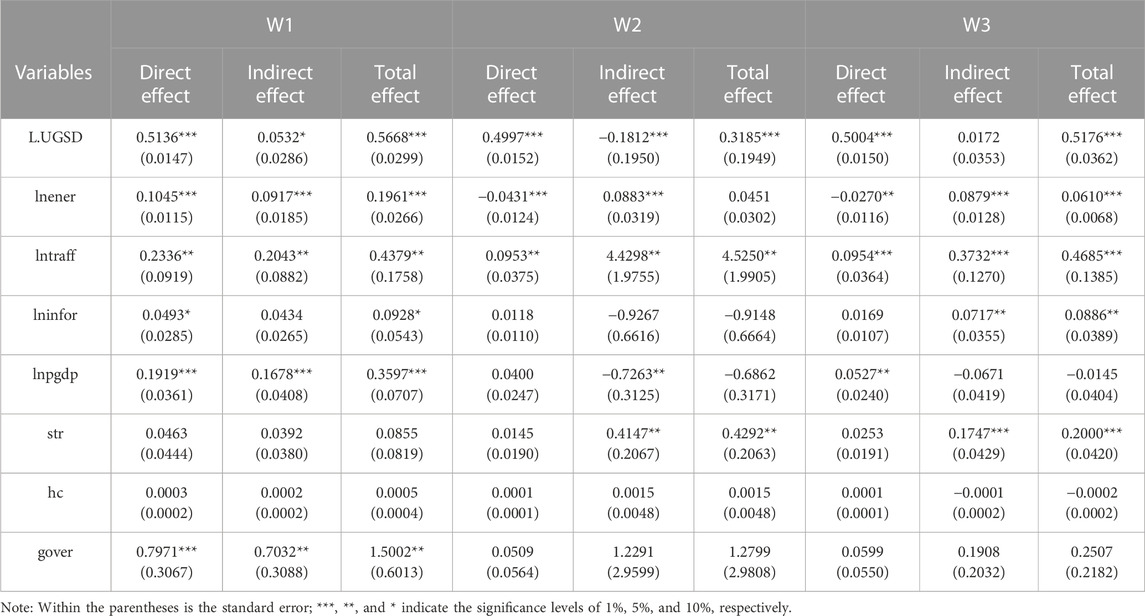
TABLE 5. Spatial effect decomposition.
As shown in Table 5, the direct and indirect effects of energy, transportation, and information infrastructure on urban green and smart development are heterogeneous with different spatial weight matrices. In general, there are positive spillover effects of energy and transportation on local and adjacent cities’ urban green and smart development with the geographical adjacency matrix. This could be attributed to the construction of new energy systems and diversified transportation patterns, which are beneficial to cities’ low-carbon transformation and the promotion of urban green and smart development. By contrast, the effect of information infrastructure is only positive on local green and smart development, while its spillover effect on adjacent cities is insignificant.
According to Table 5, we know that the indirect effect of energy infrastructure on urban green and smart development is positive, whereas the direct effect is significantly negative, and the total effect on urban green and smart development is insignificant with the geographical distance matrix. With regard to transportation infrastructure, the results show that the direct, indirect, and total effects are all significant, among which the indirect effect is stronger than the direct effect. However, the indirect effect of information infrastructure on urban green and smart development is insignificant, indicating that geographical proximity could not enhance the positive spillover effects of information infrastructure on urban green and smart development. The possible reason is that even though the urban information level has improved in recent years, there is still a polarization phenomenon, resulting in the unbalanced utilization of urban information infrastructure. Furthermore, there are many information islands among different industries, groups, and systems, which makes it difficult to achieve open sharing. As such, the soft environment of information including information consumption capacity, in-depth exploration, and comprehensive utilization of information resources would be the main obstacle to urban green and smart development (Wang, 2014).
With the economic distance matrix, the decomposition effect coefficients of energy infrastructure are −0.0270, 0.0879, and 0.0610, respectively. That is, energy infrastructure would suppress local urban green and smart development while promoting the green and smart development of adjacent cities. Furthermore, its spatial spillover effect offsets the negative impacts on local urban green and smart development, resulting in its positive total effect. As for transportation infrastructure, there is also a positive spatial spillover effect on urban green and smart development, which is mainly because of the efficient resource utilization, optimized transportation system, and fewer logistics cost among cities brought about by transportation infrastructure (Konno et al., 2021; Marinos et al., 2022; Wang J et al., 2022). In addition, information infrastructure shows a positive spillover effect on adjacent cities’ green and smart development, while it shows an insignificant effect on local green and smart development. The reason may be that the cost of massive investment and long-term construction of local information infrastructure would not be compensated by scale and agglomeration economy in the early stage. However, the network characteristics of information infrastructure could offer opportunities for resource circulation, which could upgrade adjacent cities’ innovation and technology levels, while reducing the cost of information acquisition and resource integration.
Based on the above theoretical analysis, the mediation effects of domestic trade and opening-up are further explored, and the results of the mediation effect of domestic trade are shown in Table 6.
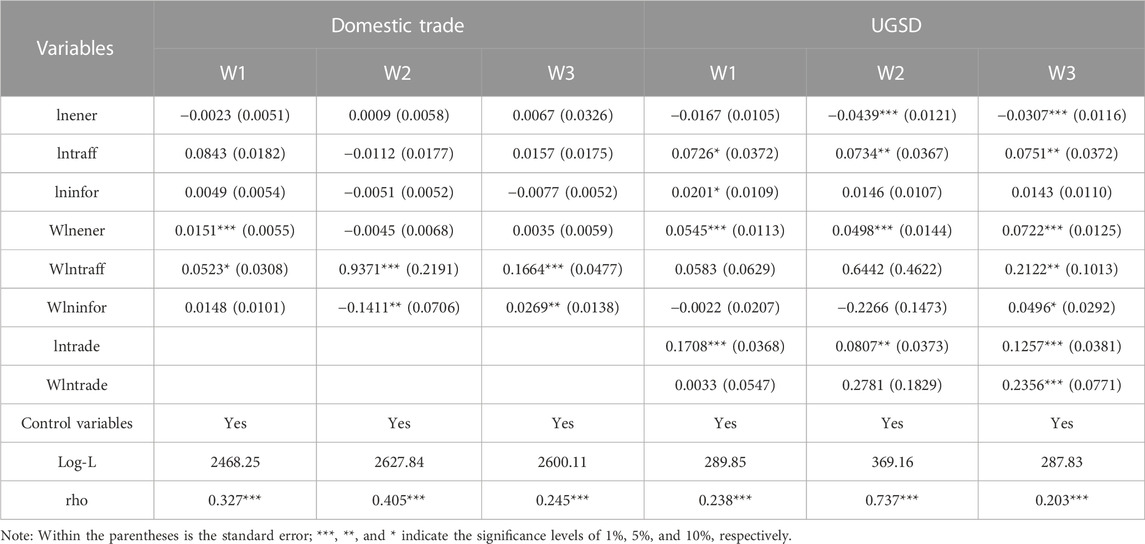
TABLE 6. The mediation effect of domestic trade.
As shown in Table 6, domestic trade could not mediate the impact of energy infrastructure on urban green and smart development. The possible reason is that energy infrastructure mainly serves the production of the secondary industry; as such, the role of energy infrastructure in enhancing urban development through domestic trade could be limited. In contrast, transportation infrastructure could promote green and smart development of adjacent cities by improving domestic trade with the economic distance matrix, showing a positive spatial spillover effect, which is consistent with the findings of Liu and Hu (2010). Through the diffusion and linkage effect of resource elements, transportation infrastructure could stimulate commercial trade, optimize resource allocation, and enhance the green degree of urban productivity (Ma et al., 2019). In addition, domestic trade partially mediates the impact of information infrastructure on urban green and smart development only with the economic distance matrix. This may be due to the new generation of information technologies such as blockchain and 5G technology, which have greatly transcended the constraints of time and space, resulting in economic activities being more dependent on network proximity (Yoon and Nadvi, 2018). Therefore, the advantage of urban economic proximity transcends geographical proximity in the mediation effect of domestic trade.
The results of the mediation effect of opening-up are shown in Table 7. As can be seen, there are negative spatial spillover effects of energy infrastructure on opening-up with the geographical adjacency matrix and geographical distance matrix. However, the negative spatial spillover effect of information infrastructure on opening-up is significant with the geographical distance matrix, and the spatial spillover effect of transportation infrastructure on opening-up is insignificant with all three spatial matrices. When taking opening-up as the control variable into the regression model, the spatial spillover effects of energy infrastructure on urban green and smart development turn out to be significantly positive with the geographical adjacency matrix and geographical distance matrix, while the spillover effect of information infrastructure on urban green and smart development turns to be insignificant. As such, it could be concluded that energy infrastructure could release a positive spillover effect on urban green and smart development by reducing the negative impact of opening-up. This may be due to the fact that energy infrastructure could enhance the elasticity of the energy supply chain and promote energy utilization efficiency while reducing the rigid demand for energy imports, which provides a solid foundation for domestic productivity and industrial structure upgrading. On the contrary, opening-up fails to mediate the impact of transportation and information infrastructure on urban green and smart development. The possible reason is that advantageous conditions brought by transportation and information infrastructure including advanced technology, governance experience, and high-level talents could promote the level of opening-up. However, opening-up would also cause pollution transfer and energy consumption, and when the pollution haven effect exceeds the pollution halo effect, the effects of transportation and information infrastructure on local and adjacent cities’ urban green and smart development would be negative.
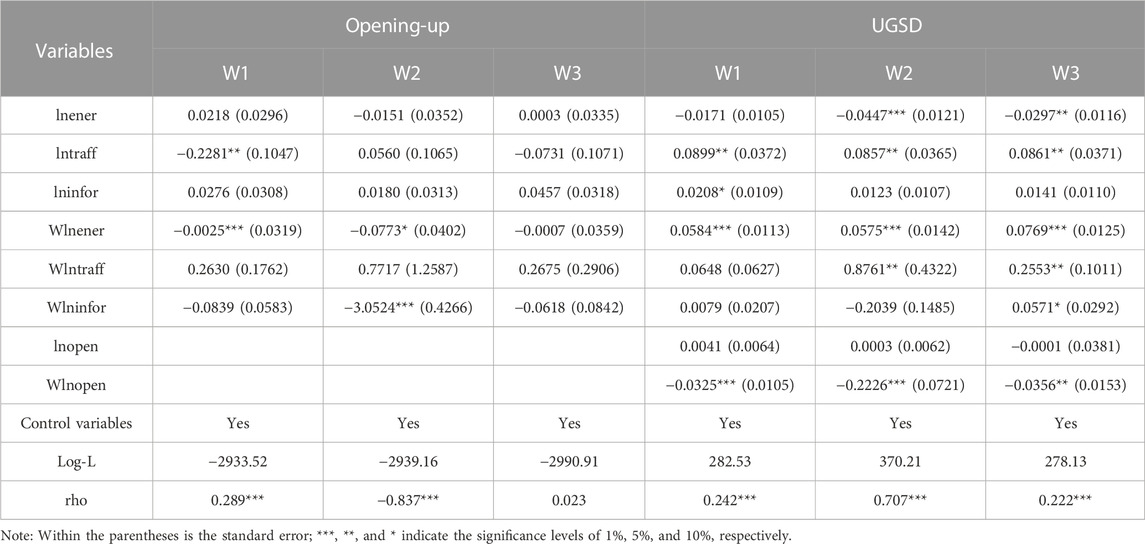
TABLE 7. The mediation effect of opening-up.
Considering the important role of infrastructure and the opportunity for the dual cycle, our research constructs a theoretical framework between infrastructure and urban green and smart development to explore the direct and indirect spatial spillover effects of different infrastructures on urban green and smart development. The main findings and hypotheses acceptance are shown in Table 8.
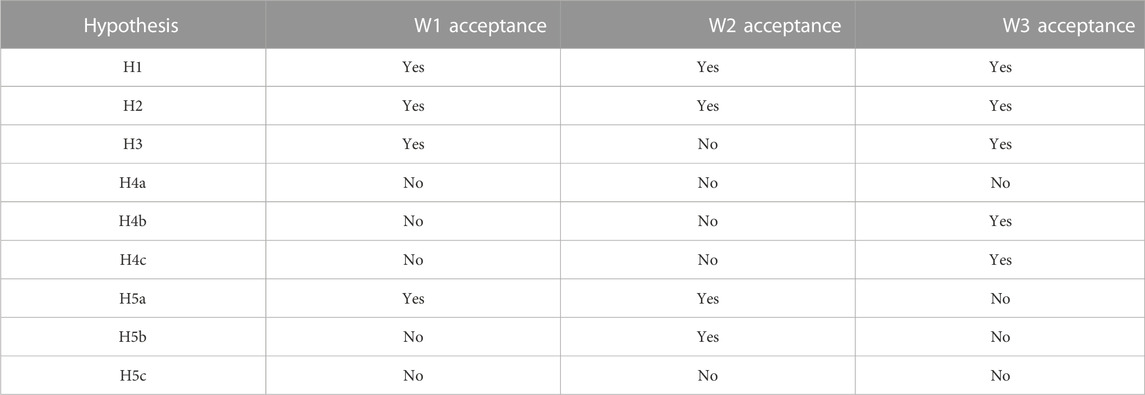
TABLE 8. Hypotheses test.
This research has two main findings. The first finding is the significant positive correlation between infrastructure and urban green and smart development at the city level. Heterogeneously, energy and transportation infrastructure both show positive spatial spillover effects on urban green and smart development on the whole, and the positive effect of transportation infrastructure is more significant. Therefore, there are significant differences in the impact of infrastructure on urban green and smart development. Consistent with the findings of Konno et al. (2021) and Marinos et al. (2022), transportation infrastructure provides opportunities to learn advanced technology and improve the accessibility and resource flow of cities (Wang L et al., 2022). In consequence, it plays a prominent role in releasing a positive spatial spillover effect for the green transformation of adjacent cities. By contrast, the positive spatial spillover effect of information infrastructure on urban green and smart development is less significant. There is a possibility that as the spatial distance increases, the economic connections driven by the improvement of information infrastructure would fade gradually, thus suppressing its positive spatial spillover effect.
The second finding implies that domestic trade partially mediates the impact of transportation and information infrastructure on urban green and smart development only with the economic distance matrix. Transportation and information infrastructures show strong network features, which could break through temporal-spatial boundaries, achieve complementation of green technology and service among cities, and promote intercity trade (He and Ren, 2018; Yang and Liu, 2018), while energy infrastructure could release a positive spillover effect on urban green and smart development by reducing the negative impact of opening-up with the geographical adjacency matrix and geographical distance matrix. In line with the existing research, energy infrastructure could enhance the elasticity of the energy supply chain and promote energy utilization efficiency, while reducing the rigid demand for energy imports, which provides a solid foundation for foreign investment (Gao and Yue, 2020; Han et al., 2020). As Hu and Wang (2005) pointed out that compared with market openness, preferential policies, geographical location, and other factors, infrastructure construction is the most important factor to attract foreign direct investment.
In the spatial econometric model, the different weight matrices have a great influence on the estimation results. Considering the comparability of estimation results and the reliability of the conclusion, this paper adopts the following methods to conduct the robustness test. The results are shown in Table 9.
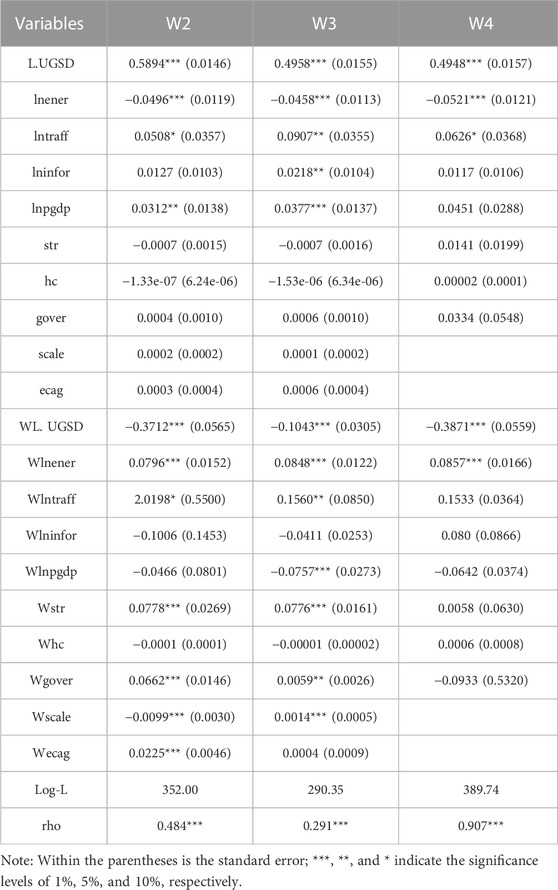
TABLE 9. Robustness test results.
(1) Adding control variables (Table 9, Column 2 and Column 3). The urban scale has been proved to be a symbol of its economic development, which was an essential condition for industrial agglomeration and acceleration of the industrialization process (Xu et al., 2022). Thus, this paper adopts the urban scale (scale) to control the potential influence of UGSD, which is measured by the urban total population at the end of the year. Cities with higher economic agglomeration tend to have more advanced and developed infrastructures. The decrease in commuting costs and information-sharing costs makes the connection between different enterprises more convenient and faster. Therefore, this paper selects the gross domestic product per unit of land area to represent economic agglomeration.
(2) Replacing the spatial weight matrix (Table 9, Column 4). Compared with the geographical adjacency matrix, the inverse distance spatial weight matrix (W4) could measure the relationship between farther spatial units. Thus, this paper adopts the inverse of the center geographical distance between two provinces. The dij represents the geographical distance between two cities measured by latitude and longitude. The setting matrix is as follows:
The estimation results are shown in Table 9, where we can conclude that there is no significant change in the significance and direction of the core explanatory variables, indicating that the research results are robust and credible.
Our research constructs a theoretical framework between infrastructure and urban green and smart development, which tries to elucidate the spatial spillover effects of different infrastructures on urban green and smart development with the three spatial matrices, reveal the multiple effects of different infrastructures on urban green and smart development from the perspectives of spatial effect decomposition, and provide new evidence for the mediation effects of domestic trade and opening-up. Based on the panel data of 221 prefecture-level cities in China from the year 2005 to 2019, urban green and smart development is measured with the undesirable SBM model and GML index, and the spatial Durbin model is adopted to explore the spatial spillover effect of infrastructure on urban green and smart development. Then, the decomposition of the spatial effect and the mediation effect of domestic trade and opening-up are analyzed. The main conclusions drawn are as follows:
First, the spatial spillover effects of three types of infrastructures on urban green and smart development are heterogeneous with the three spatial matrices. The direct effect of energy infrastructure on local green and smart development is negative, while the spatial spillover effect on adjacent cities is positive. Moreover, transportation infrastructure shows a positive effect on local and adjacent cities’ green and smart development. In contrast, information infrastructure shows a less significant positive effect in promoting green and smart development of local and adjacent cities. In addition, the decomposition results of the spatial effect show that energy and transportation infrastructure promote local and adjacent green and smart development with three spatial weight matrices, while information infrastructure only promotes adjacent cities’ development with the economic distance matrix.
Second, control variables show differential spatial spillover effects on urban green and smart development. In general, the economic development level shows a positive spatial spillover effect on urban green and smart development with the geographical adjacency matrix, while it shows a negative spatial spillover effect with the geographical distance matrix. Moreover, there is a positive spatial spillover effect of industrial structure on urban green and smart development only with the geographical distance matrix. Noticeably, the human capital level shows an insignificant spatial spillover effect on local and adjacent cities’ green and smart development, which is possibly due to the mismatching effect between economy demand and talent supply, and the rebound effect brought by technological progress. With the geographical adjacency matrix, government size could promote green and smart development of adjacent cities through the intercity demonstration effect and the competition-cooperation effect.
Third, as for the mediation effects of domestic trade and opening-up, they play heterogeneous roles between different infrastructures and urban green and smart development. From the perspective of domestic trade, transportation and information infrastructures could promote adjacent cities’ green and smart development through domestic trade with the economic distance matrix, while domestic trade does not mediate the impact of energy infrastructure on urban green and smart development with the three spatial matrices. On the contrary, energy infrastructure shows a positive spatial spillover effect on urban green and smart development by weakening the negative impact of opening-up with the geographical proximity matrix and geographical distance matrix. However, transportation and information infrastructure could not promote urban green and smart development through opening-up with the three spatial matrices.
Based on the above conclusions, the implications are put forward as follows:
First, infrastructures are required to be constructed in a reasonable way to augment their positive spatial spillover effect on urban green and smart development. In terms of energy infrastructure, a new energy system in which the green and low-carbon energy transformation is accelerated and carbon emissions responsibility is shared should be progressively implemented according to the energy production and consumption pattern of the city and its surrounding areas. Also, it is necessary to build a green and efficient transportation infrastructure, in which the proportion of railways and waterways in comprehensive transport should be increased, green logistics should be accelerated, and the concept of ecological protection should be integrated into the whole process of upgrading transportation networks. Furthermore, it is important to promote the integration of information infrastructure with the secondary and tertiary industries and promote their transformation into intelligent, digital, and networked industries. In addition, cities with advanced information infrastructure should be encouraged to spread the network effect to adjacent cities by improving the regional linkage and integration degree of information infrastructure. As such, a comprehensive driving force of energy, transportation, and information infrastructures would be formed to promote urban green and smart development.
Second, the polarization effect and siphon effect should be restrained while the positive spillover effect of intercity factors should be strengthened. Institutional barriers that hinder the market-based allocation of elements and the distribution of goods and services should be removed to form a unified, efficient, competitive, and open market. Furthermore, the coordinated transformation of upstream and downstream industries in energy, transportation, and information fields is supposed to be adjusted according to local conditions. Additionally, the spillover effects of high-quality talents should be enhanced to achieve integrated development of local and adjacent cities. Moreover, the administrative barriers are imperative to be broken to guide the participation of private capital in the green transformation of cities and encourage governments to establish a high-quality relationship of competition and cooperation among cities.
Third, the two-wheel driving effect of domestic trade and opening-up on the relationship between infrastructure and urban green and smart development should be promoted. On the one hand, to promote the domestic circulation of the national economy, we should optimize the supply structure and quality and strive to build a sound support policy system for expanding domestic demand. On the other hand, as the optimization of opening-up is as important as precaution of the negative spatial spillover effect on adjacent cities, thus the negative impacts of opening-up should be weakened through ecological compensation and joint innovation among cities. Moreover, it is necessary to enhance the positive interaction of infrastructures, domestic trade, and opening-up, form a coordinated development mode with multilateral cooperation, and augment the impetus of infrastructure for urban green transformation and upgrading.
This study has analyzed the spatial impacts of energy, transportation, and information infrastructures on urban green and smart development with different spatial matrices, which is meaningful in understanding the relationship between infrastructure and urban green and smart development from a more comprehensive lens. Under the context of the double cycle, the roles of domestic trade and opening-up between infrastructure and urban green and smart development have explored, and it would help China to seize the opportunities at home and abroad and promote the green transformation of cities. Although this study is conducted in the context of China, infrastructure construction and green transformation are common challenges for cities of all countries. Therefore, the research findings of this study could provide beneficial insights for countries with similar conditions. However, regardless of the positive results, there are still some limitations. Urban green and smart development is a complex system with multiple levels and structures. The level of development calculated by the undesirable SBM model and the GML index is a simple simulation of the whole system based on the input-output perspective, and further research is needed to develop a more robust evaluation method. In addition, as the indicators adopted to evaluate urban green and smart development are also closely related to sustainable development, so relative research could be further studied in the future, such as the impact of infrastructure on poverty alleviation and ecological optimization. Moreover, due to the data availability, this paper only focuses on the economic infrastructure; social infrastructure such as educational and medical infrastructures could be further studied. The indirect effect of the digitization level between infrastructure and urban green and smart development could be analyzed in future studies to extend existing research.
The raw data supporting the conclusion of this article will be made available by the authors, without undue reservation.
Conceptualization, LX and JD; methodology, LX and DW; software, DW; validation, LX and JD; formal analysis, LX and DW; data checking, DW; writing—original draft preparation, DW; writing—review and editing, LX and DW; visualization, DW; supervision, LX and JD; funding acquisition, LX. All authors contributed to the article and approved the submitted version.
This research is funded by the National Natural Science Foundation of China (72174076 and 71974081), the National Social Science Foundation of China (22AGL028), the Social Science Foundation of Jiangsu Province (21GLB016 and 22GLA007), the Special Research Project of School of Emergency Management in Jiangsu University (KY-A-04 and KY-C-05), and the Postgraduate Research and Practice Innovation Program of Jiangsu Province (KYCX23_3792). The APC was funded by the National Nature Science Foundation of China (72174076).
The authors would like to thank the editor and reviewers for their insightful and valuable comments.
The authors declare that the research was conducted in the absence of any commercial or financial relationships that could be construed as a potential conflict of interest.
All claims expressed in this article are solely those of the authors and do not necessarily represent those of their affiliated organizations, or those of the publisher, the editors and the reviewers. Any product that may be evaluated in this article, or claim that may be made by its manufacturer, is not guaranteed or endorsed by the publisher.
Akbar, M., Hussain, A., Akbar, A., and Ullah, I. (2021). The dynamic association between healthcare spending, CO 2 emissions, and human development index in OECD countries: Evidence from panel VAR model. Environ. Dev. Sustain. 23, 10470–10489. doi:10.1007/s10668-020-01066-5
Álvarez-Ayuso, I. C., Becerril-Torres, O. U., and Moral-Barrera, L. E. (2011). The effect of infrastructures on total factor productivity and its determinants: A study on Mexico. Estud. Econ. 26 (1), 97.
Aschauer, D. (1989). Ls public expenditure productive. J. Monetary Econ. 23, 177–200. doi:10.1016/0304-3932(89)90047-0
Bresson, G., Etienne, J., and Mohnen, P. (2016). How important is innovation? A bayesian factor-augmented productivity model based on panel data. Macroecon. Dyn. 20 (8), 1987–2009. doi:10.1017/s1365100515000371
Bronzini, R., and Piselli, P. (2009). Determinants of long-run regional productivity with geographical spillovers: The role of R&D, human capital and public infrastructure. Regional Sci. Urban Econ. 39 (2), 187–199. doi:10.1016/j.regsciurbeco.2008.07.002
Chen, Z. Y., Qian, C. X., and Chen, M. Z. (2020). Urbanization, infrastructure construction and balanced regional development——based on the empirical examination of inter-provincial panel data from 2003 to 2017. J. Yunnan Univ. Finance Econ. 36 (2), 19–31. doi:10.16537/j.cnki.jynufe.000543
Cheng, G. S., and Hu, J. X. (2019). The impact of human capital accumulation on environmental quality. Urban Probl. 10, 46–52. doi:10.13239/j.bjsshkxy.cswt.191005
Demurger, S., Sachs, J. D., Woo, W. T., Bao, S., Chang, G., Mellinger, A., et al. (2001). Economic geography and regional growth in China. Asian Econ. Panel.
Du, J. G., Wang, Y., and Zhao, A. W. (2020). Research on the influence of smart city construction on urban green development and its function mechanism. Soft Sci. 34 (9), 59–64. doi:10.13956/j.ss.1001-8409.2020.09.09
Fan, X., Song, D. L., and Zhao, X. Y. (2017). Has infrastructure construction broken the domestic market segmentation? Econ. Res. 52 (2), 20–34.
Fang, F. Q., Tian, G., and Xiao, H. (2020). Research on the influence of infrastructure on China's economic growth and its mechanism——based on the extended barro growth model. Econ. Theory Bus. Manag. 360 (12), 13–27.
Feng, J. Y., Yan, J. J., and Tao, X. (2021). Exposing the effects of environmental regulations on China’s green total factor productivity: Results from econometrics analysis and machine learning methods. Front. Environ. Sci. 9, 544. doi:10.3389/fenvs.2021.779358
Gao, P., and Yue, S. J. (2020). Study on the measurement of total factor implied energy efficiency in China. J. Quantitative Technol. Econ. 37 (11), 61–80. doi:10.13653/j.cnki.jqte.2020.11.004
Gao, D., Li, G., Li, Y., and Gao, K. (2022). Does FDI improve green total factor energy efficiency under heterogeneous environmental regulation? Evidence from China. Environ. Sci. Pollut. Res. 29 (17), 25665–25678. doi:10.1007/s11356-021-17771-1
Guo, S., Han, M. Y., Yang, Y. P., Zou, J., and Hu, S. (2021). Hydraulic integrated interconnected regenerative suspension: Modeling and characteristics analysis. Resour. Sci. 43 (4), 733–744. doi:10.3390/mi12070733
Han, J. F., Yan, N., Su, D. Q., and Kong, W. B. (2020). Analysis of the comprehensive impact of inter-provincial power transmission on the economy and environmental protection of the affected provinces. Electr. Power Surv. Des. 4 (4), 38–41. doi:10.13500/j.dlkcsj.issn1671-9913.2020.04.009
Han, D., Ding, Y., Shi, Z., and He, Y. (2022). The impact of digital economy on total factor carbon productivity: The threshold effect of technology accumulation. Environ. Sci. Pollut. Res. 29 (37), 55691–55706. doi:10.1007/s11356-022-19721-x
Han, L. M., You, J., Meng, J., Fu, Y. L., and Wu, S. L. (2023). Empirical analysis of R&D spending, transport infrastructure development and CO2 emissions in China. Front. Environ. Sci. 11, 351. doi:10.3389/fenvs.2023.1138876
Hao, F. X., and Zhang, S. J. (2021). Analysis of transportation infrastructure, economic connection and agglomeration——based on Yangtze River Delta urban agglomeration from the spatial perspective. Inq. into Econ. Issues 3, 80–91.
Hao, S. S., and Zhu, X. A. (2019). Spatial measurement of the factors affecting the regional green development level in China. Econ. Surv. 36 (1), 10–17. doi:10.15931/j.cnki.1006-1096.20181213.011
Hao, A. M., Tan, J. Y., Ren, Z., and Zhang, Z. M. (2022). A spatial empirical examination of the relationship between agglomeration and green total-factor productivity in the context of the carbon emission peak. Front. Environ. Sci. 343. doi:10.3389/fenvs.2022.829160
He, D. A., and Ren, X. (2018). The evolution and prospect of resource allocation mechanism in the internet era. Economist 10, 63–71. doi:10.16158/j.cnki.51-1312/f.2018.10.009
Hu, H. J., and Wang, J. L. (2005). Analysis of influencing factors of regional distribution of foreign direct investment in China. Soc. Sci. 000 (5), 27–33. doi:10.3969/j.issn.0257-5833.2005.05.004
Huang, Q. H., Yu, Y. Z., and Zhang, S. L. (2019). Internet development and manufacturing productivity improvement: Internal mechanism and Chinese experience. China Ind. Econ. (8), 5–23. doi:10.19581/j.cnki.ciejournal.2019.08.001
Jiang, H. L., Jiang, P. C., Wang, D., and Wu, J. H. (2021). Can smart city construction facilitate green total factor productivity? A quasi-natural experiment based on China's pilot smart city. Sustain. Cities Soc. 69 (3), 102809. doi:10.1016/j.scs.2021.102809
Kong, J. J., Zhang, C., and Han, C. F. (2018). Study on the interactive growth strategy of infrastructure system and natural ecology. China Popul. Resour. Environ. 28 (1), 44–53.
Konno, A., Kato, H., Takeuchi, W., and Kiguchi, R. (2021). Global evidence on productivity effects of road infrastructure incorporating spatial spillover effects. Transp. policy 103, 167–182. doi:10.1016/j.tranpol.2021.02.007
Li, J. X., and Yao, W. Z. (2022). The impact of digital infrastructure investment on green growth of China's manufacturing industry: Spatial effect and mechanism analysis. Sci. Sci. Manag. S.& T 43 (8), 82–98.
Li, X., Fong, P. S., Dia, S., and Li, Y. C. (2019). Towards sustainable smart cities: An empirical comparative assessment and development pattern optimization in China. J. Clean. Prod. 215, 730–743. doi:10.1016/j.jclepro.2019.01.046
Liao, B., and Li, L. (2022). Spatial division of labor, specialization of green technology innovation process and urban coordinated green development: Evidence from China. Sustain. Cities Soc. 80, 103778. doi:10.1016/j.scs.2022.103778
Liu, S. L., and Hu, A. G. (2010). Inspection of infrastructure externalities in China: 1988—2007. Econ. Res. 45 (3), 4–15.
Liu, G., Wang, B., and Zhang, N. (2016). A coin has two sides: Which one is driving China's green TFP growth? Econ. Syst. 40, 481–498. doi:10.1016/j.ecosys.2015.12.004
Liu, Q., Hu, T. T., and Shao, Z. (2020). Analysis of the influence of transportation infrastructure on domestic and export relations: Based on the perspective of new economic geographical transportation cost. World Econ. Stud. (5), 17–33. + 135.
Liu, Z., Zeng, S., Jin, Z., and Shi, J. J. (2022). Transport infrastructure and industrial agglomeration: Evidence from manufacturing industries in China. Transp. Policy 121, 100–112. doi:10.1016/j.tranpol.2022.04.001
Ma, S. Z., Fang, C., and Liang, Y. F. (2019a). Digital trade and its era value and research outlook. J. Int. Trade (2), 176.
Ma, Y., Qiu, W. H., and Wang, X. Y. (2019b). Urban infrastructure, technological innovation and regional economic development——based on the mediation effect and panel threshold model analysis. J. Industrial Technol. Econ. 38 (8), 116–123. doi:10.3969/j.issn.1004-910X.2019.08.014
Mao, Q. L. (2012). Opening up, infrastructure scale, and economic growth. Ind. Econ. Rev. 3 (1), 111–125. doi:10.3969/j.issn.1674-8298.2012.01.011
Marinos, T., Belegri-Roboli, A., Michaelides, P. G., and Konstantakis, K. N. (2022). The spatial spillover effect of transport infrastructures in the Greek economy (2000—2013): A panel data analysis. Res. Transp. Econ. 94, 101179. doi:10.1016/j.retrec.2022.101179
McCartney, M. (2022). The China-Pakistan economic corridor (CPEC): Infrastructure, social savings, spillovers, and economic growth in Pakistan. Eurasian Geogr. Econ. 63 (2), 180–211. doi:10.1080/15387216.2020.1836986
Moura, F., and Silva, J. D. A. (2019). Smart cities: Definitions, evolution of the concept and examples of initiatives. Industry, innovation infrastructure, 1–9. doi:10.1007/978-3-319-71059-4_6-1
Nondo, C. (2018). Is there a relationship between information and communication technologies infrastructure, electricity consumption and total factor productivity? Int. J. Energy Econ. Policy 8 (4), 207–218.
Odongo, K., and Kalu, O. (2016). Does infrastructure really explain economic growth in Sub-Saharan Africa? Rev. Dev. Finance 6 (2), 105–125. doi:10.1016/j.rdf.2016.12.001
Peng, W., Yin, Y., Kuang, C., Wen, Z., and Kuang, J. (2021). Spatial spillover effect of green innovation on economic development quality in China: Evidence from a panel data of 270 prefecture-level and above cities. Sustain. Cities Soc. 69 (2), 102863. doi:10.1016/j.scs.2021.102863
Pothitou, M., Hanna, R. F., and Chalvatzis, K. J. (2017). ICT entertainment appliances’ impact on domestic electricity consumption. Renew. Sustain. Energy Rev. 69, 843–853. doi:10.1016/j.rser.2016.11.100
Puga, D. (2002). European regional policies in light of recent location theories. J. Econ. Geogr. 2, 373–406. doi:10.1093/jeg/2.4.373
Shamsuzzoha, A., Niemi, J., Piya, S., and Rutledge, K. (2021). Smart city for sustainable environment: A comparison of participatory strategies from helsinki. Singap. Lond. Cities 114 (12), 103–194. doi:10.1016/j.cities.2021.103194
Sun, H. B., Zhang, Z., and Liu, Z. L. (2022). Regional differences and threshold effect of clean technology innovation on industrial green total factor productivity. Front. Environ. Sci. 10, 1465. doi:10.3389/fenvs.2022.985591
Tang, W., Wang, Y., Li, B., Jiang, X., Li, F., Xu, J., et al. (2015). Structural brain abnormalities correlate with clinical features in patients with drug-naïve ocd: A DARTEL-enhanced voxel-based morphometry study. Econ. Res. J. 50 (9), 72–80. doi:10.1016/j.bbr.2015.07.061
Tian, G., and Li, J. (2019). How does infrastructure construction affect economic development along the "Belt and Road": By promoting growth or improving distribution? Emerg. Mark. Finance Trade 55 (1), 3332–3348. doi:10.1080/1540496x.2019.1607725
Tone, K. (2001). A slacks-based measure of efficiency in data envelopment analysis. Eur. J. Operational Res. 130 (3), 498–509. doi:10.1016/s0377-2217(99)00407-5
Wang, X., and Wang, Y. (2021). Green credit policy enhances green innovation research. J. Manag. World 37 (6), 173–188. + 11. doi:10.19744/j.cnki.11-1235/f.2021.0085
Wang, J., Yang, X. Y., Qalati, S. A., and Deng, Y. Z. (2022). Spatial spillover effect and spatial distribution characteristics of transportation infrastructure on economic growth: A case of the Yangtze River Delta. Front. Environ. Sci. 10, 900209. doi:10.3389/fenvs.2022.900209
Wang, L., Wu, Y., Huang, Z., and Wang, Y. (2022). How big data drives green economic development: Evidence from China. Front. Environ. Sci. 10, 2281. doi:10.3389/fenvs.2022.1055162
Wang, Y. G. (2014). Construction and empirical analysis of urban information index in China——taking beijing, shanghai, tianjin and chongqing as an example. Ecol. Econ. 30 (3), 56–58. doi:10.3969/j.issn.1671-4407.2014.03.012
Wen, Z. L., and Ye, B. J. (2014). Analyses of mediating effects: The development of methods and models. Adv. Psychol. Sci. 22 (5), 731–745. doi:10.3724/sp.j.1042.2014.00731
Xie, J. (2018). Infrastructure construction and regional total factor productivity——based on the spatial measurement analysis of 285 prefecture-level cities in China. Sci. Decis. Mak. (4), 71–94. doi:10.3773/j.issn.1006-4885.2018.04.071
Xu, L. Y., Wang, D. D., and Du, J. G. (2021). The heterogeneous influence of infrastructure construction on China’s urban green and smart development——the threshold effect of urban scale. Land 10, 1015. doi:10.3390/land10101015
Xu, L. Y., Wang, D. D., and Du, J. G. (2022). Spatial-temporal evolution and influencing factors of urban green and smart development level in China: Evidence from 232 prefecture-level cities. Int. J. Environ. Res. Public Health 19, 3939. doi:10.3390/ijerph19073939
Yang, D. M., and Liu, Y. W. (2018). Why did "Internet +" add its performance. China Ind. Econ. (5), 80–98. doi:10.19581/j.cnki.ciejournal.2018.05.005
Yang, H. C., Li, L. S., and Zhang, F. M. (2021). The impact of manufacturing gathering on energy performance and regional comparison research. Sci. Res. Manag. 42 (5), 102–115. doi:10.16192/j.cnki.1003-2053.2020.01.009
Yoon, S., and Nadvi, K. (2018). Industrial clusters and industrial ecology: Building 'eco-collective efficiency' in a South Korean cluster. Geoforum 90, 159–173. doi:10.1016/j.geoforum.2018.01.013
Yuan, H. X., and Liu, Y. B. (2019). Financial agglomeration and green development——based on the two-dimensional perspective of level and efficiency. Sci. Res. Manag. 40 (12), 126–143.
Zeng, C., Song, Y., Cai, D. W., Hu, P. Y., Cui, H. T., Yang, J., et al. (2019). Exploration on the spatial spillover effect of infrastructure network on urbanization: A case study in wuhan urban agglomeration. Sustain. Cities Soc. 47, 101476. doi:10.1016/j.scs.2019.101476
Zhang, G., and Hu, Y. (2020). The effect of innovative human capital on green total factor productivity in the Yangtze River Delta region——based on the empirical analysis of the space Durbin model. China Popul. Resour. Environ. 30 (9), 106–120. doi:10.12062/cpre.20200408
Zhang, H., and Zhou, W. (2023). Are infrastructure development, economic complexity index, and oil cnsumption really matter for green economic recover? The role of institutions. Front. Environ. Sci. 11, 91. doi:10.3389/fenvs.2023.1102038
Zhang, J., Wu, G. Y., and Zhang, J. P. (2004). Estimation of inter-provincial material capital stock in China: 1952-2000. Econ. Res. J. 10, 35–44.
Zhang, X., Wang, X., Wan, G. H., and Sun, F. C. (2018). A comprehensive framework for transport infrastructure. Econ. Res. 53 (1), 50–64.
Zhang, P., Chen, P., Xiao, F., Sun, Y., Ma, S., and Zhao, Z. (2022). The impact of information infrastructure on air pollution: Empirical evidence from China. Int. J. Environ. Res. Public Health 19 (21), 14351. doi:10.3390/ijerph192114351
Zhang, H. A. (2016). Study on the strategic interaction of regional environmental regulations: An interpretation of the universality of incomplete enforcement of environmental regulations. China Ind. Econ. 7, 74–90. doi:10.19581/j.cnki.ciejournal.2016.07.006
Zhang, H. (2021). Trade openness and green total factor productivity in China: The role of ICT-based digital trade. Front. Environ. Sci. 9, 809339. doi:10.3389/fenvs.2021.809339
Zhao, W., Deng, F. H., and Huo, W. D. (2020). Trade effect of internet infrastructure in countries along the "belt and road" ——based on the intermediary effect analysis of trade cost and total factor productivity. J. Chongqing Univ. Soc. Sci. Ed. 26 (3), 19–33. doi:10.11835/j.issn.1008-5831.jg.2019.12.005
Keywords: infrastructure, urban green and smart development, domestic trade, opening-up, spatial spillover effect
Citation: Wang D, Xu L and Du J (2023) The direct and indirect spatial spillover effects of infrastructure on urban green and smart development. Front. Environ. Sci. 11:1197048. doi: 10.3389/fenvs.2023.1197048
Received: 30 March 2023; Accepted: 17 July 2023;
Published: 28 July 2023.
Edited by:
Gul Jabeen, Harbin Institute of Technology, Shenzhen, ChinaReviewed by:
Elchin Suleymanov, Baku Engineering University, AzerbaijanCopyright © 2023 Wang, Xu and Du. This is an open-access article distributed under the terms of the Creative Commons Attribution License (CC BY). The use, distribution or reproduction in other forums is permitted, provided the original author(s) and the copyright owner(s) are credited and that the original publication in this journal is cited, in accordance with accepted academic practice. No use, distribution or reproduction is permitted which does not comply with these terms.
*Correspondence: Lingyan Xu, eHVsaW5neWFuMzMzQDE2My5jb20=
Disclaimer: All claims expressed in this article are solely those of the authors and do not necessarily represent those of their affiliated organizations, or those of the publisher, the editors and the reviewers. Any product that may be evaluated in this article or claim that may be made by its manufacturer is not guaranteed or endorsed by the publisher.
Research integrity at Frontiers
Learn more about the work of our research integrity team to safeguard the quality of each article we publish.