 Songqiu Wang
 Jianping Guo
 Tian Xian3
 Wei Cheng
94% of researchers rate our articles as excellent or good
Learn more about the work of our research integrity team to safeguard the quality of each article we publish.
Find out more
ORIGINAL RESEARCH article
Front. Environ. Sci., 03 May 2023
Sec. Atmosphere and Climate
Volume 11 - 2023 | https://doi.org/10.3389/fenvs.2023.1195750
This article is part of the Research TopicClimate-Environment Interactions under Global WarmingView all 25 articles
The supergeostrophic flow remains seldomly reported from an observational perspective. Here, 1 year record of radar wind profiler measurements and ERA-5 reanalysis collected at Beijing observatory station are used to characterize the vertical structures of supergeostrophic wind and Ekman spirals in the lower troposphere. It is found that supergeostrophic flow shows significant diurnal variation, with lowest frequency for the supergeostrophic wind forming during daytime under clear-sky conditions, largely due to strong turbulent mixing and friction in the daytime. By comparison, the planetary boundary layer at night is stably stratified, the supergeostrophic wind occurs more frequently due to friction-induced decoupling from the ground surface. Furthermore, the presence of cloud makes the supergeostrophic wind occur more often in the daytime. Also, the geostrophic wind deviation within 1 km of atmosphere is found to be more negatively associated with the difference between surface temperature and 2-m air temperature compared with that in the altitude range of 1–3 km, indicating that the supergeostrophic wind near ground surface is more subject to the influence of heat flux. Intriguingly, most of the vertical wind profiles in the PBL are found not to follow Ekman spiral under neutral atmospheric conditions. The supergeostrophic winds contribute significantly to the magnitude of Ekman spirals in the upper mixed layer. Overall, the profiles and evolution features of the supergeostrophic wind and Ekman spirals observed in the lower troposphere in Beijing are much complicated than expected. The findings lay a solid foundation for better elucidating the low-level atmospheric dynamics in Beijing.
Geostrophic winds are parallel to the isobar, resulting from a balance between the Coriolis effect induced by the Earth’s rotation and the pressure gradient force (Jeffreys, 1926; Holton and Hakim, 2013). This balance is also called geostrophic equilibrium and is hardly seen in the planetary boundary layer (PBL), due largely to mechanical friction from the ground. Therefore, Ekman spirals dominate the upper part of PBL, particularly under the condition of neutral stratification (Ekman and Kullenberg, 1905). Theoretically, the large-scale horizontal winds in the upper atmosphere well above the PBL tend to be geostrophic in mid- and high-latitude regions. The spatial and temporal pattern of the geostrophic wind field is key to characterizing the dynamics and chemistry of the middle atmosphere (Garratt, 1985, 1994; Riese et al., 1999). The supergeostrophic wind occurs occasionally during daytime in the presence of convective storms and occurs frequently at night that is often referred to as the nocturnal low-level jet (NLLJ), which was observed late at night in the lowest few hundred meters above ground (Bonner, 1968; Takle et al., 2014). At night, the surface cools down, resulting in a thermal inversion, and the stably stratified PBL decouples from the aloft free atmosphere (Stull, 1988). The friction disappears and thus cause a NLLJ, which is also referred to as supergeostrophic wind. Besides, the inertia oscillation, synoptic-scale baroclinicity and sloping terrain are among the factors causing supergeostrophic wind or low-level jet (LLJ) (Davies, 2006; Kidston et al., 2010). Also, it has been long recognized that the supergeostrophic flow is oftentimes associated with the interaction between gravity wave and mesoscale convective systems (Zhang and Fritsch, 1987; Orlanski and Chang, 1993; He et al., 2022). The LLJ, or the low-level supergeostrophic wind, exhibits obvious diurnal variation, which usually occurs at night and in the early morning (Bonner, 1968; Wei et al., 2014; Miao et al., 2018). This significant diurnal variation can be explained by the well-established inertial oscillation theory proposed by Blackadar (1957).
The geostrophic flow is subject to the impact of various factors such as PBL height, shear and steering profile, and surface friction velocity (Baas et al., 2010; Falasca et al., 2016; Howland et al., 2020). Supergeostrophic wind represents the observed wind speed being greater than the geostrophic wind speed and is generally observed within a few kilometers of the low troposphere (Bonner, 1968; Stull, 1988). This is generally caused by the mechanically generated turbulence near the ground surface or large-scale forcing in the daytime. Normally, the ageostrophic motion in the atmosphere can be rapidly adjusted to the geostrophic wind through the dispersion effect of inertial gravity waves. However, during the transition period around dusk, it is generally assumed an ageostrophic wind profile in the lower troposphere owing to the disappearance of frictional constraint. This ageostrophic wind tends to undergo an inertial oscillation, which is closely connected to supergeostrophic wind several hours later (Thorpe and Guymer, 1977; Van de Wiel et al., 2010). The LLJ or supergeostrophic wind is well featured with the occurrence of significant geostrophic deviation (Akiyama, 1973), and tightly connected with the exchanges of heat, momentum, and air mass between surface and free atmosphere (Banta et al., 2002), thereby being linked to the occurrence of convective storms (Rife et al., 2010; Saggiorato et al., 2020).
With the advent of the state-of-the-art satellite-borne temperature measurements, our understanding of the geostrophic wind in the stratosphere and mesosphere has been steadily improved in recent years (e.g., Oberheide et al., 2002). By comparison, the knowledge remains limited concerning whether the geostrophic balance exists in the lower troposphere, especially in the PBL. Most of the previous studies are focused on theoretical analyses and numerical simulations (Cammas and Ramond, 1989; Howland et al., 2020). Russell and Takle (1985) found that above the LLJ, there existed a significant supergeostrophic flow, whose magnitude and lifetime were highly dependent on ageostrophic wind shear, by using a multilevel model that explicitly represented vertical gradients of the geostrophic wind. Few prior observational studies investigated the features of superstrophic winds due to the lack of wind profile observations. As an alternative, high-precision barometer measurements were used to compile a climatological record of near-surface geostrophic wind in Denmark (Kristensen and Jensen, 1999). Also, airborne radar altimeter measurements have been used to conduct analyses on the geostrophic winds at a given altitude (Parish et al., 1988) or the ageostrophic wind within a jet stream system near the tropopause (Shapiro and Kennedy, 1981). Nevertheless, few prior studies are heavily relying on the profiling observation of winds. The presence of cloud further complicates the evolution of wind profile (Koning et al., 2021).
The observational network of Radar wind profiler (RWP) in China came into operation as early as 2008 by the China Meteorological Administration, and is composed of more than 170 station at the time of writing this manuscript (Liu et al., 2020; Guo et al., 2021). This motivates us to further figure out the geostrophic wind in the lower troposphere and Ekman spirals in the PBL from an observational perspective. The remainder of this paper proceeds as follows: Section 2 describes the measurement, data and methods used in this study. In Section 3, we conduct a comprehensive observational analysis on the supergeostrophic wind and Ekman spirals in terms of its vertical structure, under both clear-sky and cloudy conditions in Beijing. The potential influential factors and mechanisms are discussed as well. It ends with several key findings summarized in Section 4.
In this study, the RWP data collected at Beijing observatory station (116.47°E, 39.80°N) was used to derive the climatology of vertical wind profile in the lower troposphere. The observational site of RWP is shown in Figure 1. Liu et al. (2020) reported that the RWP can provide wind profile with a vertical resolution of 120 m starting from the ground surface all the way up to a mean height of about 5 km above ground level (AGL), covering the period from January to December 2020. Prior to formal analysis, we have conducted data quality control to ensure that these wind profiling measurements are good enough to be used to characterize the geostrophic wind in Beijing (Liu et al., 2020). Noteworthy is that if more than 20% of the data below 3 km AGL are discarded or lost, the entire profile averaged during a given hour will be discarded. As a result, 7,194 valid hourly wind profiles were collected in Beijing.
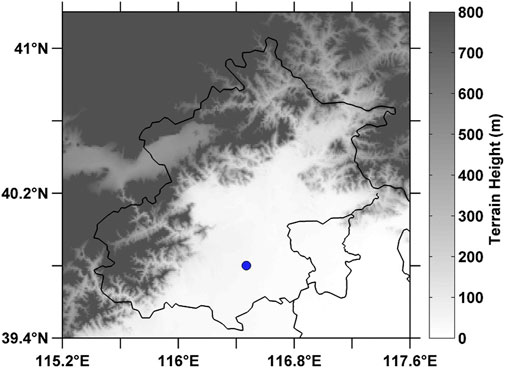
FIGURE 1. Topographical map surrounding Beijing observatory station (blue dot), at which the surface temperature, 2 m air temperature, surface pressure, rainfall, and wind profiles are measured.
To minimize the potential influence of rainfall, all the wind profile measurements from RWP analyzed here are constrained to those samples belonging to the non-rainy periods, which are screened using the 1-min rain gauge measurements at Beijing Observatory station shown in Figure 1. In addition, hourly measurements of ground surface temperature (Ts), air temperature at 2 m (Ta), and cloud fraction are obtained from the same weather station. All these meteorological datasets are subjected to strict data-quality control by the National Meteorological Information Center (NMIC) of the China Meteorological Administration; http://data.cma.cn/data/online.html?t=1) and have been used extensively in previous weather and climatological studies (Yu et al., 2010; Zhang and Zhai, 2011; Luo et al., 2016; Chen et al., 2018). All-day averaged cloud fraction and rain gauge data are used to discriminate between clear-sky and cloudy conditions. The clear-sky condition refers to those days with cloud fraction being below 20%, whereas cloudy condition refer to those non-rainy days with cloud fraction being above 80% (CMA 2003). In this way, we get 116 clear-sky days and 28 cloudy days, contributing 34.6% and 8.4% of the total number of days.
ERA-5, the fifth generation of global atmospheric reanalysis produced at the European Centre for Medium-Range Weather Forecasts (ECMWF), is the successor of ERA-interim. It exhibits significant improvements over previous reanalysis, due largely to the updated parameterization schemes and more observations assimilated, which lead to its capability of public access within 5 days behind real time in operational mode. Meanwhile, ERA-5 reanalysis provides a spatial resolution of 0.25° × 0.25 ° and a temporal resolution of 1-h. Particularly, the accuracy and performance have been well demonstrated in reproducing the variation of temperature, rainfall, wind, surface energy balance (Hersbach et al., 2020). Currently, it covers the period from 1950 to the present (Bell et al., 2021). Here we only use the pressure dataset at the grid centered at Beijing observatory station.
We define the wind speed observed by the RWP (Vobs) minus geostrophic wind speed calculated from the ERA-5 reanalysis (Vgeo) as geostrophic velocity deviation (VD). When the VD is greater than 0 (less than 0), the actual observed wind is manifested as supergeostrophic (subgeostrophic) flow, which is usually used to indicate the occurrence of low-level jet (Blackadar, 1957; Nagata and Ogura, 1991; Baas et al., 2009). It has been recognized that VD plays an important role in the production and transformation of atmospheric kinetic energy and mass redistribution.
Based on the pressure data from ERA-5, the geostrophic wind speed is derived by.
where
where
The isobaric coordinate from ERA-5 reanalysis has to be converted to the geometric height, in order to match the RWP measurements with ERA-5 reanalysis, according to the following barometric formula:
where
To better tease out the physical mechanisms behind the supergeostrophic wind observed in the study area, our analysis will be conducted on the daytime and nighttime samples separately. Unless otherwise noted, the daytime refers to the hours from 0900 BJT to 1700 BJT, and the nighttime refers to those from 2100 BJT to 0600 BJT.
In the PBL, pressure gradient force is balanced by Coriolis force and internal frictional force, and the frictional force is of crucial importance in keeping the wind from being geostrophic flow. The PBL can be divided into surface layer and Ekman layer, and the wind distribution in the Ekman layer can be ideally described from a mathematical view of point as description of Ekman spiral (Ellison, 1955). This is generally valid under the assumption of neutral atmospheric static condition.
To reveal how the Ekman spiral evolves with height, we determine the static stability of the PBL by using the metric of lower tropospheric stability (LTS). Following previous studies (e.g., Klein and Hartmann, 1993; Guo et al., 2018), LTS is formulated as follow:
Where θ denotes the potential temperature that is estimated from hourly ERA-5 reanalysis. All the LTS samples are divided into three subsets, each of which has the same number of samples. As shown in Figure 2, the neutral atmosphere conditions in this study correspond to the second tercile of LTS, which ranges from 10.6 K to 15.6 K.

FIGURE 2. Histogram showing the occurrence frequency of lower tropospheric stability (LTS) over Beijing observatory station, which is calculated using 1-year potential temperature dataset from ERA-5 reanalysis.
Figure 3 shows the normalized contoured frequency by altitude diagram (NCFAD) of VD at the lower troposphere under clear-sky and cloudy conditions in the daytime and nighttime, respectively. The vertical structures of VD in the PBL and aloft free troposphere exhibit frequent variations. In the daytime, the NCFAD of VD shows a similar pattern for both clear-sky and cloudy conditions: Below about 1.5 km AGL, subgeostrophic flow dominates since most negative VD samples occur in this altitude range. The Vobs is equal to Vgeo at about 1.5 km AGL, indicating quasi-geostrophic phenomenon occurs at this height. This also suggests that the daytime averaged PBL height can be reached up to 1.5 km AGL, well consistent with the PBL height as observed by the RWP in Beijing (Solanki et al., 2021). By comparison, VD is a small positive value above 1.5 km AGL, indicating supergeostrophic wind is observed albeit not obvious (Figures 3A,B). Under normal condition, stronger turbulence tends to occur in the PBL as compared with that in the free atmosphere, especially in the daytime, due to the stronger land-atmosphere exchanges induced by the solar radiation reaching the ground surface (Baas et al., 2009). This generally tends to result in more homogenous variation of Vobs with height in the daytime, as compared with the vertical variation at night.

FIGURE 3. Normalized contoured frequency by altitude diagram (NCFAD) of the wind speed observed by the RWP (Vobs) minus the geostrophic wind speed calculated from the ERA-5 reanalysis (Vgeo) during daytime (A–B) and nighttime (C–D). Also shown are the NCFADs for (A–C) clear-sky and (B–D) cloudy conditions. Note that the white vertical curves represent 50th percentile.
As shown in Figures 3C,D, the occurrence frequency of VD in the nighttime is biased towards positive above 0.5 km AGL under the both clear-sky and cloudy conditions. A close look at Figure 3 shows that at night the altitude where VD changes from negative to positive in the vertical drops sharply from 1.5 to 0.5 km AGL relative to that at daytime. Notably, the frequency of supergeostrophic wind at night reaches a maximum at around 1.5 km AGL and then descends with height, much larger than that at daytime. This means that supergeostrophic wind tends to occur more frequently at night compared with in daytime. This is because the stable boundary layer (SBL) formed by the combined effects of surface cooling and strong radiative cooling of the air induce a rapid decay of both turbulence and stress divergence (Kumar et al., 2006; Kallistratova and Kouznetsov, 2012), making the air in the residual layer suddenly or in the free troposphere have no friction force.
As shown in Figure 4A, the subgeostrophic wind under clear-sky condition only occurs below 0.5 km AGL for the period 0800 to 2,200 BJT with maximum wind from 1,200 to 1800 BJT. And during the hours after sunset, the supergeostrophic wind speed increases gradually above 0.5 km after 1800 BJT, the supergeostrophic wind speed reaches a maximum between 0000BJT and 0400 BJT at the height range of 1.5–2.25 km, then the speed gradually decreases at heights above 2.25 km AGL, which means that the supergeostrophy phenomenon is caused by the rapid increase of wind speed at the level of maximum jet flow at night. In contrast, the supergeostrophic wind under the cloudy condition can be found above 1 km AGL all day, but below 0.5 km AGL the wind speed is lower and the supergeostrophic wind cannot be easily found (Figure 4B). The supergeostrophic wind in the daytime under cloudy conditions is more obvious than that under the clear-sky conditions. This indicates that the diurnal variability of the supergeostrophic wind speed is also significantly influenced by clouds.
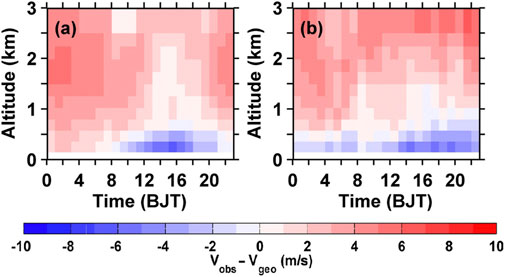
FIGURE 4. Diurnal variability of height-resolved geostrophic deviation (color shading) at Beijing observatory station under (A) clear-sky and (B) cloudy conditions, which is indicated by the wind observed by the RWP minus geostrophic wind as calculated from ERA-5 reanalysis.
The diurnal variation of the supergeostrophy wind observed here can be explained by inertial oscillation theory proposed by Blackadar (1957), in which inertial oscillations of important ageostrophic components are found to play an important role in the development of LLJ. As such, the wind is subgeostrophic within the PBL in the daytime. The wind component continues to develop overnight, triggered by decoupling of surface friction at sunset. The nocturnal wind profile presents an oscillation around the geostrophic wind vector with a period of 2π/f (f is the Coriolis parameter). As a result, the vertical profile of the horizontal wind takes on the common “nose” shape. This is generally consistent with previous LLJ observations at low levels (Kalapureddy et al., 2007; Wei et al., 2014). Apart from the well-established inertial oscillation theory, several other mechanisms could at least partly account for the formation of supergeostrophic LLJ, including the block effect by the mountains (Wexler, 1961), the baroclinicity associated with diurnal heating and cooling changes over sloping terrain (Holton, 1967), a secondary circulation beneath the exit region of an upper-level jet streak (Uccellini, 1980), and the land-sea thermal property difference (Beardsley et al., 1987).
Figure 5 shows the comparison analysis of diurnal variability of supergeostrophic winds within lowest 1 km of the atmosphere between daytime and nighttime in the year of 2020 at Beijing observatory station. Under clear-sky conditions, strong turbulent mixing and friction in the daytime tend to homogenize the wind profile in the lower troposphere, making it difficult to form supergeostrophic wind (Figure 5A). Noteworthy is that the occurrence frequency of supergeostrophic wind shows a gradual decreasing trend from sunrise to sunset, irrespective of clear-sky and cloudy conditions. During daytime, the frequency of supergeostrophic flow in the presence of cloud is higher than that under clear-sky conditions, most likely due to the stronger convective or entrainment activities caused by clouds in daytime. In contrast, the frequency of nighttime supergeostrophic wind increases gradually with time, and more frequent supergeostrophic wind tends to occur under clear-sky conditions than under cloudy conditions. In this case, the PBL is well decoupled from the underlying surface, and NLLJ or supergeostrophic wind tends to occur just above the SBL (Kalnay et al., 1996), particularly during clear-sky nighttime (Figure 5B). The impact of cloud on the diurnal cycle of supergeostrophic wind occurrence at night seems contrary to that as observed in the daytime.
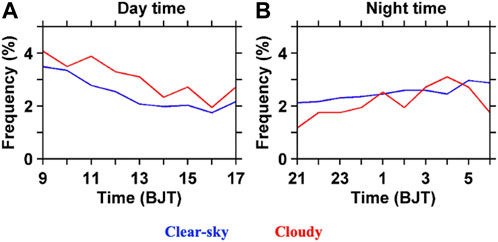
FIGURE 5. Comparison analysis of diurnal variability of supergeostrophic winds as calculated with the combination of RWP and ERA-5 reanalysis for (A) daytime averaged within lowest 1 km of the atmosphere, and (B) nighttime averaged within lowest 0.5 km of the atmosphere in the year of 2020 at Beijing observatory station. Note that the blue curves represent clear-sky conditions, whilst the red curves represent the cloudy conditions, which refer to cloud fraction being greater than 80%.
Besides the effect induced by the mechanical turbulent mixing in the PBL, the near-surface turbulent sensible heat flux is an importantenergy source driving the variation of air motion in the PBL, thereby affecting the profile of wind (Shen and Masahide, 2007; Zhou and Huang, 2010). Here, since recent studies (Cava et al., 2006; Liao et al., 2019) suggest that the difference between Ts and Ta basically reflects the variation characteristics of near-surface sensible heat flux, we here use Ts–Ta as an indicator for sensible heat flux to analyze its potential impact on supergeostrophic flow. When Ts–Ta is negative, it means that the radiative cooling effect dominates near the ground surface, and a downward sensible heat flux can be seen from the atmosphere to the ground surface. When Ts–Ta is positive, a upward sensible heat flux is typically observed. As illustrated in Figure 6A, the magnitude of Ts–Ta shows a unimodal distribution during daytime, reaching a maximum around 1300 BJT when being under strong influence of solar radiation heating. Interestingly, Ts–Ta remains always positive (particularly for the clear-sky conditions) during daytime, as opposed to the negative magnitude at night (Figure 6B) when surface radiative cooling effect dominates. Furthermore, the magnitude of Ts–Ta during nighttime is found to be much lower under cloudy conditions, compared with clear-sky nighttime. This could be mainly owing to the strong radiative warming effect of cloud at night, making a much weaker stratified SBL.
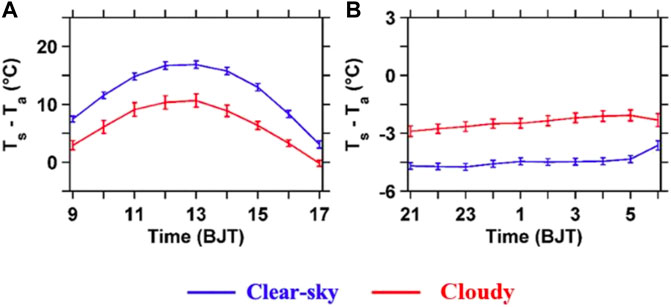
FIGURE 6. The same as Figure 4 but for the ground-surface temperature (Ts) minus air temperature at 2 m (Ta).
Figure 7 shows the VD as observed by the RWP at the Beijing observatory station as a function of Ts–Ta during the daytime. It is found that VD, overall, decreases significantly with the increase of the magnitude of Ts–Ta for the altitudes of 1 km and 2–3 km AGL. As expected, a much steeper regression slop is observed for the lowest atmosphere (within 1 km), as compared with high atmosphere (two to three km). This indicates that surface forcing can be much easily detected in the atmospheric layer that is closest to the ground surface.
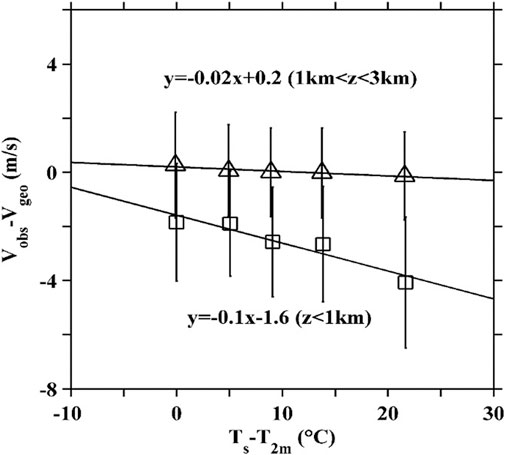
FIGURE 7. VD as observed by the RWP at the Beijing observatory station as a function of Ts minus Ta during the daytime. All samples are evenly divided into five bins, and the triangle (square) represents the samples belonging to the height of 1–3 km AGL (below 1 km AGL).
Figure 8 presents the joint probability distribution of u/ug and v/vg as observed by the RWP at Beijing observatory station at 0.35 km, 0.57 km, 0.79 km and 1.02 km AGL, respectively. Also shown are the Ekman spiral distributions at the corresponding height. Theoretically, the wind direction rotates clockwise with height in the PBL if the dominant forces acting on the air mass, such as Coriolis force and pressure gradient force, are not in equilibrium. Especially under neutral condition, most of the joint pairs of u/ug and v/vg are expected to be concentrated within the first quadrant of Figure 8. Nevertheless, most of samples in Figure 8 are clustered at the regions with u/ug and v/vg being less than one at low altitudes like 0.35 and 0.57 km AGL. Near the top of PBL such as 1.02 km AGL, a large fraction of samples can be observed with the values of u/ug and v/vg being greater than 1. This suggests that the wind speed observed by the RWP is found to increase with height, and the occurrence frequency of supergeostrophic wind could be likely increased with the increasing altitude.
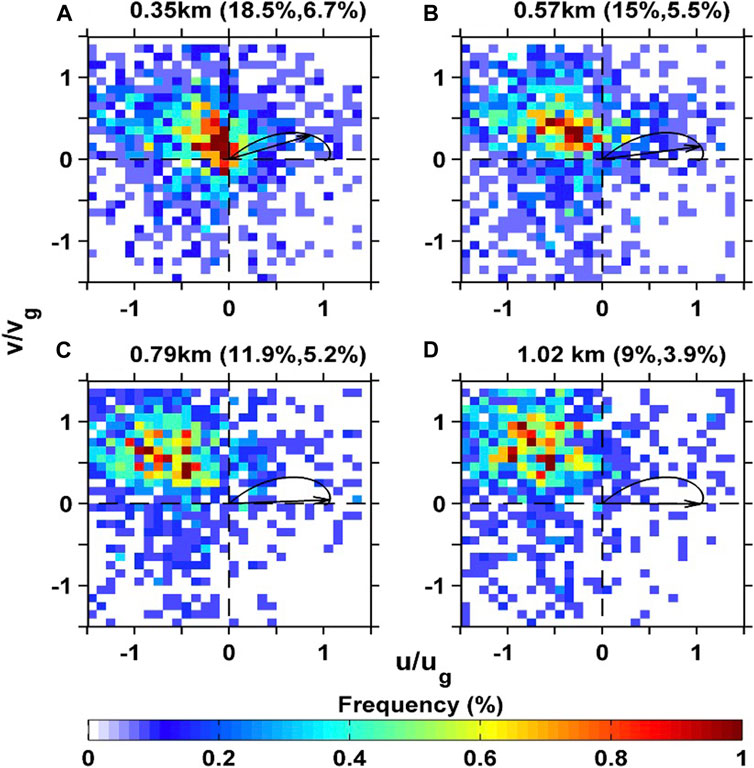
FIGURE 8. Joint probability distribution of u/ug versus v/vg at four different altitudes: (A) 0.35 km, (B) 0.57 km, (C) 0.79 km and (D) 1.02 km above ground level, in which u and v are obtained from the RWP measurements, and ug and vg are calculated from the ERA-5 reanalysis. Also shown is the hodograph of the wind components in the Ekman spirals. The arrow in each panel denotes the wind velocity at the above-mentioned four altitudes. The two numbers in the parenthesis represent the percentages which meet the criteria used to determine the first quadrant containing the Ekman spiral for all times and nighttime for a given day. It should be noted that all the results shown here are under neutral atmospheric condition, corresponding to the LTS values ranging from 10.6 to 15.6 K (c.f., Figure 2).
As shown in Figure 8, the probability for the occurrence of Ekman spiral tends to decrease with altitude in the PBL, even though the maximum percentage during all day (nighttime) is less than 20% (7%), which is generally consistent with previous findings (e.g., Lenn and Chereskin, 2009). This indicates that most of the observed winds in the PBL deviate substantially from the spiral pattern even in steady state barotropic situations with near neutral static stability, which generally agrees with previous studies (Holton and Hakim, 2013). The low probability of Ekman spiral observed in the upper altitude could means that the wind profiles near the top of PBL could be dramatically affected by the large pressure-driven flows, such as tides, internal waves, and the geostrophic currents (Lenn and Chereskin, 2009).
In this study, 1 year record of radar wind profiler measurements and ERA-5 reanalysis collected at Beijing observatory station were used to characterize the vertical structures of supergeostrophic wind and Ekman spirals in the lower troposphere. It is found that supergeostrophic wind is more likely to occur in the nighttime than in the daytime. The altitude where supergeostrophic wind oftentimes occurs generally corresponds to the height where the horizontal maximum wind speed of LLJ that is mainly caused by inertial oscillations. Overall, geostrophic flow shows significant diurnal variation in the vertical. In particular, the subgeostrophic wind in the daytime is mainly present within the PBL, whereas supergeostrophic wind tends to occur in the free troposphere (higher than 1.5 km AGL). By comparison, during the nighttime, supergeostrophic flow tends to occur more frequently, and the maximum occurrence frequency extends down to the altitudes below 0.5 km AGL.
The cloud impact on geostrophic wind is investigated as well. It is hard for the supergeostrophic wind to be formed during daytime under clear-sky conditions due to strong turbulent mixing and friction in the daytime. The presence of cloud makes the supergeostrophic wind occur more often in the daytime, probably owing the strong convective instability caused by clouds. By comparison, the nighttime supergeostrophic wind is found to occur more frequently than in the daytime. This could be due to the much weaker surface cooling by the aloft cloud cover, resulting in not well decoupled PBL from the ground surface. The PBL at night, nevertheless, is stably stratified, and the LLJ is more likely to occur at night due to friction decoupling, and supergeostrophic wind occurs more often. This in turn leads to frequent supergeostrophic wind occurring above the PBL. Besides, the supergeostrophic wind at 1 km AGL and below is more subject to the influence of ground surface heat flux, compared with higher atmosphere (one to three km AGL).
Overall, most of the vertical wind profiles in the PBL are found not to follow Ekman spiral under neutral atmospheric conditions. The joint probability distributions of u/ug and v/vg indicate that less than 20% of the all-day wind observations lie in the first quadrant of Figure 8 (i.e., Ekman spiral distribution), no matter the altitudes are 0.35 km, 0.57 km, 0.79 km or 1.02 km AGL. The nighttime observations have less probability to follow Ekman spiral pattern in the PBL. The wind direction rotates clockwise with height, and the higher probability of u/ug and v/vg occurrence is concentrated in the first quadrant. The occurrence frequency of Ekman spirals gradually decreases, but the occurrence rate of Ekman spirals at night gradually increases with altitude, and at 1.02 km, the frequency of supergeostrophic wind increased. It shows that there is inertial oscillation in the boundary layer and the supergeostrophic winds can contribute significantly to the magnitude of Ekman spirals in the upper mixed layer.
In conclusion, we present observational results of the supergeostrophic wind and Ekman spirals in the lower troposphere in Beijing. Their vertical and diurnal variation is much complicated than expected. More importantly, the driving forcings and underlying mechanism are myriad and deserve more observational analyses and numerical experiments based on large eddy simulation.
The datasets presented in this study can be found in online repositories. The names of the repository/repositories and accession number(s) can be found in the article/supplementary material.
The study was completed with close cooperation between all contributing authors. JG conceived of the idea for assessing the supergeostrophic wind by using radar wind profiler data in Beijing; SW conducted the data analyses and wrote the manuscript; JG, NL, TX, DM, HL, and WC discussed the experimental results, and all coauthors helped reviewing the manuscript.
This work was jointly supported by the Youth Cross Team Scientific Research Project of the Chinese Academy of Sciences under grant JCTD-2021-10, the National Natural Science Foundation of China under grant U2142209, and the Chinese Academy of Meteorological Sciences under grant 2021KJ008.
The authors declare that the research was conducted in the absence of any commercial or financial relationships that could be construed as a potential conflict of interest.
All claims expressed in this article are solely those of the authors and do not necessarily represent those of their affiliated organizations, or those of the publisher, the editors and the reviewers. Any product that may be evaluated in this article, or claim that may be made by its manufacturer, is not guaranteed or endorsed by the publisher.
Akiyama, T. (1973). Ageostrophic low-level jet stream in the Baiu season associated with heavy rainfalls over the sea area. J. Meteor. Soc. Jpn. 51, 205–208. doi:10.2151/jmsj1965.51.3_205
Baas, P., Bosveld, F. C., Klein Baltink, H., and Holtslag, A. A. M. (2009). A climatology of nocturnal low-level jets at Cabauw. J. Appl. Meteorology Climatol. 48 (8), 1627–1642. doi:10.1175/2009jamc1965.1
Baas, P., Bosveld, F., Lenderink, G., van Meijgaard, E., and Holtslag, A. A. M. (2010). How to design single-column model experiments for comparison with observed nocturnal low-level jets. Q. J. R. Meteorol. Soc. 136, 671–684. doi:10.1002/qj.592
Banta, R. M., Newsom, R. K., Lundquist, J. K., Pichugina, Y. L., Coulter, R. L., and Mahrt, L. (2002). Nocturnal low-level jet characteristics over Kansas during CASES-99. Bound. Layer. Meteorol. 105 (2), 221–252. doi:10.1023/a:1019992330866
Beardsley, R. C., Dorman, C. E., Friehe, C. A., Rosenfeld, L. K., and Winant, C. D. (1987). Local atmospheric forcing during the coastal ocean dynamics experiment: 1. A description of the marine boundary layer and atmospheric conditions over a northern California upwelling region. J. Geophys. Res. 92 (C2), 1467–1488. doi:10.1029/JC092iC02p01467
Bell, B., Hersbach, H., Simmons, A., Berrisford, P., Dahlgren, P., Horányi, A., et al. (2021). The ERA5 global reanalysis: Preliminary extension to 1950. Q. J. R. Meteorol. Soc. 147, 4186–4227. doi:10.1002/qj.4174
Blackadar, A. K. (1957). Boundary layer wind maxima and their significance for the growth of nocturnal inversions. Bull. Amer. Meteor. Soc. 38, 283–290. doi:10.1175/1520-0477-38.5.283
Bonner, W. D. (1968). Climatology of the low level jet. Mon. Weather Rev. 96 (12), 833–850. doi:10.1175/1520-0493(1968)096<0833:COTLLJ>2.0.CO;2
Cammas, J., and Ramond, D. (1989). Analysis and diagnosis of the composition of ageostrophic circulations in jet-front systems. Mon. Weather Rev. 117 (11), 2447–2462. doi:10.1175/1520-0493(1989)117<2447:aadotc>2.0.co;2
Cava, D., Katul, G. G., Scrimieri, A., Poggi, D., Cescatti, A., and Giostra, U. (2006). Buoyancy and the sensible heat flux budget within dense canopies. Boundary-Layer Meteorol. 118, 217–240. doi:10.1007/s10546-005-4736-1
Chen, X., Yuan, H. L., and Xue, M. (2018). Spatial spread-skill relationship in terms of agreement scales for precipitation forecasts in a convection-allowing ensemble. Quart. J. Roy. Meteor. Soc. 144, 85–98. doi:10.1002/qj.3186
Davies, P. A. (2006). Development and mechanisms of the nocturnal jet. Meteorol. Appl. 7 (3), 239–246.
Ekman, V. W., and Kullenberg, B. (1905). On the influence of the earth’s rotation on ocean-currents. Ark. Mat. Astron 2 (11), 1–53.
Ellison, T. H. (1955). The Ekman spiral. Q. J. R. Meteorological Soc. 81 (350), 637–638. doi:10.1002/qj.49708135025
Falasca, S., Catalano, F., and Moroni, M. (2016). Numerical study of the daytime planetary boundary layer over an idealized urban area: Influence of surface properties, anthropogenic heat flux, and geostrophic wind intensity. J. Appl. Meteorology Climatol. 55 (4), 1021–1039. doi:10.1175/jamc-d-15-0135.1
Garratt, J. R. (1985). The inland boundary layer at low latitudes. Bound. Layer. Meteorol. 32, 307–327. doi:10.1007/bf00121997
Guo, J., Liu, H., Li, Z., Rosenfeld, D., Jiang, M., Xu, W., et al. (2018). Aerosol-induced changes in the vertical structure of precipitation: A perspective of TRMM precipitation radar. Atmos. Chem. Phys. 18, 13329–13343. doi:10.5194/acp-18-13329-2018
Guo, J., Zhang, J., Yang, K., Liao, H., Zhang, S., Huang, K., et al. (2021). Investigation of near-global daytime boundary layer height using high-resolution radiosondes: First results and comparison with ERA-5, MERRA-2, JRA-55, and NCEP-2 reanalyses. Atmos. Chem. Phys. 21, 17079–17097. doi:10.5194/acp-21-17079-2021
He, Y., Zhu, X., Sheng, Z., He, M., and Feng, Y. (2022). Observations of inertia gravity waves in the western pacific and their characteristic in the 2015/2016 quasi-biennial oscillation disruption. J. Geophys. Res. Atmos. 127, e2022JD037208. doi:10.1029/2022jd037208
Hersbach, H., Bell, B., Berrisford, P., Hirahara, S., Horányi, A., Muñoz-Sabater, J., et al. (2020). The ERA5 global reanalysis. Q. J. Roy. Meteor. Soc. 146 (730), 1999–2049. doi:10.1002/qj.3803
Holton, J. R. (1967). The diurnal boundary layer wind oscillation above sloping terrain. Tellus 19 (2), 199–205. doi:10.1111/j.2153-3490.1967.tb01473.x
Howland, M. F., Ghate, A. S., and Lele, S. K. (2020). Influence of the geostrophic wind direction on the atmospheric boundary layer flow. J. Fluid Mech. 883, A39. doi:10.1017/jfm.2019.889
Jeffreys, H. (1926). On the dynamics of ceostrophic winds: ON the dynamics of ceostrophic winds. Quart. J. Roy. Meteor. Soc. 52 (217), 85–104. doi:10.1002/qj.49705221708
Kalapureddy, M. C. R., Rao, D. N., Jain, A. R., and Ohno, Y. (2007). Wind profiler observations of a monsoon low-level jet over a tropical Indian station. Ann. Geophys. 25 (10), 2125–2137. doi:10.5194/angeo-25-2125-2007
Kallistratova, M. A., and Kouznetsov, R. D. (2012). Low-level jets in the Moscow region in summer and winter observed with a sodar network. Boundary-layer Meteorol. 143 (1), 159–175. doi:10.1007/s10546-011-9639-8
Kalnay, E., Kanamitsu, M., Kistler, R., Collins, W., Deaven, D., Gandin, L., et al. (1996). The NCEP/NCAR 40-year reanalysis project. Bull. Am. Meteorological Soc. 77 (3), 437–471. doi:10.1175/1520-0477(1996)077<0437:tnyrp>2.0.co;2
Kidston, J., Frierson, D. M. W., Renwick, J. A., and Vallis, G. K. (2010). Observations, simulations, and dynamics of jet stream variability and annular modes. J. Clim. 23 (23), 6186–6199. doi:10.1175/2010jcli3235.1
Klein, S. A., and Hartmann, D. L. (1993). The seasonal cycle of low stratiform clouds. J. Clim. 6, 1587–1606.
Koning, A. M., Nuijens, L., Bosveld, F. C., Siebesma, A. P., van Dorp, P. A., and Jonker, H. J. J. (2021). Surface-layer wind shear and momentum transport from clear-sky to cloudy weather regimes over land. J. Geophys. Res. Atmos. 126, e2021JD035087. doi:10.1029/2021JD035087
Kumar, V., Kleissl, J., Meneveau, C., and Parlange, M. B. (2006). Large-eddy simulation of a diurnal cycle of the atmospheric boundary layer: Atmospheric stability and scaling issues. Water Resour. Res. 42 (6), W06D09. doi:10.1029/2005WR004651
Lenn, Y. D., and Chereskin, T. K. (2009). Observations of ekman currents in the southern ocean. J. Phys. Ocean. 39, 768–779. doi:10.1175/2008jpo3943.1
Liao, Y., Chen, D., and Liu, Q. (2019). The spatiotemporal characteristics and long-term trends of surface-air temperatures difference in China[J]. Clim. Change Res. 15 (4), 374–384.
Liu, B., Guo, J., Gong, W., Shi, L., Zhang, Y., and Ma, Y. (2020). Characteristics and performance of wind profiles as observed by the radar wind profiler network of China. Atmos. Meas. Tech. 13, 4589–4600. doi:10.5194/amt-13-4589-2020
Luo, Y. L., Wu, M. W., Ren, F. M., Li, J., and Wong, W. K. (2016). Synoptic situations of extreme hourly precipitation over China. J. Clim. 29, 8703–8719. doi:10.1175/JCLI-D-16-0057.1
Miao, Y., Guo, J., Liu, S., Wei, W., Zhang, G., Lin, Y., et al. (2018). The climatology of low-level jet in Beijing and Guangzhou, China. J. Geophys. Res. Atmos. 123 (5), 2816–2830. doi:10.1002/2017jd027321
Nagata, M., and Ogura, Y. (1991). A modeling case study of interaction between heavy precipitation and a low-level jet over Japan in the Baiu season. Mon. weather Rev. 119 (6), 1309–1336. doi:10.1175/1520-0493(1991)119<1309:amcsoi>2.0.co;2
Oberheide, J., Lehmacher, G. A., Offermann, D., Grossmann, K. U., Manson, A. H., Meek, C. E., et al. (2002). Geostrophic wind fields in the stratosphere and mesosphere from satellite data. J. Geophys. Res. 107 (D23), CRI 3-1–CRI 3-18. doi:10.1029/2001JD000655
Orlanski, I., and Chang, E. K. M. (1993). Ageostrophic geopotential fluxes in downstream and upstream development of baroclinic waves. J. Atmos. Sci. 50 (2), 212–225. doi:10.1175/1520-0469(1993)050<0212:agfida>2.0.co;2
Parish, T. R., Rodi, A. R., and Clark, R. D. (1988). A case study of the summertime Great Plains low level jet. Mon. Weather Rev. 116 (1), 94–105. doi:10.1175/1520-0493(1988)116<0094:acsots>2.0.co;2
Riese, M., Spang, R., Preusse, P., Ern, M., Jarisch, M., Offermann, D., et al. (1999). Cryogenic Infrared Spectrometers and Telescopes for the Atmosphere (CRISTA) limb scan measurements, data processing, and atmospheric temperature and trace gas retrieval. J. Geopyhs. Res. 104, 16,349–16,367.
Rife, D. L., Pinto, J. O., Monaghan, A. J., Davis, C. A., and Hannan, J. R. (2010). Global distribution and characteristics of diurnally varying low-level jets. J. Clim. 23 (19), 5041–5064. doi:10.1175/2010jcli3514.1
Russell, R. D., and Takle, E. S. (1985). A numerical study of the effects of synoptic baroclinicity on stable boundary-layer evolution. Bound-Layer Meteor 31, 385–418. doi:10.1007/bf00120837
Saggiorato, B., Nuijens, L., Siebesma, A. P., de Roode, S., Sandu, I., and Papritz, L. (2020). The influence of convective momentum transport and vertical wind shear on the evolution of a cold air outbreak. J. Adv. Model. Earth Syst. 12, e2019MS001991. doi:10.1029/2019ms001991
Shapiro, M. A., and Kennedy, P. J. (1981). Research aircraft measurements of jet stream geostrophic and ageostrophic winds. J. Atmos. Sci. 38 (12), 2642–2652. doi:10.1175/1520-0469(1981)038<2642:ramojs>2.0.co;2
Shen, X. S., and Masahide, K. (2007). Studies of the interannual variability of springtime Eurasian surface air temperature. Chin. J. Atmos. Sci. 31 (1), 19–27.
Solanki, R., Guo, J., Li, J., Singh, N., Guo, X., Han, Y., et al. (2021). Atmospheric boundary layer height variation over mountainous and urban sites in Beijing as derived from radar wind profiler measurements. Boundary-Layer Meteorol. 181 (1), 125–144. doi:10.1007/s10546-021-00639-9
Stull, R. B. (1988). “An introduction to boundary layer meteorology,” in An introduction to boundary layer meteorology. Editor R. B. Stull (Springer). doi:10.1007/978-94-009-3027-8
Takle, E. S., Rajewski, D. A., Lundquist, J. K., Gallus, W. A., and Sharma, A. (2014). Measurements in support of wind farm simulations and power forecasts: The Crop/Wind-energy Experiments (CWEX). J. Phys. Conf. Ser. 524, 012174. doi:10.1088/1742-6596/524/1/012174
Thorpe, A. J., and Guymer, T. H. (1977). The nocturnal jet. Q.J.R. Meteorol. Soc. 103, 633–653. doi:10.1002/qj.49710343809
Uccellini, L. W. (1980). On the role of upper tropospheric jet streaks and leeside cyclogenesis in the development of low level jets in the Great Plains. Mon. Weather Rev. 108 (10), 1689–1696. doi:10.1175/1520-0493(1980)108<1689:OTROUT>2.0.CO;2
Van de Wiel, B. J. H., Moene, A. F., Steeneveld, G. J., Baas, P., Bosveld, F. C., and Holtslag, A. A. M. (2010). A conceptual view on inertial oscillations and nocturnal low-level jets. J. Atmos. Sci. 67 (8), 2679–2689. doi:10.1175/2010jas3289.1
Wei, W., Zhang, H. S., and Ye, X. X. (2014). Comparison of low-level jets along the north coast of China in summer. J. Geophys. Res. Atmos. 119 (16), 9692–9706. doi:10.1002/2014jd021476
Wexler, H. (1961). A boundary layer interpretation of the low-level jet. Tellus 13 (3), 368–378. doi:10.3402/tellusa.v13i3.9513
Yu, R., Li, J., Yuan, W., and Chen, H. (2010). Changes in characteristics of late-summer precipitation over eastern China in the past 40 years revealed by hourly precipitation data. J. Clim. 23, 3390–3396.
Zhang, D., and Fritsch, J. M. (1987). Numerical simulation of the meso-β scale structure and evolution of the 1977 johnstown flood. Part II: Inertially stable warm-core vortex and the mesoscale convective complex. J. Atmos. Sci. 44 (18), 2593–2612. doi:10.1175/1520-0469(1987)044<2593:nsotms>2.0.co;2
Zhang, H., and Zhai, P. M. (2011). Temporal and spatial characteristics of extreme hourly precipitation over eastern China in the warm season. Adv. Atmos. Sci. 28, 1177–1183. doi:10.1007/s00376-011-0020-0
Keywords: supergeostrophic wind, Ekman spiral, radar wind profiler, wind speed, Beijing
Citation: Wang S, Guo J, Xian T, Li N, Meng D, Li H and Cheng W (2023) Investigation of low-level supergeostrophic wind and Ekman spiral as observed by a radar wind profiler in Beijing. Front. Environ. Sci. 11:1195750. doi: 10.3389/fenvs.2023.1195750
Received: 28 March 2023; Accepted: 13 April 2023;
Published: 03 May 2023.
Edited by:
Haipeng Yu, Chinese Academy of Sciences (CAS), ChinaReviewed by:
Tao Huang, The Chinese University of Hong Kong, ChinaCopyright © 2023 Wang, Guo, Xian, Li, Meng, Li and Cheng. This is an open-access article distributed under the terms of the Creative Commons Attribution License (CC BY). The use, distribution or reproduction in other forums is permitted, provided the original author(s) and the copyright owner(s) are credited and that the original publication in this journal is cited, in accordance with accepted academic practice. No use, distribution or reproduction is permitted which does not comply with these terms.
*Correspondence: Jianping Guo, anBndW9jYW1zQGdtYWlsLmNvbQ==
Disclaimer: All claims expressed in this article are solely those of the authors and do not necessarily represent those of their affiliated organizations, or those of the publisher, the editors and the reviewers. Any product that may be evaluated in this article or claim that may be made by its manufacturer is not guaranteed or endorsed by the publisher.
Research integrity at Frontiers
Learn more about the work of our research integrity team to safeguard the quality of each article we publish.