
95% of researchers rate our articles as excellent or good
Learn more about the work of our research integrity team to safeguard the quality of each article we publish.
Find out more
BRIEF RESEARCH REPORT article
Front. Environ. Sci. , 27 July 2023
Sec. Freshwater Science
Volume 11 - 2023 | https://doi.org/10.3389/fenvs.2023.1193393
 Alix Hervé1,2,3
 Isabelle Domaizon2,4Jean-Marc Baudoin2,5Tony Dejean1Pierre Gibert2,3Alice Valentini1
 Maxime Logez2,3,6*
Various factors can influence the concentration of eDNA found in the environment and blur the link between eDNA results and in situ fish abundances, biomasses or even occurrences. We studied the influence of one abiotic factor, the temperature, and one biotic factor, the fish size class, on the amount of fish eDNA detectable in water. To do so, we conducted two controlled experiments using tench (Tinca tinca, L) placed into outdoor mesocosms during 1 week. The quantification of fish eDNA abundances was performed using quantitative PCR after filtrating a large volume of water (30 L). The Bayesian hierarchical ANOVAs performed on qPCR results did not detect the effect of size class on eDNA amount, but fish eDNA concentration was shown to increase significantly when temperature rose by 6°C (no effect detected at 3°C). This suggests that fish assemblage quantification of two thermally contrasting sites through eDNA is not directly comparable.
Environmental DNA (eDNA) analysis is increasingly used for aquatic biomonitoring, either to monitor the presence/absence of a given species or to assess the composition of fish assemblages. In parallel several methods are used to efficiently quantify species eDNA concentrations (used as a proxy of fish abundances) such as the quantitative PCR (qPCR; Doi et al., 2017; Fukaya et al., 2020; Kamoroff and Goldberg, 2018; Takahara et al., 2012) or digital droplet PCR (Doi et al., 2015a; Doi et al., 2015b; Capo et al., 2019). Recent developments have combined eDNA metabarcoding method with qPCR quantification techniques to assess the abundances of different species composing fish assemblages (van Bleijswijk et al., 2020), by matching the total eDNA quantity per sample and the relative abundance retrieved from the metabarcoding results (van Bleijswijk et al., 2020; Pont et al., 2023). Such methods offer the possibility to simultaneously quantify all species from a given community. Nonetheless, before using such an approach, it is necessary to assess how biotic and abiotic factors affect this quantification, with a simplified model.
Indeed, several factors can influence the eDNA concentration in the environment and among them fish biomass is a key biological factor (Doi et al., 2017; Itakura et al., 2020). Additionally, as eDNA released is linked to metabolism (Lacoursiere-Roussel et al., 2016; Yates et al., 2021), it could be expected that mass-specific eDNA production is higher for small individuals such as juveniles than for larger ones (Maruyama et al., 2014; Yates et al., 2021). However, Jo et al. (2019) and Mizumoto et al. (2018) reported contradicting results, whereby larger individuals were the greatest eDNA releasers. In any case, the size structure of populations may influence the eDNA signal (Yates et al., 2019; Yates et al., 2021) and this constitutes a serious issue when inferring biomass from eDNA quantification.
Such estimation is also challenged by the role played by abiotic factors such as temperature on eDNA concentration in the water (Harrison et al., 2019; Yates et al., 2021). Temperature plays a major role in the activity of ectotherms, which affects the amount of DNA released by fish in the environment (Strickler et al., 2015). On the one hand, the increase in temperature during spring is the main factor for exiting winter dormancy and inducing the reproductive behaviour in most species (except winter-spawners such as salmonids) from temperate regions (de Souza et al., 2016; Avlijaš et al., 2018; Thalinger et al., 2021). In this case, temperature indirectly influences the amount of eDNA by affecting the level of activity of the species. On the other hand, it has been demonstrated that an increase in temperature favours eDNA decay by spontaneously degrading DNA and by increasing DNA decomposition through the enhanced activity of microorganisms (Lance et al., 2017; Harrison et al., 2019). Studies that have investigated the role of temperature in fish eDNA commonly used large thermal gaps, greater than 5°C between consecutive treatments (Jo et al., 2019; Caza-Allard et al., 2022). Furthermore, all of these experimental studies were conducted under controlled constant temperatures without considering the natural circadian fluctuations of temperature. Therefore, the role played by temperature over restricted thermal gradients and in conditions closer to natural conditions still needs further investigation.
To test which factor may influence fish community eDNA quantification, we conducted two controlled experiments focusing on only one species, as a simplified experimental model. The first experiment compared the eDNA concentration of the species placed in three different thermal conditions but with natural circadian fluctuations of temperature, while the second experiment investigated the effect of population size structures on the eDNA quantity released in fish populations with equivalent biomasses.
Tinca tinca L. was chosen as a model species because this is a native species that is widely distributed in European lakes; characterised by a calm temper, this species shows no hostility towards its congeners, which is relevant for experimental studies (Caza-Allard et al., 2022).
For the temperature experiment, we chose to test the impact of temperature on the tolerated range of this species, with low variations between treatments to submit individuals to a plausible variation of temperature in a natural environment, rather than expose them to extreme ranges in temperature as previously evaluated in several studies (Jo et al., 2019; Caza-Allard et al., 2022). Moreover, this gradient was non-stressful for this thermo-tolerant species. Indeed, tench can tolerate temperatures from 0°C to 38°C, with a preference range between 20°C and 26°C (Avlijaš et al., 2018). Populations of T. tinca were composed of six small individuals (94.0 mm ± 6.85 mm, 10.9 g ± 3 g), one medium-sized individual (239.9 mm ± 19.1 mm, 211 g ± 51.0 g) and one large fish (316 mm ± 33 mm, 452 g ± 94.6 g). They were placed into 12 large outdoor mesocosms (about 775 L) for 6 days, under three thermal treatments (four replicates per treatment): ambient temperature (AT), AT plus 3°C (AT3) and AT plus 6°C (AT6). Each mesocosm was equipped with a thermal regulation system that set the temperature based on the temperature measured in a control mesocosm, which defined the AT conditions. This system maintained a constant (controlled) deviation in temperature between mesocosms (i.e., AT3, AT6) and maintained the natural circadian fluctuations within each mesocosm (between 5.5°C and 14°C for AT, 8.5°C and 17°C for AT3 and 11.5°C and 20°C for AT6) (Supplementary Figure S1).
To test the effect of fish size classes on eDNA signal, three treatments were choose along a gradient of adult size classes and thus of fish weight: small (281 mm ± 24.5 mm, 321 g ± 83.8 g), medium (346.7 mm ± 10.2 mm, 594.3 g ± 52.1 g) and large (396.4 mm ± 16.1 mm, 877.5 g ± 63.8 g). Within each mesocosm T. tinca population was composed of fish from one size class but with comparable biomass (mean = 1714 g, standard deviation = 125 g). The experiment lasted 8 days, using the same facilities (∼725 L mesocosms, 649–764 L) but with similar temperatures between mesocosms (average difference of 0.125°C, Supplementary Figure S2) which varied from 6°C to 14.8°C. During both experiments, from a few days before the start of the experiment until the last day of the experiment, fish were starved because nutrition can influence DNA production (Klymus et al., 2015), and under these temperatures, fasting was not considered stressful. Even if pH and ultraviolet B radiations are known to influence eDNA degradation (Strickler et al., 2015), their influence on the results were supposed to be similar among mesocosms. Indeed, pH values were comparable among the mesocosms (maximum deviation value of 0.2 between the lowest and highest pH values), and the outdoor mesocosms are located in open landed area of the south of France (43.523°N, 5.511°E) with expected similar Sun radiations.
All macro-organisms were removed from the water before the experiments to ensure that potential fish DNA was naturally degraded in the water for at least 1 week through UV and microorganism activity (Thomsen et al., 2012). Three to four pre-treatment eDNA samples were collected before fish were placed into the mesocosms to verify the fish eDNA concentration prior fish introduction. At the end of each experiment, in each mesocosm, 30 L of water was filtered with a VigiDNA 0.45 μm filter capsule (SPYGEN, France), following the protocol described in Cantera et al. (2019). At the end of each filtration, the water inside the capsule was emptied and the capsule was filled with 80 mL of CL1 Conservation buffer (SPYGEN) and stored at room temperature. The DNA extraction and the amplification with teleo primers (Valentini et al., 2016) by quantitative PCR was performed following the protocol described in Pont et al. (2023). Two DNA extractions followed by a qPCR were performed to verify the absence of eDNA contamination. All controls were negative; the two DNA extraction controls were sequenced in Hervé et al. (2022) and only human DNA was found. To be comparable, the qPCR results were expressed in number of DNA copies per Gram of fish, after being corrected by the volume and the fish biomass of each mesocosm. The quantifications were not biased by the previous existence of eDNA in the mesocosms. Six of the seven pre-treatment samples were negatives and one displayed an eDNA concentration that was 444-fold lower than what was observed at the end of the experiments, and then considered negligible (Supplementary Table S1).
T. tinca were held in captivity under permit number A1300101 granted by the French authority of the “Direction départementale de la protection des populations des Bouches-du- Rhône” under articles R 214-87, R 214-122, and R 215-10 of the French law. At the end of the experiments, fish were euthanized using anaesthetic overdose (eugenol) in accordance with the European Directive 2010/63/EU.
To test the effect of each factor on eDNA amount, we used Bayesian hierarchical ANOVAs with non-informative priors, to take into account the variability between mesocosms within the same treatment. For each mean treatment parameter (
The effect of temperature on fish eDNA concentration was marked and significant (as revealed by the posterior distribution of the deviation between mean values) when comparing AT and AT6 (Figures 1A–C), with a higher number of DNA copies (on average 1.71 times greater) observed for the highest temperature. The pattern observed for AT3 showed a high variation of DNA concentrations between mesocosms (Figures 1A, B), while the variation between PCR replicates was still low (points from the same mesocosm are very close on Figures 1A, B; posterior distribution of within mesocosm variances in Supplementary Figure S3).
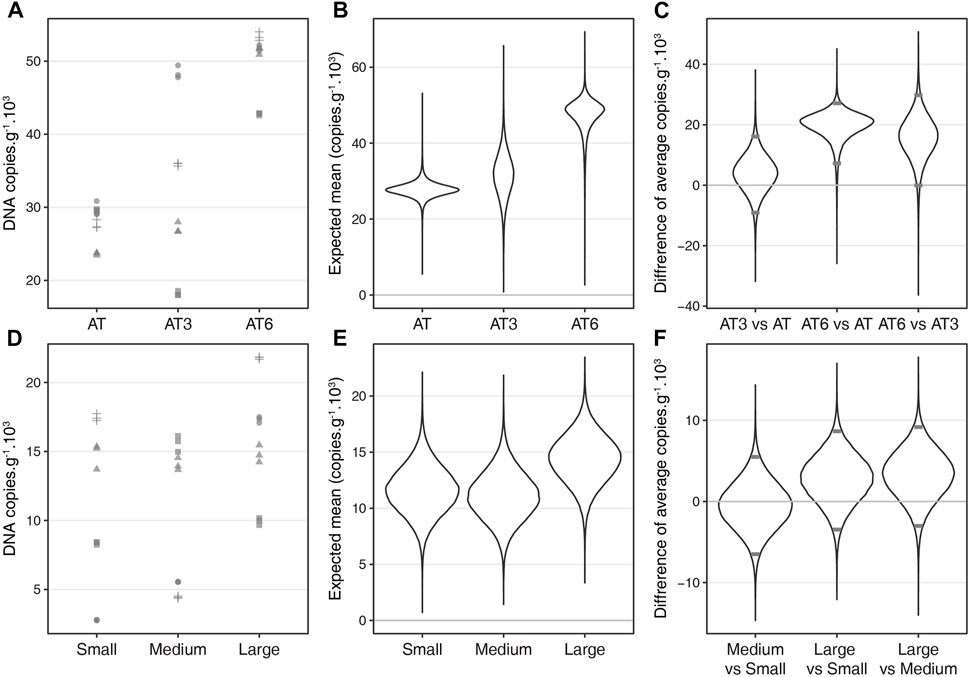
FIGURE 1. Results of the experiments on temperature (A–C) and fish size class (D–F). The qPCR results are presented as number of copies standardized to fish biomass quantified for each temperature treatment (A) and each size class treatment (D) (qPCR replicates from each mesocosm are represented with the same shape). The posterior distributions (from the Bayesian hierarchical linear model) of the average number of copies per treatment are illustrated for temperature treatment (B) and size class treatment (E). The differences between the average values of each treatment are compared two by two for temperature treatment (C) and size class treatment (F). Differences are considered significant if the 95% credible interval (between the grey horizontal bars) does not include 0.
No effect of size classes on the amount of eDNA was detected when standardised to the fish biomass within each mesocosm (Figures 1D–F). Each CIs (95%) derived from the posterior distribution of the deviation between the average values of two size classes (e.g., medium vs. small) included zero (Figure 1F).
It has been shown that fish eDNA concentration in the water is a balance between the activity of individuals (DNA released is thought to increase with the level of fish activity) and eDNA degradation by microorganisms and free enzymes (Harrison et al., 2019). AT6 conditions were close to the preferential range of T. tinca (Avlijaš et al., 2018), suggesting that in these conditions the eDNA release increased and outweighed the effect of degradation due to microbial activity. This pattern is consistent with majority of the previously observed temperature–eDNA relationship (i.e., Caza-Allard et al., 2022) but is much more marked than what was observed in previous studies, even when considering a wider thermal gradient (Jo et al., 2019). Some authors also found no relationship between temperature and eDNA amount, even in laboratory conditions, with contrasted thermal conditions (Rourke et al., 2023).
Regarding the effect of fish size classes on the amount of eDNA found in the water using universal fish primers, no clear and significant pattern was detected when standardised to the fish biomass. The amount of eDNA per Gram was comparable between larger fish and smaller ones even if they were 2.7 fold heavier. Most of the previous studies dealing with the link between fish biomass (or density) and eDNA amount have already highlighted a positive correlation between them (Rourke et al., 2022) especially in controlled conditions (Yates et al., 2019). Once standardised by fish weight, the pattern could be different with smaller fish shedding more DNA than larger ones (Maruyama et al., 2014). This was not the pattern observed here, which can be due to the different life stages used in the two studies; in our study we chose to explore the effect of a gradient of adult size classes, with less contrast in fish sizes than in the Maruyama et al. (2014) study were adults and juvenile were used. It would therefore be interesting to conduct a similar experiment considering a larger number of size classes, especially among smaller fish. The absence of significant response observed in our study could also be partly due to the quantification method that we used. The great majority of studies working on one species used specific primers to run the qPCRs, while we used universal primers designed for the amplification of teleost fishes and elasmobranchs species (Valentini et al., 2016). We chose these primers since they are the ones used in the study that tested the combination of metabarcoding and qPCR to demonstrate the possibility to quantify the abundance of species at the community level (van Bleijswijk et al., 2020; Pont et al., 2023). With the teleo primers, there is a risk to amplify DNA from organisms other than fish (Bylemans et al., 2018); however, the verifications we performed prior to fish introduction showed that such non-target DNA was at extremely low number of copies or below detection level; additionally the qPCR controls were found to be negative.
Another possibility is that the between individual variability was too high (Rourke et al., 2023) to detect an effect of size class or that the link between biomass and eDNA amount is not linear (Coulter et al., 2019; Souma et al., 2023). In their study, Coulter et al. (2019) observed that once a certain size is reached there is no more variation in the eDNA quantification (the curve reached an asymptote). Such nonlinear relationship between eDNA and fish biomass could explain the already weak link (correlation) already observed in some studies (Capo et al., 2019; Guivas and Brammell, 2020) especially different biomass could lead to quite similar eDNA concentrations. The lower link observed in situ (Yates et al., 2019) could also be due to the selectivity of the traditional methods used to assess fish biomass that serve as a comparison point. For instance, gillnets are size-selective (Prchalová et al., 2009), with larger fish with the greatest biomass poorly caught. Our results and previous observations (Maruyama et al., 2014) suggested that eDNA collected on the field is mainly due to large individuals as they represent the biggest proportion of the biomass. Even if juvenile shedding rate is greater than those of large fish (Maruyama et al., 2014), and even if they constitute the majority of the captures, they represent only a small proportion of the total biomass (tench smaller than 20 cm represent less than 2% of the biomass of the fish caught in French lacustrine biomonitoring program, OFB unpublished data). Therefore, the selectivity of traditional methods, with all the other parameters that affect eDNA in the field, could blur the potential biomass-eDNA relationship. The relationship between eDNA and fish biomass needs further investigation (Yates et al., 2021).
Finally, these results suggest the temperature effect may be an issue if biomass or abundance estimations from eDNA are compared, e.g., between two fish assemblages/communities from different lakes or in different environmental conditions. The effect of temperature may hinder comparisons because two comparable communities living in different thermal conditions would lead to different biomass estimations from eDNA quantifications. An extreme case could arise if communities with distinct biomasses would result in a comparable eDNA quantification because of the counterbalancing effect of temperature. Further investigations under contrasting environmental conditions, for a larger diversity of fish species, are needed before using eDNA as a quantifying tool in routine practice.
The raw data supporting the conclusion of this article are available at 10.6084/m9.figshare.23708145.
The animal study was reviewed and approved by French authority of the “Direction départementale de la protection des populations des Bouches-du- Rhône,” permit number A1300101, under articles R 214-87, R 214-122, and R 215-10 of the French law.
AH, ML, TD, ID, and J-MB designed the experiment. AH, ML, and PG realised the experiment. AH and ML analysed the data. AH, ML, ID, TD, AV, and J-MB participated to the conceptualization. AV and TD, participated to the formal analysis. TD, J-MB, and ML participated to the project supervision. All authors contributed to the article and approved the submitted version.
This study was supported by the French Biodiversity Agency (OFB), the French National Research Institute for Agriculture, Food and Environment (INRAE), the company SPYGEN and the French National Agency for Research and Technology (ANRT).
Teleo primers and the use of the amplified fragment for identifying fish species from environmental samples are patented by the CNRS and the Universite’ Grenoble Alpes. This patent only restricts commercial applications and has no implications for the use of this method by academic researchers. SPYGEN owns a licence for this patent. AH, TD, and AV are research scientists at a private company specialising in the use of eDNA for species detection.
The remaining authors declare that the research was conducted in the absence of any commercial or financial relationships that could be construed as a potential conflict of interest.
All claims expressed in this article are solely those of the authors and do not necessarily represent those of their affiliated organizations, or those of the publisher, the editors and the reviewers. Any product that may be evaluated in this article, or claim that may be made by its manufacturer, is not guaranteed or endorsed by the publisher.
The Supplementary Material for this article can be found online at: https://www.frontiersin.org/articles/10.3389/fenvs.2023.1193393/full#supplementary-material
Avlijaš, S., Ricciardi, A., and Mandrak, N. E. (2018). Eurasian tench (Tinca tinca): The next great lakes invader. Can. J. Fish. Aquatic Sci. 75, 169–179. doi:10.1139/cjfas-2017-0171
Bylemans, J., Gleeson, D. M., Hardy, C. M., and Furlan, E. (2018). Toward an ecoregion scale evaluation of eDNA metabarcoding primers: A case study for the freshwater fish biodiversity of the murray-darling basin (Australia). Ecol. Evol. 8, 8697–8712. doi:10.1002/ece3.4387
Cantera, I., Cilleros, K., Valentini, A., Cerdan, A., Dejean, T., Iribar, A., et al. (2019). Optimizing environmental DNA sampling effort for fish inventories in tropical streams and rivers. Sci. Rep. 9, 3085. doi:10.1038/s41598-019-39399-5
Capo, E., Spong, G., Norman, S., Königsson, H., Bartels, P., and Byström, P. (2019). Droplet digital PCR assays for the quantification of Brown trout (Salmo trutta) and Arctic char (Salvelinus alpinus) from environmental DNA collected in the water of mountain lakes. PLoS ONE 14, e0226638. doi:10.1371/journal.pone.0226638
Caza-Allard, I., Laporte, M., Côté, G., April, J., and Bernatchez, L. (2022). Effect of biotic and abiotic factors on the production and degradation of fish environmental DNA: An experimental evaluation. Environ. DNA 4, 453–468. doi:10.1002/edn3.266
Coulter, D. P., Wang, P., Coulter, A. A., Van Susteren, G. E., Eichmiller, J. J., Garvey, J. E., et al. (2019). Nonlinear relationship between Silver Carp density and their eDNA concentration in a large river. PLOS ONE 14, e0218823. doi:10.1371/journal.pone.0218823
de Souza, L. S., Godwin, J. C., Renshaw, M. A., and Larson, E. (2016). Environmental DNA (eDNA) detection probability is influenced by seasonal activity of organisms. PLoS ONE 11, e0165273. doi:10.1371/journal.pone.0165273
Doi, H., Inui, R., Akamatsu, Y., Kanno, K., Yamanaka, H., Takahara, T., et al. (2017). Environmental DNA analysis for estimating the abundance and biomass of stream fish. Freshw. Biol. 62, 30–39. doi:10.1111/fwb.12846
Doi, H., Takahara, T., Minamoto, T., Matsuhashi, S., Uchii, K., and Yamanaka, H. (2015a). Droplet digital polymerase chain reaction (PCR) outperforms real-time PCR in the detection of environmental DNA from an invasive fish species. Environ. Sci. Technol. 49, 5601–5608. doi:10.1021/acs.est.5b00253
Doi, H., Uchii, K., Takahara, T., Matsuhashi, S., Yamanaka, H., and Minamoto, T. (2015b). Use of droplet digital PCR for estimation of fish abundance and biomass in environmental DNA surveys. PLOS ONE 10, e0122763. doi:10.1371/journal.pone.0122763
Fukaya, K., Murakami, H., Yoon, S., Minami, K., Osada, Y., Yamamoto, S., et al. (2020). Estimating fish population abundance by integrating quantitative data on environmental DNA and hydrodynamic modelling. Mol. Ecol. 30, 3057–3067. doi:10.1111/mec.15530
Guivas, R. A., and Brammell, B. F. (2020). Use of environmental DNA to determine fantail darter (Etheostoma flabellare) density in a laboratory setting: Effects of biomass and filtration method. Int. J. Zoology 2020, 1–7. doi:10.1155/2020/4731686
Harrison, J. B., Sunday, J. M., and Rogers, S. M. (2019). Predicting the fate of eDNA in the environment and implications for studying biodiversity. Proc. R. Soc. B Biol. Sci. 286, 20191409. doi:10.1098/rspb.2019.1409
Hervé, A., Domaizon, I., Baudoin, J. M., Dejean, T., Gibert, P., Jean, P., et al. (2022). Spatio-temporal variability of eDNA signal and its implication for fish monitoring in lakes. PLOS ONE 17, e0272660. doi:10.1371/journal.pone.0272660
Itakura, H., Wakiya, R., Sakata, M. K., Hsu, H. Y., Chen, S. C., Yang, C. C., et al. (2020). Estimations of riverine distribution, abundance, and biomass of anguillid eels in Japan and Taiwan using environmental DNA analysis. Zool. Stud. 59, e17. doi:10.6620/ZS.2020.59-17
Jo, T., Murakami, H., Yamamoto, S., Masuda, R., and Minamoto, T. (2019). Effect of water temperature and fish biomass on environmental DNA shedding, degradation, and size distribution. Ecol. Evol. 9, 1135–1146. doi:10.1002/ece3.4802
Kamoroff, C., and Goldberg, C. S. (2018). An issue of life or death: Using eDNA to detect viable individuals in wilderness restoration. Freshw. Sci. 37, 685–696. doi:10.1086/699203
Klymus, K. E., Richter, C. A., Chapman, D. C., and Paukert, C. (2015). Quantification of eDNA shedding rates from invasive bighead carp Hypophthalmichthys nobilis and silver carp Hypophthalmichthys molitrix. Biol. Conserv. 183, 77–84. doi:10.1016/j.biocon.2014.11.020
Lacoursiere-Roussel, A., Rosabal, M., and Bernatchez, L. (2016). Estimating fish abundance and biomass from eDNA concentrations: Variability among capture methods and environmental conditions. Mol. Ecol. Resour. 16, 1401–1414. doi:10.1111/1755-0998.12522
Lance, R., Klymus, K., Richter, C., Guan, X., Farrington, H., Carr, M., et al. (2017). Experimental observations on the decay of environmental DNA from bighead and silver carps. Manag. Biol. Invasions 8, 343–359. doi:10.3391/mbi.2017.8.3.08
Maruyama, A., Nakamura, K., Yamanaka, H., Kondoh, M., and Minamoto, T. (2014). The release rate of environmental DNA from juvenile and adult fish. PLoS ONE 9, e114639. doi:10.1371/journal.pone.0114639
Mizumoto, H., Urabe, H., Kanbe, T., Fukushima, M., and Araki, H. (2018). Establishing an environmental DNA method to detect and estimate the biomass of Sakhalin taimen, a critically endangered Asian salmonid. Limnology 19, 219–227. doi:10.1007/s10201-017-0535-x
Pont, D., Meulenbroek, P., Bammer, V., Dejean, T., Erős, T., Jean, P., et al. (2023). Quantitative monitoring of diverse fish communities on a large scale combining eDNA metabarcoding and qPCR. Mol. Ecol. Resour. 23, 396–409. doi:10.1111/1755-0998.13715
Prchalová, M., Kubečka, J., Říha, M., Mrkvička, T., Vašek, M., Jůza, T., et al. (2009). Size selectivity of standardized multimesh gillnets in sampling coarse European species. Fish. Res. 96, 51–57. doi:10.1016/j.fishres.2008.09.017
Rourke, M. L., Fowler, A. M., Hughes, J. M., Broadhurst, M. K., DiBattista, J. D., Fielder, S., et al. (2022). Environmental DNA (eDNA) as a tool for assessing fish biomass: A review of approaches and future considerations for resource surveys. Environ. DNA 4, 9–33. doi:10.1002/edn3.185
Rourke, M. L., Walburn, J. W., Broadhurst, M. K., Fowler, A. M., Hughes, J. M., Fielder, D. S., et al. (2023). Poor utility of environmental DNA for estimating the biomass of a threatened freshwater teleost; but clear direction for future candidate assessments. Fish. Res. 258, 106545. doi:10.1016/j.fishres.2022.106545
Souma, R., Katano, I., Doi, H., Takahara, T., and Minamoto, T. (2023). Comparing environmental DNA with whole pond survey to estimate the total biomass of fish species in ponds. Freshw. Biol. 00, 727–736. doi:10.1111/fwb.14059
Strickler, K. M., Fremier, A. K., and Goldberg, C. S. (2015). Quantifying effects of UV-B, temperature, and pH on eDNA degradation in aquatic microcosms. Biol. Conserv. 183, 85–92. doi:10.1016/j.biocon.2014.11.038
Takahara, T., Minamoto, T., Yamanaka, H., Doi, H., and Kawabata, Z. (2012). Estimation of fish biomass using environmental DNA. PLoS ONE 7, e35868. doi:10.1371/journal.pone.0035868
Thalinger, B., Deiner, K., Harper, L. R., Rees, H. C., Blackman, R. C., Sint, D., et al. (2021). A validation scale to determine the readiness of environmental DNA assays for routine species monitoring. Environ. DNA 3, 823–836. doi:10.1002/edn3.189
Thomsen, P. F., Kielgast, J., Iversen, L. L., Wiuf, C., Rasmussen, M., Gilbert, M. T. P., et al. (2012). Monitoring endangered freshwater biodiversity using environmental DNA. Mol. Ecol. 21, 2565–2573. doi:10.1111/j.1365-294X.2011.05418.x
Valentini, A., Taberlet, P., Miaud, C., Civade, R., Herder, J., Thomsen, P. F., et al. (2016). Next-generation monitoring of aquatic biodiversity using environmental DNA metabarcoding. Mol. Ecol. 25, 929–942. doi:10.1111/mec.13428
van Bleijswijk, J. D. L., Engelmann, J. C., Klunder, L., Witte, H. J., Witte, J. I. J., and van der Veer, H. W. (2020). Analysis of a coastal North Sea fish community: Comparison of aquatic environmental DNA concentrations to fish catches. Environ. DNA 2, 429–445. doi:10.1002/edn3.67
Yates, M. C., Cristescu, M. E., and Derry, A. M. (2021). Integrating physiology and environmental dynamics to operationalize environmental DNA (eDNA) as a means to monitor freshwater macro-organism abundance. Mol. Ecol. 30, 6531–6550. doi:10.1111/mec.16202
Keywords: mesocosm, Tinca tinca, eDNA quantification, teleo, metabarcoding
Citation: Hervé A, Domaizon I, Baudoin J-M, Dejean T, Gibert P, Valentini A and Logez M (2023) Do temperature and population size structure influence the quantity of fish eDNA in water?. Front. Environ. Sci. 11:1193393. doi: 10.3389/fenvs.2023.1193393
Received: 24 March 2023; Accepted: 14 July 2023;
Published: 27 July 2023.
Edited by:
Teresa Ferreira, University of Lisbon, PortugalReviewed by:
Ana Filipa Filipe, University of Lisbon, PortugalCopyright © 2023 Hervé, Domaizon, Baudoin, Dejean, Gibert, Valentini and Logez. This is an open-access article distributed under the terms of the Creative Commons Attribution License (CC BY). The use, distribution or reproduction in other forums is permitted, provided the original author(s) and the copyright owner(s) are credited and that the original publication in this journal is cited, in accordance with accepted academic practice. No use, distribution or reproduction is permitted which does not comply with these terms.
*Correspondence: Maxime Logez, bWF4aW1lLmxvZ2V6QGlucmFlLmZy
Disclaimer: All claims expressed in this article are solely those of the authors and do not necessarily represent those of their affiliated organizations, or those of the publisher, the editors and the reviewers. Any product that may be evaluated in this article or claim that may be made by its manufacturer is not guaranteed or endorsed by the publisher.
Research integrity at Frontiers
Learn more about the work of our research integrity team to safeguard the quality of each article we publish.