
94% of researchers rate our articles as excellent or good
Learn more about the work of our research integrity team to safeguard the quality of each article we publish.
Find out more
ORIGINAL RESEARCH article
Front. Environ. Sci. , 01 June 2023
Sec. Environmental Economics and Management
Volume 11 - 2023 | https://doi.org/10.3389/fenvs.2023.1191012
 Hongyu Wang1,2*
 Lei Du3*
The agricultural credit scale plays a crucial role in improving the agricultural green production efficiency (AGPE) in China. This paper selected the panel data of 30 provinces in China from 2009 to 2020 and used the Metafrontier-Malmquist-Luenberger index to calculate the agricultural green production efficiency. On this basis, this paper uses the Panel Tobit model to analysis the impact of agricultural credit scale on AGPE. The main conclusions are as follows: 1) From 2009 to 2020, the average AGPE in 30 provinces was 4.2%, and agricultural technology progress was the main driving factor for AGPE growth. 2) The agricultural credit scale significantly promotes AGPE, and the impact of the agricultural credit scale on AGPE presents a significant inverted U-shape. 3) The impact of the agricultural credit scale on AGPE in eastern, central, and western regions is significantly heterogeneous. 4) AGPE has significant spatial spillover effects. This paper believes that improving agricultural green production efficiency requires paying attention to the important role played by the scale of agricultural credit.
Since the reform and opening up, China’s agricultural development has made remarkable achievements (Zhong et al., 2021). According to the data published in the China Statistical Yearbook, the gross domestic product of China’s primary industry has increased from 0.1 trillion yuan in 1978–12.10 trillion yuan in 2022, with an annual growth rate of about 11%. The rapid development of the agricultural economy cannot be separated from the improvement of agricultural production efficiency (Huang et al., 2023). However, early agricultural development in China belonged to a typical “high pollution, high emissions, and low efficiency” development model. This extensive agricultural development model caused many environmental pollution issues, seriously restricting the improvement of agricultural production efficiency (Liu et al., 2021; Huang et al., 2022). In the face of this dilemma, in recent years, the Chinese government has begun to advocate the agricultural green and high-quality development model, solving the problems of environmental pollution and excessive waste of resources generated in agricultural development by promoting green agricultural development (Wang et al., 2022). From the perspective of China’s agricultural development, improving the efficiency of green agricultural production is the key to achieving sustainable development of China’s agricultural economy (Wen and Wang, 2022; Li et al., 2023). Based on this, many scholars have pointed out that agricultural green production efficiency can be used to measure green agricultural development (Liu and Feng, 2019; Sheng et al., 2022). Undoubtedly, improving the efficiency of green agricultural production has played a crucial role in promoting the green development of China’s agriculture.
With the continuous development of rural finance in China, the Chinese government has continuously increased the investment scale of agricultural credit, which has played an increasingly important role in improving agricultural production efficiency (Wang et al., 2022); Wen and Wang, 2022). Agricultural credit is a form of providing working capital for agricultural reproduction. It is the general term for financial organizations to carry out credit activities in rural areas, including savings and loans (Wang et al., 2022). Agricultural credit investment can provide strong financial support for agricultural mechanization, agricultural technology research and development, and agricultural green production, thereby affecting the efficiency of agricultural green production (Li et al., 2021). Therefore, clarifying the relationship between agricultural credit scale and agricultural green production efficiency has essential theoretical and practical significance for promoting green agricultural development and achieving high-quality economic growth in China.
Currently, research on the agricultural green production efficiency mainly focuses on the following two aspects: on the one hand, it is the measurement of agricultural green production efficiency. The measurement methods of agricultural green production efficiency mainly include SFA and DEA (Yu, 2021; Yao and Wu, 2022; Du et al., 2023). SFA is a parametric analysis method that requires the strict setting of the form of the production function during the measurement process (Kumbhakar et al., 2015). If there is a deviation in the formal setting of the production function, it will lead to errors in the estimation results (Du et al., 2022a; Du et al., 2022b). Therefore, there are better choices than SFA to measure agricultural green production efficiency. DEA is a nonparametric analysis method that estimates the objective function through linear programming to estimate the efficiency of a decision-making unit (DMUs) (Färe et al., 1992; Färe et al., 1994). This method does not need to set the specific form of the production function strictly, so most scholars use the DEA method to measure agricultural green production efficiency (Han et al., 2018; Xu et al., 2019; Zhong et al., 2021; Huang et al., 2022; Yang et al., 2022).
On the other hand, it is about the influencing factors of agricultural green production efficiency. Scholars pointed out that environmental regulation (Sun, 2022), climate change (Song et al., 2022), agricultural insurance (Li et al., 2022), agricultural innovation (Djoumessi, 2021), financial inclusion (Hu et al., 2021), carbon trading (Yu et al., 2022), and green trade barriers (Liu et al., 2023) can impact agricultural green production efficiency. However, there are relatively few studies on the impact of agricultural credit scale on agricultural green production efficiency. Wang et al., 2022) discussed the spatial spillover effect between agricultural credit and agricultural total factor productivity, arguing that agricultural credit inhibits the increase of total factor productivity in surrounding areas. However, this study ignores the possible nonlinear relationship between agricultural credit and agricultural total factor productivity.
The existing research has laid an excellent theoretical foundation for this paper, but there are still the following areas worth improving: 1) From the perspective of research framework, the existing literature rarely discusses the impact of agricultural credit scale on agricultural green production efficiency. 2) From the perspective of research content, the existing literature rarely discusses the nonlinear relationship between agricultural credit and agricultural green production efficiency. 3) From the perspective of research method, traditional DEA methods to measure agricultural green production efficiency mostly assume that agricultural production in various regions has a common production Frontier. However, there is significant heterogeneity in natural resource endowments, and the agricultural production technology set in different regions is not the same (Du et al., 2023). Therefore, it is difficult to reflect regional differences in agricultural green production efficiency measured under the common Frontier.
In summary, the innovation points of this paper can be summarized in the following three aspects: 1) In terms of research content, this paper brings the scale of agricultural credit and green production efficiency into the same analytical framework system. It deeply explores the impact mechanism of agricultural credit scale on agricultural green production efficiency. In addition, this paper delves into the driving and inhibitory effects of agricultural credit scale on agricultural green production efficiency. 2) Based on the panel Tobit model, this paper empirically examines the impact of agricultural credit scale on AGPE and its non-linear relationship. Furthermore, the spatial econometric model is used to discuss the spatial spillover effect of the impact of agricultural credit scale on AGPE. 3) The Metafroniter-Malmquist-Luenberger index is used to measure agricultural green production efficiency. The model divides provinces with homogeneous agricultural development into groups and calculates intra-group and common Frontier efficiency, respectively. This can effectively avoid bias in estimation results caused by regional heterogeneity among samples, and the conclusions drawn are closer to the actual situation.
The rest of this paper is arranged as follows: part 2 is the mechanism analysis; part 3 is the methodology and Data; part 4 is the empirical results; part 5 is the discussion part; and part 6 is the conclusions and policy recommendations of this paper.
Agricultural credit is an essential guarantee for improving Agricultural green production efficiency, which many scholars have recognized (Wang et al., 2022; Wen and Wang, 2022). However, some scholars have found that agricultural credit also can inhibit agricultural green production efficiency. Therefore, according to Ding et al. (2022a), Ding et al. (2022b), Wen and Wang (2022), this paper establishes a theoretical framework for the impact of agricultural credit on agricultural green production efficiency from both the driving and inhibiting effects. Figure 1 is the theoretical framework of this paper.
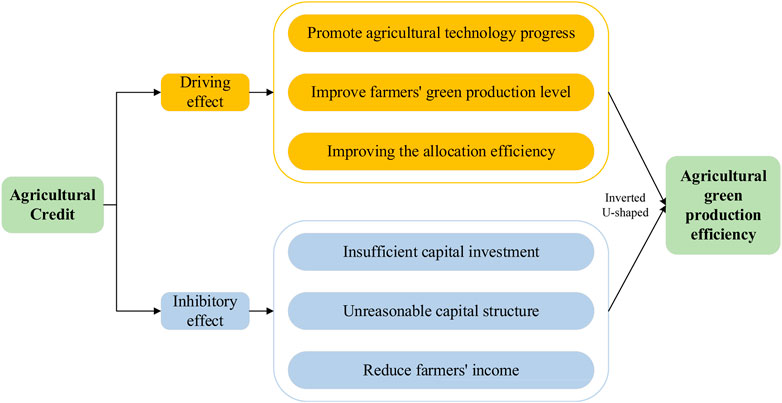
FIGURE 1. Theoretical framework.
Agricultural credit has a driving effect on agricultural green production efficiency. Firstly, agricultural credit can solve the shortage of funds for agricultural enterprises in technological innovation, which is conducive to agricultural technological innovation. When the latest technological achievements in agriculture are translated into agricultural production practice, it can improve the production level of green agriculture, promote technological progress in agricultural production, and promote the improvement of agricultural green production efficiency (Thi and Chi, 2022). Secondly, agricultural credit can improve farmers’ scientific and technological quality and improve agricultural green production technology. Generally, in areas with high levels of agricultural credit, farmers are more likely to obtain credit funds, which is beneficial for farmers to purchase new equipment for green agricultural production and improve their ability to practice and operate new technologies. This contributes to the progress of agricultural technology, thereby improving agricultural green production efficiency (Grivins et al., 2021). Thirdly, agricultural credit is conducive to optimizing the allocation of agricultural input factors and improving the allocation efficiency of agricultural production factors. Under the traditional technology model, farmers often increase food production by expanding the input of production materials. After agricultural credit solves the problem of funding shortage for farmers to purchase new equipment, farmers will widely use new equipment and new production technologies, reducing production materials while increasing food production and improving agricultural green production efficiency (Wen and Wang, 2022; Zhao et al., 2022).
However, agricultural credit also has an inhibitory effect on agricultural green production efficiency. Some scholars have pointed out that while enjoying agricultural credit to enhance agricultural green production efficiency, it is also necessary to be vigilant against the inhibitory effect of the blind expansion of agricultural credit scale on agricultural total factor productivity (Wang et al., 2022); Wen and Wang, 2022). The possible reasons for this phenomenon are: Firstly, the insufficient input of agricultural credit funds has hindered the improvement of agricultural green production efficiency. Affected by risk control, rural financial institutions have an insufficient investment in agricultural credit funds. The credit risk of rural financial institutions’ credit investment in agricultural technology is relatively high. Although the scale of rural credit in China continues to expand, there is still massive room for improvement in agricultural green production efficiency (Wen and Wang, 2022). Secondly, the irrational structure of agricultural credit allocation has reduced the allocation efficiency of agricultural credit funds. If agricultural credit is invested outside of agricultural production, it will reduce the improvement of agricultural production technology. Only when credit funds are used in intermediate links of agricultural production can agricultural technological efficiency be effectively improved, while China’s agricultural production intermediate links invest fewer credit funds (Fan, 2020). Thirdly, agricultural credit will hinder the growth of farmers’ income and inhibit the use of new agricultural technologies. Although agricultural credit can promote the growth of farmers’ consumption, the relationship between the scale of agricultural credit and farmers’ income is an “inverted U-shaped” relationship (Zhu et al., 2022). The expansion of agricultural credit has not improved farmers’ income levels in long-term development, and these factors have lowered farmers’ production aspirations, thereby impeding farmers’ use of new technologies. This is not conducive to the improvement of agricultural green production efficiency.
In summary, agricultural credit can solve the shortage of funds in improving agricultural green production efficiency. However, there are also some problems, such as inhibiting farmers’ income growth and impeding the use of new technologies. Based on this, this paper proposes the following hypothesis: With the continuous expansion of the agricultural credit scale, this driving effect may have a downward trend. There may be an “inverted U-shaped” relationship between the scale of agricultural credit and agricultural green production efficiency.
According to Ding et al. (2022b) and Du et al. (2022a), this paper uses the Metafrontier-Malmquist-Luenberger index (MML) based on DEA model to measure the agricultural green production efficiency (AGPE). Significant differences exist in regions’ natural resource endowments and agricultural production technologies. Therefore, using a common production boundary to measure agricultural green production efficiency may lead to a deviation between the estimated results and the actual situation. This paper applies the meta-Frontier technology to measure the agricultural green production efficiency. Oh and Lee (2010) combined the Metafrontier technology with the Malmquist index and proposed the Metafrontier-Malmquist index. According to Oh and Lee (2010), this paper adds undesirable outputs to the Metafrontier-Malmquist index and constructs the Metafrontier-Malmquist-Lunberger index to measure agricultural green production efficiency. The model is described as follows.
Define three types of production technology collections: current group technology
Among them, the group Frontier can be expressed as
In order to further explore the driving mechanism of agricultural green production efficiency, this paper defines agricultural green total production efficiency as AGPE. The calculation method is shown in Formula 2 below.
In order to further explore the driving mechanism of agricultural green production efficiency, this paper decomposes AGPE. The calculation method is shown in Formula 2 below.
In formula (2),
In formula (3), EC represents the technical efficiency change from t to t+1 period. BPG (Best Practice Gap) represents the gap between the Frontier of DMUs in the group and the group Frontier. BPC (Best Practice Change) refers to the change of BPG from t to t+1 period, which is usually used to reflect the technological progress of each DMUs. When BPC>1, the technical level is improved. On the contrary, when BPC<1, the technical level has not been improved. TGR represents the gap between the group Frontier and the common Frontier. TGC represents the change of TGR from t to t+1 period. TGC>1 indicates that the distance from the group Frontier to the common Frontier decreases over time and vice versa.
According to (Wang et al., 2022) and Du et al., 2023, this paper has built an input-output indicators system and use the Metafrontier Malmquist Luenberger index to measure the agricultural green production efficiency.
The input variable in this paper are as follows: 1) Labor. This paper uses the number of agricultural employees in each province (10 thousand people) to represent the labor input. 2) Agricultural machinery. In this paper, the total power of agricultural machinery in each province (10,000 kw) is selected to represent the input of agricultural machinery input. 3) Land. This paper uses the total planting area of crops in each province (1000 HA) to express the land input. 4) Water. The effective irrigation area of each province (1000 HA) is the proxy variable of water input. 5) Power. The agricultural diesel consumption of each province (10,000 tons) is the proxy variable of power input. 6) Fertilizer. The amount of pure fertilizer application in each province (10,000 tons) is the proxy variable of fertilizer input. 7) Pesticide. The use amount of pesticide in each province (10,000 tons) is the proxy variable of fertilizer input. 8) Agricultural film. The consumption of agricultural plastic film (10,000 tons) is the proxy variable of agricultural film input.
This paper’s output variables mainly contain desirable and undesirable outputs. The desirable output in this paper is the gross value of agriculture (10,000 yuan). And the undesirable output is the agricultural carbon emissions (10,000 tons). In the process of agricultural production, agricultural carbon emissions have become the main source of environmental pollution (Wang et al., 2022). Therefore, choosing agricultural carbon emissions as undesired output is very reasonable. According to Liu et al. (2021) and Yu et al. (2022), the calculation formula for agricultural carbon emissions is as follows:
In formula (4), C represents the total carbon emission of the agricultural sector; Cr is the agricultural carbon emission sources; Sr is the number of agricultural carbon emission sources; δr is the coefficients of agricultural carbon emission sources. The carbon emission coefficients of each agricultural carbon emission source are shown in Table1.
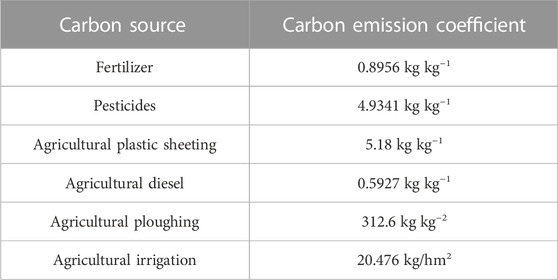
TABLE 1. Agricultural carbon emission source, coefficient and reference.
To further study the impact of agricultural credit scale on the agricultural green production efficiency, this paper takes the estimated results of agricultural green production efficiency based on the MML index as the explained variable and the agricultural credit scale as the core explanatory variable. Since the efficiency value calculated by the DEA model is a limited variable, if the least squares method is used for regression, it will lead to an error in the estimation result (Liang et al., 2021; Huang et al., 2022). In contrast, the panel Tobit model uses the maximum likelihood method to estimate, which can effectively solve the problem of limited data. Therefore, we use the Panel Tobit model to analyze the impact of the agricultural credit scale on the agricultural green production efficiency. According to Tobin. (1958), the basic form of the panel Tobit model is as follows:
In formula (5),
1) Explained Variable: Agricultural green production efficiency (AGPE). This paper uses the agricultural green production efficiency measured by the Metafrontier-Malmquist-Luenberger index as the explained variables. Therefore, according to the decomposition results of agricultural green production efficiency, the explained variables in this paper are EC, BPC, TGC, and AGPE, respectively.
2) Core explanatory Variable: Agricultural credit scale (ACS). Scholars usually use the balance of rural credit to represent the scale of agricultural credit. However, the number of large state-owned banks in China’s rural areas is gradually decreasing. Agricultural credit funds are from large state-owned banks and some rural credit cooperatives or rural banks. Therefore, this paper selects the total amount of agricultural loans in each region to represent the scale of agricultural credit, with the unit of 10,000 yuan and the abbreviation of ACS.
3) Control variables: In the process of research, the following control variables are also selected: ①Economic development level (ln RGDP). This paper uses the logarithm of per capita GDP to measure the level of economic development. ② Industrial structure (IS): This paper uses the proportion of added value of the primary industry in GDP to measure the industrial structure. ③ Disaster area (lnDA): This paper uses the logarithm of affected area of crops to measure disaster area. ④ Fiscal Support (FS): This paper uses the proportion of agricultural expenditure in total financial expenditure to measure fiscal support. ⑤ Degree of opening up (OPEN): This paper uses the proportion of total foreign direct investment in GDP to measure the degree of opening up. ⑥ Urbanization level (Urban): This paper uses the proportion of urban population in total population to measure the urbanization level.
According to the Panel Tobit model and variable selection, the model of this paper can be constructed as the following forms:
The study area of this paper is 30 provinces in mainland China, excluding Tibet, Hong Kong, Macao, and Taiwan. As we all know, China has a vast land area, and agricultural production in different regions has significant heterogeneity. Therefore, according to the production characteristics of China’s agriculture production, this paper divided the study area into the eastern, central, and western regions. The study area is shown in Figure 2 below.
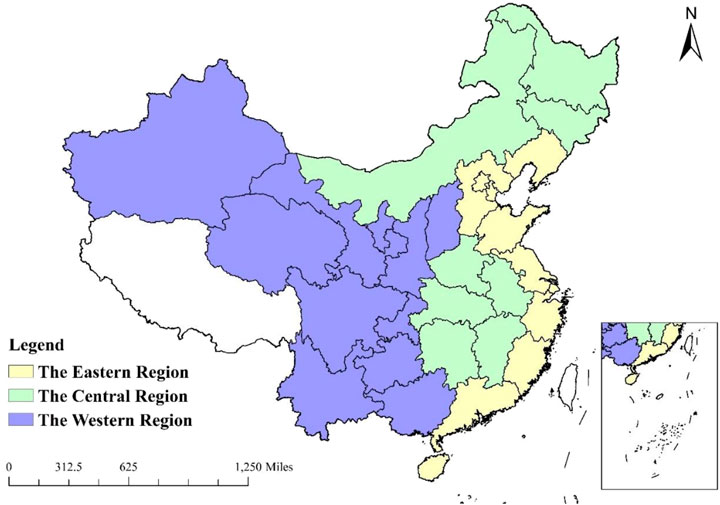
FIGURE 2. Study area.
Since the agricultural credit scale data before 2009 has not yet been published, this paper selects panel data of 30 provinces in China from 2009 to 2010 for empirical research in view of the availability of data. The original data of all variables are from the official data published by the Chinese government. Among them, the data on agricultural credit scale comes from China Financial Yearbook, and other data are from China Statistical Yearbook and China Rural Statistical Yearbook. This paper uses linear interpolation to complement a small number of missing values in the sample. The statistical description of the samples is shown in Table 2.
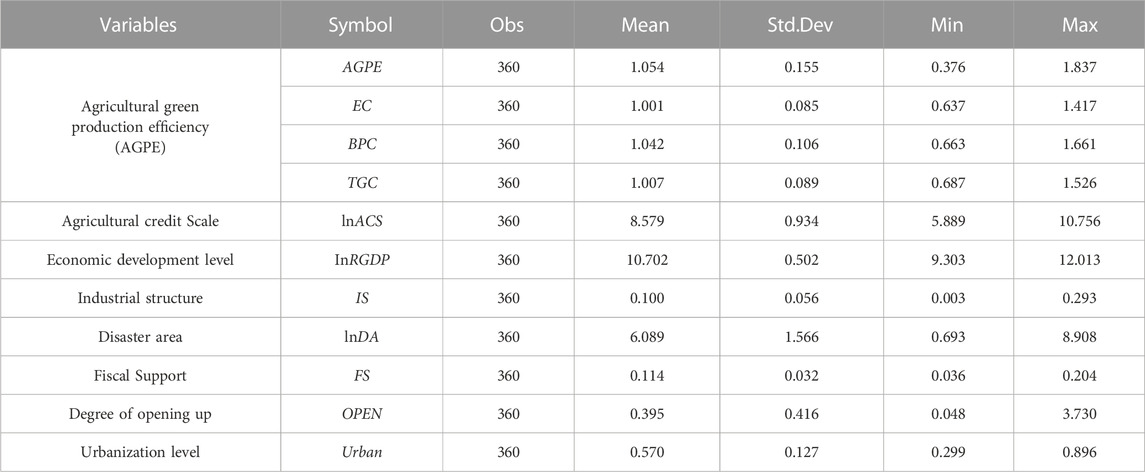
TABLE 2. The statistical description of the samples.
According to the Metafrontier Malmquist Luenberger index, this paper calculated the agricultural green production efficiency (AGPE) of 30 provinces in China from 2009–2020. This paper further decomposed the AGPE into EC, BPC, and TGC to explore the driving force of AGPE. In addition, the AGPE of this paper is calculated using the MaxDEA pro 6.18 software.
Table 3 shows the average value of AGPE from 2009–2020. We can find that the average value of AGPE from 2009 to 2020 was 1.042 (AGPE > 1), which means that the agricultural green production efficiency was 4.2% during the sample period. The average values of technological efficiency (EC) and technological progress (BPC) were 0.996 (EC < 1) and 1.0407 (BPC > 1), respectively, indicating that the agricultural green production efficiency was mainly driven by technological progress during the sample period. In addition, from the annual average of AGPE, we can find that AGPE shows a fluctuating upward trend during the sample period.
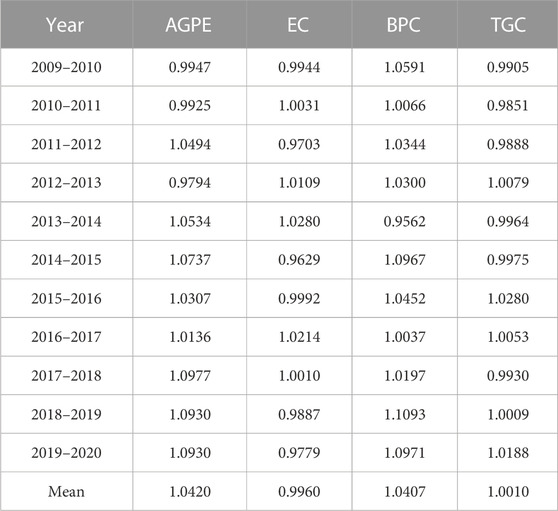
TABLE 3. The results of AGPE from 2009–2020.
Figure 3 shows the regional distribution differences of AGPE. We can see that AGPE presents prominent regional imbalance characteristics. The agricultural green TFP in the eastern, central, and western regions was 10.22%, 3.08%, and 1.56%, respectively. The eastern region was the highest, followed by the central region, and the western region was the lowest. The distributions of EC, BPC, and TGC indices also exhibit this characteristics. Let us focus on the changes in TGC: The TGC index in the eastern region was 1.0125, indicating that the agricultural green production Frontier in the eastern region was significantly higher than the common Frontier. The TGC index in the central region was 1.0009, indicating that the agricultural green production Frontier in the central region was slightly higher than the common Frontier. The TGC index in the western region was 0.9932, indicating that the Frontier of agricultural green production in the western region was lower than the common Frontier and that agricultural green production technology needs further improvement. From Figure 4, it can be further found that the distribution of AGPE presents a distinct geographical distribution characteristic of “high in the east and low in the west”. The top three AGPE provinces are Fujian (1.187), Zhejiang (1.182), and Tianjin (1.098), all located in the eastern region of China.
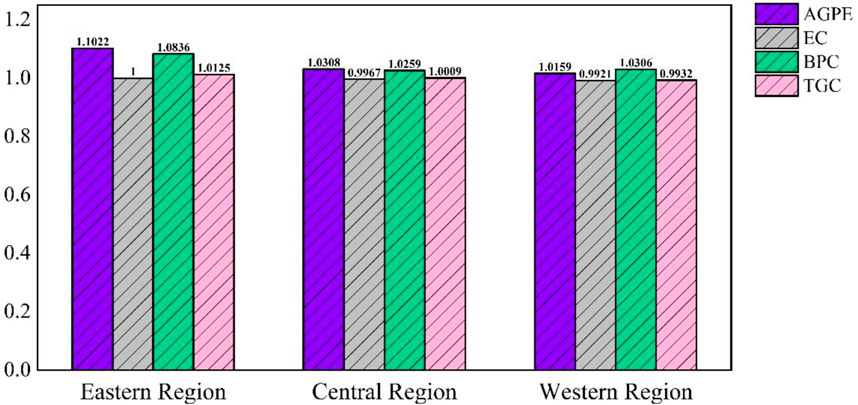
FIGURE 3. Regional distribution differences of AGPE.
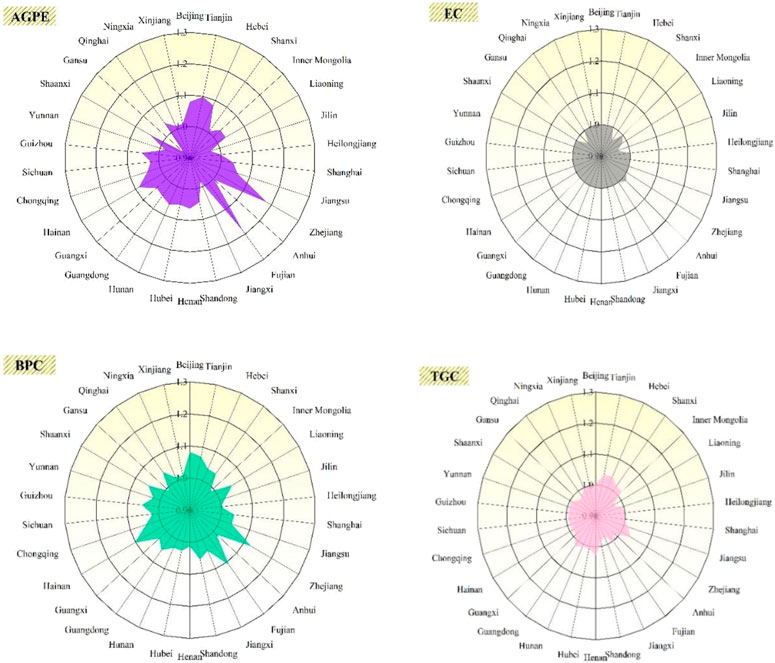
FIGURE 4. Regional distribution differences of AGPE.
Table 4 shows the regression results of the panel Tobit model. Columns (1)–(4) show the regression results for EC, BPC, TGC, and AGPE, respectively, as the explained variables. Column (5) shows the estimated results after adding the square item to the agricultural credit scale.
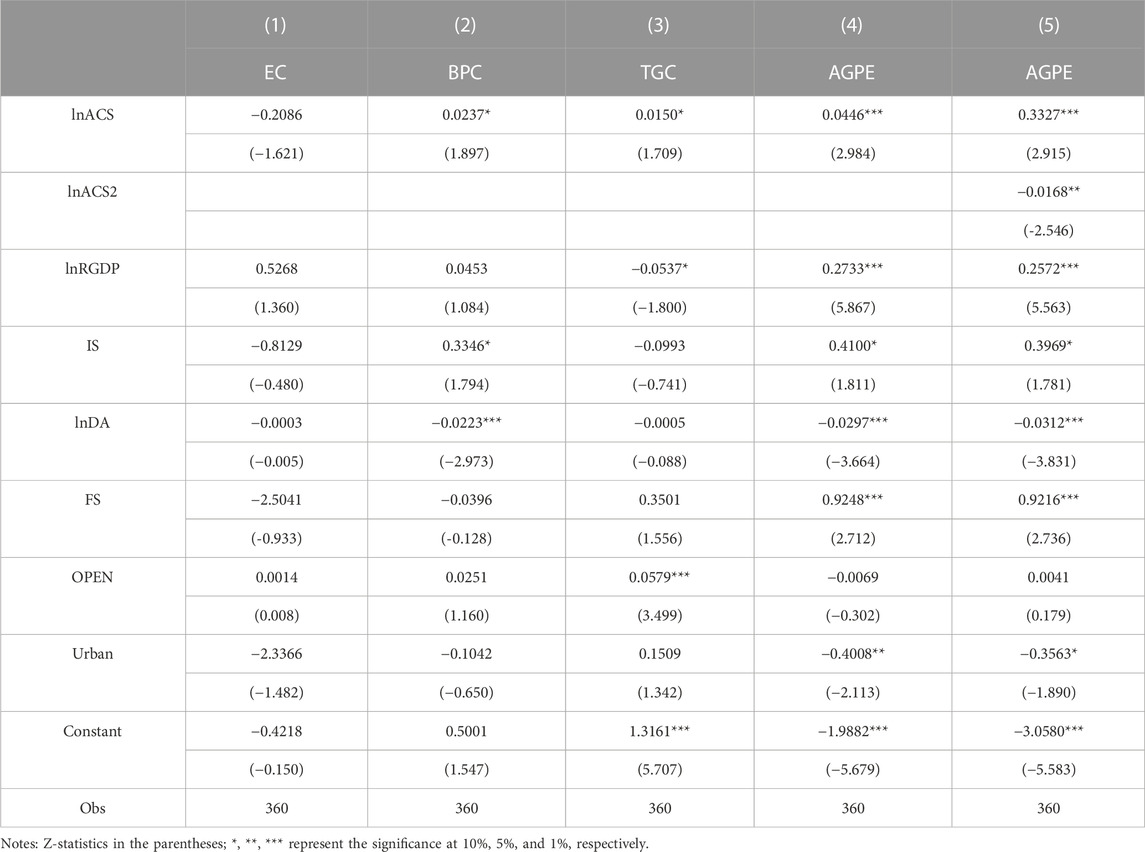
TABLE 4. The regression results of the panel Tobit model.
Firstly, from the estimation results in columns (1) to (3), we can find that when the explained variables are BPC and TGC, the estimation coefficients of lnACS are 0.0237 and 0.0150, respectively, and both are significantly positive at a 10% significance level. When EC is the explained variable, the estimated coefficient of lnACS is −0.2086, which is insignificant. This result indicates that the agricultural credit scale can significantly promote agricultural technology progress and improve technology gaps but does not impact agricultural technology efficiency. In addition, it can be seen from the results that the agricultural credit scale has the most significant impact on agricultural technology progress. When the agricultural credit scale increases by 1%, it can promote agricultural technology progress by 2.27%.
Secondly, from the estimation results in column (4), we can find that when AGPE is the explained variable, the estimated value of lnACS is 0.0446, which is positive at the significance level of 1%. This indicates that the agricultural credit scale significantly promotes agricultural green production efficiency. That is, an increase of 1% in agricultural credit scale can promote a 4.46% increase in AGPE. In addition, the estimated results of economic development level, industrial structure, and agricultural financial support are 0.2733, 0.4100, and 0.9248, respectively, which are significantly positive. This indicates that the level of economic development, industrial structure, and agricultural financial support can significantly improve AGPE. The estimated results of the disaster area and urbanization level are −0.0297 and −0.4008, respectively, which are significantly negative. This indicates that the natural disasters and urbanization is not conducive to improving AGPE.
Finally, column (5) shows the result of adding the square term of agricultural credit scale. According to the results in column (5), we can find an interesting phenomenon: the square term of the lnACS is −0.0168, which is significantly negative at the significance level of 5%. This indicates that the impact of the agricultural credit scale on agricultural green production efficiency presents a significant inverted U-shape. Expanding the agricultural credit scale to a certain extent can promote the improvement of AGPE, but this driving effect shows a decreasing marginal effect. When the agricultural credit scale expands to a certain extent, continuing to expand the scale of agricultural credit will inhibit the improvement of AGPE. This proves the hypothesis of this paper.
The benchmark regression calculates AGPE using the Metafrontier Malmquist Luenberger index. In the robustness test section, we remeasure AGPE based on the super-efficiency SBM model with undesirable output proposed by Tone (2004), replacing the AGPE calculated by the Metafrontier Malmquist Luenberger index.
The calculation results in Table 5 show that the estimated coefficients of lnACS and lnACS2 are 0.3291 and −0.0196, respectively, which are significant at the 10% significance level. This is consistent with the results in the benchmark regression. It is once again proved that the impact of agricultural credit input on AGPE has a significant inverted U-shaped relationship. This conclusion also proves that the benchmark regression results in this paper are robust.
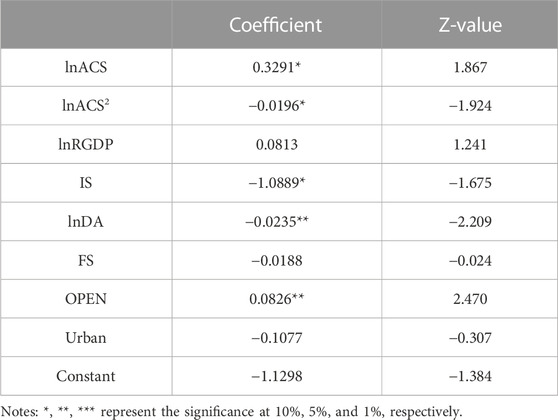
TABLE 5. Results of robustness test.
The endogeneity problem between agricultural credit scale and agricultural green production efficiency comes from the following aspects: 1) agricultural credit scale and agricultural green production efficiency are mutually causal. 2) The agricultural credit scale may have a time lag on the improvement of agricultural green production efficiency. Therefore, it is necessary to choose robust instrumental variables to address estimation bias caused by endogeneity.
When selecting instrumental variables, we need to strictly follow the assumptions of correlation and exogeneity. According to Wen and Wang (2022), this paper selects “balance of savings deposits of urban and rural residents” as a instrumental variable to solve endogeneity problems. The credit funds provided by rural financial institutions in rural areas come from the savings deposits of urban and rural residents they absorb. Therefore, the balance of savings deposits of urban and rural residents will affect the total amount of credit provided by rural financial institutions in rural areas. Based on this, we believe that the selection of the instrumental variables well satisfies the assumptions of correlation and exogeneity. In terms of estimation methods, this paper chooses the GMM and the two-stage least squares (2SLS) method as the regression methods for dealing with endogeneity problems.
Columns 1) and 2) in Table 6 show the regression results of the DIFF-GMM and SYS-GMM models. The regression results show that the first-order lag term of AGPE is significantly positive, indicating that the dynamic panel model is effective. In addition, the p-values of AR (1) test for DIFF-GMM and SYS-GMM are both 0.0000, while the p-values of AR (2) test are 0.2655 and 0.3878, respectively. This result means that the difference equations with random perturbation terms all have first-order sequence correlation, and there is no second-order sequence correlation. Furthermore, the result of Sargan test indicating that the instrumental variables are effective and there is no problem of over identification of the instrumental variables. Column 3) is the result of 2SLS. It can be seen that in the case of instrumental variable regression, the impact of ACS on AGPE is still significantly positive. In addition, the result of F-test means that there is no problem with a weak instrumental variable in the model, and instrumental variable in this paper are effective.

TABLE 6. Results of endogenous test.
This paper divides China into eastern, central, and western regions to further analyze the regional differences in agricultural credit scale on AGPE.
Table 7 shows that the impact mechanism of the agricultural credit scale on AGPE in the eastern, central, and western regions of China is different. The estimated result of lnACS in the eastern region is 0.8523, which is significantly positive at the significance level of 1%. The estimated result of lnACS2 is −0.0422, which is negative at the significance level of 1%. The estimated result of lnACS in the central region is 0.0330, which is positive at the 5% significance level. The estimated result of t lnACS2 is −0.49, which is negative at the 10% significance level. The estimated result of lnACS in the western region is 0.3494, and the estimated result of lnACS2 is −0.0197, both of which are insignificant.
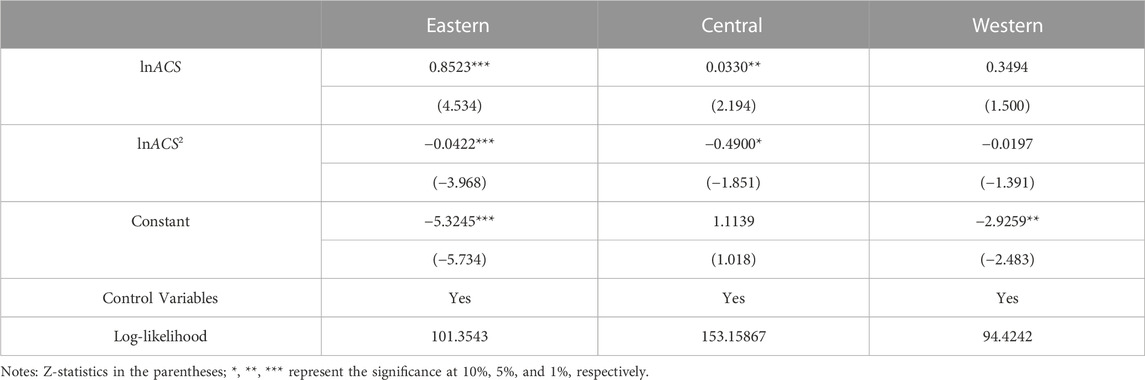
TABLE 7. Results of regional heterogeneity test.
According to Table 7, we can find two interesting phenomena: Firstly, the impact of agricultural credit scale on AGPE all presents an inverted U-shaped characteristic in the eastern, central, and western regions. Secondly, the impact of the agricultural credit scale on AGPE shows significant heterogeneity in the three regions. The scale of agricultural credit has the most significant impact on agricultural green production efficiency in the eastern region, followed by the central region, and not evident in the western region.
In this section, we have constructed the spatial autocorrelation model (SAR), the spatial error model (SEM), and the spatial Durbin model (SDM) to verify the spatial heterogeneity of the impact of agricultural credit scale on AGPE. Reasonable selection of spatial weight matrix is the basis for spatial econometric analysis. There are three common spatial weight matrices: the 0–1 matrix, the geographic distance matrix, and the economic weight matrix. According to (Wang et al., 2022), this paper uses the geographic distance matrix for spatial econometric analysis. In addition, due to the significant spatial correlation of each variable, it is no longer consistent with the classical assumptions of OLS. Currently, using MLE to estimate the model will yield more accurate results.
According to the results shown in Table 8, we can find that: 1) The regression coefficients of the spatial lag term ρ were 0.6268, 0.7801, and 0.7429, respectively, which were positive at the significance level of 1%. This result indicates that AGPE has a significant spatial spillover effect. In other words, the improvement of AGPE in the region can promote the improvement of AGPE in the surrounding provinces. 2) The regression coefficients of lnACS were 0.0172, 0.0164, and 0.0267, respectively, which were significantly positive. This results also proves that agricultural credit scale can improve AGPE. 3) From the regression results of the spatial Durbin model, it can be seen that the regression coefficients of W*lnACS is −0.7627, which is negative at the significance level of 5%. This indicates that the agricultural credit scale in the region inhibits the improvement of AGPE in surrounding provinces.
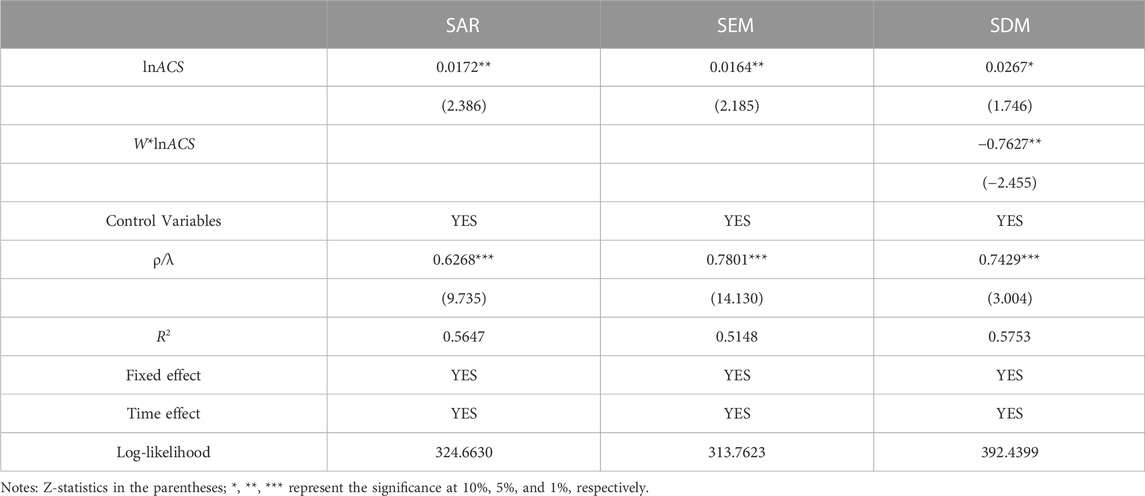
TABLE 8. Results of spatial heterogeneity test.
During the sample period, China’s agricultural green production efficiency was 4.2%. Advances in agricultural technology mainly drive the growth of AGPE. Agricultural technology efficiency has a small contribution to AGPE growth. This indicates that agricultural technology efficiency is a key factor restricting AGPE improvement. From Table 2, we can find that the temporal distribution characteristics of AGPE shows a fluctuating upward trend. Figures 3, 4 show the spatiotemporal distribution characteristics of AGPE. We can find that the spatial distribution of AGPE shows the characteristics of “high in the east and low in the west” and gradually decreases from east to west. This conclusion was consistent with Chen et al. (2021), Zhong et al. (2021), Liu et al. (2021) and (Wang et al., 2022).
In addition, AGPE exhibits a characteristic of regional imbalance. The AGPE of the eastern, central, and western regions was 10.22%, 3.08%, and 1.56%, respectively. From the perspective of growth sources, the AGPE growth in the three regions is driven by agricultural technology progress. The agricultural technology efficiency in the eastern region is the highest. In terms of the technology gap, the eastern and central regions are slightly higher than the common Frontier, while the western regions have a large gap with the common Frontier. The reasons for this phenomenon may be as follows: First, the eastern region of China has an excellent natural climate and agricultural production environment. At the same time, the eastern region has a high level of economic development, advanced production technology, and high-quality workers. Therefore, in agricultural production, the eastern region can implement the development concept of “promoting agriculture through science and technology” and carry out agricultural green production activities. In addition, the advanced agricultural production technology in the eastern region also provides technical support for agricultural cleaner production in the eastern region. Therefore, the eastern region has the highest AGPE. Second, the central region is the main region of agricultural production in China. However, compared to the eastern region, the central region lags behind the eastern region in terms of economic development, agricultural productivity, and labor quality. Therefore, the growth rate of AGPE in the central region is relatively slow. Third, the western region has a harsh natural environment, poor soil, poor economic development, and backward agricultural technology. Due to resource endowments, the growth rate of AGPE in western China is the slowest, and there is a significant gap between AGPE and the common Frontier.
Through the previous part, we found that the agricultural credit scale significantly promotes AGPE, and the impact of the agricultural credit scale on AGPE presents a significant inverted U-shape. In this part, we will analysis the reasons for this result.
Firstly, empirical results found that the agricultural credit scale has the most significant impact on agricultural technological progress. This conclusion was consistent with Li et al. (2023), Wen and Wang (2022), and (Wang et al., 2022). This phenomenon may be because the expansion of agricultural credit has provided sufficient credit funds for farmers and agricultural production enterprises. Farmers have improved production equipment and increased agricultural mechanization with the funds borrowed. Therefore, with unchanged production conditions, agricultural credit funds significantly impact agricultural technological progress. However, the improvement of agricultural technology has not brought about the improvement of agricultural technology efficiency. Therefore, how to promote the improvement of agricultural technology efficiency is the main task of China’s agricultural development in the future.
Secondly, the impact of the agricultural credit scale on AGPE presents a significant inverted U-shape. The possible reasons for this phenomenon are that some regions excessively pursue the blind expansion of agricultural credit scale and do not reasonably allocate priority agricultural credit funds. Many agricultural credit funds have been used to improve agricultural production technology, ignoring the improvement of agricultural technology efficiency, resulting in the uneven allocation of agricultural credit funds (Wen and Wang, 2022). On the other hand, the expansion of the agricultural credit scale is divorced from the actual needs of agricultural business entities, and there are situations where agricultural business entities divert credit funds for other purposes, resulting in more overdue loans, affecting the enthusiasm of financial institutions to provide credit funds in agriculture (Mei et al., 2022).
Thirdly, the agricultural credit scale significantly impacts the AGPE in the eastern region, followed by the central and western regions. Promoting agricultural credit scale to AGPE in the western region should be a key concern. The eastern and central regions have a good foundation for agricultural development and advanced production technologies. Therefore, agricultural credit funds can be invested to improve green production technology and promote green agricultural development. In addition, the eastern and central regions should pay attention to the issue of unreasonable agricultural credit allocation, gradually increasing credit investment for technological efficiency, reducing credit investment for agricultural technological progress, and achieving optimal allocation of limited agricultural credit funds. However, the western region is relatively backward in China’s economic development. Due to the constraints of natural resource endowments, the green agricultural development in the western region lags behind that in the eastern and central regions. Agricultural credit funds are not used to improve green agricultural production. Therefore, there is a phenomenon that agricultural credit funds do not significantly increase AGPE in the western region.
Fourthly, the improvement of AGPE in the region can improve the AGPE in the surrounding areas. However, the improvement of agricultural credit scale in the region is not conducive to the improvement of AGPE in the surrounding areas. Generally speaking, the characteristics of agricultural credit funds in China determine that agricultural credit activities only occur within local provinces, and there is no cross-provincial capital flow. The level of financial development in different regions varies greatly, so there is also a significant gap in the scale of agricultural credit funds. Due to the profit-seeking nature of capital, agricultural production materials will flow from regions with low credit scales to regions with high credit scales to obtain more financial support. Therefore, due to the “siphon effect,” areas with sizeable agricultural credit scales have inhibited the increase in AGPE in surrounding areas.
This paper selected the panel data of 30 provinces in China from 2009 to 2020 and used the Metafrontier-Malmquist-Luenberger index to calculate the agricultural green production efficiency (AGPE). On this basis, this paper uses the panel Tobit model to analysis the impact of agricultural credit scale on AGPE. The conclusion of this paper are as follows.
Firstly, the average value of AGPE in 30 provinces was 4.2% during 2009–2020. The average value of EC, BPC, and TGC were 0.9960, 1.0407, and 1.0010, respectively. Therefore, improving agricultural technology efficiency is a key factor in promoting China’s AGPE growth. In addition, AGPE has significant regional imbalances. From the perspective of growth rate, eastern region > central region > western region.
Secondly, the agricultural credit scale significantly promotes AGPE, and the impact of the agricultural credit scale on AGPE presents a significant inverted U-shape. In addition, the level of economic development, industrial structure, and agricultural financial support can significantly improve AGPE.
Thirdly, the impact of the agricultural credit scale on AGPE in eastern, central, and western regions is significantly heterogeneous. According to the estimated results, the scale of agricultural credit has the most significant impact on AGPE in the eastern region, followed by the central region, and the most negligible impact on AGPE in the western region.
Fourthly, AGPE has significant spatial spillover effects. The improvement of AGPE in the region can improve the AGPE in the surrounding areas. However, the improvement of agricultural credit scale in the region is not conducive to the improvement of AGPE in the surrounding areas.
According to the research conclusion, although the regression results support the hypothesis that agricultural credit scale has an “inverted U-shaped” effect on agricultural total factor productivity in this article, it cannot be denied that the scale of agricultural credit has a positive effect on agricultural total factor productivity, and its theoretical value for the development of rural economy in China. Therefore, from the conclusion made above, this paper puts forward some policy recommendations as follows:
Firstly, the “dual-wheel-drive” growth model should become China’s primary mode of agricultural economic growth. Therefore, efforts should be made to improve agricultural technology efficiency. Improve China’s agricultural science and technology innovation capacity by strengthening investment in agricultural science and technology research and development, increasing financial support, establishing special funds, and improving talent treatment. Improve the conversion rate of agricultural scientific and technological achievements and the application level of agricultural production technologies by improving the transformation and promotion system of agricultural scientific and technological achievements. By promoting advanced agricultural production technologies to farmers and using platforms such as agricultural technology stations to strengthen education for farmers, farmers are guided to apply advanced production technologies to the production process to improve agricultural technology efficiency. In addition, it is also necessary to promote the coordinated growth of regional AGPE and establish interregional agricultural development cooperation mechanisms.
Secondly, in the process of improving AGPE, it is necessary to expand the agricultural credit scale and pay attention to the efficiency of agricultural credit. It is necessary to continuously strengthen support for agricultural technological efficiency, control the scale of credit for agricultural technological progress, and prevent the inhibitory effect of the blind expansion of agricultural credit on AGPE. In addition, the agricultural credit scale should meet the actual needs of rural development, promoting technological efficiency improvement and considering technological progress. Credit funds should be invested in entities with urgent needs for improving AGPE.
Thirdly, pay attention to the scale of agricultural credit investment in various regions, prevent the “inverted U″ phenomenon, and make the allocation of agricultural credit funds more reasonable and effective. Agricultural credit scale should be tailored to local conditions based on the actual situation of agricultural total factor productivity in various regions. The eastern region should focus on improving agricultural technology efficiency to improve the growth quality of AGPE. The central region should pay attention to the issue of irrational agricultural credit provision, gradually increase credit input for technological efficiency, control the scale of credit for technological progress, and optimize the allocation of limited agricultural credit funds. The western region needs to pay more attention to using agricultural credit funds to improve AGPE.
Fourthly, pay attention to the spatial spillover effect of AGPE, and promote the rational flow of production factors within the region. Attention should be paid to the exchange and cooperation of production factors such as agricultural production technology, capital, talent, and information technology among regions. Establish a mechanism for the coordinated development of agriculture among regions. Avoid regional protectionism and “beggar thy neighbor” phenomena, and jointly promote the upgrading of AGPE.
Due to the limitations of research conditions, some aspects of this article still deserve further improvement in future research. Firstly, there are many methods for measuring AGPE, and in the future, we can focus on updated methods for measuring AGPE. Secondly, if the research data can reach the county and city levels, there may be more exciting research results. Thirdly, the specific characteristics of the agricultural sector and credit systems in China may not be representative of other contexts. This study aims to provide a theoretical basis and empirical test for studying agricultural credit input and agricultural green production efficiency. We hope that our research can better promote China’s agricultural green production efficiency.
The original contributions presented in the study are included in the article/Supplementary Material, further inquiries can be directed to the corresponding authors.
HW: conceptualization, methodology, visualization, writing—original draft, funding acquisition. LD: formal analysis, conceptualization and writing—review and editing. All authors contributed to the article and approved the submitted version.
This research was supported by the General Research Project of Harbin Federation of Social Sciences (Item number: 2023HSKY060) and the Heilongjiang Provincial Philosophy and Social Science Fund Project (Item number: 21JLE322).
The authors declare that the research was conducted in the absence of any commercial or financial relationships that could be construed as a potential conflict of interest.
All claims expressed in this article are solely those of the authors and do not necessarily represent those of their affiliated organizations, or those of the publisher, the editors and the reviewers. Any product that may be evaluated in this article, or claim that may be made by its manufacturer, is not guaranteed or endorsed by the publisher.
Chen, Y., Miao, J., and Zhu, Z. (2021). Measuring green total factor productivity of China's agricultural sector: A three-stage SBM-DEA model with non-point source pollution and CO2 emissions. J. Clean. Prod. 318, 128543. doi:10.1016/j.jclepro.2021.128543
Ding, J., Liu, B., and Shao, X. (2022a). Spatial effects of industrial synergistic agglomeration and regional green development efficiency: Evidence from China. Energy Econ. 112, 106156. doi:10.1016/j.eneco.2022.106156
Ding, J., Qiao, P., Wang, J., and Huang, H. (2022b). Impact of food safety supervision efficiency on preventing and controlling mass public crisis. Front. Public Health 10, 1052273. doi:10.3389/fpubh.2022.1052273
Djoumessi, Y. F. (2021). What innovations impact agricultural productivity in Sub-Saharan Africa? J. Agric. Food Res. 6, 100228. doi:10.1016/j.jafr.2021.100228
Du, L., Tian, M., Cheng, J., Chen, W., and Zhao, Z. (2022a). Environmental regulation and green energy efficiency: An analysis of spatial Durbin model from 30 provinces in China. Environ. Sci. Pollut. Res. Int. 29 (44), 67046–67062. doi:10.1007/s11356-022-20551-0
Du, L., Wang, F., and Tian, M. (2022b). Environmental information disclosure and green energy efficiency: A spatial econometric analysis of 113 prefecture-level cities in China. Front. Environ. Sci. 10, 996580. doi:10.3389/fenvs.2022.966580
Du, L., Wang, F., Tian, M., Zhao, Z., Ma, S., and Wang, F. (2023). Spatiotemporal differentiation and spatial correlation of agricultural total factor productivity in China: An estimation based on the data of prefecture-level cities. Ciência Rural. 53 (4), 877. doi:10.1590/0103-8478cr20210877
Fan, F. (2020). Does farmer credit improve the technical efficiency of agricultural production? Analysis based on micro survey data of farmers. J. Central Univ. Finance Econ. 5, 33–41.
Färe, R., Grosskopf, S., Lindgren, B., and Roos, P. (1992). Productivity changes in Swedish pharamacies 1980-1989: A non-parametric malmquist approach. J. Prod. Analysis 3, 85–101. doi:10.1007/bf00158770
Färe, R., Grosskopf, S., and Lovell, C. A. K. (1994). Production frontiers. Cambridge, United Kingdom: Cambridge University Press.
Grivins, M., Thorsøe, M. H., and Maye, D. (2021). Financial subjectivities in the agricultural sector: A comparative analysis of relations between farmers and banks in Latvia, Denmark and the UK. J. Rural Stud. 86, 117–126. doi:10.1016/j.jrurstud.2021.06.006
Han, H., Zhong, Z., Wen, C., and Sun, H. (2018). Agricultural environmental total factor productivity in China under technological heterogeneity: Characteristics and determinants. Environ. Sci. Pollut. Res. Int. 25 (32), 32096–32111. doi:10.1007/s11356-018-3142-4
Hu, Y., Liu, C., and Peng, J. (2021). Financial inclusion and agricultural total factor productivity growth in China. Econ. Model. 96, 68–82. doi:10.1016/j.econmod.2020.12.021
Huang, W., Liu, Q., and Abu Hatab, A. (2023). Is the technical efficiency green? The environmental efficiency of agricultural production in the MENA region. J. Environ. Manage 327, 116820. doi:10.1016/j.jenvman.2022.116820
Huang, X., Feng, C., Qin, J., Wang, X., and Zhang, T. (2022). Measuring China's agricultural green total factor productivity and its drivers during 1998-2019. Sci. Total Environ. 829, 154477. doi:10.1016/j.scitotenv.2022.154477
Kumbhakar, S. C., Wang, H.-J., and Horncastle, A. P. (2015). A practitioner's guide to stochastic frontier analysis using stata. Cambridge, United Kingdom: Cambridge University Press.
Li, C., Shi, Y., Khan, S. U., and Zhao, M. (2021). Research on the impact of agricultural green production on farmers' technical efficiency: Evidence from China. Environ. Sci. Pollut. Res. Int. 28 (29), 38535–38551. doi:10.1007/s11356-021-13417-4
Li, G., Jia, X., Khan, A. A., Khan, S. U., Ali, M. A. S., and Luo, J. (2023). Does green finance promote agricultural green total factor productivity? Considering green credit, green investment, green securities, and carbon finance in China. Environ. Sci. Pollut. Res. Int. 30 (13), 36663–36679. doi:10.1007/s11356-022-24857-x
Li, H., Tang, M., Cao, A., and Guo, L. (2022). Assessing the relationship between air pollution, agricultural insurance, and agricultural green total factor productivity: Evidence from China. Environ. Sci. Pollut. Res. Int. 29 (52), 78381–78395. doi:10.1007/s11356-022-21287-7
Liang, X., Li, J., Guo, G., Li, S., and Gong, Q. (2021). Evaluation for water resource system efficiency and influencing factors in Western China: A two-stage network DEA-tobit model. J. Clean. Prod. 328, 129674. doi:10.1016/j.jclepro.2021.129674
Liu, D., Zhu, X., and Wang, Y. (2021). China's agricultural green total factor productivity based on carbon emission: An analysis of evolution trend and influencing factors. J. Clean. Prod. 278, 123692. doi:10.1016/j.jclepro.2020.123692
Liu, Y., and Feng, C. (2019). What drives the fluctuations of “green” productivity in China’s agricultural sector? A weighted russell directional distance approach. Resour. Conservation Recycl. 147, 201–213. doi:10.1016/j.resconrec.2019.04.013
Liu, Z., Zhang, M., Li, Q., and Zhao, X. (2023). The impact of green trade barriers on agricultural green total factor productivity: Evidence from China and OECD countries. Econ. Anal. Policy. 78, 319–331. doi:10.1016/j.eap.2023.03.011
Mei, B., Khan, A. A., Khan, S. U., Ali, M. A. S., and Luo, J. (2022). An estimation of the effect of green financial policies and constraints on agriculture investment: Evidences of sustainable development achievement in northwest China. Front. Public Health 10, 903431. doi:10.3389/fpubh.2022.903431
Oh, D. H., and Lee, J. D. (2010). A metafrontier approach for measuring Malmquist productivity index. Empir. Econ. 38, 47–64. doi:10.1007/s00181-009-0255-0
Sheng, Y., Ball, V. E., Erickson, K., and Mesonada, C. S. J. (2022). Cross-country agricultural TFP convergence and capital deepening: Evidence for induced innovation from 17 OECD countries. J. Prod. Analysis 58 (2-3), 185–202. doi:10.1007/s11123-022-00646-z
Song, Y., Zhang, B., Wang, J., and Kwek, K. (2022). The impact of climate change on China's agricultural green total factor productivity. Technol. Forecast. Soc. Change 185, 122054. doi:10.1016/j.techfore.2022.122054
Sun, Y. (2022). Environmental regulation, agricultural green technology innovation, and agricultural green total factor productivity. Front. Environ. Sci. 10, 955954. doi:10.3389/fenvs.2022.955954
Thi, N., and Chi, K. (2022). Driving factors for green innovation in agricultural production: An empirical study in an emerging economy. J. Clean. Prod. 368, 132965. doi:10.1016/j.jclepro.2022.132965
Tobin, J. (1958). Estimation of relationships for limited dependent variables. Econometrica 26 (1), 24–36. doi:10.2307/1907382
Tone, K. (2004). Dealing with undesirable outputs in DEA:a slacksbased measure(SBM) Approach. Toronto: NAPW III, 44–45.
Wang, F., Du, L., and Tian, M. (2022). Does agricultural credit input promote agricultural green total factor productivity? Evidence from spatial panel data of 30 provinces in China. Int. J. Environ. Res. Public Health 20 (1), 529. doi:10.3390/ijerph20010529
Wen, H., and Wang, H. (2022). Spatio-temporal relationship between agricultural credit scale and agricultural total factor productivity. Mod. Econ. Res. 4, 114–125.
Xu, X., Huang, X., Huang, J., Gao, X., and Chen, L. (2019). Spatial-temporal characteristics of agriculture green total factor productivity in China, 1998-2016: Based on more sophisticated calculations of carbon emissions. Int. J. Environ. Res. Public Health 16, 3932. doi:10.3390/ijerph16203932
Yang, Y., Ma, H., and Wu, G. (2022). Agricultural green total factor productivity under the distortion of the factor market in China. Sustainability 14, 9309. doi:10.3390/su14159309
Yao, S., and Wu, G. (2022). Research on the efficiency of green agricultural science and technology innovation resource allocation based on a three-stage DEA model-A case study of anhui province, China. Int. J. Environ. Res. Public Health 19, 13683. doi:10.3390/ijerph192013683
Yu, B. (2021). Urban spatial structure and total-factor energy efficiency in Chinese provinces. Ecol. Indic. 126, 107662. doi:10.1016/j.ecolind.2021.107662
Yu, D., Liu, L., Gao, S., Yuan, S., Shen, Q., and Chen, H. (2022). Impact of carbon trading on agricultural green total factor productivity in China. J. Clean. Prod. 367, 132789. doi:10.1016/j.jclepro.2022.132789
Zhao, X., Nakonieczny, J., Jabeen, F., Shahzad, U., and Jia, W. (2022). Does green innovation induce green total factor productivity? Novel findings from Chinese city level data. Technol. Forecast. Soc. Change 185, 122021. doi:10.1016/j.techfore.2022.122021
Zhong, S., Li, Y., Li, J., and Yang, H. (2021). Measurement of total factor productivity of green agriculture in China: Analysis of the regional differences based on China. PLoS One 16 (9), 0257239. doi:10.1371/journal.pone.0257239
Keywords: agricultural credit scale, agricultural green production efficiency, Metafrontier-Malmquist-Luenberger index, panel Tobit model, panel data
Citation: Wang H and Du L (2023) Agricultural credit scale and agricultural green production efficiency: a Metafrontier-Malmquist-Luenberger and panel Tobit approach. Front. Environ. Sci. 11:1191012. doi: 10.3389/fenvs.2023.1191012
Received: 21 March 2023; Accepted: 23 May 2023;
Published: 01 June 2023.
Edited by:
Shigeyuki Hamori, Kobe University, JapanReviewed by:
Sufyan Ullah Khan, University of Stavanger, NorwayCopyright © 2023 Wang and Du. This is an open-access article distributed under the terms of the Creative Commons Attribution License (CC BY). The use, distribution or reproduction in other forums is permitted, provided the original author(s) and the copyright owner(s) are credited and that the original publication in this journal is cited, in accordance with accepted academic practice. No use, distribution or reproduction is permitted which does not comply with these terms.
*Correspondence: Hongyu Wang, d2FuZ2hvbmd5dTMzNTU3N0AxNjMuY29t; Lei Du, ZHVsZWlAYmpmdS5lZHUuY24=
Disclaimer: All claims expressed in this article are solely those of the authors and do not necessarily represent those of their affiliated organizations, or those of the publisher, the editors and the reviewers. Any product that may be evaluated in this article or claim that may be made by its manufacturer is not guaranteed or endorsed by the publisher.
Research integrity at Frontiers
Learn more about the work of our research integrity team to safeguard the quality of each article we publish.