 Qianrong Ma
 Hongjia Lei
 Fang Jia
 Siyuan Sun1
 Pengcheng Yan
 Guolin Feng
94% of researchers rate our articles as excellent or good
Learn more about the work of our research integrity team to safeguard the quality of each article we publish.
Find out more
ORIGINAL RESEARCH article
Front. Environ. Sci., 07 April 2023
Sec. Atmosphere and Climate
Volume 11 - 2023 | https://doi.org/10.3389/fenvs.2023.1185776
This article is part of the Research TopicClimate-Environment Interactions under Global WarmingView all 25 articles
The characteristics and related mechanisms of the interannual variability of late summer (August) extreme precipitation in West China (WC) were investigated from 1961 to 2021. Precipitation and extreme precipitation (defined as the 99th percentile) generally decreased in the southeast-northwest direction, with a maximum in the Sichuan Basin. The non-linear trends in extreme precipitation have increased since the 1980s. Therefore, we further found that the interannual increase in extreme precipitation in the WC was significantly related to the eastward-strengthened South Asian high, western-stretched Western Pacific Subtropical high, enhanced westerly jet, anomalous cyclone in Mongolia, and anomalous anticyclone in the western Pacific. The anti-cyclonic anomaly is a Gill-type response to increase the sea surface temperature in the western Pacific. A mid-high latitude barotropic Rossby-wave train can be induced and has essential effects on the above key circulation patterns, further cooperating with the strong updrafts rather than strengthening and maintaining extreme precipitation in the WC.
The East Asian summer monsoon (EASM) affects four precipitation peaks in China through its northward advance (Ding and Chan, 2005; Wang and Ding, 2008; Ullah et al., 2023). The main rain belts successively move through South China, the Yangtze River Valley, and North China (Wang and Ding, 2008; Ding et al., 2010; Sun et al., 2017), with precipitation mainly concentrated in summer (He et al., 2007; Shi et al., 2020). In West China (WC, referring to 28–36°N and 100−108°E), the autumn rain phenomenon is the most common after summer precipitation, known as the West China autumn Rain, which is the last rain belt accompanied by the retreating EASM (Bai and Dong, 2004; Wang and Ding, 2008; Zhou et al., 2021). Yuan and Liu (2013) defined the start (August) and end (October) dates of the West China autumn Rain using the transition time of the wind direction from summer to winter. Many studies have shown that late summer precipitation significantly impacts the duration and intensity of autumn rain in WC (Yuan and Liu, 2013; Wei et al., 2018a; Wang and Zhou, 2019).
In recent decades, China has experienced significant changes in precipitation characteristics and intensity because of global warming (Aihaiti et al., 2021; Herzschuh et al., 2019; Xu et al., 2021). Late summer precipitation in the WC has become more diverse and intense because of the influence of the Indian, East Asian, and Tibetan Plateau monsoons, which may lead to floods, landslides, and debris flows and have a significant impact on human society and the economy (Zhai et al., 2005; Wang et al., 2015; Ma et al., 2022; Qian et al., 2022). Wang et al. (2015) demonstrated that precipitation in WC decreased before the 1990s and increased after the 2000s, emphasizing increased precipitation intensity (Zhang et al., 2019; Nie and Sun, 2021).
In addition, there have been frequent extreme precipitation events in WC that have caused flooding disasters in recent years, such as in the late summer of 2017, which affected more than 6 million people and resulted in direct economic losses of 121 billion Chinese Yuan (Hartfield et al., 2018; Zhou J. et al., 2019). In July 2019, an extreme precipitation event triggered a catastrophic landslide causing more than 50 casualties (Fan et al., 2020). The most recent extreme precipitation event occurred in August 2020, with an average 24-h precipitation anomaly that broke historical records since 1960 (Qian et al., 2022). This rare extreme precipitation has become one of the top 10 weather and climate events in 2020, affecting more than 8.523 million people and causing direct economic losses of 60.93 billion Chinese Yuan (http://news.weather.com.cn/2020/12/3427356.shtml). Therefore, it is crucial to investigate the characteristics and causes of late summer extreme precipitation in the WC to enhance disaster prevention and management capabilities.
Previous studies have analyzed the factors that influence precipitation in WC. The EASM significantly impacts thermal, dynamic, and hydrological processes (Yasui and Watanabe, 2010; Wang et al., 2015; Yuan and Yang, 2020). Wei et al. (2018b) found that the northward shifting and strengthening of the East Asian jet stream (EAJS) could adjust abnormal ascending branches and influence precipitation in the WC. When the western Pacific subtropical high (WPSH) extends westward and strengthens, more precipitation occurs in the WC because of abundant moisture (Zhu and Yu, 2003; Ma et al., 2022). The strengthened WPSH, combined with the northward EAJS, benefits water vapor transportation from the Bay of Bengal, South China Sea, and western Pacific to the WC, leading to increased precipitation (Wei et al., 2018b; Zhou B. et al., 2019; Ullah et al., 2023). Monsoons from the Bay of Bengal and the South China Sea also significantly impact the increasing of precipitation by the moisture transportation (Wang and Ding, 2008). The anomalous South Asian High (SAH) is closely related to summer precipitation in the WC because of enhanced upward movement and water vapor transport (Chen et al., 2016). The role of the sea surface temperature (SST) has also been studied. Xu et al. (2016) found that the possible cooperative impacts of the El Niño–Southern Oscillation (ENSO) and Indian Ocean Dipole (IOD) have significant effects on anomalous lower-level anticyclones over the western North Pacific and the southward shift of the strengthened EAJS, which further increases precipitation in the WC. The Atlantic multidecadal oscillation (AMO) and Pacific decadal oscillation (PDO) have also been shown to influence the interdecadal variation of precipitation in WC (Gao et al., 2017; Wei et al., 2018a; Yang et al., 2019). Additionally, the variability in precipitation in the WC is positively correlated with the austral winter sea ice concentration in the southern Indian and Pacific Oceans (Zhou et al., 2021). Surface conditions over the Tibetan Plateau are also considered vital factors (Huo et al., 2014). Most previous studies have examined autumn precipitation changes and identified key factors (Yuan and Liu, 2013; Wang et al., 2015; Xu et al., 2016; Nie and Sun, 2021). However, the recurrent circulation conditions for extreme precipitation events in WC, which have become more frequent and violent in late summer, remain unclear.
This study aimed to understand better the physical mechanisms of late summer extreme precipitation in WC and answer the associated questions. The remainder of this paper is organized as follows: Section 2 introduces the data and methods used in the study. Section 3 describes the characteristics of late summer extreme precipitation in WC. In addition, the circulation mechanisms, the relationship with SST in the western Pacific, and the physical mechanism behind their linkage are discussed. Finally, Section 5 presents a brief conclusion and discussion.
Observed daily precipitation datasets were supplied by the National Meteorological Information Center of the China Meteorological Administration (CMA). A total of 250 stations in WC (28˚–36˚N, 100˚–108˚E, Figure 1) were selected in late summer (August) from 1961 to 2021, in which the missing stations with less than 5% of the total missing time series were estimated using the inverse distance method (Eischeid et al., 2000). The ERA5 atmospheric reanalysis data used in this study, including potential height, temperature, horizontal winds, vertical velocity, and specific humidity, were provided by the European Center for Medium-Range Weather Forecasting (Bell et al., 2021). The horizontal resolution of the variables was 0.25° × 0.25°, and the vertical layer was 1000–1 hPa with 37 layers. To investigate the combined effects of SST anomalies on the interannual variability of extreme precipitation in WC, global monthly SST data with a 1° × 1 ° horizontal resolution obtained from the Met Office Hadley Centre Sea Ice and Sea Surface Temperature (HadISST) (Rayner et al., 2003) were also used. Notably, linear trends in all datasets were removed before analysis.
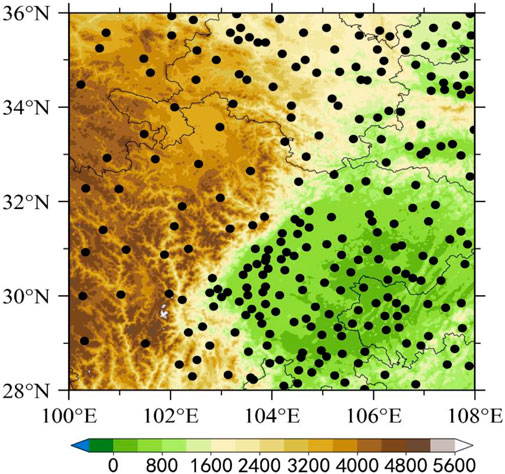
FIGURE 1. Topographic profile and distribution of 250 meteorological stations (dark dots) in WC.
Extreme precipitation indices were provided by the World Meteorological Organization (WMO) Expert Team on Climate Change Detection and Indices (ETCCDI; http://etccdi.pacificclimate.org/list_27_indices.shtml). In this study, the 99% percentile of wet days in August was selected as extreme precipitation. The total precipitation accumulation with daily precipitation exceeding the 99th percentile was defined as R99TOT, and the number of occurrences was R99FRE. The Generalized Extreme Value (GEV) distribution was applied to describe the distribution of extreme values, and the return period used to investigate the occurrence of particular extreme events was calculated using the GEV. Empirical Orthogonal Function (EOF) analysis (Lorenz, 1956) was proposed to exhibit the leading mode of variability of extreme precipitation in August over WC from 1961 to 2021. The interannual variability of extreme precipitation was calculated by removing the 9-year running mean from the original time series. Consequently, linear regression and Pearson correlation were used for statistical analysis, and statistical significance was determined using Student’s t-test.
The wave activity fluxes (WAFs) were calculated according to Takaya and Nakamura (2001) as follows:
where
where
The vertically integrated water vapor transport flux (WVT) was defined by Trenberth (1991). The vertical integrated <
The climatological spatiotemporal characteristics of late summer precipitation and extreme precipitation in WC during 1961–2021 are shown in Figure 2. Both precipitation (Figure 2A) and extreme precipitation (Figure 2B) exhibited an inhomogeneous spatial distribution, which increased from the northwest to the southeast, and the values were higher in the western Sichuan Basin. Spatial distributions are influenced by the orography and altitude of the WC (Nie and Sun, 2021). As shown in Figure 2C, the R99FRE exceeded 10 times by more than 97% of the stations, and the stations in southeastern WC largely reached 18 times. Apart from southeastern Sichuan, increasing precipitation trends prevailed in southern Gansu, southwestern Shaanxi, and the Sichuan Basin (Figure 2D). Compared with precipitation, R99TOT and R99FRE occurred more frequently in most WC, except in the southeastern regions (Figures 2E, F).
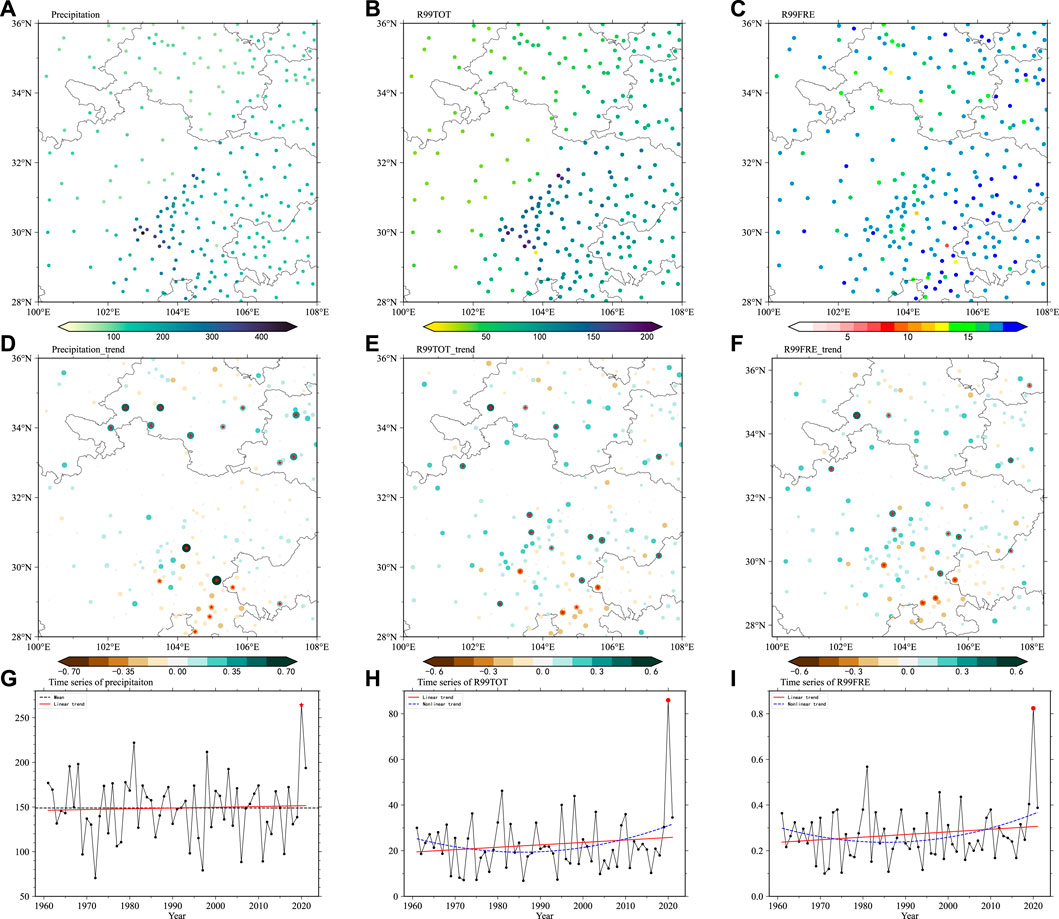
FIGURE 2. Spatial distributions of (A) precipitation, (B) R99TOT, (Unit: mm), and (C) R95FRE (Unit: times), with units of mm and times, as well as the linear trend of (D) precipitation, (E) R99TOT (Unit: mm/year), and (F) R95FRE (Unit: times/year) in WC during late summer from 1961 to 2021. The dotted stations indicate significant values at the 95% confidence level based on the Student’s t-test. The time series of regional (G) precipitation, (H) R99TOT, and (I) R95FRE in WC are plotted in black lines. The solid gray line in (G) represents the average precipitation. The red and blue dotted lines in (H) and (I) represent linear and non-linear trends, respectively.
The regional precipitation, R99TOT, and R99FRE in WC and the eastern regions during late summer are further discussed. There were no significant trends or decadal changes in precipitation and extreme precipitation indices (Figures 2G–I). However, the non-linear trends of R99TOT and R99FRE showed a transition around 2000 from a decreasing to an indistinctive increasing trend (Figures 2H, I), further implying that the variability of extreme precipitation in WC has different features.
Under the background of a slightly linear increasing trend in WC at a rate of 0.01 mm decade−1. The observed rainfall in August 2020 in WC was a rare event, occurring with a return period of 60 years, based on the GEV fits (Figure 3A). The intensity reached 2.46 standard deviations (Qian et al., 2022). Furthermore, comparisons between the R99TOT anomalies reconstructed from different periods suggest that climate change is likely to increase the occurrence of extreme precipitation events, especially in recent decades (Figure 3B). In addition, the KS test in Figure 3A suggests that the observed extreme precipitation in August 2020 was not an outlier and can be explained within the context of historical records. Therefore, an in-depth understanding of extreme precipitation from large-scale circulation is crucial for predicting and mitigating disasters.
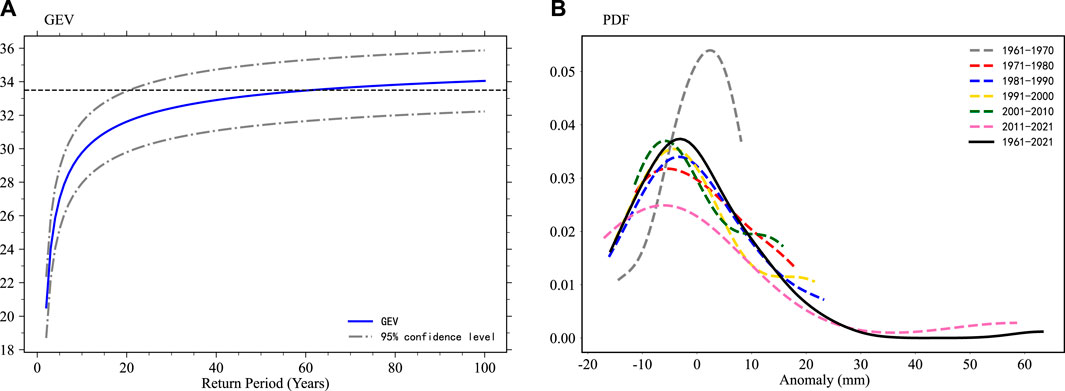
FIGURE 3. (A) Return period (blue line) fitted with the GEV distribution at 95% confidence intervals. (B) The GEV distribution fits the seven different periods: 1961–1970 (gray), 1971–1980 (red), 1981–1990 (blue), 1991–2000 (yellow), 2001–2010 (green), 2011–2021 (pink), and 1961–2021 (black).
The first EOF mode of R99TOT displayed a dipole pattern with an increase in the northwestern WC and a decrease in the southeastern WC, accounting for 22.12% of the total variance (Figure 4A). The maximum positive values were located in the western Sichuan Basin and southeastern Gansu Province. PC1, which corresponds to the first mode, as shown in Figure 4B, presents an asymmetrical oscillation. The interannual and interdecadal components accounted for 88% and 12%, respectively, of the total variance in PC1. Therefore, this study further explored the atmospheric processes associated with the interannual variability in late summer extreme precipitation.
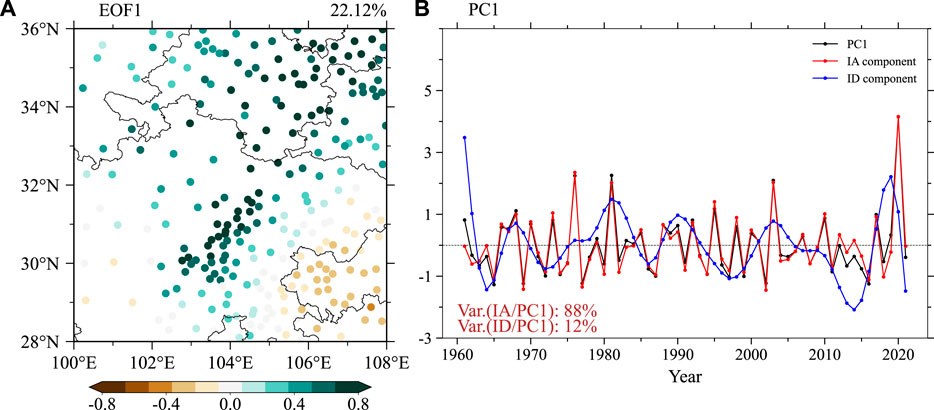
FIGURE 4. (A) Spatial pattern and (B) the principal component (PC, black line) of the first EOF mode of late summer extreme precipitation in WC from 1961 to 2021. The red and blue lines in (B) are the interannual and interdecadal components of PC1, respectively.
Changes in interannual late summer extreme precipitation in WC were closely linked to consistent changes in atmospheric circulation. Thus, Figure 5 illustrates the anomalous atmospheric circulation patterns regressed onto the interannual PC1 component from 1961 to 2021.
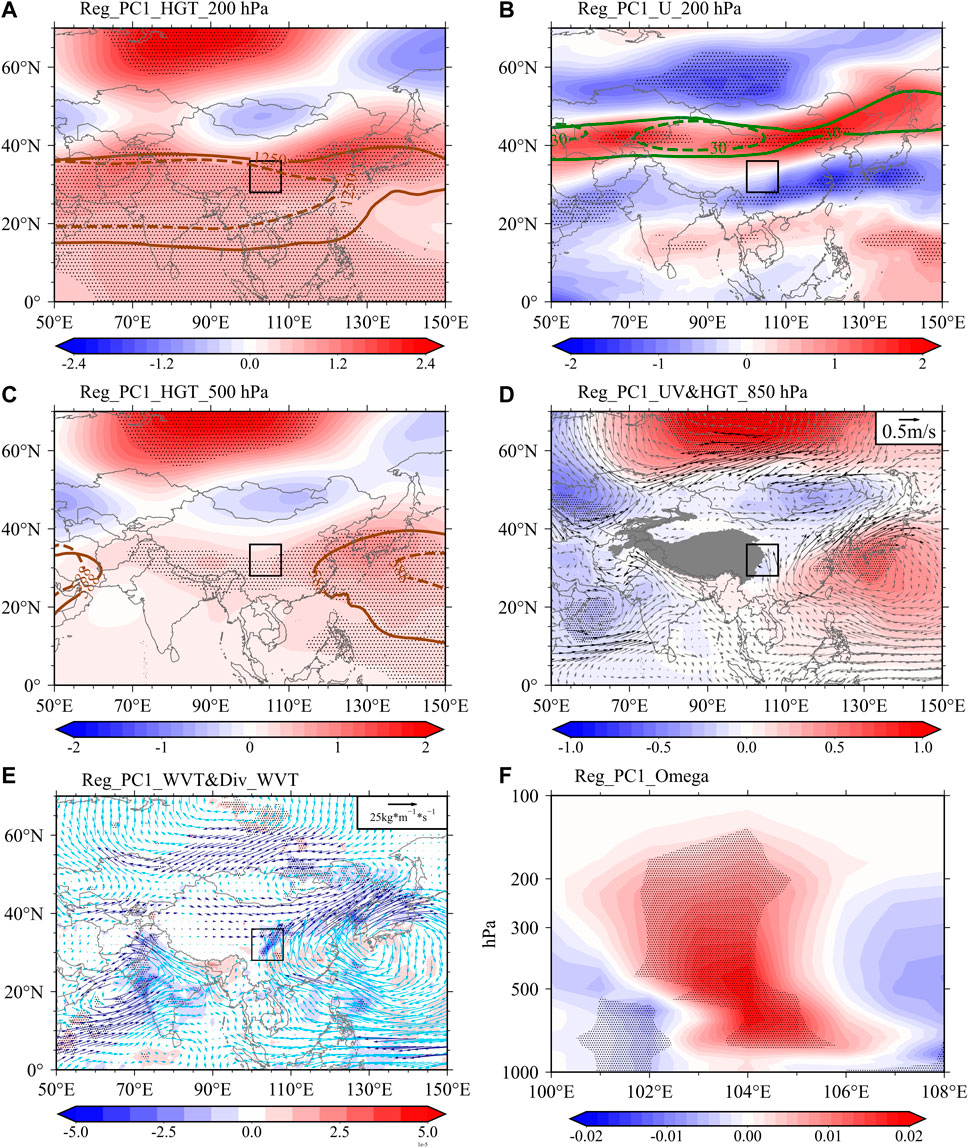
FIGURE 5. Regressed (A) geopotential height at 200 hPa (Shading, Unit: gpm; the dashed and solid brown lines represent the 12,500 gpm isoline in the climatological and regressed mean, respectively), (B) the zonal wind at 200 hPa (Shading, Unit: m·s−1; the dashed and solid green lines represent the 30 ms−1 isolines in the climatological and regressed mean, respectively), (C) the geopotential height at 500 hPa (Shading, Unit: gpm; the dashed and solid brown lines are the same as (A) but for 5,880 isolines). (D) The geopotential height at 850 hPa (Shading, Unit: gpm) and wind fields (Vectors, Unit: m·s−1). (E) The WVT (Vectors, Unit: kg·m−1·s−1) and its divergence (Shading, Unit: kg·m−2·s−1), and (F) the height-longitude profile of vertical velocity along the latitudes 30°–36°N (Shading, Unit: 10−1 Pa·s−1) in late summer onto the interannual component of PC1 from 1961 to 2021, respectively. Dotted areas are statistically significant at the 95% confidence level.
There are three notable anti-cyclonic systems in the Western Siberian Plain, Iranian Plateau, and Korean Peninsula from 200 hPa (Figure 5A) to 500 hPa (Figure 5C). Simultaneously, three cyclonic systems were located over the Caspian Sea, Mongolia, and the Chersky Mountains. The cyclonic system over Mongolia stretched southward, and the WC was sandwiched between two high-pressure centers at 500 hPa (Figure 5C). It is worth noting that the 12,500 gpm at 200 hPa and 5,880 gpm at 500 hPa isolines abnormally strengthened. Ma et al. (2022) emphasized that the eastward SAH and westward WPSH provided favorable conditions for extreme events in August 2022. Furthermore, the westerly jet at 200 hPa was also strengthened, and the WC was located on its south side (Figure 5B). In the lower troposphere, the cyclonic system over Mongolia further stretched southward, and an anti-cyclonic system over the western Pacific caused the WC to be affected by the low-pressure trough and southerly water vapor (Figure 5D). As shown in Figure 5E, abundant anomalous southerly water vapor was transported to WC and mainly converged along 30°–36°N, 104°–106°E, which is consistent with the maximum R99TOT. In addition, the regressed vertical motion enhanced significant upward vertical motion and sustained extreme precipitation in WC (Figure 5F).
Under these atmospheric circulation patterns, the SAH and WPSH tended to extend further east and west, respectively. This favored the formation of an upper-level divergence. The enhanced jet stream shifted northward, and the cyclonic system over Mongolia stretched southward, providing beneficial dynamic conditions (Yokoyama et al., 2017). Correspondingly, the anti-cyclonic system over the western Pacific guaranteed sufficient water vapor. Finally, a high R99TOT occurred in cooperation with enhanced updrafts.
To illustrate the formation of quasi-barotropic circulation anomalies, summer SST fields associated with the interannual component of PC1 are plotted in Figure 6. Figure 6A shows the SST regression of the interannual component of PC1. A significant positive SST anomaly was observed in the western Pacific Ocean. The areas with the highest relevance (at the 95% confidence level) were selected as key SST regions. The SST index (SSTI) is defined as the year-to-year regionally averaged SST over 0°–25°N, 110°–150°E. In Figure 6B, the SSTI significantly increased with 0.014°C/year (at the 99% confidence level), and the correlation coefficients with the interannual component of PC1 reached 0.48 (at the 99% confidence level). In addition, the SSTI experienced significant interdecadal changes around the mid-1980s.
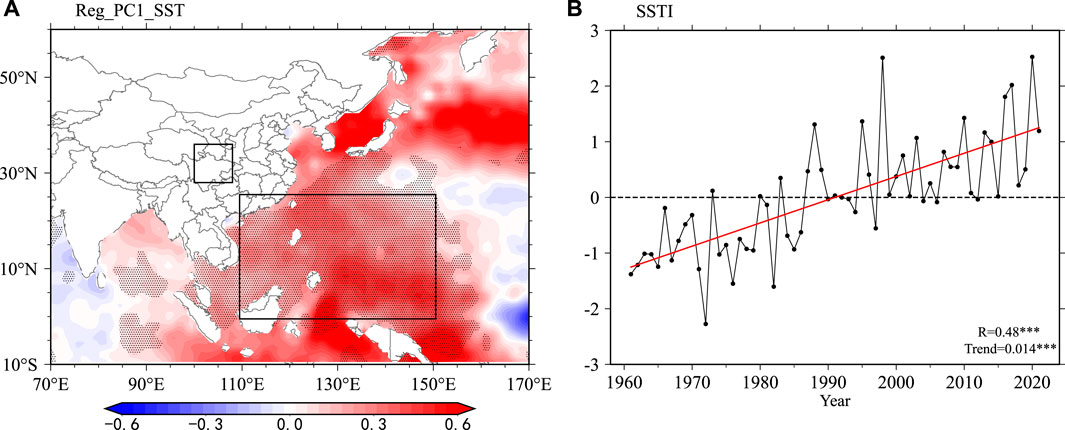
FIGURE 6. (A) Regressed SST maps in summer onto the interannual component of PC1 from 1961 to 2021, and (B) the standardized SSTI series and its linear trend during 1961–2021. The two black rectangular frames in (A) represent locations of WC and pass the 95% significance level, respectively. The black rectangular boxes in (A) represent locations of WC and pass the 95% significance level, respectively.
To validate the speculation that increasing SST could influence interannual R99TOT by adjusting atmospheric teleconnections. Figure 7 shows the regressed circulation and precipitation against the SSTI. Figure 7A shows the regressed zonal wind at 200 hPa, the strengthened westerly jet stream, and the southern WC. At 500 hPa, three notable anti-cyclonic systems were centered over the Western Siberian Plain, the Indian peninsula, and southeast China (Figure 7B). Against the backdrop of increasing SST in the western Pacific, the SAH and WPSH also tended to strengthen. The cyclonic system over Mongolia stretched southward and placed the WC between two high-pressure centers. The anomalously strengthened anticyclone over the western Pacific at 850 hPa continuously transported water vapor into WC (Figure 7C). Simultaneously, the strong upward vertical velocity further enhanced precipitation (Figure 7D). In Figures 7E, F, the significantly increased precipitation and R99TOT further prove that the warming of the western Pacific might be closely related to precipitation and extreme precipitation in WC.
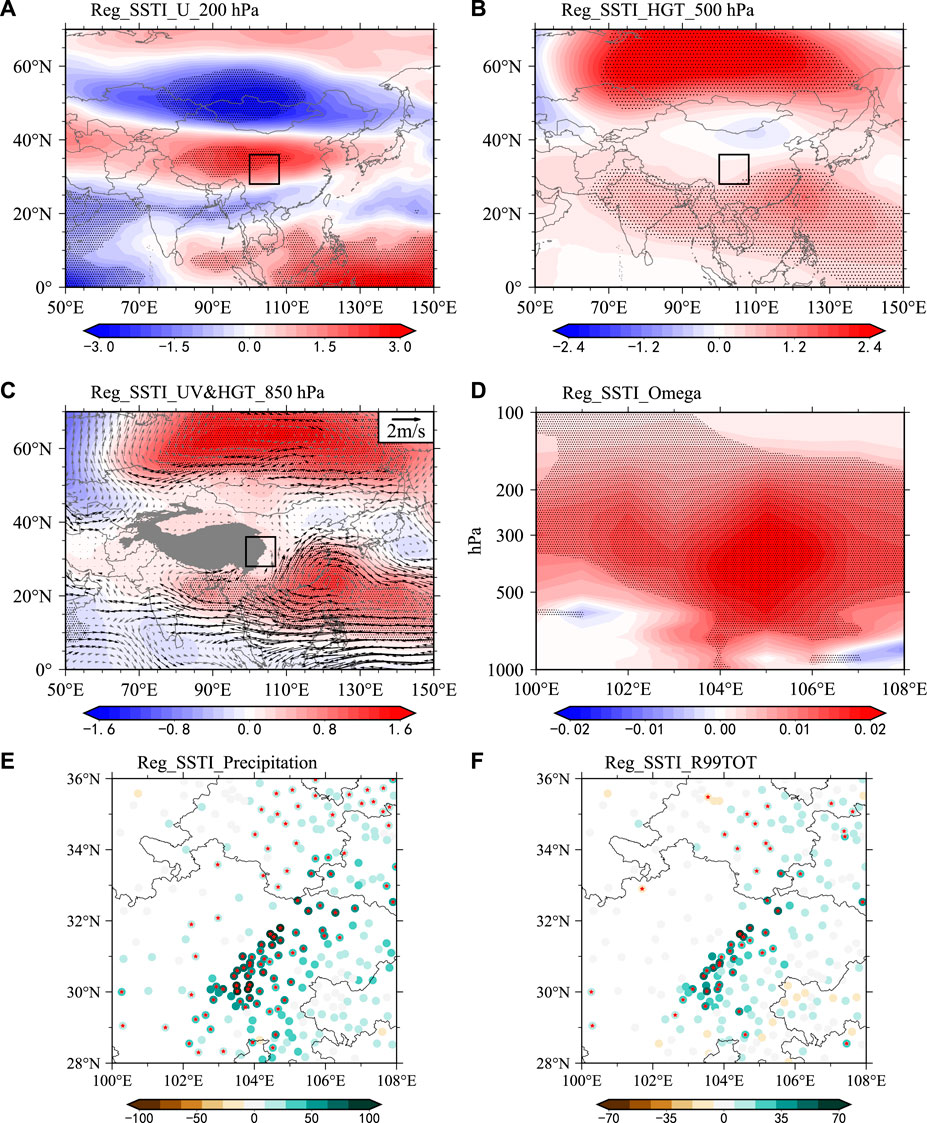
FIGURE 7. Regressed (A) zonal wind at 200 hPa (Shading, Unit: m·s−1), (B) geopotential height at 500 hPa (Shading, Unit: gpm), (C) geopotential height (Shading, Unit: gpm) and wind fields (Vectors, Unit: m·s−1) at 850hPa, (D) vertical velocity height-longitude profile (Shading, Unit: m·s−1), (E) later summer precipitation and (F) R99TOT in WC (Dots, Unit: mm) onto the SSTI from 1961 to 2021, respectively. Dotted areas and red starts are statistically significant at the 95% confidence level.
Figure 8 shows the responses of WAFs and RWS to interannual R99TOT and increased SSTI. In Figure 8A, the regressed WAF with respect to the interannual components of PC1 originated from the West Pacific, was transmitted across the Atlantic, and was enhanced over Europe before arriving and converging in the WC. Figure 8B shows the SSTI regressed WAFs and RWS. It is clear that the WAFs separated from the western Pacific, and an obvious wave train crossed the mid-high latitudes, strengthened over western Europe, and converged in the WC, which further proved that the stationary Rossby-wave train was derived from the Pacific.
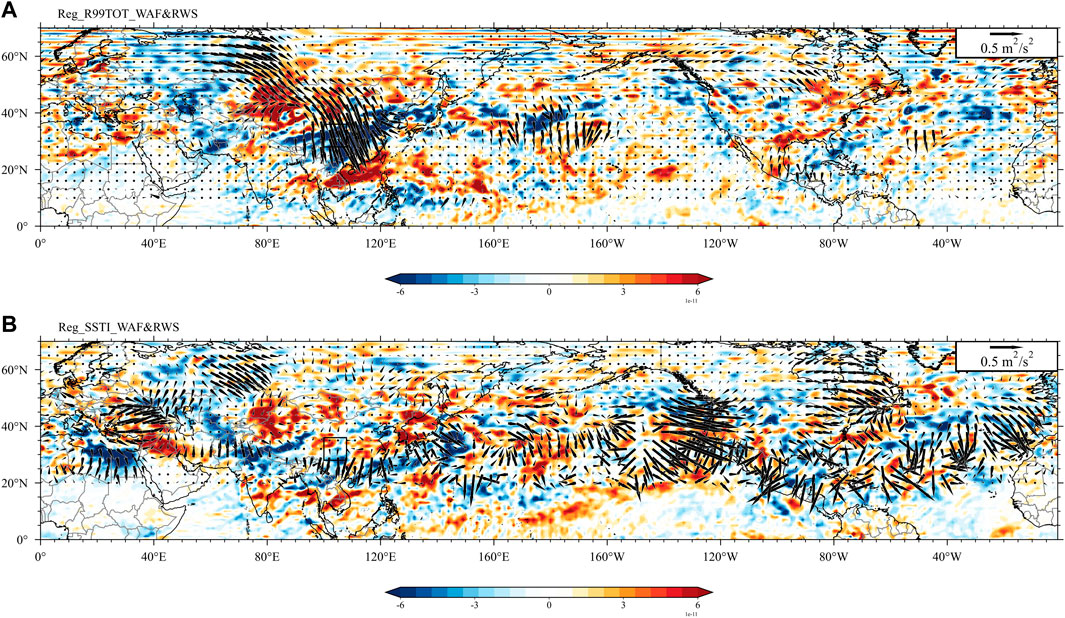
FIGURE 8. WAFs (Vectors; Unit: m2·s−2) and RWS (Shading; Unit: 10–10 m2·s−1) at 200 hPa regressed onto the (A) interannual component of PC1 and (B) SSTI from 1961–2021, respectively.
In summary, the warming SST in the western Pacific could induce a barotropic Rossby-wave train, which provides beneficial conditions for extreme precipitation in WC.
The characteristics and related mechanisms of the interannual variability of late summer extreme precipitation in the WC were investigated based on meteorological station observations. Late summer precipitation, R99TOT, and R99FRE generally decreased in a southeast-northwest direction. Relatively high values are observed in the Sichuan Basin. Precipitation decreased before 2020, and heavy precipitation in 2020 was rare. In turn, the non-linear trends of R99TOT and R99FRE have increased since the 1980s, which indicates that these trends were enveloped by variability (Nie and Sun, 2021; Qian et al., 2022). Extreme precipitation events have become increasingly frequent and heavy in recent decades. Therefore, a detailed understanding of the dynamic origins of extreme precipitation in WC is important.
Thus, the related atmospheric circulation and fundamental physical processes were further investigated. The interannual components of R99TOT account for 88% of the total variance from 1961 to 2021. The eastward-strengthened SAH and western-stretched WPSH played key roles in increasing R99TOT in WC, especially along 30˚–36˚N, 104˚–106˚E. Furthermore, the enhanced westerly jet stream located on the northern side of the WC provides beneficial dynamic conditions for extreme precipitation (Yokoyama et al., 2017). The increased SSTI promoted convection and induced diabatic heating, which triggered an anti-cyclonic anomaly in the western Pacific that transported abundant water vapor to the WC. These anomalous circulation patterns were unusually strong in 2020 (Ma et al., 2022). In addition, anomalously strong updrafts further strengthened and maintained extreme precipitation events.
Notably, high-value areas where extreme precipitation frequently occurs, located on the southeastern side of the Tibetan Plateau, cause more severe floods and landslides. Thermal anomalies over the Tibetan Plateau can affect extreme precipitation events in this area via favoring ascending motion (Li et al., 2020). However, high precipitation is closely related to the topography. The contribution of topography to extreme precipitation requires further investigation (Shi et al., 2008). Moreover, Wang et al. (2008) reported that the surface temperatures on the Tibetan Plateau increased more than 1.8°C during the past 50 years, which deformed the WPSH and adjusted SAH. Our study also found the influence of the SAH on extreme precipitation in WC. Previous research also emphasized that more extreme precipitation occurs in WC, followed by eastward-extended SAH (Chen et al., 2019; Nie and Sun, 2021; Ma et al., 2022). However, the links between these mechanisms require further in-depth studies. In addition, increasing western Pacific SST via the WPSH has influenced the Mei-Yu Belt and extreme precipitation in China (Qian and Shi, 2017; Chen et al., 2018). Zhu et al. (2020) reported that the Gill-type response to diabatic cooling in the Pacific Ocean could adjust two barotropic Rossby-wave trains, which may influence precipitation in the WC.
The 2020/22 anomalous La Niña event led to a super Mei-Yu event in 2020. The specific influencing mechanism needs further investigation to determine whether SST warming anomalies over the western Pacific Ocean are enriched and related to La Niña influencing extreme precipitation in the WC (Ren et al., 2016; Qiao et al., 2021). In addition, the influence of global warming on extreme precipitation in WC requires further investigation.
The original contributions presented in the study are included in the article/Supplementary Material, further inquiries can be directed to the corresponding authors.
QM and PY conceived of the presented idea. QM, FJ, and YG developed the theory and performed the computations. PY and SS verified the analytical methods. QM, GF, and PY encouraged to investigate and supervised the findings of this work. All authors contributed to the article and approved the submitted version.
This work was supported by the National Natural Science Foundation of China (Grant 42205050 and 42205023) and the Joint Research Project for Meteorological Capacity Improvement (Grant 22NLTSZ003).
The station observed dataset is provided by the National Meteorological Information Center (NMIC), China. We sincerely thank reviewers for their insightful comments and useful suggestions.
The authors declare that the research was conducted in the absence of any commercial or financial relationships that could be construed as a potential conflict of interest.
All claims expressed in this article are solely those of the authors and do not necessarily represent those of their affiliated organizations, or those of the publisher, the editors and the reviewers. Any product that may be evaluated in this article, or claim that may be made by its manufacturer, is not guaranteed or endorsed by the publisher.
Aihaiti, A., Jiang, Z., Zhu, L., Li, Z., and You, Q. (2021). Risk changes of compound temperature and precipitation extremes in China under 1.5°C and 2°C global warming. Atmos. Res. 838.
Bai, H., and Dong, W. (2004). Climate features and formation causes of autumn rain over southwest China. Plateau Meteorol. 23 (6), 884–889. (in Chinese).
Bell, B., Hersbach, H., Simmons, A., Berrisford, P., Dahlgren, P., Horányi, A., et al. (2021). The ERA5 global reanalysis: Preliminary extension to 1950. Q. J. R. Meteorol. Soc. 147 (741), 4186–4227. doi:10.1002/qj.4174
Chen, D., Zhou, C., and Deng, M. (2016). Characteristics of water vapor content in southwest China and its association with the South Asia High in summer. J. Appl. Meteorol. Climatol. 27 (4), 473–479. (in Chinese).
Chen, J., Wang, X., Zhou, W., Wang, C., Xie, Q., Li, G., et al. (2018). Unusual rainfall in southern China in decaying August during extreme El Niño 2015/16: Role of the western Indian ocean and North tropical atlantic SST. J. Clim. 31 (17), 7019–7034. doi:10.1175/jcli-d-17-0827.1
Chen, Y., Zhai, P., Liao, Z., and Li, L. (2019). Persistent precipitation extremes in the Yangtze River Valley prolonged by opportune configuration among atmospheric teleconnections. Q. J. R. Meteorol. Soc. 145 (723), 2603–2626. doi:10.1002/qj.3581
Ding, Y., and Chan, J. C. L. (2005). The East asian summer monsoon: An overview. Meteorol. Atmos. Phys. 89, 117–142. doi:10.1007/s00703-005-0125-z
Ding, Y., Wang, Z., and Sun, Y. (2010). Inter-decadal variation of the summer precipitation in East China and its association with decreasing Asian summer monsoon. Part I: Observed evidences. Int. J. Climatol. 28 (9), 1139–1161. doi:10.1002/joc.1615
Eischeid, J. K., Pasteris, P. A., Diaz, H. F., Plantico, M. S., and Lott, N. J. (2000). Creating a serially complete, national daily time series of temperature and precipitation for the Western United States. J. Appl. Meteor. 39 (9), 1580–1591. doi:10.1175/1520-0450(2000)039<1580:cascnd>2.0.co;2
Fan, X., Tang, J., Tian, S., and Jiang, Y. (2020). Rainfall-induced rapid and long-runout catastrophic landslide on July 23, 2019 in Shuicheng, Guizhou, China. Landslides 17, 2161–2171. doi:10.1007/s10346-020-01454-y
Gao, T., Wang, H., and Zhou, T. (2017). Changes of extreme precipitation and nonlinear influence of climate variables over monsoon region in China. Atmos. Res. 197, 379–389. doi:10.1016/j.atmosres.2017.07.017
Hartfield, G., Blunden, J., and Arndt, D. S. (2018). A Look at 2017 takeaway points from the state of the climate supplement. Bull. Amer. Meteor. Soc. 99 (8), 1527–1539. doi:10.1175/bams-d-18-0173.1
He, J., Ju, J., Wen, Z., Lv, J., and Jin, Q. (2007). A review of recent advances in research on Asian monsoon in China. Adv. Atmos. Sci. 24 (6), 972–992. doi:10.1007/s00376-007-0972-2
Herzschuh, U., Cao, X., Laepple, T., Dallmeyer, A., Telford, R. J., and Ni, J. (2019). Position and orientation of the westerly jet determined Holocene rainfall patterns in China. Nat. Commun. 10, 2376.
Huo, F., Jiang, Z., and Liu, Z. (2014). Impacts of late spring Tibetan Plateau snow cover on early autumn precipitation. Chin. J. Atmos. Sci. 38 (2), 352–362. (in Chinese).
Li, L., Zhang, R., Wu, P., Wen, M., and Duan, J. (2020). Roles of Tibetan Plateau vortices in the heavy rainfall over southwestern China in early July 2018. Atmos. Res. 245, 105059. doi:10.1016/j.atmosres.2020.105059
Lorenz, E. N. (1956). “Empirical orthogonal functions and statistical weather prediction,” in Sci. Rep. No. 1, statist. Forecasting proj (Dept. Meteor, MIT), 49.
Ma, Q., Jia, F., Wu, X., Chang, Y., Zhi, R., and Feng, G. (2022). Characteristics and related mechanisms of the persistent extreme precipitation in August 2020 over Western China. Front. Earth Sci. 10, 1–13.
Nie, Y., and Sun, J. (2021). Synoptic-scale circulation precursors of extreme precipitation events over southwest China during the rainy season. J. Geophys. Res. Atmos. 126 (13), e2021JD035134. doi:10.1029/2021jd035134
Qian, C., Ye, Y., Zhang, W., and Zhou, T. (2022). Heavy rainfall event in mid-August 2020 in Southwestern China: Contribution of anthropogenic forcings and atmospheric circulation. Bull. Amer. Meteor. Soc. 103 (3), S111–S117. doi:10.1175/bams-d-21-0233.1
Qian, W., and Shi, J. (2017). Tripole precipitation pattern and SST variations linked with extreme zonal activities of the Western Pacific subtropical high. Int. J. Climatol. 37 (6), 3018–3035. doi:10.1002/joc.4897
Qiao, S., Chen, D., Wang, B., Cheung, H. N., Liu, F., Cheng, J., et al. (2021). The longest 2020 Meiyu season over the past 60 years: Subseasonal perspective and its predictions. Geophys. Res. Lett. 48 (9), e2021GL093596. doi:10.1029/2021gl093596
Rayner, N. A., Parker, D. E., Horton, E. B., Folland, C. K., Alexander, L. V., Rowell, D. P., et al. (2003). Global analyses of sea surface temperature, sea ice, and night marine air temperature since the late nineteenth century. J. Geophys. Res. Atmos. 108 (D14), 4407. doi:10.1029/2002jd002670
Ren, R., Sun, S., Yang, Y., and Li, Q. (2016). Summer SST anomalies in the Indian Ocean and the seasonal timing of ENSO decay phase. Clim. Dyn. 47 (5), 1827–1844. doi:10.1007/s00382-015-2935-0
Sardeshmukh, P. D., and Hoskins, B. J. (1988). The generation of global rotational flow by steady idealized tropical divergence. J. Atmos. Sci. 45 (7), 1228–1251. doi:10.1175/1520-0469(1988)045<1228:tgogrf>2.0.co;2
Shi, X., Wang, Y., and Xu, X. (2008). Effect of mesoscale topography over the Tibetan plateau on summer precipitation in China: A regional model study. Geophys. Res. Lett. 35 (19), L19707. doi:10.1029/2008gl034740
Shi, Y., Jiang, Z., Liu, Z., and Li, L. (2020). A Lagrangian analysis of water vapor sources and pathways for precipitation in East China in different stages of the East Asian summer monsoon. J. Clim. 33 (3), 977–992. doi:10.1175/jcli-d-19-0089.1
Sun, L., Shen, B., Sui, B., and Huang, B. (2017). The influences of East Asian monsoon on summer precipitation in northeast China. Clim. Dyn. 48 (5), 1647–1659. doi:10.1007/s00382-016-3165-9
Takaya, K., and Nakamura, H. (2001). A formulation of a phase-independent wave-activity flux for stationary and migratory quasigeostrophic eddies on a zonally varying basic flow. J. Atmos. Sci. 58 (6), 608–627. doi:10.1175/1520-0469(2001)058<0608:afoapi>2.0.co;2
Trenberth, K. E. (1991). Climate diagnostics from global analyses: Conservation of mass in ECMWF analyses. J. Clim. 4 (7), 707–722. doi:10.1175/1520-0442(1991)004<0707:cdfgac>2.0.co;2
Ullah, W., Zhu, C., Wang, G., Hagan, D. F. T., Luo, D., Wei, J., et al. (2023). Soil moisture-constrained East Asian Monsoon meridional patterns over China from observations. npj Clim. Atmos. Sci. 6, 4–11. doi:10.1038/s41612-023-00331-4
Wang, B., Bao, Q., Hoskins, B., Wu, G., and Liu, Y. (2008). Tibetan Plateau warming and precipitation changes in East Asia. Geophys. Res. Lett. 35 (14), L14702. doi:10.1029/2008gl034330
Wang, L., Chen, W., Zhou, W., and Huang, G. (2015). Teleconnected influence of tropical Northwest Pacific sea surface temperature on interannual variability of autumn precipitation in Southwest China. Clim. Dyn. 45 (9), 2527–2539. doi:10.1007/s00382-015-2490-8
Wang, Z., and Ding, Y. (2008). Climatic characteristics of rainy seasons in China. Chin. J. Atmos. Sci. 32 (1), 1–13. (in Chinese).
Wang, Z., and Zhou, B. (2019). Observed decadal transition in trend of autumn rainfall over central China in the late 1990s. J. Clim. 32 (5), 1395–1409. doi:10.1175/jcli-d-18-0112.1
Wei, T., He, S., Yan, Q., Dong, W., and Wen, X. (2018a). Decadal shift in West China autumn precipitation and its association with sea surface temperature. J. Geophys. Res. Atmos. 123 (2), 835–847. doi:10.1002/2017jd027092
Wei, T., Song, W., Dong, w., Ke, Z., Sun, L., and Wen, X. (2018b). A skilful prediction scheme for West China autumn precipitation. Theor. Appl. Climatol. 135 (1), 183–192. doi:10.1007/s00704-017-2363-7
Xu, H., Chen, H., and Wang, H. (2021). Interannual variation in summer extreme precipitation over Southwestern China and the possible associated mechanisms. Int. J. Climatol. 41 (6), 3425–3438.
Xu, K., Zhu, C., and Wang, W. (2016). The cooperative impacts of the El Niño–Southern Oscillation and the Indian Ocean Dipole on the interannual variability of autumn rainfall in China. Int. J. Climatol. 36 (4), 1987–1999. doi:10.1002/joc.4475
Yang, Q., Ma, Z., Wu, P., Klingaman, N. P., and Zhang, L. (2019). Interdecadal seesaw of precipitation variability between North China and the southwest United States. J. Clim. 32 (10), 2951–2968. doi:10.1175/jcli-d-18-0082.1
Yasui, S., and Watanabe, M. (2010). Forcing processes of the summertime circumglobal teleconnection pattern in a dry AGCM. J. Clim. 23 (8), 2093–2114. doi:10.1175/2009jcli3323.1
Yokoyama, C., Takayabu, Y. N., and Horinouchi, T. (2017). Precipitation characteristics over East Asia in early summer: Effects of the subtropical jet and lower-tropospheric convective instability. J. Clim. 30 (20), 8127–8147. doi:10.1175/jcli-d-16-0724.1
Yuan, C., and Yang, M. (2020). Interannual variations in summer precipitation in southwest China: Anomalies in moisture transport and the role of the tropical atlantic. J. Clim. 33 (14), 5993–6007. doi:10.1175/jcli-d-19-0809.1
Yuan, X., and Liu, X. (2013). Onset-withdrawal dates of autumn persistent rains over West China and the associated autumn to winter evolution of the atmospheric circulation. Acta Meteor. Sin. 71 (5), 913–924. (in Chinese).
Zhai, P., Zhang, X., Hui, W., and Pan, X. (2005). Trends in total precipitation and frequency of daily precipitation extremes over China. J. Clim. 18 (7), 1096–1108. doi:10.1175/jcli-3318.1
Zhang, C., Wang, Z., Zhou, B., Li, Y., Tang, H., and Xiang, B. (2019). Trends in autumn rain of West China from 1961 to 2014. Theor. Appl. Climatol. 135 (1), 533–544. doi:10.1007/s00704-017-2361-9
Zhou, B., Wu, J., Xu, Y., Han, Z., and Shi, Y. (2019a). Projected changes in autumn rainfall over West China: Results from an ensemble of dynamical downscaling simulations. Int. J. Climatol. 39 (12), 4869–4882. doi:10.1002/joc.6115
Zhou, B., Xu, M., Sun, B., Han, T., and Cheng, Z. (2021). Possible role of Southern Hemispheric sea ice in the variability of West China autumn rain. Atmos. Res. 249, 105329. doi:10.1016/j.atmosres.2020.105329
Zhou, J., Zhao, J., and Zhi, R. (2019b). Possible causes of the anomalous characteristics of autumn rain in Western China in 2017. Theor. Appl. Climatol. 138 (1), 1109–1123. doi:10.1007/s00704-019-02876-y
Zhu, Y., and Yu, R. (2003). Interannual variation of summer precipitation in the west of Sichuan Basin and its relationship with large-scale circulation. Chin. J. Atmos. Sci. 27 (6), 1048–1056. (in Chinese).
Keywords: extreme precipitation, West China, West Pacific SST, South Asian High, western Pacific subtropical high
Citation: Ma Q, Lei H, Jia F, Sun S, Yan P, Gu Y and Feng G (2023) Interannual variability of extreme precipitation in late summer over west China during 1961–2021. Front. Environ. Sci. 11:1185776. doi: 10.3389/fenvs.2023.1185776
Received: 14 March 2023; Accepted: 30 March 2023;
Published: 07 April 2023.
Edited by:
Hainan Gong, Institute of Atmospheric Physics (CAS), ChinaReviewed by:
Zhiwei Zhu, Nanjing University of Information Science and Technology, ChinaCopyright © 2023 Ma, Lei, Jia, Sun, Yan, Gu and Feng. This is an open-access article distributed under the terms of the Creative Commons Attribution License (CC BY). The use, distribution or reproduction in other forums is permitted, provided the original author(s) and the copyright owner(s) are credited and that the original publication in this journal is cited, in accordance with accepted academic practice. No use, distribution or reproduction is permitted which does not comply with these terms.
*Correspondence: Pengcheng Yan, eWFucGNAaWFtY21hLmNu
Disclaimer: All claims expressed in this article are solely those of the authors and do not necessarily represent those of their affiliated organizations, or those of the publisher, the editors and the reviewers. Any product that may be evaluated in this article or claim that may be made by its manufacturer is not guaranteed or endorsed by the publisher.
Research integrity at Frontiers
Learn more about the work of our research integrity team to safeguard the quality of each article we publish.