 Huading Lou
- Key Laboratory of Urban and Architectural Heritage Conservation of Ministry of Education, School of Architecture, Southeast University, Nanjing, China
Although air filter towers are commonly used to improve air quality in urban areas, their operation often produces significant noise levels, and their noise impact is unknown. In this research paper, a case study on the noise impacts of an outdoor air filter tower in city open areas and on building façades is conducted by noise mapping. Noise levels around the filter tower were first measured in situ, and a prediction model for noise mapping was built and well-calibrated by comparing the predicted and measured results. Noise mapping was then carried out to investigate noise exposure in city open areas and on façades in four typical urban blocks with different morphology. Simulated results highlight noise level improvement with the increase of façade height at some high-rise buildings whose heights are higher than the neighboring ones. In addition, urban morphology, including building height and density, as well as the distance between the source and the building, has an impact on noise exposure. The utilization of sound-absorbing building envelopes has been identified as an effective means of reducing noise on building façades, with a maximum attenuation of approximately 4 dB(A) observed, but the effectiveness of this method is limited at certain positions. This study provides valuable insights into the impact of filter towers on noise levels and offers suggestions for urban sound planning.
1 Introduction
Noise is an important public issue and is recognized as an environmental pollution source. Noise evaluations and mapping (Licitra et al., 2022) are needed for the well-being of citizens or workers exposed to high noise levels. Noise prevention plays a vital role in avoiding noise levels that lead to complaints (Gaetano et al., 2019; Lou and Ou, 2019; Tong and Kang, 2021) and health effects, such as sleep disorders with awakenings (Erickson and Newman, 2017; Minichilli et al., 2018), hypertension ischemic heart disease (Bluhm et al., 2007; Dratva et al., 2012; Van Kempen and Babisch, 2012), diastolic blood pressure (Lee et al., 2019; Petri et al., 2021), decreased working performance (Horr et al., 2016; Rossi et al., 2018; Vukić et al., 2021), and annoyance (Miedema and Oudshoorn, 2001). It is a growing concern among both the general public and policymakers all over the world. In response to this concern, various organizations (ISO, 1987; World Health Organization, 2018) and national governments (BS, 1991; ASTM E, 2003; GB, 2008) have developed guidelines and recommendations for noise exposure to safeguard public health and welfare by providing measures to mitigate the impact of noise pollution.
Large cities are confronted with substantial challenges arising from noise pollution generated by human activities. Nevertheless, long-term noise monitoring in these urban environments presents a financial burden for administrations. Consequently, a paradigm shift has occurred in urban area management, leveraging the information and communication technology revolution and giving rise to the concept of smart cities. In line with the evolution toward smart cities, new technologies (Jezdovic et al., 2021; Renaud et al., 2023) have been developed to provide smart noise solutions and address the cost concerns associated with measurement instruments (asdrubali and D’alessandro, 2018). One such technology is the Internet of Things technology within smart cities, through the design and development of wireless acoustic sensor networks (WASNs) (Liu et al., 2020). Low-cost, high-capacity sensors have started being used to monitor specific noise sources in urban environments (Alías and Alsina-Pagès, 2019). For instance, a digital signal processor based on an acoustic sensor was designed by López et al. (2020) for outdoor noise monitoring in smart cities. In addition, intelligent transportation systems (ITSs) can also be utilized to monitor noise levels based on traffic flow detection using camera images and machine learning methods (Fredianelli et al., 2022a). The instrumentation and methodology could be integrated with the existing ITS for traffic control to design an integrated method, which could also provide updated data over time for noise maps and action plans.
Noise monitoring, noise mapping, and noise modeling are widely utilized to investigate noise impact. Researchers have used noise monitoring data for the development of noise maps, which gives a clear picture of the noise level around the source. Predicting the noise level by noise modeling is always necessary for taking decisions regarding the noise level for any development project (Alam et al., 2020). It has been observed that 90% of the studies on noise evaluation are focused on traffic noise, such as road traffic ( Cueto et al., 2017; Fredianelli et al., 2022b; Ruiz-Padillo et al., 2016), railway traffic (Bunn and Zannin, 2016), airport (Iglesias-Merchan et al., 2015), and port activities (Nastasi et al., 2020; Fredianelli et al., 2022b), while the remaining 10% focused on residential, commercial, and industrial areas (Alam et al., 2020). For instance, a case study (Paiva et al., 2019) found that noise levels at measured points exceeded the critical level of 55 dB(A) and demonstrated the associations between living in areas exposed to road traffic noise and feeling annoyed with the noise. Another field study (Alam et al., 2021) investigated traffic noise near major roads passing through densely populated residential areas, and monitoring results showed non-compliance with regulatory standards for daytime and nighttime noise. Xie et al. (2016) also found that both the outdoor and indoor acoustic environment of residential areas along light rapid transit lines largely exceeded the national standards by up to 15 dB(A). Bunn and Zannin (2016) pointed out that the simulated noise mitigation measures, such as the exclusion of trains’ horns, the inclusion of acoustic barriers, and the removal of railway tracks from the urban perimeter, could lead to a reduction of 2–12 dB(A) in railway noise levels reaching the façades of hospitals and schools. For air traffic noise, it was found that sound pressure levels increased by approximately 8 dB(A) from natural ambient levels, but public opinion did not perceive aircraft noise disruption as being relevant as that quantified by technical procedures (Iglesias-Merchan et al., 2015). In addition, Nastasi et al. (2020) measured the noise emissions of moving ships and built a multiple regression analysis to understand the influence of parameters, such as minimum distance, speed, and draught, on ships’ noise emissions. Studies have also examined the impact of various types of environmental noise, including residential noise (Akhtar et al., 2016), commercial noise (Akhtar et al., 2016), and wind turbine noise (Qu and Kang, 2017).
The literature review reveals the noise problem as an important public issue. Traffic noise is the most commonly recognized environmental noise concern, while other sources, such as commercial noise, wind turbine noise, and leisure noise, are also being increasingly acknowledged. It is also demonstrated that different types of noise can have varying effects on noise levels (Hao et al., 2015; Qu and Kang, 2017), and the results obtained regarding noise impact may be influenced by source types, including the height of the source, sound power level, and spectrum. An air filter tower is a kind of facility for mitigating outdoor pollutant concentrations and increasing wind ventilation by fan blowers, and it is, thus, widely utilized in urban areas (Tan et al., 2017; Bachler et al., 2021). Air pollution in high-density megacities has a higher impact on public health than in cities of lower population density (Kunzli et al., 2000). Bulky building blocks, compacted urban volumes, and very limited open spaces seriously block pollutant dispersion in deep street canyons (Hang et al., 2012). Nevertheless, the generation of high-level noise, both mechanical and aerodynamic, during the operation of air filter towers inevitably has a negative impact on the urban soundscape. However, published studies (Tan et al., 2017; Bachler et al., 2021) have primarily focused on the effectiveness of air filter towers in reducing urban pollutant concentrations. It is interesting to examine their impact on noise levels and to investigate noise distributions of air filter towers in urban environments.
Therefore, this study aimed to evaluate and understand the noise impacts of an outdoor air filter tower in city open areas and on building façades by noise mapping. Specifically, noise levels around the filter tower were first measured in situ, and a prediction model for noise mapping was built and well-calibrated by comparing the predicted and measured noise levels. Noise mapping was then carried out to investigate noise exposure in city open areas and on building façades in four typical urban blocks with different morphology. In addition, the effects of sound-absorbing building envelopes on noise reduction were also discussed.
2 Methodology
2.1 Site selection
In this study, the noise impact of an outdoor air filter tower was investigated at four common sample sites, as shown in Figure 1. The sample sites were selected based on their position in relation to neighboring buildings, also taking into account the location of the air filter tower (indicated by the solid dot at the intersection of the x-axis and y-axis). Each of the four sample sites was selected to represent a different scenario for the placement of the air filter tower. Site A was situated in an open area with low building density, resulting in a sound field that closely approximated a semi-free field. In contrast, site B featured the air filter tower placed in front of a row of buildings, simulating a single vertical reflection boundary near the source in outdoor space. Sites C and D were selected to represent scenarios with four and two vertical reflection boundaries, respectively, in order to capture a range of potential noise propagation patterns. In addition, sites A and B were selected from residential areas with a range of multi-story and high-rise residential buildings of varying forms. Site C was situated in a mixed-use area featuring a combination of single-story factories and multi-story office buildings, while site D was located in a commercial area characterized by high building density and deep street canyons. A grid of 250 × 250 m was created for each site, with consideration given to both computational efficiency and the potential impact of filter tower noise.
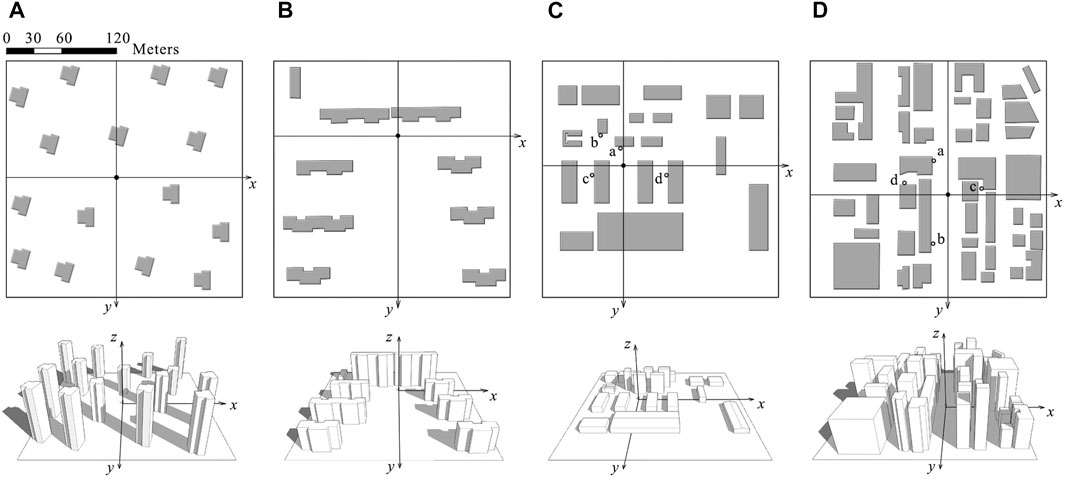
FIGURE 1. Plans and 3D models of the four selected sites with different urban forms, each with 250 m × 250 m, where buildings are in gray and open areas are in white. The solid dot at the intersection of the x-axis and y-axis represents the air filter tower; the capital letters, (A–D), are the number of the corresponding sites; the hollow circles in sites C and D are some typical calculation positions in noise mapping in Section 3.5.
As shown in Figure 2, the outdoor air filter tower in this study is of a pentagonal prism with a height of 5.35 m, and each side of the pentagonal plane is 1.1 m in length. The air flows through the inlet to be purified in the filter chamber, and the purified air, driven by fan blowers, flows through the circular outlet toward urban areas. High-level noise, emitting from the fan blower chamber, propagates toward the surrounding environment.

FIGURE 2. Photograph of the outdoor air filter tower used in this study.
2.2 Measurement of the air filter tower noise
Noise measurement aims to verify the acoustic parameters and reliability of the prediction model of the outdoor air filter tower by comparing the predicted noise levels and the measured ones. As shown in Figure 3, the air filter tower was positioned on an outdoor flat, hard ground between two buildings, 220 m away from the vehicle road, and operated at its maximum fan blade speed of 1780 r/min. To ensure that the noise levels were solely produced by the air filter tower and not by other sources (mainly traffic noise), noise measurements were conducted after rush hour at approximately 18:00. Measurements were conducted at two different heights (1.2 m and 6 m) above the ground, and six microphone positions were evenly arranged at each height in a semicircular pattern, 5 m away from the exterior wall of the air filter tower, to obtain the sound power level of the air filter tower noise (ISO, 2010). A portable sound level meter (type 01 dB Fusion, Acoem, France) was utilized to record sound pressure levels (SPLs) at 1/3 octave bands and A-weighted equivalent SPLs (LA,eq). A recording time of 20 min was chosen for each microphone position to ensure accuracy and consistency in the measurements. In addition, immediately after the noise of the filter tower was measured, the background noise was also recorded at each microphone position over the same measurement time interval.
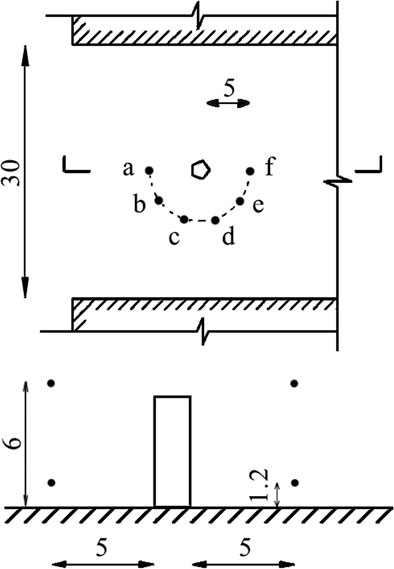
FIGURE 3. Schematic diagrams of noise measurements of the filter tower (unit: m).
2.3 Simulation of the air filter tower noise
To investigate noise exposure and impacts of the filter tower on the sample sites, an acoustic prediction model was built for noise mapping with a commonly used noise mapping package: Raynoise 3.0 by LMS International. It uses advanced beam tracing methods to predict the sound field produced by sources at any locations in closed, open, or partially open spaces (Bistafa and Bradley, 2001; Gerges and Gomes, 2001; Huang et al., 2012). The 3D virtual model of each site was first built in AutoCAD, and then it was imported to Raynoise. As shown in Figure 1, the ground was situated in the x–y plane (z = 0), and the center of the bottom of the air filter tower was located at the origin of three axes. The filter tower noise was modeled as the point source, and the sound power level of the source was calculated (ISO 3744: 2010, 2010) based on the measured noise levels on the microphone positions and is given in Table 1. Three-point sources were positioned at the geometric center of the fan chamber, 4.8 m above the ground. Background noise, in accordance with the measured values, was also considered in noise mapping and is given in Table 1. In addition, ground and building envelope surfaces were considered acoustic boundaries with specific sound-absorption coefficients. The sound-absorbing properties of the materials of the prediction model, which were initially set in accordance with the values in Raynoise and the literature (Vorländer, 2008; Cox and D’Antonio, 2004), were adjusted to decrease the differences between the predicted SPLs by noise mapping and measurement at microphone positions. The final absorption coefficients of different materials used in noise mapping are listed in Table 2. In addition, the effects of sound diffraction on building edges were also considered. The air temperature was set to 25°C and relative humidity to 60% for atmospheric absorption. The number of rays was 4,000 and the reflection order was set as 5.
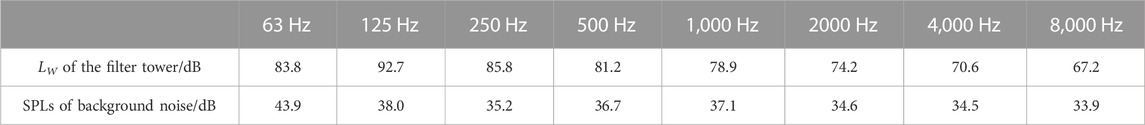
TABLE 1. Sound power level (LW) of the filter tower and sound pressure levels (SPLs) of background noise used in noise mapping.
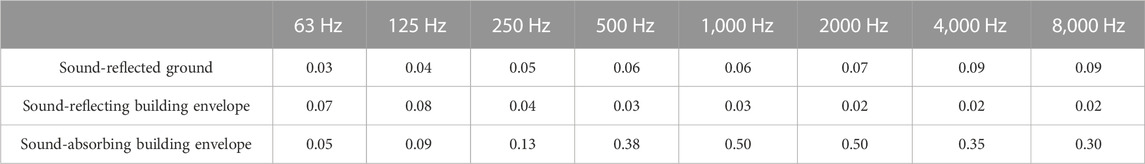
TABLE 2. Sound-absorption coefficients of the acoustic boundaries in noise mapping.
3 Results and discussion
3.1 Validations on the prediction model for noise mapping
To verify the acoustic parameters and reliability of the prediction model of the filter tower noise, comparisons of noise levels between the measured and predicted values at different heights are shown in Figure 4 and Table 3, where the noise levels in Figure 4 are the average values at microphone positions of the given height. It can be seen that, in Figure 4, measured noise levels at the height of 6.0 m were higher than the results at 1.2 m since the fan blower chamber was located around 5 m above the ground. For each measurement height, a difference of approximately 4 dB at the frequency range of 63–500 Hz between the measured and predicted results was found, and the difference was up to 5 dB over 1,000 Hz. However, predicted noise spectra were equal to those obtained by measurement. In Table 3, smaller differences for LA,eq within 2.2 dB (A) are observed. It should be mentioned that LA,eq was utilized to describe the noise levels of the air filter tower in the present work, and minor errors, thus, exist when investigating noise exposure in open areas in Figure 5 and Figure 7, but there was no influence of the uncertainty of the prediction model on noise reduction.
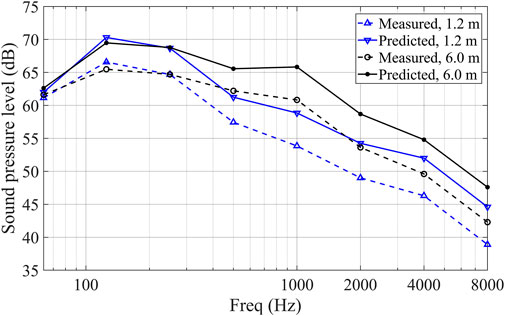
FIGURE 4. Measured and predicted SPLs at different measurement heights above the ground, 5 m away from the exterior wall of the air filter tower.
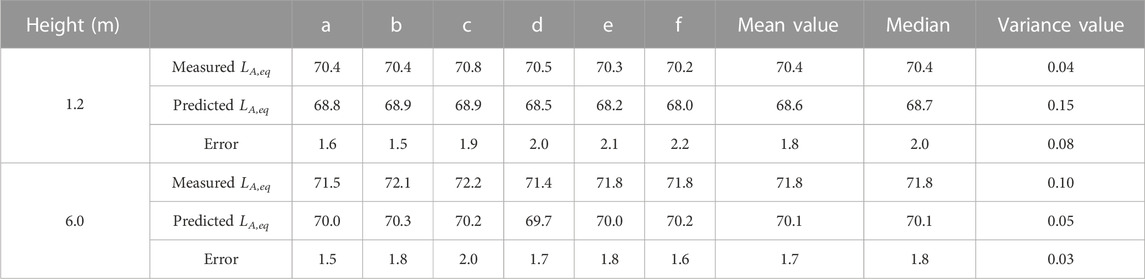
TABLE 3. Measured and predicted A-weighted equivalent SPLs (LA,eq) at 12 microphone positions (unit: dB(A)).
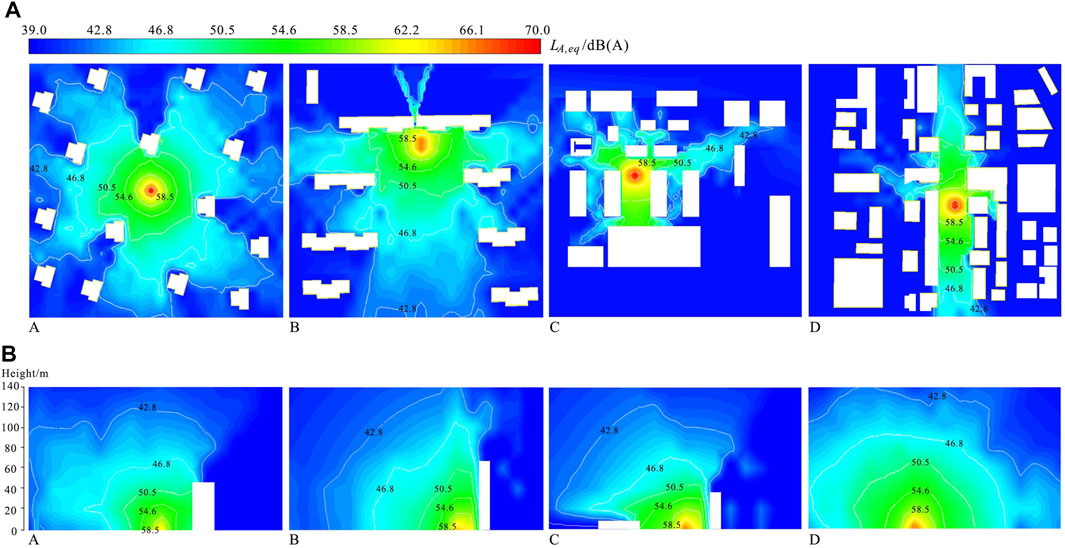
FIGURE 5. Noise exposure maps (A) on the horizontal plane (1.2 m above the ground) and (B) on the vertical plane in the four sample sites.
3.2 Noise exposure in open areas
Noise exposure in open areas with sound-reflecting building envelopes, 1.2 m above the ground, of the four sample sites by noise mapping is presented in Figure 5A. Noise maps vertically along the y-direction (x = 0) are also illustrated in Figure 5B. It can be seen that open areas and building façades were impacted by the air filter noise. For instance, in site A, noise levels on building façades were lower than the recommended values in residential areas during daytime (55 dB(A) in ASTM E 1686-03 and GB 3096-2008), while noise levels on some building façades impacted by direct sound of the filter tower exceeded the limit at night (45 dB(A) in GB 3096-2008). High noise levels larger than 55 dB(A) were also found on those building façades impacted by the direct sound in site B, which exceeded the limits in residential areas both during daytime and at night (50 dB(A) in the nighttime in ASTM E 1686-03 and 45 dB(A) in the nighttime in GB 3096-2008). In sites C and D, noise levels on building façades close to the air filter tower also exceeded the limits in commercial areas at night (50 dB(A)) in GB 3096-2008. It is worth noting that the comparisons between the noise levels generated by the air filter tower and the recommendations provided by the World Health Organization (World Health Organization, 2018) were not discussed in this study. This is because the noise criteria outlined by the WHO primarily focus on transportation noise, wind turbine noise, and leisure noise rather than specific noise sources such as air filter towers.
Strong reflection against the surfaces of buildings was clearly observed due to the low absorption performance of the façades, leading to higher noise levels in open areas. However, noise levels on buildings that were insulated by others decreased dramatically, achieving the creation of shadow zones with lower noise levels around buildings. These observations highlight the significant impact of buildings on noise resistance, as evidenced by the limited impact areas in the street canyon of site D. The resisting effect of buildings was also observed in other published studies on wind turbine noise (Qu and Kang, 2017) and traffic noise (Hao et al., 2015). The resisting effects of built environment morphology can create large variances among noise exposures at different buildings (Qu and Kang, 2014). This is because noise propagation in a densely built area is affected by the acoustical effect of absorbing, reflecting, and shielding from buildings, which promotes the creation of protected areas or shadow areas in an urban context (Oliveira and Silva, 2011). Furthermore, the present study also observed varying effects of urban form on noise resistance and exposure in open areas across the selected study sites, and it is interesting to further investigate quantitative correlations between noise exposure and urban form to enable more accurate predictions, analyses, and prevention of noise pollution through the efficient design of urban planning.
3.3 Noise attenuation in open areas
This section investigates the noise attenuation of the filter tower in open areas when considering the impact of sound-reflecting building envelopes. As shown in Figure 6A, the relative attenuation of noise levels (LA,eq) at different distances from the filter tower along the horizontal direction (parallel to the y-axis) and vertical direction (parallel to the z-axis) was calculated for the four selected sample sites. It should be mentioned that the relative attenuation observed in this study was the difference between the noise level at a given point and the A-weighted sound power level of the source (89.5 dB(A)). As seen in Figure 6A, similar attenuation among the four sites was found within the horizontal distance of 10 m to the filter tower, and the differences became larger with the increase in the distance. The highest levels of noise reduction were observed in site A, followed by sites B, D, and C. This can be attributed to the fact that the filter tower in site A was situated in a more open space with lower building density and less reflection, resulting in rapid decay of sound energy over an essentially free field and a reflecting plane.
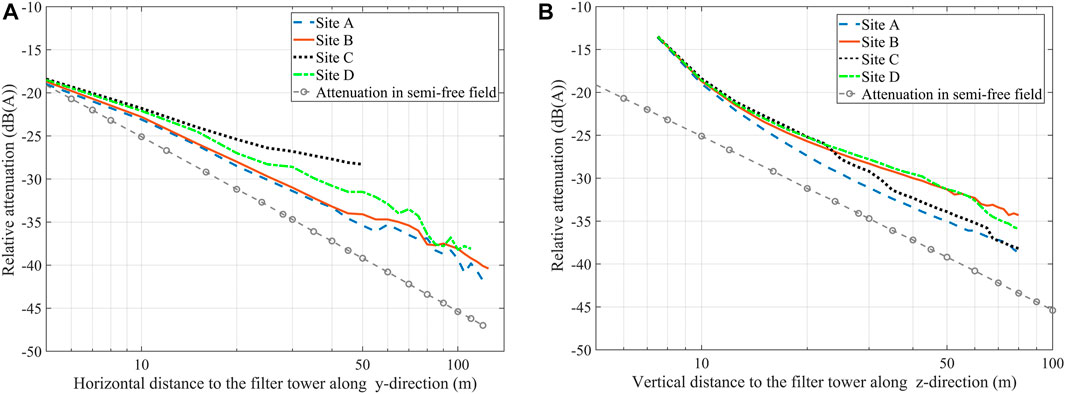
FIGURE 6. Relative attenuation of the noise level in open areas with different distances to the filter tower (A) along the y-direction (x = 0, z = 1.2 m) and (B) z-direction (x = 0, y = 0) in the four sample sites with sound-reflecting building envelopes. The relative attenuation is the difference between the noise level at a given point and the A-weighted sound power level of the source (89.5 dB(A)), and a larger absolute value of the relative attenuation means a stronger reduction of the filter tower noise.
Analysis of the attenuation on the vertical direction in Figure 6B reveals that site A experienced the highest levels of noise reduction within the vertical distance range of 7.5 m–22.5 m, followed by sites B, D, and C. These results are consistent with those obtained for the horizontal direction in Figure 6A. In addition, the attenuation rate in site C from a height of 22.5 m was higher than that observed in both sites B and D. It can be seen in Figure 1 that the filter tower was very close to the neighboring high-rise buildings in sites B and D, leading to strong reflection against building façades and low sound energy attenuation. In addition, noise reduction in open areas in the four sample sites was lower than the attenuation in semi-free fields due to the reflection against building surfaces.
3.4 Noise exposure on building façades
To evaluate the noise exposure on building façades, LA,eq on façades with sound-reflected building envelopes at different heights were first calculated by noise mapping, and the arithmetic averaged value and maximum value at each height were then obtained as shown in Figures 7A, B, respectively. As seen in Figure 7A, there was a slight increase in noise level from the height of 1.2 m–5.0 m since the fan blower chamber was located approximately 5 m above the ground. Site C showed the highest value of averaged noise levels below the height of 30 m among the four sample sites due to the strong reflection on the surrounding buildings around the filter tower, while the lowest noise level was found in site D due to the effects of buildings on noise resistance. A sharp increase in noise levels was observed at sites C and B. Interestingly, it was observed that the average noise levels on façades in site B slightly increased with height, which was in contrast to the results obtained in other cases. Observation of Figure 1 reveals that the buildings situated along the negative direction of the y-axis were much higher than those in other directions in sites B and C. Additionally, the distance between the filter tower and the impacted façade was extremely small, with no insulation during sound propagation. These factors contributed to the observed improvement in average noise levels on higher façades. Although a similar condition (high-rise building and slight distance between the filter tower and impacted façade) was also found in site D, high building density and significant effects of buildings on noise resistance reduced the averaged noise levels.
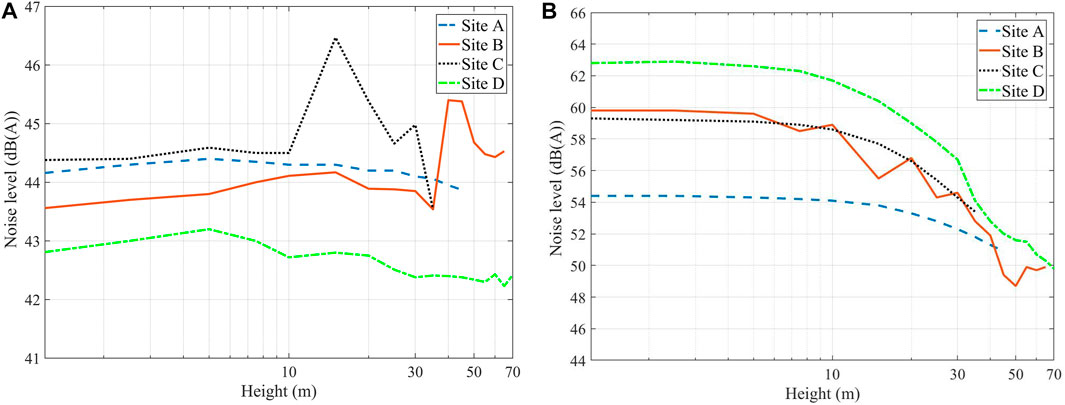
FIGURE 7. (A) Averaged and (B) maximum noise levels at different heights on façades with sound-reflecting building envelopes in the four sample sites.
However, the maximum noise level distribution on façades at different heights in Figure 7B is quite different from the results in Figure 7A. Site A was found to be the quietest, while site D exhibited the highest noise levels at the calculated heights, with a maximum noise level of 63.0 dB(A) at a height of 2.5 m. This study highlighted the issue of noise pollution in street canyons occupied by high-rise buildings with high density, as demonstrated by the results obtained for site D. In addition, the noise level improvement with increasing height on façades of high-rise buildings is shown in Figure 7B, with a slight enhancement of the maximum noise level observed from a height of 50 m in site B.
3.5 Noise reduction on façades by sound-absorbing building envelopes
To further investigate noise reduction at typical positions (marked by hollow circles with a, b, c, and d in Figure 1) on façades at different heights in sites C and D, we compared noise levels under different absorption performances of the building envelope. Specifically, we assumed the building envelope to be sound-reflecting in the first case and moderately absorptive in the second, while maintaining the ground as sound-reflective. The absorption coefficients used in these calculations are presented in Table 2. As shown in Figure 8, using sound-absorbing building envelopes for noise reduction on façades was found to be effective in noise mapping, though it was very limited at some positions, and the effect differed according to the positions. The results showed that noise reduction at position ‘a’ in both sites was lower than at any other position, followed by positions ‘b’ and ‘c’. The highest reduction was observed at position ‘d’, with a maximum value of approximately 4 dB(A) at a height of 5 m in both sites. In addition, the effect decreased with the enhancement of façade height. As seen in Figure 1, positions ‘c’ and ‘d’ were isolated by buildings and were only impacted by the reflected sound of the filter tower. It is known that better performance of absorptive treatment for noise reduction can be achieved in spaces where reverberated sound energy is dominant in an acoustic field. It seems that decreasing the noise impact of the air filter tower by sound-absorbing building envelopes in outdoor spaces is very limited. Attenuating the sound power of the filter tower can be an efficient and significant method for noise reduction. For instance, installing a muffler on the outlet or strengthening the sound insulation of the fan chamber can help to reduce noise levels.
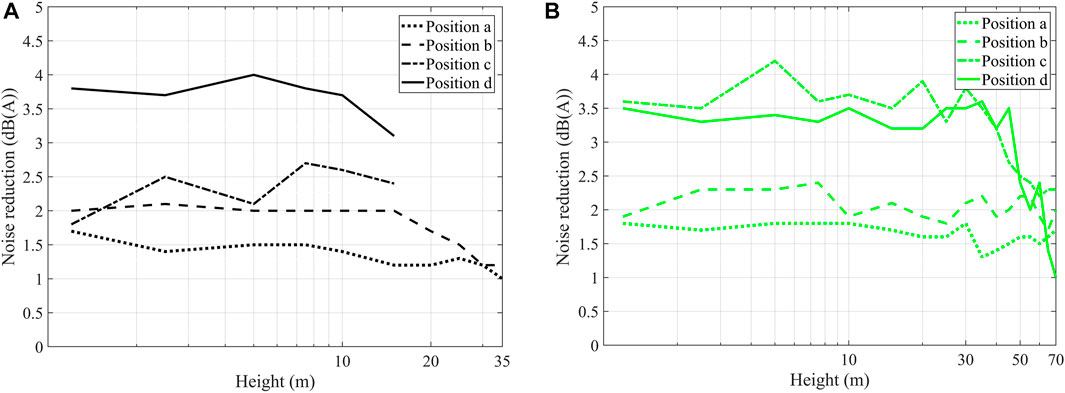
FIGURE 8. Effects of sound-absorbing building envelopes on noise reduction at some typical positions (see Figure 1 marked with a, b, c, and d) with different heights on façades in sites (A) C and (B) D.
4 Conclusion
In this study, a virtual acoustic prediction model was built and well-calibrated by comparing the predicted noise levels and the measured ones, and noise impacts of an outdoor air filter tower in city open areas and on building façades were, thus, evaluated and understood by noise mapping. The results highlighted noise level improvement with the increase of height on façades at some high-rise buildings whose heights were higher than the neighboring ones. It was also revealed that urban morphology influences the noise exposure and noise reduction of the filter tower, and the effects of buildings on noise resistance and attenuation of the averaged noise levels on façades were observed in noise mapping. Furthermore, using sound-absorbing building envelopes for noise reduction on façades, though very limited, was found to be effective.
4.1 Strengths and limitations
Study strengths: This research demonstrates several key strengths. First, it highlights the significant noise impact of the air filter tower, emphasizing how noise levels improve as the façade height increases, particularly in high-rise buildings that surpass neighboring structures. Second, it underscores the influence of urban morphology, including building height and density, as well as the distance between the noise source and buildings, on noise exposure and propagation. Finally, the study sheds light on the importance of sound-absorbing building envelopes in reducing noise levels.
Study limitations: It is important to acknowledge the limitations of this study. First, the selection of only four study sites may limit the generalizability of the findings and may not fully represent the diversity of urban blocks with varying forms. Additionally, the present work does not explore quantitative correlations between noise exposure and urban morphology, which could provide valuable insights into the noise impact of the filter tower. Further research in this area is warranted to better understand the relationship between urban morphology and noise levels and to provide meaningful suggestions for urban sound planning.
Data availability statement
The original contributions presented in the study are included in the article/Supplementary Material; further inquiries can be directed to the corresponding author.
Author contributions
HL: methodology, investigation, software, visualization, writing—original draft, writing—review and editing, and validation. NR: investigation. YZ: investigation. HM: conceptualization, methodology, investigation, supervision, funding acquisition, writing—review and editing, and project administration. All authors contributed to the article and approved the submitted version.
Funding
This work was supported by the Natural Science Foundation of China (Grant No. 51408113), the Natural Science Foundation of Jiangsu Province, China (Grant No. BK 20140632), and the Postgraduate Research and Practice Innovation Program of Jiangsu Province (Grant No. KYCX21_0111).
Conflict of interest
The authors declare that the research was conducted in the absence of any commercial or financial relationships that could be construed as a potential conflict of interest.
Publisher’s note
All claims expressed in this article are solely those of the authors and do not necessarily represent those of their affiliated organizations, or those of the publisher, the editors, and the reviewers. Any product that may be evaluated in this article, or claim that may be made by its manufacturer, is not guaranteed or endorsed by the publisher.
References
Akhtar, N., Ahmad, K., and Alam, P. (2016). Noise monitoring and mapping for some pre-selected locations of New Delhi, India. Fluct. Noise Lett. 15 (02), 1650019. doi:10.1142/s021947751650019x
Alam, P., Ahmad, K., Afsar, S., and Akhtar, N. (2020). Noise monitoring, mapping, and modelling studies-A review. J. Ecol. Eng. 21 (4), 82–93. doi:10.12911/22998993/119804
Alam, P., Ahmad, K., Khan, A. H., Khan, N. A., and Dehghani, M. H. (2021). 2D and 3D mapping of traffic induced noise near major roads passing through densely populated residential area of South Delhi, India. PloS One 16 (3), 0248939. doi:10.1371/journal.pone.0248939
Alías, F., and Alsina-Pagès, R. M. (2019). Review of wireless acoustic sensor networks for environmental noise monitoring in smart cities. J. Sens. 2019, 1–13. doi:10.1155/2019/7634860
Asdrubali, F., and D’Alessandro, F. (2018). Innovative approaches for noise management in smart cities: A review. Curr. Pollut. Rep. 4 (2), 143–153. doi:10.1007/s40726-018-0090-z
ASTM E (2003). Standard guide for selection of environmental noise measurements and criteria. West Conshohocken, Philadelphia: American Society of Testing Materials, 9.
Bachler, P., Müller, T. K., Warth, T., Yildiz, T., and Dittler, A. (2021). Impact of ambient air filters on PM concentration levels at an urban traffic hotspot (Stuttgart, Am Neckartor). Atmos. Pollut. Res. 12, 101059. doi:10.1016/j.apr.2021.101059
Bistafa, S. R., and Bradley, J. S. (2001). Predicting speech metrics in a simulated classroom with varied sound absorption. J. Acoust. Soc. Am. 109 (4), 1474–1482. doi:10.1121/1.1354199
Bluhm, G. L., Berglind, N., Nordling, E., and Rosenlund, M. (2007). Road traffic noise and hypertension. Occup. Environ. Med. 64 (2), 122–126. doi:10.1136/oem.2005.025866
BS (1991). Description and measurement of environmental noise-Part 3: Guide to application to noise limits. London: British Standard, 1–2.
Bunn, F., and Zannin, P. H. T. (2016). Assessment of railway noise in an urban setting. Appl. Acoust. 104, 16–23. doi:10.1016/j.apacoust.2015.10.025
Cox, T. J., and D’Antonio, P. (2004). Acoustic absorbers and diffusers: Theory, design and application. London, UK: Spon Press.
Cueto, J. L., Petrovici, A. M., Hernández, R., and Fernández, F. (2017). Analysis of the impact of bus signal priority on urban noise. Acta Acust. United Acust. 103 (4), 561–573. doi:10.3813/aaa.919085
Dratva, J., Phuleria, H. C., Foraster, M., Gaspoz, J. M., Keidel, D., Künzli, N., et al. (2012). Transportation noise and blood pressure in a population-based sample of adults. Environ. Health Perspect. 120 (1), 50–55. doi:10.1289/ehp.1103448
Erickson, L. C., and Newman, R. S. (2017). Influences of background noise on infants and children. Curr. Dir. Psychol. 26 (5), 451–457. doi:10.1177/0963721417709087
Fredianelli, L., Carpita, S., Bernardini, M., Del Pizzo, L. G., Brocchi, F., Bianco, F., et al. (2022a). Traffic flow detection using camera images and machine learning methods in ITS for noise map and action plan optimization. Sensors 22 (5), 1929. doi:10.3390/s22051929
Fredianelli, L., Gaggero, T., Bolognese, M., Borelli, D., Fidecaro, F., Schenone, C., et al. (2022b). Source characterization guidelines for noise mapping of port areas, 09021.Heliyon
Gaetano, L., Matteo, B., Diego, P., Luca, F., and Francesco, F. (2019). “Port noise impact and citizens' complaints evaluation in rumble and Mon acumen interreg projects,” in Proceedings of the 26th International Congress on Sound and Vibration, Montreal, Canada.
GB (2008). Environmental quality standard for noise, ministry of environment protection of the people’s Republic of China. 3096-2008.
Gerges, S. N. Y., and Gomes, M. H. A. (2001). The assessment of room acoustics parameters using the MLS technique and numerical simulation. J. Acoust. Soc. Am. 110 (5), 2620. doi:10.1121/1.4776831
Hang, J., Li, Y., Sandberg, M., Buccolieri, R., and Sabatino, S. D. (2012). The influence of building height variability on pollutant dispersion and pedestrian ventilation in idealized high-rise urban areas. Build. Environ. 56, 346–360. doi:10.1016/j.buildenv.2012.03.023
Hao, Y., Kang, J., Krijnders, D., and Wörtche, H. (2015). On the relationship between traffic noise resistance and urban morphology in low-density residential areas. Acta Acust. United Acust. 101, 510–519. doi:10.3813/aaa.918848
Horr, Y. A., Arif, M., Kaushik, A., Mazroei, A., Katafygiotou, M., and Elsarrag, E. (2016). Occupant productivity and office indoor environment quality: A review of the literature. Build. Environ. 105, 369–389. doi:10.1016/j.buildenv.2016.06.001
Huang, C. C., Qin, Y. G., Yan, X., and Wang, P. (2012). Acoustical design of the national theatre company of China (NTCC). J. Acoust. Soc. Am. 131 (4), 3358. doi:10.1121/1.4708593
Iglesias-Merchan, C., Diaz-Balteiro, L., and Soliño, M. (2015). Transportation planning and quiet natural areas preservation: Aircraft overflights noise assessment in a National Park. Transp. Res. Part D-Transport. Environ. 41, 1–12. doi:10.1016/j.trd.2015.09.006
ISO (1987). Acoustics-Description and measurement of environmental noise-Part 3: Application to noise limits. Switzerland: International Organization for Standardization, 1–2.
ISO (2010). Acoustics-Determination of sound power levels and sound energy levels of noise sources using sound pressure - engineering methods for an essentially free field over a reflecting plane. Switzerland: International Organization for Standardization, 3744.
Jezdovic, I., Popovic, S., Radenkovic, M., Labus, A., and Bogdanović, Z. (2021). A crowdsensing platform for real-time monitoring and analysis of noise pollution in smart cities. Sust. Comput. 31, 100588. doi:10.1016/j.suscom.2021.100588
Kunzli, N., Kaiser, R., Medina, S., Studnicka, M., Chanel, O., Filliger, P., et al. (2000). Public health impact of outdoor and traffic-related air pollution: A European assessment. Lancet 356, 795–801. doi:10.1016/s0140-6736(00)02653-2
Lee, P. J., Park, S. H., Jeong, J. H., Choung, T., and Kim, K. Y. (2019). Association between transportation noise and blood pressure in adults living in multi-storey residential buildings. Environ. Int. 132, 105101. doi:10.1016/j.envint.2019.105101
Licitra, G., Bolognese, M., Chiari, C., Carpita, S., and Fredianelli, L. (2022). Noise source predominance map: A new representation for strategic noise maps. Noise Mapp. 9, 269–279. doi:10.1515/noise-2022-0163
Liu, Y., Ma, X., Shu, L., Yang, Q., Zhang, Y., Huo, Z., et al. (2020). Internet of Things for noise mapping in smart cities: State-of-the-Art and future directions. IEEE Netw. 1-7, 112–118. doi:10.1109/mnet.011.1900634
López, J. M., Alonso, J., Asensio, C., Pavón, I., Gascó, L., and de Arcas, G. (2020). A digital signal processor based acoustic sensor for outdoor noise monitoring in smart cities. Sensors 20 (3), 605. doi:10.3390/s20030605
Lou, H., and Ou, D. (2019). A comparative field study of indoor environmental quality in two types of open-plan offices: Open-plan administrative offices and open-plan research offices. Build. Environ. 148, 394–404. doi:10.1016/j.buildenv.2018.11.022
Miedema, H. M. E., and Oudshoorn, C. G. M. (2001). Annoyance from transportation noise: Relationships with exposure metrics DNL and DENL and their confidence intervals. Environ. Health Perspect. 109, 409–416. doi:10.1289/ehp.01109409
Minichilli, F., Gorini, F., Ascari, E., Bianchi, F., Coi, A., Fredianelli, L., et al. (2018). Annoyance judgment and measurements of environmental noise: A focus on Italian secondary schools. Int. J. Environ. Res. Public Health 15 (2), 208. doi:10.3390/ijerph15020208
Nastasi, M., Fredianelli, L., Bernardini, M., Teti, L., Fidecaro, F., and Licitra, G. (2020). Parameters affecting noise emitted by ships moving in port areas. Sustainability 12 (20), 8742. doi:10.3390/su12208742
Oliveira, M. F., and Silva, L. T. (2011). The influence of urban form on facades noise levels. WSEAS Trans. Environ. Dev. 7, 125–135.
Paiva, K. M., Cardoso, M. R. A., and Zannin, P. H. T. (2019). Exposure to road traffic noise: Annoyance, perception and associated factors among Brazil's adult population. Sci. Total Environ. 650, 978–986. doi:10.1016/j.scitotenv.2018.09.041
Petri, D., Licitra, G., Vigotti, M. A., and Fredianelli, L. (2021). Effects of exposure to road, railway, airport and recreational noise on blood pressure and hypertension. Int. J. Environ. Res. Public Health 18 (17), 9145. doi:10.3390/ijerph18179145
Qu, F., and Kang, J. (2017). Effects of built environment morphology on wind turbine noise exposure at building façades. Renew. Energy 107, 629–638. doi:10.1016/j.renene.2017.02.037
Qu, F., and Kang, J. (2014). “Effects of spatial configuration on the wind turbine noise distribution in residential areas,” in Forum acusticum (Krakow.
Renaud, J., Karam, R., Salomon, M., and Couturier, R. (2023). Deep learning and gradient boosting for urban environmental noise monitoring in smart cities. Expert Syst. Appl. 218, 119568. doi:10.1016/j.eswa.2023.119568
Rossi, L., Prato, A., Lesina, L., and Schiavi, A. (2018). Effects of low-frequency noise on human cognitive performances in laboratory. Build. Acoust. 25 (1), 17–33. doi:10.1177/1351010x18756800
Ruiz-Padillo, A., Ruiz, D. P., Torija, A. J., and Ramos-Ridao, Á. (2016). Selection of suitable alternatives to reduce the environmental impact of road traffic noise using a fuzzy multi-criteria decision model. Environ. Impact Assess. Rev. 61, 8–18. doi:10.1016/j.eiar.2016.06.003
Tan, D., Zhou, X., Xu, Y., Wu, C., and Li, Y. (2017). Environmental, health and economic benefits of using urban updraft tower to govern urban air pollution. Renew. Sust. Energy Rev. 77, 1300–1308. doi:10.1016/j.rser.2017.03.003
Tong, H., and Kang, J. (2021). Relationships between noise complaints and socio-economic factors in England. Sust. Cities Soc. 65, 102573. doi:10.1016/j.scs.2020.102573
Van Kempen, E., and Babisch, W. (2012). The quantitative relationship between road traffic noise and hypertension: A meta-analysis. J. Hypertens. 30 (6), 1075–1086. doi:10.1097/hjh.0b013e328352ac54
Vorländer, M. (2008). Auralization: Fundamentals of acoustics, modelling, simulation, algorithms and acoustic virtual reality. Berlin, Germany: Springer Science+Business Media LLC.
Vukić, L., Mihanovic, V., Fredianelli, L., and Plazibat, V. (2021). Seafarers’ perception and attitudes towards noise emission on board ships. Int. J. Environ. Res. Public Health 18 (12), 6671. doi:10.3390/ijerph18126671
World Health Organization (2018). Environmental noise guidelines for the European region. Available at: https://www.euro.who.int/en/publications/abstracts/environmental-noise-guidelines-for-the-european-region-2018.
Keywords: outdoor air filter tower, urban morphology, urban sound environment, noise mapping, urban environment
Citation: Lou H, Rong N, Zhao Y and Min H (2023) Noise impact evaluations of an outdoor air filter tower in urban blocks. Front. Environ. Sci. 11:1182339. doi: 10.3389/fenvs.2023.1182339
Received: 08 March 2023; Accepted: 05 June 2023;
Published: 20 June 2023.
Edited by:
Shazia Rehman, Central South University, ChinaReviewed by:
Mohamed F. Yassin, Kuwait Institute for Scientific Research, KuwaitPervez Alam, Baba Ghulam Shah Badshah University, India
Gaetano Licitra, Agenzia Regionale per la Protezione Ambientale della Toscana (ARPAT), Italy
Copyright © 2023 Lou, Rong, Zhao and Min. This is an open-access article distributed under the terms of the Creative Commons Attribution License (CC BY). The use, distribution or reproduction in other forums is permitted, provided the original author(s) and the copyright owner(s) are credited and that the original publication in this journal is cited, in accordance with accepted academic practice. No use, distribution or reproduction is permitted which does not comply with these terms.
*Correspondence: Hequn Min, hqmin@seu.edu.cn