 Hengzhi Jiang1
 Mingliang Zhang
- 1National Marine Environmental Monitoring Center, Dalian, China
- 2College of Ocean Science and Environment, Dalian Ocean University, Dalian, China
- 3Technology Innovation Center for Coastal Ecological Environment and Disaster Protection, Dalian, Liaoning, China
Salt-marsh plants play important roles in the hydrodynamics and sediment transport and deposition processes in coastal regions. The Delft3D model was applied to quantify the influence of salt-marsh plants on the hydrodynamic characteristics and suspended sediment transport of a coastal wetland, and to reveal the contribution of plants in trapping sediment in the local area. Specifically, the spatial distributions of salt-marsh plants were acquired from remote sensing images and coupled with the Delft3D model. A comparison showed that the modeled results and observed data fit very well. The model results indicated that salt marsh plants had a negligible effect on tidal level, but they did significantly affect flow velocity and tidal flux, as indicated by the obvious slow-flow zones in vegetated belts. Phragmites australis attenuated the flow velocity more than Suaeda heteroptera. We also found that the suspended sediment concentration was lower in P. australis and S. heteroptera areas because the resistance created by vegetation prevented sediment from being resuspended and helped trap suspended sediment. Numerical experiments further confirmed that the suspended sediment flux was obviously different with and without vegetation. The interception of suspended sediment by salt marsh plants could reduce the suspended sediment by more than 60%.
1 Introduction
As an essential component of estuaries, estuarine wetlands function as a transition area between terrestrial and coastal water ecosystems, possessing features from both terrestrial and aquatic environments (Chi et al., 2018). Estuarine wetlands take complex and varied forms, such as coastal beaches, coastal marshes, and inter-tidal mudflats that can be colonized by various salt-marsh plants. These plants play important roles in capturing suspended sediment from coastal and terrestrial waters and retaining that sediment through processes of sediment deposition (Darke and Megonigal, 2003; Carr et al., 2010; van der Deijl et al., 2017; Azhikodan and Yokoyama, 2018; Nardin et al., 2018; Huai et al., 2021). Furthermore, these plants serve as a barrier that protects the areas behind them from erosion caused by tidal currents, strong waves, and storm surge (Liu et al., 2018; Kalra et al., 2021). The hydrodynamics and sediment transport processes in estuarine wetlands are very complex due to the presence of irregular coastlines, islands, shoals, tidal flats, and salt-marsh plants, in combination with highly variable factors including river discharge, ocean currents and tides, and winds, which further complicate these systems. Despite their complexity, understanding the hydrodynamic characteristics and sediment transport processes in estuarine wetlands is of great importance for environmental protection and disaster reduction.
Numerical simulations provide an alternative approach for predicting hydrodynamic behavior and suspended sediment transport in large scale water bodies. A series of numerical modeling systems with different computational schemes have been developed that are able to simulate currents, waves, salinity gradients, and sediment transports in estuarine areas (e.g., ROMS, Delft3D, FVCOM, HAMSOM, EFDC, etc.) (Hamrick, 1992; Chen et al., 2003; Dinniman and Klinck, 2004; Shchepetkin and McWilliams, 2005; Patsch et al., 2017; Wu, et al., 2018). These modeling systems have been successfully applied to simulate estuarine circulation, sediment transport, and sediment deposition in different study regions (Xing et al., 2012; Shanas and Sanil Kumar, 2014; Liang et al., 2022; Serra et al., 2022; Shen et al., 2022).
The salt-marsh plants growing on tidal flats alter flow and as well as increase the intensity of turbulence in estuarine wetland regions. Various simulation algorithms have been applied to solve the complex problems posed by flow-vegetation interactions. Some studies have used Manning’s roughness coefficient to express the vegetation resistance caused by salt marsh plants in estuarine wetlands or vegetated channels (De Doncker et al., 2009; Lago et al., 2010; Busari and Li, 2015). Other studies have used bulk drag force in two-dimensional models (Horstman et al., 2015; Zhang and Xu, 2021), where the drag force of vegetation incorporates both the momentum equations and turbulence-closure equations. At an experimental scale, the three-dimensional flow-vegetation interactions have been modeled through vegetation-induced drag and inertial forces (Beudin et al., 2017), providing insight into the flow patterns through vegetated areas at smaller scales. Although some studies on the interactions between salt-marsh plants and tidal-scale dynamics have been carried out at large spatial scales using numerical models (Sheng et al., 2012; Al-Asadi and Duan, 2015; Ashal et al., 2016), few study has quantitatively evaluated how these plant communities interact with water flow in estuarine wetlands.
Hydrological processes are important factors that can shape coastal wetlands and their plant communities. Many studies have attempted to characterize the hydrological conditions of estuarine wetlands. For instance, Stark et al. (2016) studied the capacity of a tidal wetland to locally decrease water levels in an intertidal marsh during storm tides. Wester et al. (2018) proposed using a more precise 2D model to depict the interactions between river discharge and Moon tides in tidal wetlands. Zhang et al. (2018) discussed the hydrological dynamics of the water exchange between surface and subsurface waters in coastal marshlands and coastal vegetated wetlands. These studies have all observed close relationships between the hydrological properties of wetlands and the distributions of their plant communities, which enhances our understanding of the effects of vegetation on hydrodynamics and helps to study the interactions between estuaries and the associated wetland vegetation at different scales.
Suspended sediment transport in water column is significantly affected by both flat hydrodynamics and wetland vegetation canopy, which also influences with the sand capturing capacity. Numerical simulations have been widely used in the study of hydrodynamic interactions between plants and sediment due to their low costs and unrestricted experimental applicability. Previous studies have included flow and turbulence (Condon and Sheng, 2012), water level alteration (Li et al., 2020), lateral water exchange (Ge et al., 2021), and tidal flat landscape shape (Temmerman et al., 2005; Hu et al., 2018) as interaction factors in their tidal wetland simulations. Salt marsh plants growing in the intertidal belt capture sediment and drive geomorphological evolution, but these processes also impact the ecological systems of estuarine wetlands (Stephan and Gutknecht, 2002; Skłodowski et al., 2014; Valyrakis et al., 2021; Yamasaki et al., 2021; Schulze et al., 2022). Generally, these studies have mainly focused on the interaction between salt marsh plants and water flow in specific areas of estuaries or bays and relatively few field and simulation-based studies have examined coastal wetlands that represent the transition zone between environments. Therefore, the sediment capturing mechanisms of salt marsh plants toward suspended sediment are still poorly understood and in depth studies of the sediment capturing capability of salt marsh plants in coastal wetlands are necessary.
The Bohai Sea is a semi-enclosed sea adjacent to the Yellow Sea through the Bohai Strait and composed of Liaodong Bay, Bohai Bay, and Laizhou Bay. The LRE is located in the north of Liaodong Bay and is the most northern estuary in China, it has a large amount of salt marsh plants in the vast coastal intertidal area. In this study, our goals were to determine the effect of salt marsh plants on the dynamics and mechanisms of suspended sediment capture in tidal wetlands of the LRE. Therefore, this work constructed, applied, and verified a full three-dimensional hydrodynamic model that explicitly accounts for vertical flow gradients in the water column. The paper is organized as follows. Firstly, the Delft3D model with flow-vegetation dynamics is tested using four laboratory experiments involving flow through suspended emergent vegetation. Next, the model is applied to investigate the effects of salt marsh vegetation on hydrodynamics, hydrological processes, and suspended sediment transport in the Liao River Estuary (LRE) based on available field data. Then, the effects of salt-marsh plants on the wetland are investigated using a series of numerical experiments and the suspended sediment flux in vegetated areas of the coastal wetland of the LRE are calculated. Finally, we provide our conclusions and projections for this technology going forward.
2 Materials and methods
2.1 Model description
Delft3D-FLOW (version 4.00.01) is a numerical model based on the finite difference method constructed to simulate three-dimensional (3D) unsteady incompressible flow in different water masses. In the Delft3D model, the extended ADI method and a central difference are applied as the horizontal and vertical convective terms, respectively (Dastgheib et al., 2008; Deltares, 2014). This model has been applied to calculate hydrodynamics, sediment erosion, and deposition in coastal areas, estuaries, lagoons, rivers, and lakes (Lesser et al., 2004; Volp et al., 2016). The governing equation includes a continuity equation and momentum equations, and the specific expressions are:
The vertical velocity in σ coordinates is:
The influence of the vegetation on drag leads to the momentum equations containing an extra term for friction force, F(z) (N/m−3), caused by the cylindrical plant stalks. The drag force of vegetation is expressed as:
where ϕ(z) is the stem width as a function of z; Cd is the drag coefficient of the vegetation; n(z) is the number of plants per unit area; u(z) is the horizontal velocity profile; and v(z) is the vertical flow velocity profile.
Where the influence of the vegetation on turbulence means that the k-ε equations and transport equations must be solved for both turbulent kinetic energy k and for energy dissipation ε.
2.2 Sediment transport equation
The sediment transport module computes suspended sediment concentrations and sedimentation rates for each time step and each grid cell and, based on the three dimensional advection-diffusion equation for suspended sediment, can be expressed as (Deltares, 2014):
where C is suspended sediment concentration; εs,x, εs,y, and εs,z are sediment eddy diffusivity in the x, y, and z directions, respectively; ws is the settling velocity of suspended sediment; Ceq is the local equilibrium depth-averaged suspended sediment concentration; and Ts is an adaptation time scale.
3 Model validation and application
3.1 Vegetation module validation
In this paper, two examples from the literature (Plew, 2011; Zhao et al., 2017) were selected to verify the model and to further analyze the change in the main stream velocity of water flow through floating vegetation groups. In case A, the length of the flume was 20 m, the width was 0.6 m, and the height was 0.5 m. In case B, the flume was 6 m long, the width was 0.6 m, and the height was 0.5 m. The flume bottom slope was 0.1% in both cases and the vegetation was arranged in the form of floating vegetation. In the model, the grid resolutions in three directions (horizontal, lengthwise, and vertical) were 5 cm, 5 cm, and 0.9 cm, respectively. The number of grids in case A were 400 × 12 × 40, and the total number of grids in case B were 120 × 12 × 40. A discharge was set as the inlet boundary condition, and the water depth was set as the outlet boundary in these case studies. There were four cases (A, B2, B12, and B14), where the parameters in these case studies were as follows (Plew, 2011; Zhao et al., 2017), the flume inlet flow rate Q were 26.5 L/s, 7.1 L/s, 10.5 L/s and 10.1 L/s, respectively, water depth h are 36 cm, 20 cm, 20 cm and 20 cm, respectively, the clearance height between the vegetation and flume bottom hg were 25 cm, 2.5 cm, 10 cm and 10 cm, the ratio of clearance height to water depth hg/h were 0.694, 0.125, 0.5, and 0.5, respectively, the drag coefficient of vegetation Cd were 1.208, 0.780, 1.010, and 0.850, respectively, the projected area per unit volume of floating vegetation a are 3.2 m−1, 1.272 m−1, 1.908 m−1 and 0.850 m−1, respectively.
In order to clearly represent the vertical distribution of horizontal flow velocities in the flume, the calculation results are dimensionless. The horizontal axis represents the dimensionless velocity, and the vertical axis is dimensionless as the ratio of water depths Z and H. The specific results are shown in Figure 1. The simulated results were consistent with the experimental data, demonstrating that this model provides good accuracy in flow velocity through vegetated regions using the appropriate drag coefficient. Due to the resistance of vegetation, the main stream velocity is smaller in the vegetated area, while it is larger under the suspended canopy in the flume, therefore, there is a large velocity gradient in the main stream velocities across the transition from the canopy to the depth under the vegetation. In general, the simulated results indicate that the Delft3D-flow module can precisely reflect the movement of water flow in vegetated regions.
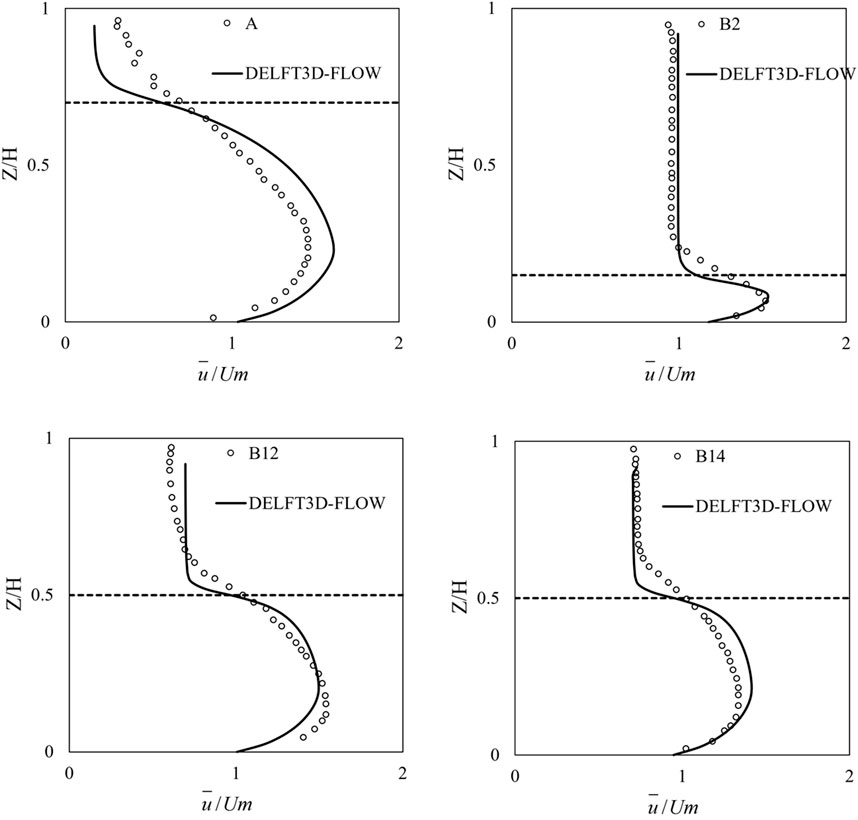
FIGURE 1. Comparison of the vertical distributions of horizontal velocities under different cases (dashed lines represent the velocities at depths in the floating vegetation).
3.2 Numerical simulation in the Liao River Estuary (LRE)
The bathymetry of the LRE is complex and contains a series of coastal shoals, creek channels, mudflats, islands, and large wetland areas (Figure 2). The wetlands of the Liao River Delta are salt marsh wetlands populated by the common salt marsh plants Suaeda heteroptera (an annual halophyte plant) and Phragmites australis in the inter-tidal areas. These areas are regularly flooded by the rise and fall of the tides. It is the largest P. australis marsh in Asia and hundreds of miles of S. heteroptera line the coastal beaches, forming the famous “red beach” landscape.
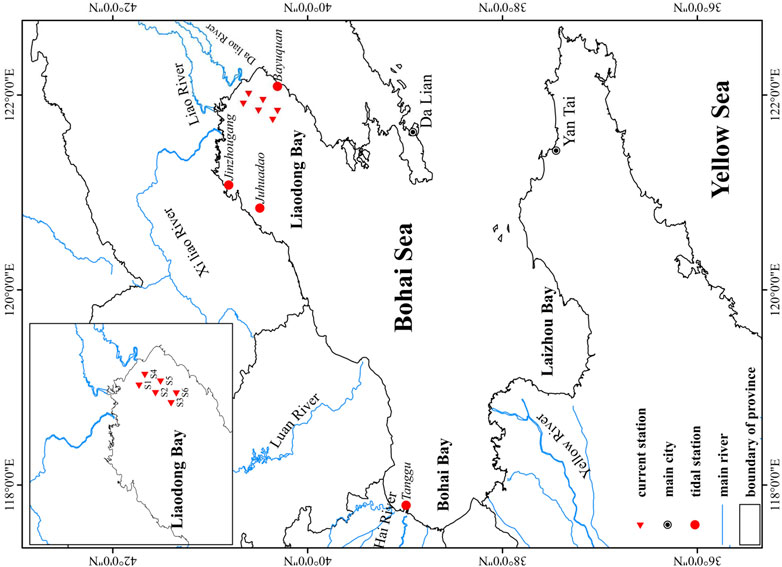
FIGURE 2. Main rivers and observation stations in the study area (red circles: tidal level stations; red triangles: tidal current stations).
For this study area, a three-level nested grid simulation was set to encompass all the computational domains (Figure 3). The smallest grid resolutions in the Bohai Sea, Liaodong Bay and Liao River Estuary were 1,500 m, 500 m, and 10 m, respectively. The time step of each models are all 60 s. On the premise of ensuring the orthogonality of grid (φ < 0.02), the grid resolution decreases successively from offshore to the estuary, which effectively improves the computational accuracy and efficiency of the Delft3d model. The three-dimensional model is used for numerical simulations, and the σ coordinate is applied in the vertical direction to make 10 layers. The level-1 ocean-scale domain covers the entire Bohai sea, with Dalian and Yantai taken as the open boundaries of the level-1 grid, where eight dominant constituents (M2, S2, N2, K2, K1, O1, P1, and Q1) are selected for harmonic analysis to obtain tide level time series for the open boundary conditions. The level-2 regional domain covers Liao Dong Bay, and its open boundary condition water levels are provided from level-1 grid model. The level-3 domain covers the area of interest with the highest resolution, i.e., the tidal wetlands of the LRE, it receives boundary conditions from level-2 and considers the fresh water input of the upstream rivers. The runoff from the Liao River and Daliao River were 101 m3/s and 57 m3/s during study period, respectively (Zhang and Xu, 2021). The computation period was from 1 May 2019 to 31 May 2019 (including two spring tides and neap tides). Four tide level stations (Bayuquan, Jinzhou port, Juhuadao, and Tanggu) were used to verify the tide levels. The study area is mainly a muddy estuarine area with a median particle size of less than 30 μm, therefore, the sediment transport model for cohesive suspended sediment was applied in the study region. The parameters related to the cohesive suspended sediment including following contents, the reference density for hindered is 1,600 kg/m3, the specific density is 2,650 kg/m3, the dry bed density is 952 kg/m3, the settling velocity is 4.5 × 10⁻⁴ m/s, the initial thickness at bed is 0.05 m, the critical bed shear stress for sedimentation is 0.75 N/m3, the critical bed shear stress for erosion is 1.75 N/m3, the erosion rate is 1 × 10⁻⁴ kg/m2/s. In addition, the input sediment concentrations at the two river boundaries were taken from the measured data.
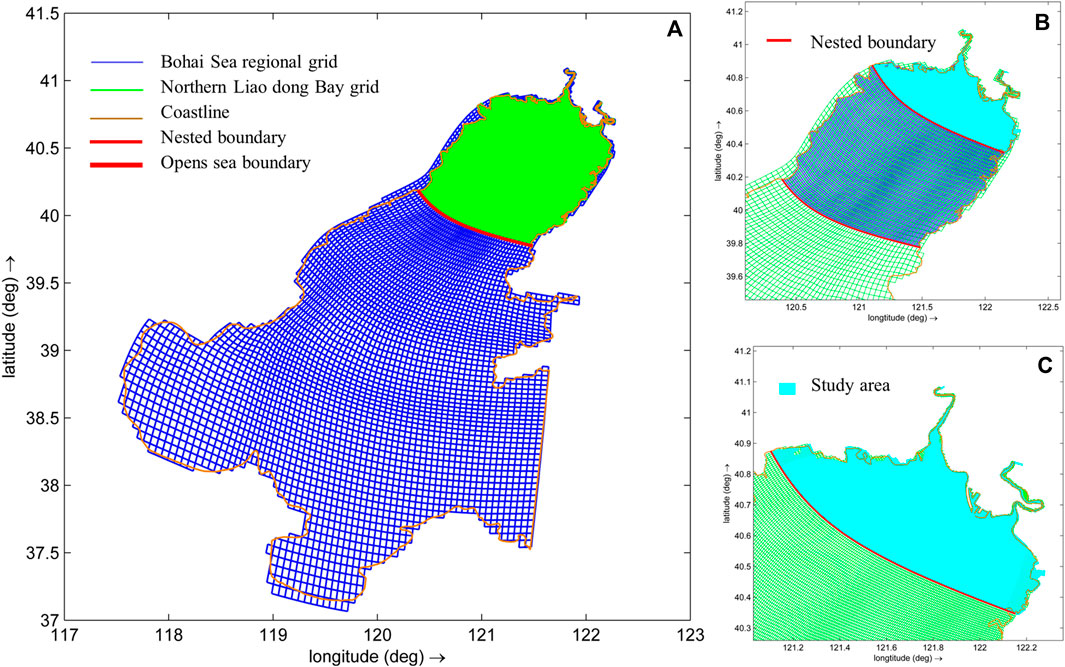
FIGURE 3. Schematic diagram of three nested grid layers in the research area. (A) Bohai Sea, (B) Liaodong Bay and (C) Liao River Estuary.
Our study region contained six observation stations (S1, S2, S3, S4, S5, and S6) used to validate the performance of the proposed model in terms of water levels, flow currents, and suspended sediment concentrations (SSCs), as shown in Figure 2. Field measurements were carried out at a series of observation stations in the Liao River Estuary area, the survey periods for tidal flow and SSC were divided into neap and spring tides, the spring tide period was from 10:00 on 20 April to 10:00 on 21 April 2019, and the neap tide period was from 7:00 on 26 April to 7:00 on 27 April 2019. Furthermore, several observation points in the tidal flats (E1–E4) were selected to investigate and compare the influence of vegetation on water surface elevations, flow velocities, and SSCs. E1 and E4 were located in areas occupied by S. heteroptera and E2 and E3 were located in areas occupied by P. australis, as shown in Figure 4. In addition, cross sections (C1–C4) in the eastern tidal flat were also configured to study the discharge flux process in the studied areas.
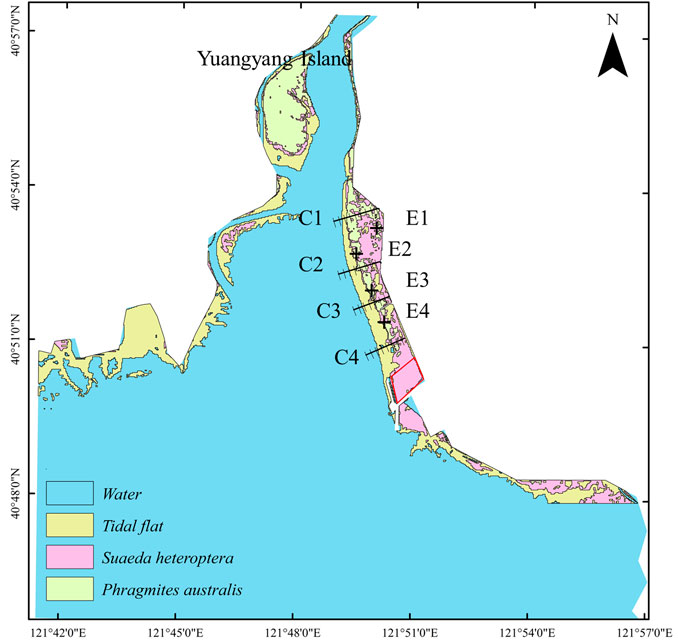
FIGURE 4. Distribution of salt-marsh plants and the observation points in the coastal wetlands of the LRE.
We evaluated the coverage of S. heteroptera and P. australis using RS images from May 2019 in the coastal wetlands of the LRE. The RS images used in this paper had a spatial resolution of 30 m and were downloaded from the USGS website (https://glovis.usgs.gov/next) from orbit number 120/32. The ENVI 5.4 software was used to conduct radiometric calibration and atmospheric correction in the RS images. The images underwent multi-resolution segmentation and were interpreted using the decision tree in eCognition 9.0. Based on the decision tree algorithm using three normalized indices (Wang and Zhang, 2022), we carried out a series of analyses with the help of visual interpretation of satellite images to identify water bodies, tidal flats, and salt-marsh vegetation in the LRE and categorized them according to their different features, as shown in Figure 4. Areas in red represent S. heteroptera cover, areas in green represent P. australis cover, areas in blue represent water bodies, and areas in gray are tidal flats. In these simulation scenarios, we used the digital map and the land cover distributions to assign vegetation type, stem height, and stem density to each grid to be used in the hydrodynamic model. We obtained the physical parameters of the two salt marsh plants by the field survey, they are as follow: the stem diameters of S. heteroptera and P. australis were 0.002 m and 0.005 m, respectively; the densities of S. heteroptera and P. australis were 250 stems/m2 and 65 stems/m2, respectively; the stem heights of S. heteroptera ranged from 15 to 25 cm and averaged 20 cm ± 3 cm, and those of P. australis ranged from 120 to 180 cm and averaged 150 cm ± 20 cm. The drag force coefficients of the vegetation were kept constant with a value of 1.0 corresponding to this growth period (Zhang and Xu, 2021).
Figure 5 shows the comparison between the simulated and observed results in tidal levels for the four stations. The tides at the four stations presented two high and low tides each day, all were irregular semi-diurnal tides. The tidal ranges of the stations to the north were greater than that near to the south side in this study region, and the maximum tidal range occurred at the Bayuquan tidal station. The correlation coefficient R2 and RMSE for all water level stations were 0.9286 and 0.24 m, respectively. R2 values over 0.9 indicate very good results, therefore, it can be concluded that the model had good accuracy and the coarse mesh model can provide precise boundary conditions for the nested grids. Figure 6 shows comparisons of the simulated and measured results in flow velocities and flow directions, respectively, at the surface and bottom layers; where stations S3 and S6 are in the second nested grid, stations S1, S2, S3, S4, and S5 are in the third nested grid. The simulated results followed the measured values very well. The flow velocities gradually increased from the bottom to the surface at all six gauge stations. The flow velocity at station S1 was influenced by the shoreline and deviated from the values measured to a certain extent. Topography had a great influence on velocity and flow direction, as shown by the lower velocities at stations S1, S2, and S3, which were located near the shoal area. Figure 7 shows comparison of the simulated and observed SSCs in the surface and bottom water layers, the simulated SSCs were in good agreement with the observed data. The SSCs at the bottom were higher than those at the surface in the study areas, and the SSCs at all stations were higher during the spring tide period than the neap tide period. We found that the influences of spring and neap tides on SSC processes were stronger in the near shore waters, and weaker in offshore waters. These results indicated that these modeling systems are capable of reproducing the tidal level, tide movement, and sediment transport processes. Therefore, the model can be used to investigate the hydrodynamic processes and distribution characteristics of SSC in coastal wetland areas.
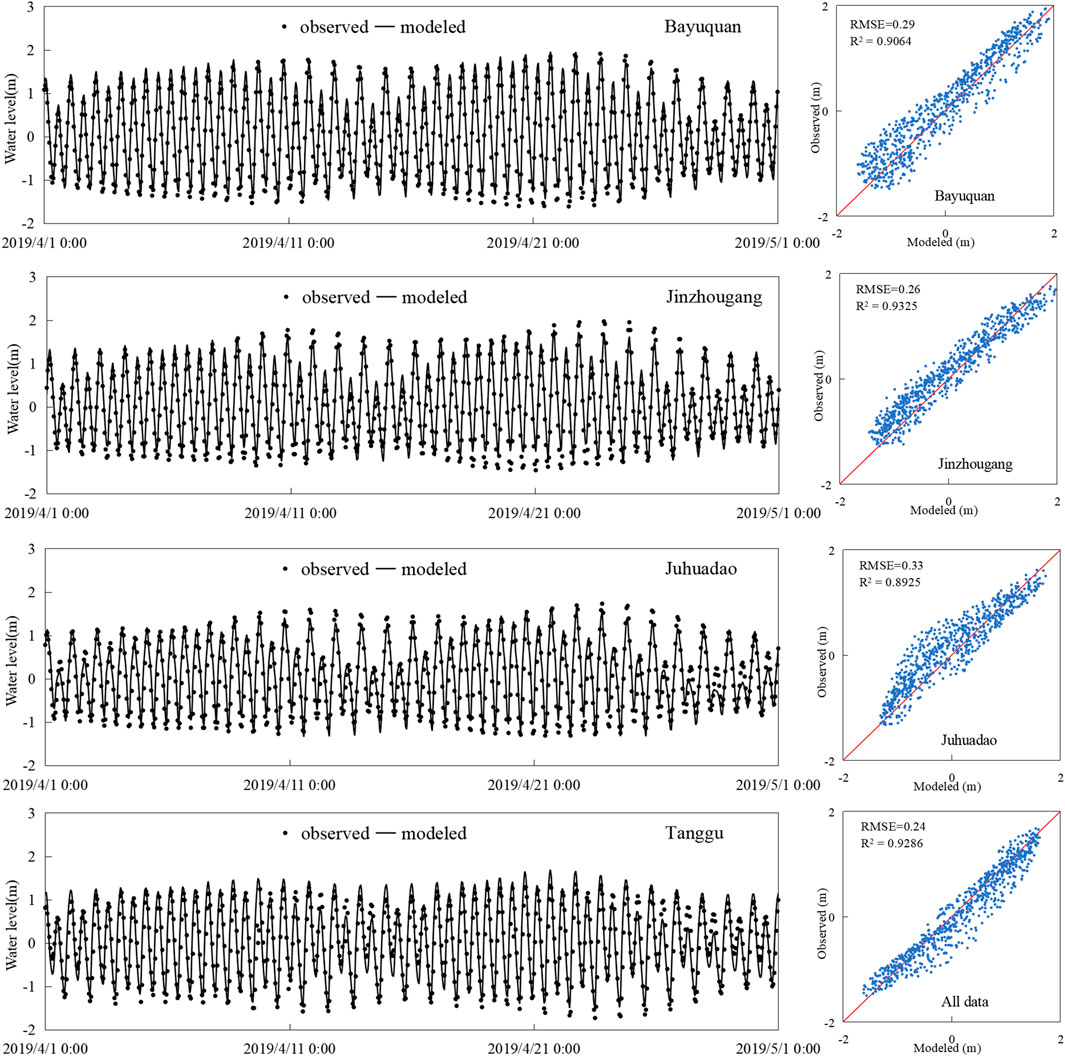
FIGURE 5. Comparison of the simulated and measured tidal levels at four stations (left). Correlation coefficient R2 and RMSE for all stations (right).
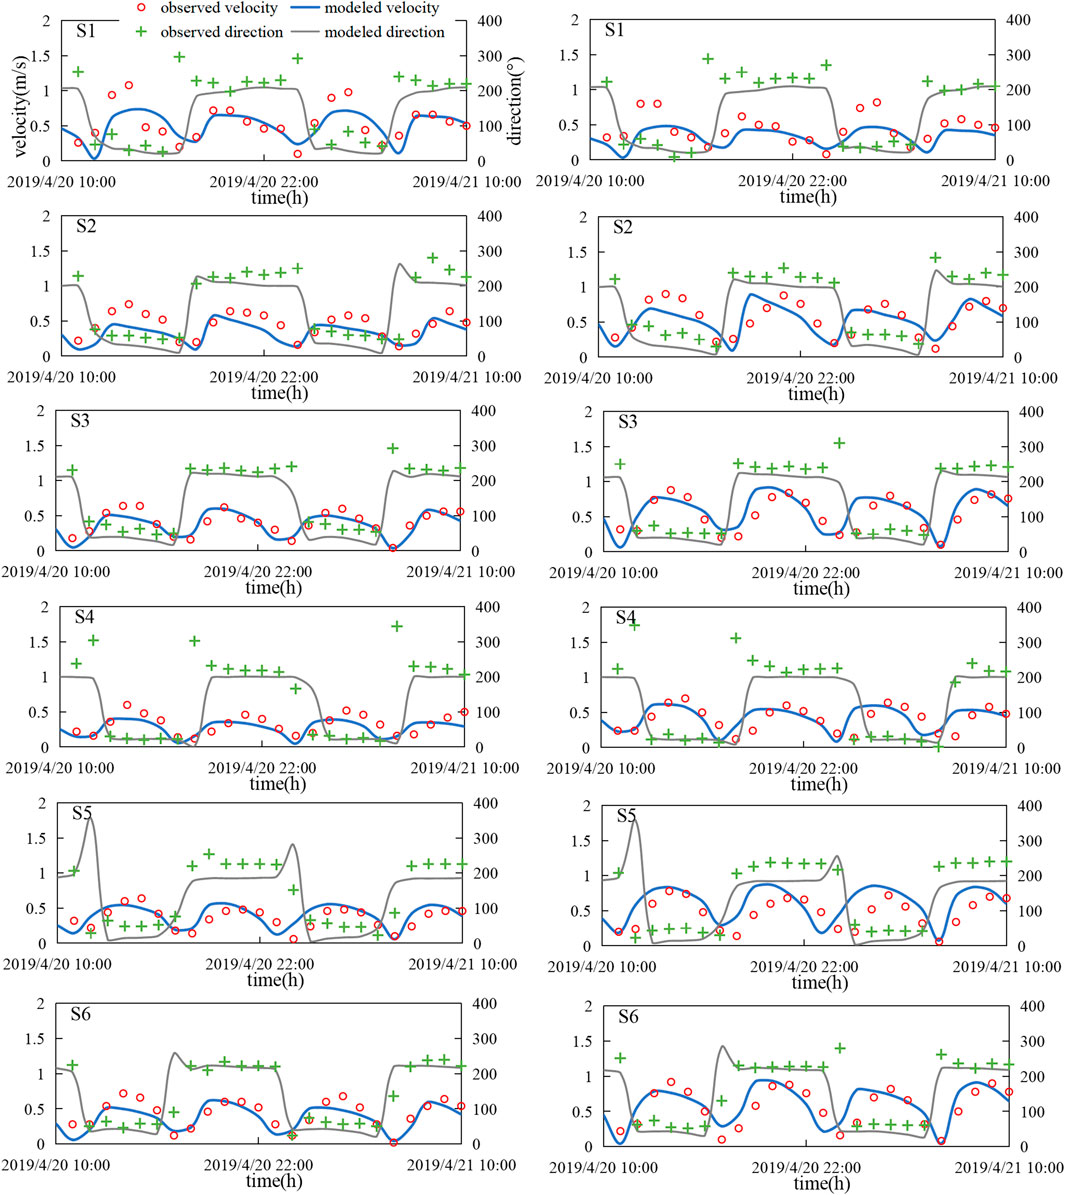
FIGURE 6. Comparison of the simulated and observed tidal currents and flow directions during spring tide.

FIGURE 7. Comparison of the simulated and observed SSCs at stations S1–S6 during spring tide.
4 Results and discussion
4.1 Effect of salt-marsh plants on flow
To understand how vegetation impacts the hydrodynamics and water fluxes in coastal wetlands during flood and ebb processes, we ran the model to analyze the flow of water through salt-marsh plants in the LRE. Figure 8 shows a comparison of simulated tidal levels without and with vegetation at stations E1, E2, E3, and E4, and the results of the two conditions were almost identical. This showed that salt-marsh plants have little influence on the tidal fluctuation in coastal wetlands, whether in spring tide or neap tide periods, and the maximum water level and the time to reach flood peak remain unchanged despite differences in plant distribution and plant type. Figure 9 shows the vertical profiles of the horizontal currents at different times, where the water levels shifted from being within to above the vegetation canopy during an inundation cycle. All horizontal flow velocity profiles showed gradual decreases from surface to bottom, including cases with and without vegetation, but flow velocities were obviously greater in flood tide periods than ebb tide periods. In the absence of vegetation, the peak velocities of the four stations (E1–E4) in the flood period were 52.19%, 85.43%, 80.03%, and 88.04% higher than those of the ebb period. However, with vegetation the peak velocities for four stations during the flooding period were relatively smaller, and were only 51.42%, 80.15%, 59.47%, and 60.39% higher than those of the ebb period. This indicated that flow velocities at all stations were reduced in vegetated areas due to the flow resistance caused by vegetation, therefore, the salt-marsh plants can slow water flows to some extent. The vertical distributions of flow velocities in E1 and E4 stations were relatively gentle in S. heteroptera areas, where the plants attenuated the peak velocities by 10.50% and 22.87%, respectively. However the vertical distributions of flow velocities exhibited dramatic changes in P. australis areas, and the attenuation rates for peak velocities at stations E2 and E3 were 80.78% and 77.20%, respectively. These results indicated that the effects of P. australis on tidal currents are stronger than those of S. heteroptera. Figure 10 gives a comparison of the simulated fluxes in four cross-sections under vegetated and non-vegetated conditions. The water fluxes exhibited similar trends in all four cross sections, with water flux reductions occurring near the vegetation because the vegetation increases the seabed roughness and causes water to seek lower resistance paths through tidal creeks. In particular, the water volume exchanged in a tidal cycle was reduced by 60.92% in the presence of vegetation in the cross section of C1, and similar but smaller reductions in the water exchange rate were seen in other sections. The largest attenuation rates of water exchange occurred mainly in P. australis areas. Thus it could be seen that salt-marsh plant (P. australis and S. heteroptera) covering in coastal wetlands of the LRE may play an important role in reducing flow velocity and altering tidal fluxes during the flood and ebb of the tide.
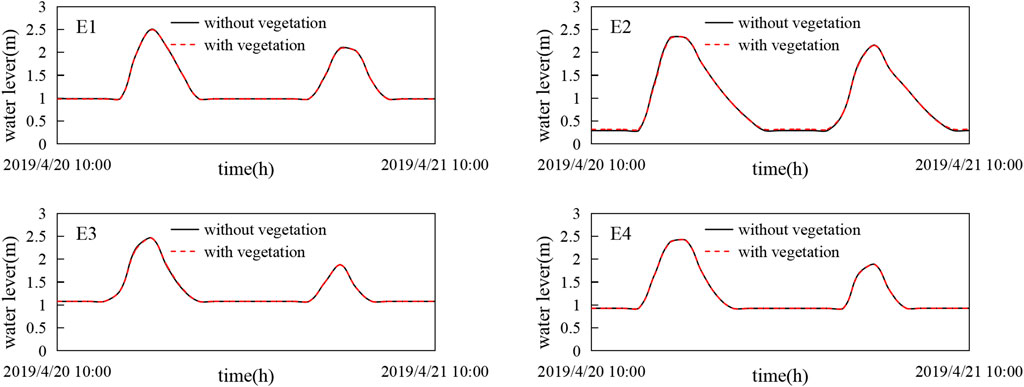
FIGURE 8. Comparison of the simulated water levels with and without vegetation.
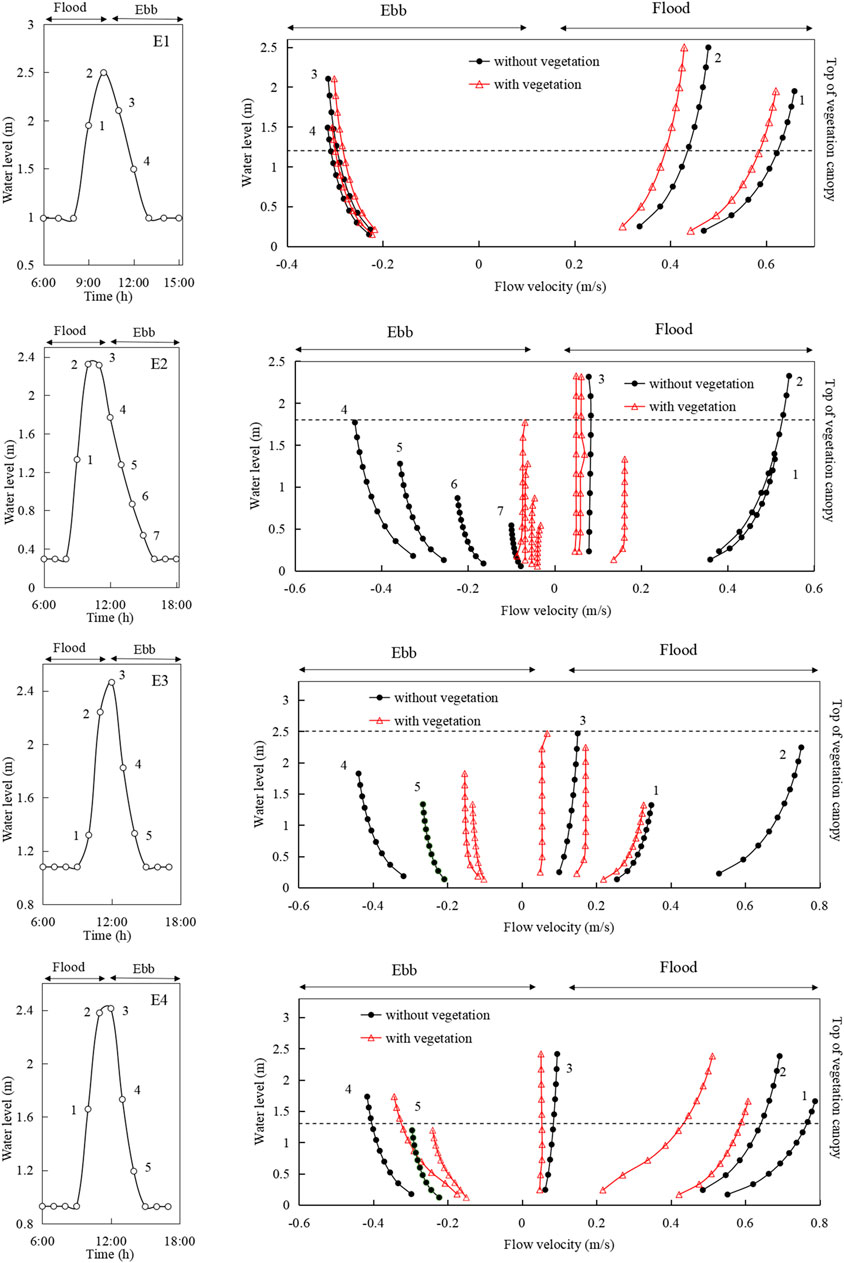
FIGURE 9. Simulated vertical profiles of flow velocity at selected stations during spring tide (20 April 2019).
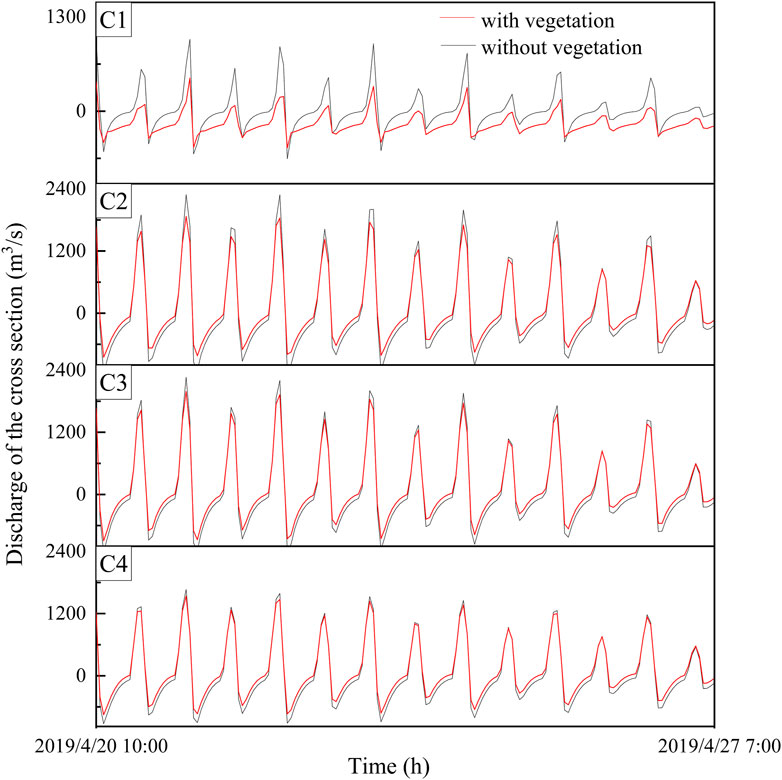
FIGURE 10. Changes of tidal fluxes in cross sections (C1–C4) with and without vegetation from 10:00 20 Apr. 2019 to 7:00 27 Apr. 2019.
Figure 11 shows the spatial patterns of flow structure in cases comparing the effects of vegetated and non-vegetated conditions. These numerical experiments showed that the presence of vegetation increased the bed resistance in tidal flats and effectively reduced the flow velocity. This was because, as the water flows through the vegetation, a lot of momentum and energy is consumed by the drag exerted by the plants, which effectively imposes resistance on the flow, resulting in decreased flow velocity compared to non-vegetated areas. Compared with S. heteroptera, P. australis is taller and larger in diameter, and it is a non-submerged emergent tidal wetland plant; due to these attributes, there were obvious slow flow regions in areas of P. australis (Figure 11B). Although the density of S. heteroptera (250 stems/m2) is bigger than that of P. australis (65 stems/m2), however its stem diameter and stem height are less than P. australis. These results showed that differences in flow velocities in vegetated region can be dependent on vegetation type, diameter, and height of salt marsh plants growing on tidal flats.
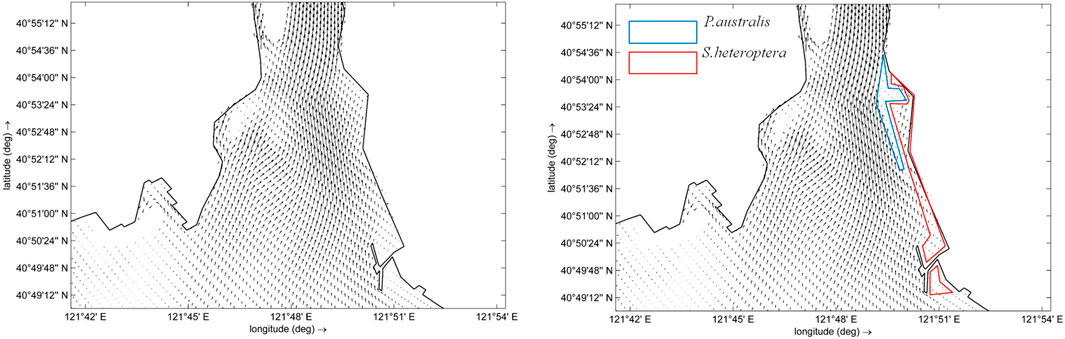
FIGURE 11. Comparison of depth-averaged flow fields in the study area during spring tide.
4.2 Effect of vegetation on suspended sediment transport
Suspended sediment in water is driven by tidal currents estuaries, where salt-marsh plants on tidal flats alter the magnitude and direction of flow currents while also changing the patterns of suspended sediment deposition distributaries within coastal wetlands. To better understand the effect of vegetation on the spatial distribution of suspended sediment, we carried out a series of numerical experiments to investigate how SSC varied across different areas, as shown in Figure 12. The comparison period was from 6:00 to 18:00 on 20 April 2019. In the early period of the flood tide and the later period of the ebb tide, the SSC was relatively low, with lower values than those at the transition period from flood to ebb. On average, the flood SSCs at the selected stations were more than double the ebb SSCs. For example, at station E1, the peak SSCs were 0.019, 0.025, and 0.002 kg/m3 at the beginning of the flood tide, highest tide period, and the end of the ebb tide, respectively. The SSCs at station E2 near the creek were clearly higher than those at other observation stations, and the high SSC in this area could be transported into the tidal flats and the coastal wetlands by tidal creeks during the flood tide. We found that the SSCs in all stations gradually decreased from the bottom to surface water layers, but the SSCs in vegetated areas were smaller than areas without vegetation, indicating that vegetation significantly influences suspended sediment transport in water. By comparing values with and without vegetation, we saw that the peak values of SSC at stations E1 and E4 were 18.92% and 45.63% lower in the presence of vegetation, while stations E2 and E3 decreased by 82.36% and 60.85% due to vegetation. Generally speaking, P. australis had stronger effects on the suspended sediment transport in the wetlands of the LRE than S. heteroptera. This was related to the vertical change in the suspended sediment concentration in areas with P. australis, which made sediment more likely to be deposited on the estuary bottom. These differences are related to the different physical forms of P. australis and S. heteroptera, with P. australis having larger stem heights and stem diameters, which give it a higher sediment capturing ratio.
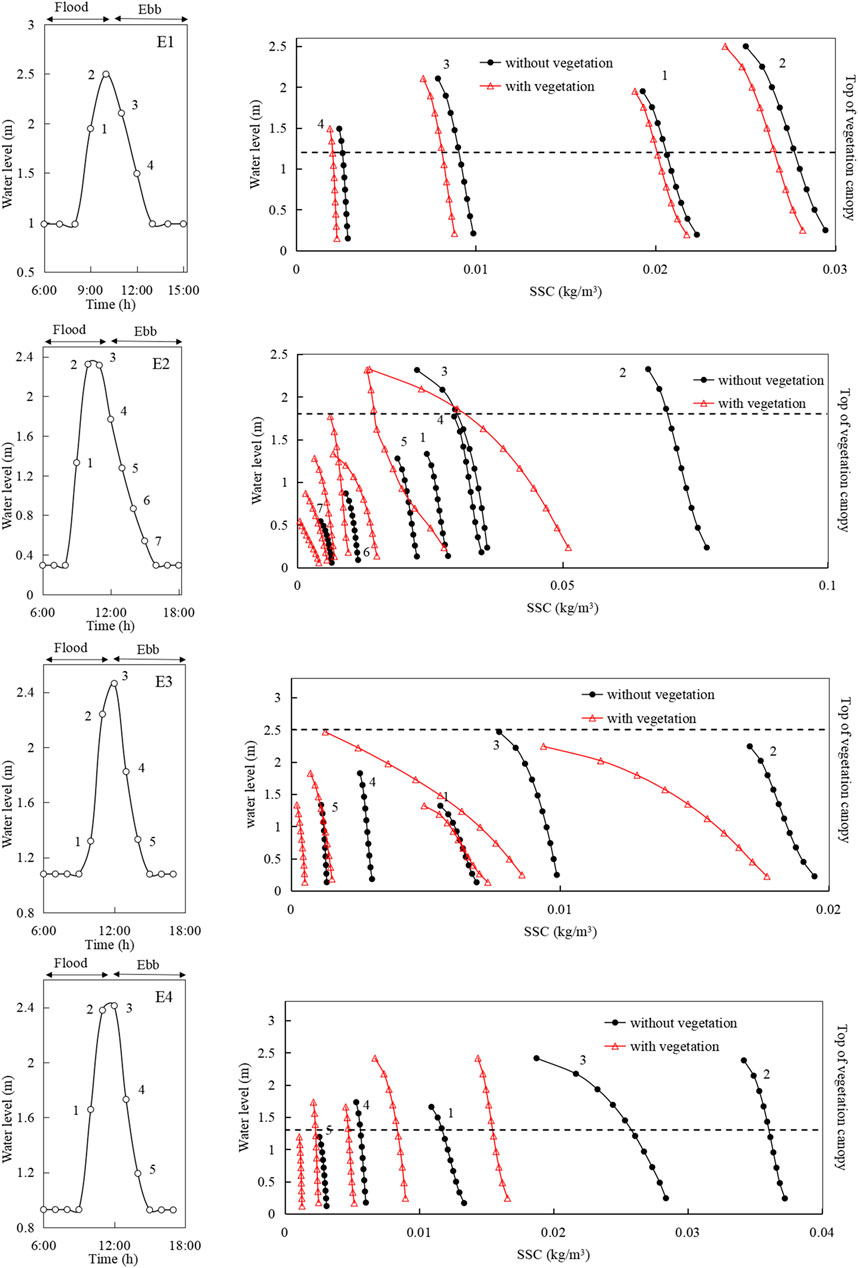
FIGURE 12. Simulated vertical profiles of SSCs in selected stations (E1, E2, E3, and E4) during spring tide (20 April 2019). Vertical profiles are shown for successive time steps (indicated by numbers).
Applying the Delft3D model, we calculated the maximum shear stress at each monitoring location during a spring tide cycle, the bottom shear stresses were computed with and without vegetation (Figure 13). There was no significant difference in bottom shear stress between offshore, bay, and tidal creek areas, but there was a notable difference between wetland regions with the two different salt marsh plant types. In the P. australis area, the shear stress was reduced by more than 50% compared to areas without vegetation, and it was reduced by 10% compared to S. heteroptera areas. Lower bed shear stress reduces the erosion and resuspension of seabed sediments, resulting in low SSCs in the water column of wetland areas. Interestingly, the presence of salt-marsh plants had a strong effect on flow velocity, and the maximum bottom shear stress on the marsh tidal flat of the LRE was significantly reduced when vegetation was present.
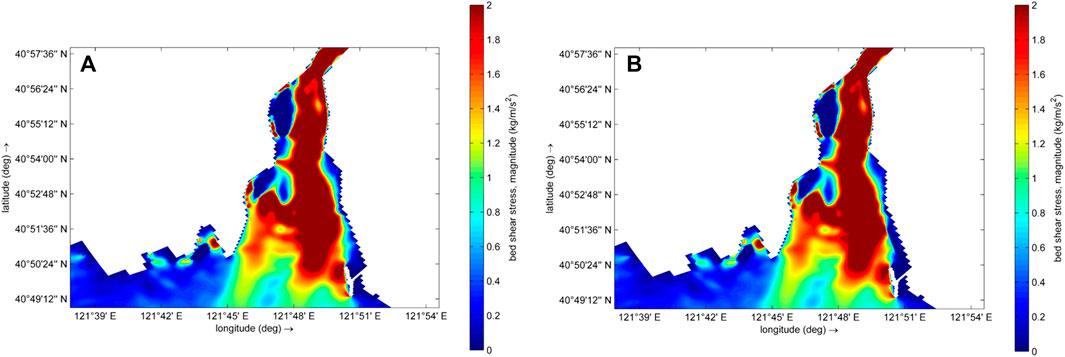
FIGURE 13. Comparison of the computed bed shear stresses at mean water level in non-vegetated and vegetated cases [(A): without vegetation, (B): with vegetation].
4.3 Sediment budget
Vegetation can trap suspended sediments and facilitate accretion, and therefore promote the elevation of tidal flat landforms. We conducted several numerical experiments to study the degree to which different landscape types capture suspended sediments in the coastal wetlands of the LRE. Three monitoring periods were selected to consider different flow conditions, including spring tide (Apr. 20, 2019), middle tide (Apr. 24, 2019), and neap tide (Apr. 27, 2019). The SSC simulation with changing tidal level during spring tide indicated that the SSCs in the flood and ebb tides are closely related with the water level change (Figure 14A), but there is a time delay between the maximum sediment concentration and the maximum tidal level.
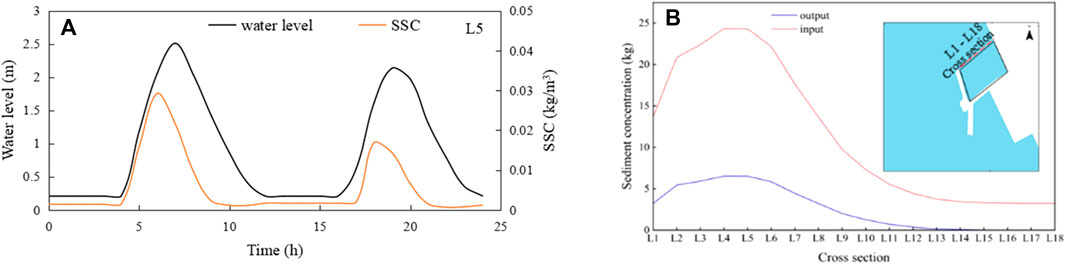
FIGURE 14. (A) Suspended sediment flux in a selected region (L5 cross section) in a spring tide tidal cycle (B)Simulated suspended sediment fluxes in selected areas in a spring tide tidal cycle.
To track the suspended sediment transport in the LRE wetlands, we also computed the total amount of suspended sediment in the defined polygon, which was located in a S. heteroptera vegetation region. The suspended sediment fluxes in the selected area were calculated by establishing cross sections L1–L18, as shown in Figure 14B. It could be seen that the incoming flux of sediment during the flood tide period was larger than that in the ebb tide period, so a portion of suspended sediment is retained in the polygon region upon transition from flood to ebb tide. This showed that the salt-marsh plants in the wetlands of the LRE have a marked effect on sediment transport, trapping it in the study area during the tidal cycle. Figure 15A shows the calculated suspended sediment flux during different time periods. During the spring tide period, the input flux of suspended sediment in the selected area was 177.99 kg during the flood tide, while the output flux was only 45.77 kg during the ebb tide. This indicated that 74.28% of the total sediment input was retained as sediment during spring tide periods. The sediment catch gradually decreased during the transition from spring tide to neap tide. Moreover, we also analyzed the effect of salt-marsh plants on suspended sediment capture by comparing areas with and without vegetation, as shown in Figure 15B showed that there were the higher suspended sediment capturing rates (>60%) in areas occupied by S. heteroptera; furthermore, the sediment capture rate decreased slightly in lower tidal flat areas. These results indicated that sediment trapping can result when suspended sediment is advected over vegetated regions, and large marsh wetlands with relatively healthy plant communities can uptake larger amounts of sediment than baren tidal flats in estuary regions. Where the healthy plant communities can effectively slowed down the tidal current when the flow through the vegetation area, so the sediment easily attached to the plants and settled down the roots of the plants. However, the influence of salt marsh plants on suspended sediment capture may be different during different periods.
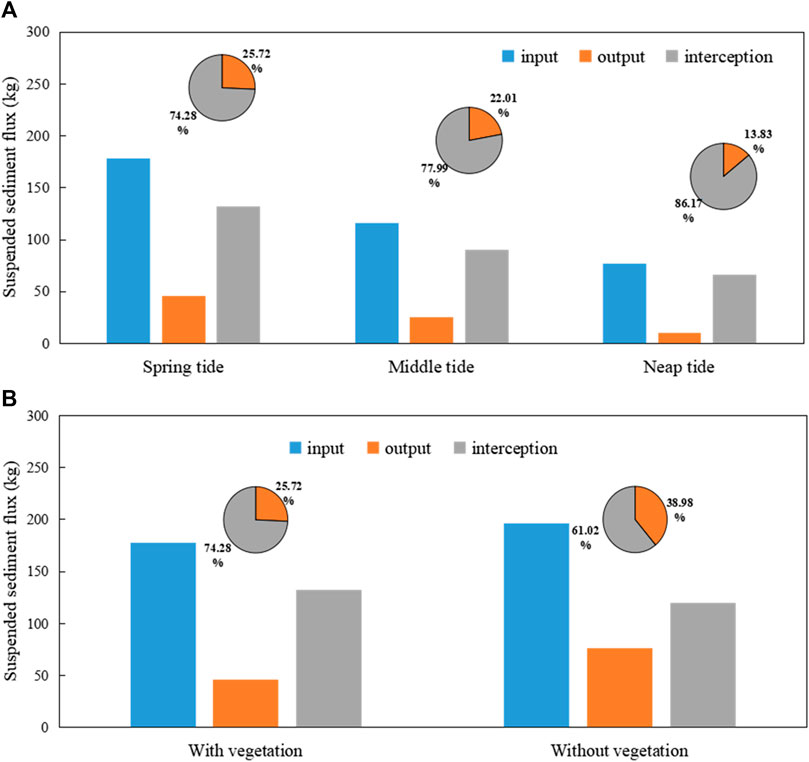
FIGURE 15. (A) Suspended sediment fluxes in selected areas during spring, middle, and neap tides (B) Computed suspended sediment fluxes in selected areas with or without vegetation during spring tide.
5 Conclusion
This study has expanded our understanding of tide induced sedimentation in coastal wetlands through a coupled hydrodynamic and sediment transport modeling system (Delft3D model). The model considered the resistance of salt marsh plants to water flow in the third layer nested grid. RS technology was used to classify objects (vegetated vs. non-vegetated domains) and extract the distribution of dominant tidal flat plants (S. heteroptera and P. australis) over a large spatial scale. The model validation demonstrated the ability of the present model to accurately capture the complex flow-vegetation interactions using experimental cases. Moreover, we conducted a series of numerical experiments to highlight the relationships among salt-marsh plants, tidal currents, and SSCs in the coastal wetlands of the LRE. The results indicated that the model successfully simulated the interaction among currents, water level, and salt marsh plants in the coastal wetland. The model revealed that the salt marsh plants have little effect in reducing the water surface elevation induced by astronomical tides. However, they can reduce flow velocities within vegetated areas, effectively restricting higher velocities to the tidal creeks surrounding the vegetated regions. The vegetation properties (e.g., type, stem height, stem diameter, and density) had a significant effect on flow velocity. This showed that salt marsh plants have a great influence on the flow structure characteristics in the coastal wetlands of the LRE and significantly reduce the volume of water exchanged with the open ocean as well. There was reasonable agreement between the modeled SSCs and field measurements in this study, indicating good model performance under different conditions. The simulated SSCs within the study area showed some pronounced temporal changes between different tidal periods, i.e., neap tide vs. spring tide. Our model results indicated that suspended sediment from coastal bays make up as much as 60% of sediment deposition in the coastal wetlands of the LRE. Furthermore, the concentrations of the suspended sediments in water were related to vegetation cover type in the tidal flats, as well as by presence or absence of salt marsh plants. Similarly, water exchange with terrestrial and seawater sources strongly influences the suspended sediment concentrations of coastal wetlands. Therefore, it can be concluded that the type of vegetation is a major factor controlling the sediment budget of wetlands. Our study has showed that the ability of coastal wetlands to attenuate flow velocity and intercept suspended sediment is influenced by the presence of vegetation, which has a positive effect on the growth and development of wetlands. The results of this study can provide theoretical and technical guidance for habitat maintenance in tidal flats as well as for coastal wetland restoration and management.
Data availability statement
The raw data supporting the conclusion of this article will be made available by the authors, without undue reservation.
Author contributions
HJ: validation, methodology, conceptualization, writing—review and editing. CC: software, validation, writing—review and editing. MZ: methodology, project administration, writing—review and editing. All authors listed have made a substantial, direct, and intellectual contribution to the work and approved it for publication.
Funding
This work was supported by the National Nature Science Foundation of China (Grant Number U21A20155; 51879028), Applied basic research plan project of Liaoning province (Grant Number 2023030048-JH2/1013), and Dalian Science and Technology Innovation Fund Project (Grant No. 2021JJ11CG001).
Conflict of interest
The authors declare that the research was conducted in the absence of any commercial or financial relationships that could be construed as a potential conflict of interest.
Publisher’s note
All claims expressed in this article are solely those of the authors and do not necessarily represent those of their affiliated organizations, or those of the publisher, the editors and the reviewers. Any product that may be evaluated in this article, or claim that may be made by its manufacturer, is not guaranteed or endorsed by the publisher.
Supplementary material
The Supplementary Material for this article can be found online at: https://www.frontiersin.org/articles/10.3389/fenvs.2023.1180457/full#supplementary-material
References
Al-Asadi, K., and Duan, J. G. (2015). Three-dimensional hydrodynamic simulation of tidal flow through a vegetated marsh area. J. Hydraul. Eng. 141 (12), 06015014. doi:10.1061/(ASCE)HY.1943-7900.0001052
Ashal, L. M., Mulligan, R. P., Proosdij, D. V., and Poirier, E. (2016). Application and validation of a three-dimensional hydrodynamic model of a macrotidal salt marsh. Coast. Eng. 114, 35–46. doi:10.1016/j.coastaleng.2016.04.005
Azhikodan, G., and Yokoyama, K. (2018). Sediment transport and fluid mud layer formation in the macro-tidal Chikugoriver estuary during a fortnightly tidal cycle. Estuar. Coast. Shelf S. 202, 232–245. doi:10.1016/j.ecss.2018.01.002
Beudin, A., Kalra, T. S., Ganju, N. K., and Warner, J. C. (2017). Development of a coupled wave-flow-vegetation interaction model. Comput. Geosci. 100, 76–86. doi:10.1016/j.cageo.2016.12.010
Busari, A. O., and Li, C. W. (2015). A hydraulic roughness model for submerged flexible vegetation with uncertainty estimation. J. Hydro-environ. Res. 9 (2), 268–280. doi:10.1016/j.jher.2014.06.005
Carr, J., D'Odorico, P., McGlathery, K. J., and Wiberg, P. L. (2010). Stability and bistability of seagrass ecosystems in shallow coastal lagoons: Role of feedbacks with sediment re-suspension and light attenuation. J. Geophys. Res. 115, G03011. doi:10.1029/2009JG001103
Chen, C. S., Liu, H. D., and Beardsley, R. C. (2003). An unstructured grid, finite-volume, three-dimensional, primitive equations ocean model: Application to coastal ocean and estuaries. Atmos. Ocean. Technol. 20, 159–186. doi:10.1175/1520-0426(2003)020<0159:augfvt>2.0.co;2
Chi, Y., Zheng, W., Shi, H. H., Sun, J. K., and Fu, Z. Y. (2018). Spatial heterogeneity of estuarine wetland ecosystem health influenced by complex natural and anthropogenic factors. Sci. Total Environ. 634, 1445–1462. doi:10.1016/j.scitotenv.2018.04.085
Condon, A. J., and Sheng, Y. P. (2012). Optimal storm generation for evaluation of the storm surge inundation threat. Ocean. Eng. 43, 13–22. doi:10.1016/j.oceaneng.2012.01.021
Darke, A. K., and Megonigal, J. P. (2003). Control of sediment deposition rates in two mid-Atlantic Coast tidal freshwater wetlands. Estuar. Coast. Shelf S. 57 (1–2), 255–268. doi:10.1016/S0272-7714(02)00353-0
Dastgheib, A., Roelvink, J. A., and Wang, Z. B. (2008). Long-term process-based morphological modeling of the marsdiep tidal basin. Mar. Geol. 256 (1), 90–100. doi:10.1016/j.margeo.2008.10.003
De Doncker, L., Troch, P., Verhoeven, R., Bal, K., Meire, P., and Quintelier, J. (2009). Determination of the Manning roughness coefficient influenced by vegetation in the river Aa and Biebrza river. Environ. Fluid Mech. 9 (5), 549–567. doi:10.1007/s10652-009-9149-0
Dinniman, M. S., and Klinck, J. M. (2004). A model study of circulation and cross shelf exchange on the west Antarctic Peninsula continental shelf. Deep-Sea Res. Part II 51, 2003–2022. doi:10.1016/j.dsr2.2004.07.030
Ge, J. Z., Zhang, J. S., Chen, C. S., and Ding, P. X. (2021). Impacts of fluvial flood on physical and biogeochemical environments in estuary-shelf continuum in the East China Sea. J. Hydrol. 598, 126441. doi:10.1016/j.jhydrol.2021.126441
Hamrick, J. M. (1992). A three-dimensional environment fluid dynamics computer code: Theoretical and computational aspects. Special report 317. Williamsburg, Virgina: The College of William and Mary, Virgina Institute of Marine Science.
Horstman, E. M., Dohmen-Janssen, C. M., Bouma, T. J., and Hulscher, S. J. M. H. (2015). Tidal-scale flow routing and sedimentation in mangrove forests: Combining field data and numerical modelling. Geomorphology 228, 244–262. doi:10.1016/j.geomorph.2014.08.011
Hu, K. L., Chen, Q., Wang, H. Q., Ellen, K. H., and Philip, M. O. (2018). Numerical modeling of salt marsh morphological change induced by Hurricane Sandy. Coast. Eng. 132, 63–81. doi:10.1016/j.coastaleng.2017.11.001
Huai, W. X., Li, S. L., Katul, G. G., Liu, M. Y., and Yang, Z. H. (2021). Flow dynamics and sediment transport in vegetated rivers: A review. J. Hydrodyn. 2021, 400–420. doi:10.1007/s42241-021-0043-7
Kalra, T. S., Ganju, N. K., Aretxabaleta, A. L., Carr, J. A., Defne, Z., and Moriarty, J. M. (2021). Modeling marsh dynamics using a 3-D coupled wave-flow-sediment model. Front. Mar. Sci. 8, 740921. doi:10.3389/fmars.2021.740921
Lago, M. E., Miralles-Wilhelm, F., Mahmoudi, M., and Engel, V. (2010). Numerical modeling of the effects of water flow, sediment transport and vegetation growth on the spatio temporal patterning of the ridge and slough landscape of the Everglades wetland. Adv. Water Resour. 33, 1268–1278. doi:10.1016/j.advwatres.2010.07.009
Lesser, G. R., Roelvink, J. A., Van Kester, J. A. T. M., and Stelling, G. S. (2004). Development and validation of a three-dimensional morphological model. Coast. Eng. 51, 883–915. doi:10.1016/j.coastaleng.2004.07.014
Li, Y. L., Zhang, Q., Tan, Z. Q., and Yao, J. (2020). On the hydrodynamic behavior of floodplain vegetation in a flood-pulse-influenced river-lake system (Poyang Lake, China). J. Hydrol. 585, 124852. doi:10.1016/j.jhydrol.2020.124852
Liang, B., Wang, Z., Xie, B., Wu, G., Yan, Z., and Borsje, B. W. (2022). The role of idealized storms on the initial stages in sand wave formation: A numerical modeling study. Ocean. Eng. 262, 112203. doi:10.1016/j.oceaneng.2022.112203
Liu, K., Chen, Q., Hu, K. L., Xu, K. H., and Twilley, R. R. (2018). Modeling hurricane-induced wetland-bay and bay-shelf sediment fluxes. Coast. Eng. 135, 77–90. doi:10.1016/j.coastaleng.2017.12.014
Nardin, W., Larsen, L., Fagherazzi, S., and Wiberg, P. (2018). Tradeoffs among hydrodynamics, sediment fluxes and vegetation community in the Virginia Coast Reserve, USA. Estuar. Coast. Shelf S. 210, 98–108. doi:10.1016/j.ecss.2018.06.009
Patsch, J., Burchard, H., Dieterich, C., Gräwe, U., Gröger, M., Mathis, M., et al. (2017). An evaluation of the North Sea circulation in global and regional models relevant for ecosystem simulations. Ocean. Model. 116, 70–95. doi:10.1016/j.ocemod.2017.06.005
Plew, D. R. (2011). Depth-averaged drag coefficient for modeling flow through suspended canopies. J. Hydraul. Eng. 137 (2), 234–247. doi:10.1061/(ASCE)HY.1943-7900.0000300
Schulze, D., Jensen, K., and Nolte, S. (2022). Effects of small-scale patterns of vegetation structure on suspended sediment concentration and sediment deposition in a salt marsh. Estuar. Coast. Shelf S. 278, 108125. doi:10.1016/j.ecss.2022.108125
Serra, T., Soler, M., Barcelona, A., and Colomer, J. (2022). Suspended sediment transport and deposition in sediment-replenished artificial floods in Mediterranean rivers. J. Hydrol. 609, 127756. doi:10.1016/j.jhydrol.2022.127756
Shanas, P. R., and Sanil Kumar, V. (2014). Coastal processes and longshore sediment transport along Kundapura coast, central west coast of India. Geomorphology 214, 436–451. doi:10.1016/j.geomorph.2014.02.027
Shchepetkin, A. F., and McWilliams, J. C. (2005). The regional oceanic modeling system (ROMS): A split explicit, free-surface, topography-following-coordinate oceanic model. Ocean. Model 9 (4), 347–404. doi:10.1016/j.ocemod.2004.08.002
Shen, Y. M., Zhang, H. X., and Tang, J. (2022). Hydrodynamics and water quality impacts of large-scale reclamation projects in the Pearl River Estuary. Ocean. Eng. 257, 111432. doi:10.1016/j.oceaneng.2022.111432
Sheng, Y. P., Lapetina, A., and Ma, G. F. (2012). The reduction of storm surge by vegetation canopies: Three -dimensional simulations. Geophys. Res. Lett. 39, L20601. doi:10.1029/2012GL053577
Skłodowski, M., Kiedrzy´nska, E., Kiedrzy´nski, M., Urbaniak, M., Zieli´nska, K. M., Kurowski, J. K., et al. (2014). The role of riparian willows in phosphorus accumulation and PCB control for lotic water quality improvement. Ecol. Eng. 70, 1–10. doi:10.1016/j.ecoleng.2014.03.088
Stark, J., Plancke, Y., Ides, S., Meire, P., and Temmerman, S. (2016). Coastal flood protection by a combined nature-based and engineering approach: Modeling the effects of marsh geometry and surrounding dikes. Estuar. Coast. Shelf S. 175 (20), 34–45. doi:10.1016/j.ecss.2016.03.027
Stephan, U., and Gutknecht, D. (2002). Hydraulic resistance of submerged flexible vegetation. J. Hydrol. 269 (1-2), 27–43. doi:10.1016/S0022-1694(02)00192-0
Temmerman, S., Bouman, T. J., Govers, G., Wang, Z. B., De Vries, M. B., and Herman, P. M. J. (2005). Impact of vegetation on flow routing and sedimentation patterns: Three-dimensional modeling for a tidal marsh: Vegetation impact on flow routing. Geophys. Res. 110, 1–18. doi:10.1029/2005JF000301
Valyrakis, M., Liu, D., Turker, U., and Yagci, O. (2021). The role of increasing riverbank vegetation density on flow dynamics across an asymmetrical channel. Environ. Fluid Mech. 21 (3), 643–666. doi:10.1007/s10652-021-09791-9
Van der Deijl, E. C., van der Perk, M., and Middelkoop, H. (2017). Factors controlling sediment trapping in two fresh water tidal wetlands in the Biesbosch area, The Netherlands. J. Soils Sediments 17, 2620–2636. doi:10.1007/s11368-017-1729-x
Volp, N. D., Van Prooijen, B. C., Pietrzak, J. D., and Stelling, G. S. (2016). A subgrid based approach for morphodynamic modelling. Adv. Water Resour. 93, 105–117. doi:10.1016/j.advwatres.2015.07.013
Wang, Y. N., and Zhang, M. L. (2022). Modeling hydrodynamic and hydrological processes in tidal wetlands. Wetlands 42, 1–14. doi:10.1007/s13157-021-01519-1
Wester, S. J., Grimson, R., Minotti, P. G., Booij, M. J., and Brugnach, M. (2018). Hydrodynamic modelling of a tidal delta wetland using an enhanced quasi-2D model. J. Hydrol. 559, 315–326. doi:10.1016/j.jhydrol.2018.02.014
Wu, G., Shi, F., Kirby, J. T., Liang, B., and Shi, J. (2018). Modeling wave effects on storm surge and coastal inundation. Coast. Eng. 140, 371–382. doi:10.1016/j.coastaleng.2018.08.011
Xing, F., Wang, Y. P., and Wang, H. V. (2012). Tidal hydrodynamics and fine-grained sediment transport on the radial sand ridge system in the southern Yellow Sea. Mar. Geol. 291, 192–210. doi:10.1016/j.margeo.2011.06.006
Yamasaki, T. N., Jiang, B., Janzen, J. G., and Nepf, H. M. (2021). Feedback between vegetation, flow, and deposition: A study of artificial vegetation patch development. J. Hydrol. 598, 126232. doi:10.1016/J.JHYDROL.2021.126232
Zhang, M. L., and Xu, H. (2021). Numerical analysis of the potential effect of wetlands on reducing tidal currents in the Liao River Estuary, China. Environ. Model Assess. 26, 205–220. doi:10.1007/s10666-020-09729-3
Zhang, Y., Li, W. H., Sun, G., Miao, G. F., Noormets, A., Emanuel, R., et al. (2018). Understanding coastal wetland hydrology with a new regional-scale, process-based hydrological model. Hydrol. Process. 32 (20), 3158–3173. doi:10.1002/hyp.13247
Keywords: numerical simulation, salt marsh plants, hydrodynamic, suspended sediment flux, sediment capture
Citation: Jiang H, Chai C and Zhang M (2023) Numerical study on the influence of salt marsh plants on coastal wetland hydrodynamics and suspended sediment transport. Front. Environ. Sci. 11:1180457. doi: 10.3389/fenvs.2023.1180457
Received: 06 March 2023; Accepted: 09 May 2023;
Published: 19 May 2023.
Edited by:
Min Luo, Zhejiang University, ChinaReviewed by:
Feifei Tong, Southern Cross University, AustraliaLi Mingchang, Zhejiang Ocean University, China
Copyright © 2023 Jiang, Chai and Zhang. This is an open-access article distributed under the terms of the Creative Commons Attribution License (CC BY). The use, distribution or reproduction in other forums is permitted, provided the original author(s) and the copyright owner(s) are credited and that the original publication in this journal is cited, in accordance with accepted academic practice. No use, distribution or reproduction is permitted which does not comply with these terms.
*Correspondence: Mingliang Zhang, emhtbGlhbmdfbWFpbEAxMjYuY29t