 Pham Viet Hoa
 Nguyen Quang Tuan2
 Giang Thi Phuong Thao
 Nguyen An Binh
95% of researchers rate our articles as excellent or good
Learn more about the work of our research integrity team to safeguard the quality of each article we publish.
Find out more
ORIGINAL RESEARCH article
Front. Environ. Sci. , 30 May 2023
Sec. Environmental Informatics and Remote Sensing
Volume 11 - 2023 | https://doi.org/10.3389/fenvs.2023.1175567
This article is part of the Research Topic Geophysical, Climatological and Anthropogenic Hazards and Disaster: Vulnerability, Risk Assessment, and Sustainability View all 11 articles
Accurate detection of landslide spatial patterns is vital in susceptibility, hazard, and risk disaster mapping. Geographic Information System (GIS)-based quantitative approaches provide a rigorous procedure for gaining deep insight into natural and anthropogenic landslides from different scales. This study aims to implement a comprehensive solution for retrieving the landslide susceptibility index. For that purpose, a landslide inventory was performed in a tropical monsoon climate region, with a magnitude of elevation spanning from −65 m to 1,900 m above the sea, considering 15 fundamental causative factors belonging to the groups of topography, hydrology, geology, land cover conditions and anthropogenic activities, and weather. The frequency ratio (FR) was implemented to rank subclasses in each causative factor. For factor weight estimation, different approaches were applied, including the subjective-based analytic hierarchy process (AHP), objective-based Shannon entropy (SE), and a synergy of both methods (AHP–SE), built on these two approaches. Out of the 271 identified landslide locations, 70% (196 points) were used for training and the remaining 30% (71 points) were applied for validation. The results showed that the integrated AHP–SE outperformed the two individual approaches, with the area under the receiver operating characteristic curve (AUC) reaching 0.876, following SE (AUC = 0.848) and AHP (AUC = 0.818). In the synergy approach, the climate pattern under tropical monsoons was confirmed as the most crucial landslide-predisposing factor. The research contributes to a novel discussion by integrating knowledge-based consultation and statistical data analysis of accurate geospatial data, incorporating significant explanatory factors toward a reliable landslide-prone zonation over space and time dimensions.
Landslides, caused by the rapid movement of rock and soil, represent one of the most hazardous geological phenomena, with significant impacts on both natural systems and human societies (Highland and Bobrowsky, 2008). In natural environments, landslides can alter the landscape, disrupt ecosystems, and affect wildlife habitats. Furthermore, they can trigger other natural disasters, such as flash floods, and increase soil erosion and sediment deposits in rivers and streams (Lombardo et al., 2020). In populated areas, landslides can cause damage to infrastructure, resulting in significant financial losses and loss of life. The number of people killed by landslides has increased significantly in the 20th century due to the growing population density and accompanying economic activities in areas with a high risk of landslides, and this trend appears to be continuing in the 21st century (Froude and Petley, 2018). Moreover, most landslides normally occur in high mountain areas, and the destruction of landmass has more negative impacts on sustainable livelihood in rural communities (Mirdda et al., 2022).
The study of landslide probability has become a mature science, with various approaches applied at regional (Guo et al., 2023), continental (Van Den Eeckhaut and Hervás, 2012), and global scales (Stanley et al., 2021), while also considering the diverse landscapes of homogeneity (Sbroglia et al., 2018) or heterogeneity (Wang et al., 2020) in specific areas. The research topic has contributed to a broader scientific understanding of the Earth’ surface processes, providing a basis for future research and innovation. Along with landslide inventories and hazard mapping, landslide susceptibility zonation indicates the probability or likelihood of a landslide occurring in a specific area based on different conditioning factors such as geology, topography, climate, land use, and human activities (Guzzetti et al., 2006). The fundamental science of landslide sensitivity has a long heritage since the pioneering research conducted in the late 1960s (Yong et al., 2022). Since the 19th century, geologists and engineers started to recognize the relationship between geology, topography, and the likelihood of landslides and then began using quantitative assessments for landslide probability zonation based on past landslide event observations (Reichenbach et al., 2018). The capabilities of the Geographic Information System (GIS) provided a promising opportunity to determine explicitly landslide-prone areas, while considering spatial relationships between both intrinsic and extrinsic factors (Nicu, 2017). Furthermore, the remote sensing data available in recent years resulted in big geospatial sources in order to construct a landslide-related geodatabase, a key point to form different GIS-based approaches for landslide-prone mapping (Scaioni et al., 2014).
Broadly speaking, predictive models of landslide predisposition can be distinguished by 1) qualitative, 2) quantitative, 3) hybrid or semi-qualitative approaches. Generally, quantitative strategies include a certain degree of objectivity compared to qualitative strategies. For quantification, there was a broad spectrum of data-driven methods, including statistics and machine learning techniques. In statistical analysis, numerous methods were applied to landslide susceptibility, mostly by frequency ratio (FR) (Nicu and Asăndulesei, 2018), Weight of Evidence (WoE) (Razavizadeh et al., 2017), Shannon entropy (SE) (Roodposhti et al., 2016), and logistic regression (LR) (Budimir et al., 2015). The technological era of artificial intelligence has witnessed a variety of machine learning-based methods, such as the traditional algorithms support vector machine (SVM), random forest (RF), and recent innovations in deep learning models (Zhang et al., 2022; Ma et al., 2023). On the other hand, semi-qualitative approaches, such as the analytic hierarchy process (AHP) (Kayastha et al., 2013), fuzzy logic (Bui et al., 2015), and weighted linear combination (WLC) (Li et al., 2022), were also recognized for their significant applications in landslide probability zonation (Tyagi et al., 2022).
As mentioned previously, for the state-of-the-art machine and deep learning models, these advanced computational intelligence methods seem to outperform conventional models. Nevertheless, there is no standard benchmark for the best modeling due to the dominant uncertainty in landslide disasters. Updated studies continued to compare the performance of different landslide sensitivity models, for instance, knowledge-based versus data-driven methods (Zhu et al., 2018), multi-criteria decision analysis (MCDA) against machine learning (Khalil et al., 2022), statistical analysis and machine learning (Ling et al., 2022), traditional machine learning and deep learning (Zhang et al., 2022), and machine learning combined with optimization algorithms (Wang et al., 2022). Apart from that, the evaluation and selection of landslide-controlling factors was also an engaging subject. Unfortunately, there was no widespread guideline for the selection of landslide conditioning factors. The challenge is each factor also contributes to landslide risk and different natural conditions in a specific area, leading to the choice of appropriate factors to comprehensively describe the study area. In general, these factors are divided into two main groups: conditioning and triggering factors (Pourghasemi et al., 2018). Taking the comparison help to identify the most informative landslide explanatory factors as well as improve the accuracy landslide susceptibility model (Gaidzik and Ramírez-Herrera, 2021; Liao et al., 2022).
One of the major challenges in the procedure of landslide probability is assigning weights to conditioning factors and subclasses inside these factors. Weighting is a process used in landslide susceptibility mapping to determine the relative importance of different components that contribute to landslide occurrence (Hodasová and Bednarik, 2021). The two main approaches for weighting are subjective and objective. Subjective weighting is mainly based on expert judgment. The approach relies on the experience and knowledge of consultants to attach weights to different factors based on their perceived importance. Objective weighting, on the other hand, is followed by mathematical calculation. Statistical models are used to determine the weights of causative factors based on their correlation with landslide occurrences. Objective estimations are generally considered more reliable than subjective approaches due to their reliance on scientific evidence while avoiding personal biases. Despite that, it is common to use a combination of both subjective and objective methods to ensure the best results (Wang et al., 2012; Zhou et al., 2016).
Located in southeast Asia, Vietnam is a region with a high frequency of landslides (Shahabi and Hashim, 2015). As a coastal country, Vietnam is directly affected by annual devastating hurricanes originating from the Pacific Ocean. Landslides are often triggered by heavy rainfall, which is primarily influenced by the tropical monsoon climate. This meteorological conditions is characterized by high temperatures and humidity throughout the year, with heavy seasonal rainfall occurring mostly from May to November, transitioning to the dry season from December to April with a high evaporation rate. With the continuous increasing trend of climate change, the frequency and magnitude of typhoons have significantly increased, leading to epic destruction caused by landslides (Gariano and Guzzetti, 2016). Therefore, landslide susceptibility zonation is one of the most crucial tasks to reduce damage to human life and property, while also supporting decision-making for future planning. Moreover, as a developing country with a remarkable increase in human population and urbanization in recent years, Vietnam faces an exacerbation of the risk of landslides and their consequences.
The literature on landslide susceptibility in Vietnam has explored various methods, including statistical techniques (Bui et al., 2015; Kieu and Ngo, 2022; Thanh et al., 2022), machine learning (Phong et al., 2021), and deep learning (Bui et al., 2020; Dao et al., 2020; Nhu et al., 2020), which have mostly been applied in the mountainous regions of the country. Unusual weather patterns have caused an increase in natural hazards that not only occur more frequently but also have greater magnitude and are expanding into coastal mountainous areas. Due to its unique geography, the Vietnamese Central region’s mainland is usually the first area affected by tropical cyclones originating in the Pacific Ocean. Among coastal provinces in Central Vietnam, Quang Nam (Pham et al., 2022), Quang Ngai (Cong et al., 2020; Long et al., 2022), and Hue (Long and De Smedt, 2018) were recently in focus for landslide-prone occurrences. Quang Binh has recently emerged as a region characterized by significant occurrence of landslides and flash floods, attributed to heavy precipitation during the rainy season, complex topography, and unstable geological features. Despite the frequency of these natural disasters, no systematic scientific investigation has yet been conducted to elucidate their underlying causes.
Based on the aforementioned perspectives, we utilized different techniques to generate landslide susceptibility maps in the coastal mountainous province Quang Binh, Vietnam. Compared to prior research, our methodology involved the integration of both the AHP and SE to reveal the better performance of the predictive model, emphasizing an underexplored approach by the synergy of both subjective and objective approaches in the landslide probability research domain. Formed by comprehensive data collections of topography, hydrology, geology, land cover conditions and anthropogenic activities, and weather, 15 independent landslide causative factors were adopted with a focus on the climate-specific spatial layer. This implies a significant impact of tropical monsoon climate on landslide events. From the exemplary area, we identified and analyzed the most influential factors, along with their respective subcategories. Our study results have significant scientific and practical implications, serving as a basis for scientific discourse and development of hazard prevention and mitigation plans focused on complex coastal mountainous regions.
Quang Binh is a coastal mountainous province located in North Central Vietnam, covering an area of approximately 8,000 km2 (Figure 1). Its geographic coordinates lie between 17°05′02″N to 18°05′12″N latitude and 105°03′55″E to 106°05′37″E longitude. The topography of Quang Binh is characterized by a narrow, west-to-east sloping landform, with hills and mountains accounting for 85% of the total natural area. The province experiences an annual rainfall of approximately 2,300 mm, with specific monthly precipitation patterns that mark seasonal transitions between dry and rainy periods. During the dry season (normally from April to August), rainfall is typically low, with the lowest value of around 44 mm in June. Conversely, in the rainy season (normally from September to March), the total amount of precipitation increases markedly, peaking at nearly 800 mm in October. Notably, based on our experience, the excessive intensity of precipitation during September and October may be a primary condition for triggering flash floods and landslides.
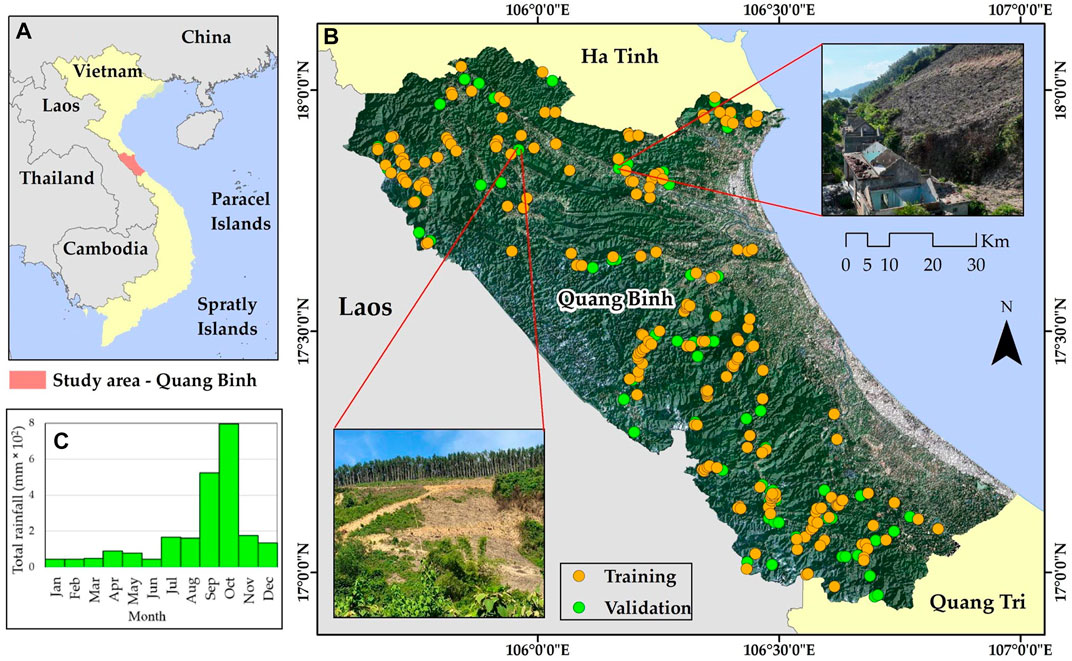
FIGURE 1. Location of the study area (A), including distribution of landslide inventory points over Sentinel-2 satellites images’ true color composite (B), and chart of mean total monthly rainfall from 2018–2021 (C).
The evolution of landscapes and geological characteristics in Quang Binh through thousands of centuries resulted in the largest cave in the world, Son Doong (Limbert et al., 2016). Moreover, the national park Phong Nha-Ke Bang was recognized by UNESCO as a World Natural Heritage site for geology and geomorphology, ecology, and biodiversity (https://whc.unesco.org/en/list/951/). Under the major land cover of tropical forests, the diversity of geological features and prevalent escarpments are also recognized as the main motivation leading to incredible landform-related hazards.
An overview of the landslide susceptibility mapping procedure is depicted in Figure 2. The mainly practiced steps are 1) landslide inventory; 2) spatial database construction of landslide conditioning factors; 3) layer reclassification and ranking the subclasses of corresponding factors using the FR method; 4) factor weighting by AHP, SE, and AHP–SE; 5) preparing landslide susceptibility mapping; and 6) model evaluation. The details of each step are further described in the following sections.
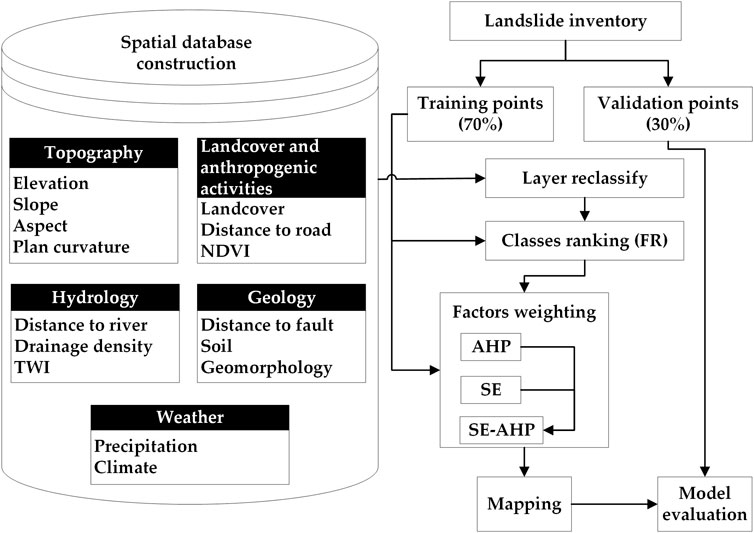
FIGURE 2. Workflow diagram for landslide susceptibility mapping.
The landslide inventory is an essential commission for GIS-based landslide susceptibility modeling (Titti et al., 2021). The quality and quantity of landslide locations have an impact on the outcome and accuracy assessment of the predictive model. Satellite images are valuable sources that support the landslide inventory, especially in mountainous regions that are difficult to access. However, dense tropical forests may present challenges and uncertainty in detecting landslide occurrences based on these remotely sensed data. Hence, taking advantage of satellite images for landslide remote detection and ground true validation is essential for enhancing the truthfulness of the landslide inventory database. In the present study, we identified 271 landslide points over the examined area, including historical destructive geological events and field investigation. The points were first sampled based on numerous geospatial resources, including high-resolution Earth Engine images, optical satellite images from Sentinel-2, and thematic maps, which were then verified in field campaigns during the rainstorm season in 2022. As illustrated in Figure 1, the dataset was split into 70% (196 points) for the training phase and 30% for validation (71 points).
In the domain of GIS-based landslide susceptibility, preparing conditioning factors in a consistent spatial database required outstanding knowledge of not only geographic accuracy but also of the various types of features to fully reflect the interest domain. To date, to select landslide-related model variables, it should be noted that there are no standard guidelines or regulations for choosing optimal factors, as these are well-defined based on the specific case and research areas. Among a plethora of causative factors relating to landslide susceptibility, we recognized 15 significant factors through state-of-the-art literature reviews (Pourghasemi et al., 2018; Reichenbach et al., 2018; Yong et al., 2022). We categorized all factors into five fundamental groups, 1) topography, 2) hydrology, 3) geology, 4) land cover conditions and anthropogenic activities, and 5) weather, as an effort to exhaustively consider the contribution of related datasets to the disaster. Continuous data layers were reclassified using Jenks natural breaks optimization, while discrete data layers were stored in unique values for further analyses. For the post-processing, the final raster layers were geometrically corrected according to the World Geodetic System (WGS), 1984, and the UTM (Universal Transverse Mercator) Zone 48°N (North), which then transformed into a 10-m resolution. Figure 3 displays the maps of all 15 factors after standardization, as mentioned previously. Detailed descriptions of each group-based conditioning factor are provided in the following sections.
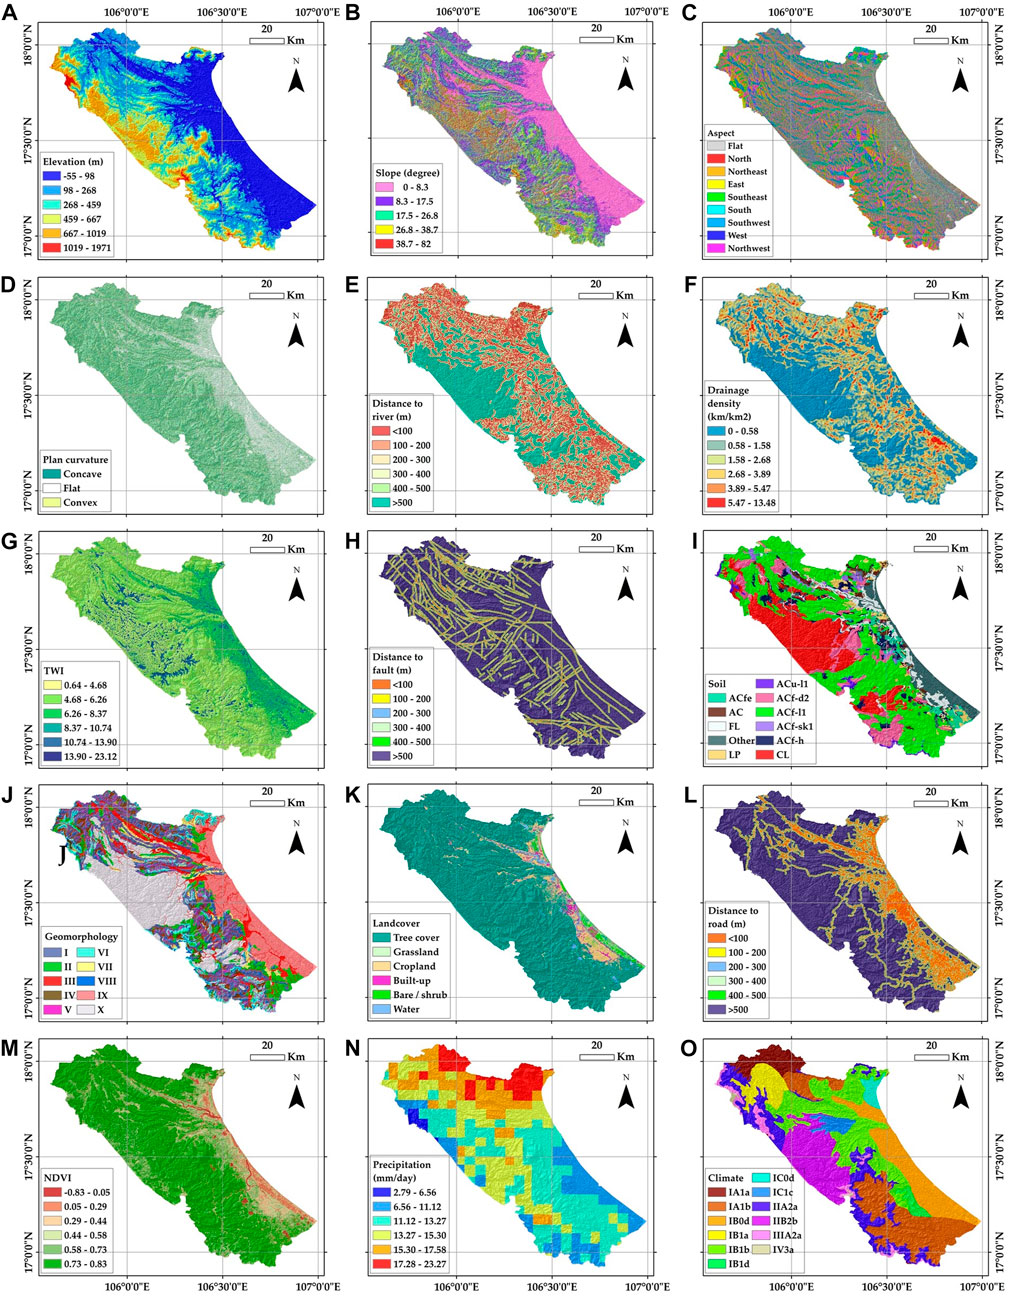
FIGURE 3. Maps of conditioning factors considered in landslide susceptibility models including (A) elevation, (B) slope, (C) aspect, (D) plan curvature, (E) distance to river, (F) drainage density, (G) TWI, (H) distance to fault, (I) soil, (J) geomorphology, (K) land cover, (L) distance to road, (M) NDVI, (N) precipitation, and (O) climate.
Topography-based components are one of the most decided characteristics related to landslide susceptibility. In this respect, we selected four remarkable factors to describe the terrain of the research area, i.e., 1) elevation, 2) slope, 3) aspect, and 4) plan curvature. To generate these topography-based factors, a digital elevation model (DEM) with an original resolution of 12.5 m was downloaded from https://asf.alaska.edu/. The DEM was generated based on products of Phased Array type L-band Synthetic Aperture Radar (PALSAR) instruments onboard the Advanced Land Observing Satellite (ALOS).
The distribution of elevation across the considered area offers an encompassing illustration of the terrain shape. Over the research area, height values extracted from the DEM ranged from −55 m under the sea level to 1,971 m above sea level due to the geographical location of the coastal mountainous region. The Jenks natural breaks optimization was applied to classify the elevation into five types. The result strongly indicates that the area is predominantly hilly, and the very high-altitude domain (>1000 m) only appears in the southeast (Figure 3A).
Slope is a crucial factor that relates to landslide triggering. Literature reviews have shown that slope is the most commonly used parameter in the field of landslide sensitivity spatial modeling (Pourghasemi et al., 2018). Although a slope of over 30° has been identified as leading to instability and an increased risk of landslides, different slope domains also require comprehensive consideration due to the unique characteristics of the specific region (Moragues et al., 2021). In the present study, spatial analysis functions were applied with input from the DEM to derive the slope. Based on the thematic map shown in Figure 3B, the slope is complex in the west and becomes flatter while transitioning to the east. It should be noted that steep slope features (>38°) only cover a small percentage (4.77%) of the total area.
We also considered the aspect of slope, which indicates the direction of each slope form. The slope aspect affects solar radiation, wind exposure, and moisture availability, resulting in different vegetation growth, soil characteristics, and local microclimates (Cellek, 2021). Understanding the slope aspect in landslide susceptibility measurements provides professional knowledge for tackling natural disasters and further planning. The visual representation of the slope aspect with a continuous range of values from 0° to 360° was divided into 10 unique classes, including north, northeast, east, southeast, south, southwest, west, northwest, and flat direction (Figure 3C).
The function of the curvature is utilized to showcase the shape of the slope, where a segment of a surface can exhibit either concavity or convexity. There are two distinct types of curvature, i.e., planform and profile. In general, the planform curvature focuses on the lateral movement of fluid flow, while the profile curvature pertains to the vertical changes in fluid flow. Here, we only focus on planform curvature as this was used more than profile curvature in detecting the probability of landslide occurrences (Pourghasemi et al., 2018). The range of values obtained by planform curvature analysis is divided into classes of concave (<−0.05), convex (>0.05), or flat (−0.05–0.05) across the surface of the study area (Figure 3D).
Hydrology plays a required role in landslide susceptibility prediction. Hydrological elements can influence the stability of the terrain and trigger landslides. Understanding the interaction between these hydrological factors and environmental characteristics can provide valuable information for landslide hazard management. By incorporating hydrological data into the landslide model and considering the dynamic nature of these factors, researchers can improve the accuracy and reliability of landslide predictive models. Therefore, different variables related to hydrology are considered in this present research, including 1) distance to river, 2) drainage density, and 3) Topographic Wetness Index (TWI).
Distance to river can affect the water content in the soil and accumulation flow. Landslide occurrences are more likely to happen in areas located near rivers, especially in mountainous regions (Pal et al., 2022). Here, Euclidean distance was applied to the river network geospatial layer and buffered into five different zones from below 100 m to more than 500 m (Figure 3E).
Apart from distance to river, drainage density refers to the amount of water draining from a certain area, and a high drainage density can indicate areas that are prone to landslides. Hydrologists recognized the vital role of drainage density in relation to a range of factors, including flash flood severity, sediment load, water concentration, and overall water balance, within a specific drainage basin (Chapter VIII Stream and Drainage Densities, 1985). Consequently, drainage density also contributed to the landslide process as one of the most significant variables representing the hydrological group setting. Figure 3F showed the distribution of six subcategories of drainage density built on the hydrological network.
Topographic wetness index, also known as the compound topographic index (CTI), was first introduced by Beven and Kirkby (1979). The index implies the effects of the spatial topographic scale on hydrological processes with the assumption of uniform soil properties. A summary of the application of the TWI was described in Sørensen et al. (2006); Pal et al. (2022) as proof of its vital role in hydrological applications. The TWI is often used to identify areas that are susceptible to landslides due to saturation-induced soil instability. To obtain the index, we applied the following equation:
where
Not paying attention to geological-related components would be a significant limitation in the systematic assessment of landslide hazards. Given the thematic layer analysis conducted over the study area, three appropriate conditioning factors were adopted, i.e., 1) distance to fault, 2) soil, and 3) geomorphology.
Geological lineaments are characterized as one of the main driving forces leading to land movements, such as active faults, earthquakes, and geomorphological formation. Particularly in landslide hazards, the presence of faults can create deformation in the surrounding rock, which can weaken the material and increase the likelihood of failure. Additionally, faults can also create pathways for water to infiltrate the rock, which can further degrade the material and increase its susceptibility to landslides (Ramli et al., 2010). Thus, we extracted the geological lineament distribution and performed Euclidean distance functions with grades of 100-m intervals. The result was then reclassified into six classes of thematic layers, as represented in Figure 3H.
The soil affects the stability of geological characteristics and, thus, unequivocally relates to landslide sensitivity. We first prepared the soil map according to the FAO/UNESCO classification. Moreover, our national database provided the map representing the details of each soil class in Acrisols due to the predominance of this group in the considered area. The final soil map includes eleven units: Epi Lithi Humic Acrisols (ACu-l1), Calcisols (CLs), Epi Lithi Ferralic Acrisols (ACf-l1), Leptosols (LPs), Endolithi Ferralic Acrisols (ACf-d2), Hapli Ferralic Acrisols (ACf-h), Ferric Acrisols (ACfe), other Acrisols (Arenic, Albic, and Plinthic) (ACs), Fluvisols (FLs), Epi Skeletic Ferralic (ACf-sk1), and other soil types (Figure 3I).
Geomorphology is also an indisputable factor influencing landslide susceptibility. The geomorphological map with ten unique characteristics was obtained from the national geodatabase. Figure 3J showed the distribution of geomorphological units including slow gravity slope (I), wash slope (II), landform with origin of stream flow (III), corroded slope (IV), the remaining surface of pediment basin (V), quick gravity slope (VI), deluvi–coluvi agglomerating slope (VII), the remaining surface of peneplain (VIII), others (IX), and karst landform (X).
For selecting candidates related to landslides, the contribution of the landcover environment and built-up infrastructures should be emphasized. Accordingly, we adopted three sensitivity factors belonging to the group of land cover conditions and anthropogenic activities, namely, 1) land cover; 2) distance to road; and 3) Normalized Difference Vegetation Index (NDVI).
A land cover map was obtained using the product of ESA WorldCover version 2.0. The classification procedure was based on both Synthetic Aperture Radar Sentinel-1 data and Sentinel-2 optical images with a resolution of 10 m globally (Zanaga et al., 2022). In our examined area, six unique classes were identified with the largest land cover class, the tree cover (84.63%), following cropland (6.22%), grassland (3.54%), water bodies (1.95%), built-up land (1.83%), and bare soil and sparse vegetation (1.83%). Figure 3K showed the distribution of land cover as mainly forest cover in hilly and mountainous areas.
Anthropogenic activities, i.e., road construction, can indeed have a significant impact on the geological structure of a large basin. With the spatial modeling of landslide sensitivity, it is necessary to consider the distribution of road networks as one of the most man-made influenced factors. Compared to plain regions with stable slopes, the pressure from concrete road constructions can be particularly intense in mountainous regions. Moreover, the presence of roadways can also imply other human activities, leading to further impact on the surrounding landscape (Pal et al., 2022). Therefore, we applied Euclidean distance estimation with an interval of 100 m. The resulting map is shown in Figure 3L.
The NDVI is also one of the indicators used to assess the density of vegetation in tropical climates. Here, we calculated the index based on the MultiSpectral Instrument (MSI) onboard Sentinel-2, as shown in Figure 3M. It should be noted that the sensor includes 12 spectral bands with resolutions ranging from 10 m to 60 m. The red and near-infrared bands (10 m) were used to obtain the NDVI using the following equation:
Two spatial layers of weather datasets related to landslide probability are 1) precipitation and 2) climate. Related to the previously mentioned factor, triggering of landslides in the tropical monsoon climate zone is often due to heavy rainfall (Funk et al., 2015). Therefore, remote sensing products of precipitation were processed through the cloud spatial computing platform Google Earth Engine using the catalog of Climate Hazards Group InfraRed Precipitation with Station Data (CHIRPS). These datasets provide daily gridded rainfall with a resolution of 0.05°. In order to focus on landslide susceptibility in rainy season, a monthly rainfall map was generated with the mean of all images collected in September 2022, the rainiest period over the research area (Figure 3N).
Climate is a long-term pattern of weather in a specific region. Furthermore, climate patterns are the main controlling parameters for the amount of precipitation. Aiming to understand the relationship between typical climates and landslides, we provided a thematic map to present the main climate patterns in detail. A description of specific climate patterns is provided in Table 1, and the map is shown in Figure 3O.
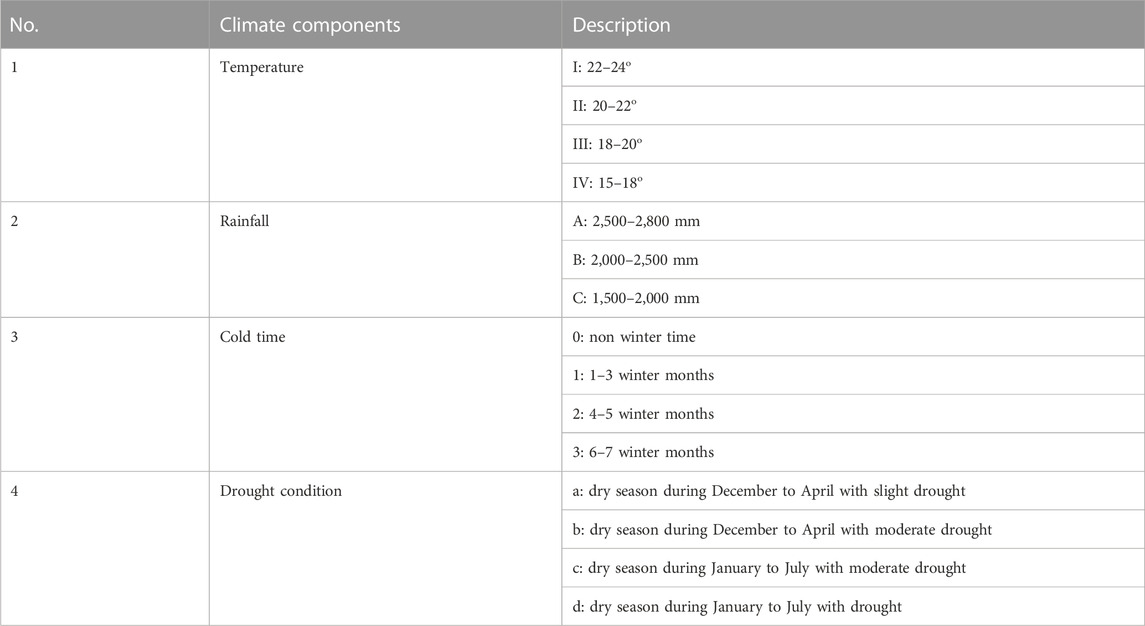
TABLE 1. Description of the climate components.
The bivariate statistical FR method was applied to estimate the landslide densities in all subclasses in each factor. The goal of this method is to compute the percentage of landslide pixels located in subcategories of all factors, correcting the associated raters to the propensity of landslide occurrences (Lee and Talib, 2005). To perform the estimation, the landslide inventory training dataset and factor maps were used for obtaining the following equations:
where i is the subclass of the considered factor j; LSi,j is the number of landslide pixels in each class; Ni,j is the number of class pixels; FRi,j is the frequency ratio; RFi,j is the relative frequency (%).
The subjective approach, AHP, was first introduced in Saaty, 1977 (1980), known as a widely used multi-criteria decision analysis that allows decision-makers to prioritize and evaluate alternative options based on multiple criteria. In the field of critical landslide area assessment, this method provides a robust, yet simple to handle, complex decision-making problems. It is based on the principle of pairwise comparison, where the relative importance of a criterion is assessed in relation to others. Here, the AHP was implemented by a subjective hierarchical structure that contains 15 landslide causative factors. Based on judgments of multidisciplinary experts who collaborated with local officers, pairwise comparisons are then made to determine their relative importance. These comparisons are repeated at each level of the hierarchy until an acceptance consistency ratio is obtained, indicating that the criteria are consistent with others. The final step involves combining the pairwise comparisons to calculate the overall weight of individual factors. The metrics in the process, including Consistency Index (CI) and Consistency Ratio (CR), were estimated according to the following equation:
where
Initially proposed by Shannon (1948), SE is a well-established information theory-based method. The basic idea is to give more weight to events that have higher entropy, as they contain more uncertainty and information, and less weight to events with lower entropy. Mainly based on ready-to-use data, the SE formula measures the average amount of information contained in a dataset, and the weights are derived from these entropy values. In risk assessment, the entropy of a hazard event can be used to determine its likelihood and potential impact. Events with higher entropy carry more uncertainty and, therefore, have a higher risk associated with them. Here, we computed the entropy of landslide susceptibility based on the distribution of detected landslides in the training dataset to the contributing factors. SE weighting was estimated using the following equations (Roodposhti et al., 2016; Agrawal and Dixit, 2022):
where i is the subclass of the considered factor j, m is the number of subclasses in each conditioning factor, n is the number of conditioning factors (n = 15), Pij is the probability density, FRij is the frequency ratio, Ej is the entropy value, and
The synergy of both objective and subjective approaches may enhance the performance of the model and mitigate issues related to the ill-posedness. Therefore, the data-driven method SE and knowledge-based method AHP were integrated to derive the combined weights for each of 15 conditioning factors, as seen in the following equation (Wang and Zhang, 2018):
where
To retrieve the landslide susceptibility index, a summation of the product of rating subclasses and respective weights of each conditioning factor is given by the following equation:
where n is the number of landslide conditioning factors (n = 15); Wj is the factor weight obtained by the corresponding methods of AHP, SE, and AHP–SE; and Rj is the two-dimensional matrix of factor j that has been reassigned to the RF. The continuous range value of the landslide susceptibility index is divided into five probability categories, namely, very low, low, moderate, high, and very high, using the natural breaks Jenks function.
The performance of various models was evaluated using the receiver operating characteristic (ROC) curve. The primary statistical metrics employed to measure the model accuracy are true positive rate (TPR), false positive rate (FPR), and AUC. The TPR, also referred to as sensitivity, reflects the proportion of correctly classified positive cases among all positive cases, while the FPR, also known as specificity, measures the likelihood of a true negative case being classified as negative. The AUC spans from 0 to 1. A retrieval value of the AUC closer to 1 results in the better performance of the model:
where true positive (TP) and true negative (TN) are the values of correct landslide and non-landslide pixels, respectively; true negative and false positive (FP) are the values of incorrect landslide and non-landslide pixels, respectively; P and N are the corresponding total number of landslide and non-landslide pixels.
We also estimate the relative landslide density index to evaluate the performance of different models in each landslide-sensitive zone, using the following equation:
where ni and Ni are the numbers of landslide pixels and total pixels in each susceptibility class, respectively.
Table 2 showed the FR and RF calculated for subclasses in landslide-controlling factors. By considering the quantity relationship between training points (196 points) that appeared in each subcategory (total of 79,865,948 pixels), higher FR values indicate higher sensitivity of a class to landslide occurrence compared to the remaining classes within a predisposing factor. It should be noted that even if a particular subclass has a small number of landslide inventory points, the FR value may still be high. This can occur when the percentage of pixels in the subclass is low relative to the total number of pixels in the thematic layer. The calculated RF (%) values were then assigned to reclassify thematic maps of all 15 causative factors as input for the landslide susceptibility model.
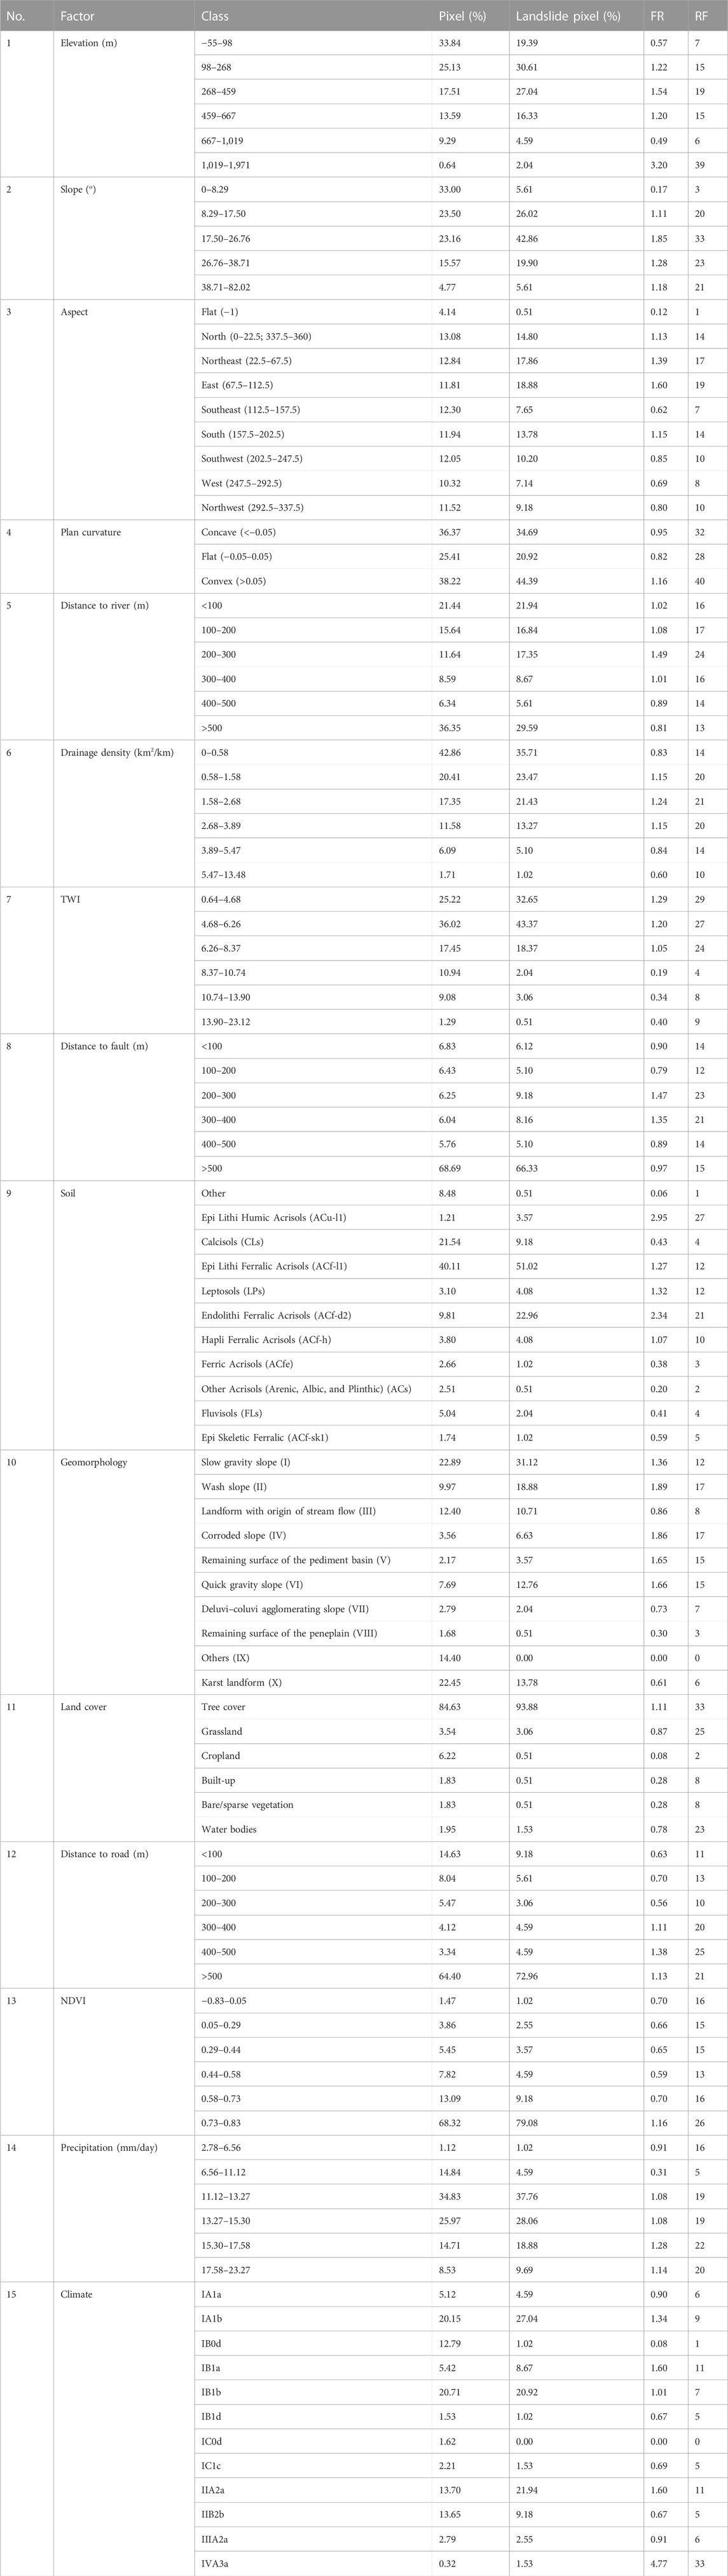
TABLE 2. Results of the frequency ratio for subclass weighting for the 15 causative factors used in the model.
Regarding topographical groups, the highest elevation ranging from 1,019 m to 1,971 m, slope degree of 17.5–26.8o, east slope aspect, and convex plan curvature (>0.05) were determined as the most influential subclasses. In case of the group set by hydrological variables, distance to rive spanning 200–300 m, drainage density between 1.6 and 2.7 km2/km, and the range of the TWI of 0.6–4.7 become more sensitive compared to other corresponding subcategories. The soil of Epi Lithi Humic Acrisols (ACu-l1), wash slope and corroded slope, and 400–500 m proximity to the fault gave the most pressure in the geological group. The group of land cover conditions and anthropogenic activities witnessed the most significant susceptibility in subclasses of tree cover, distance to road of 400–500 m, and a range value of the NDVI, approximately 0.7 – 0.8. Last, weather-based components estimated the rainfall amount on average of 15.6–23.3 mm/day, and two climate patterns (IB1a and IIA2a) are the most impact subcategories contributing to the landslide probability.
Table 3 represented the AHP order matrix for 15 conditioning factors, with a range of positive integer values from 1 to 7 applied for comparison among these aforementioned criteria. The achieved metrics
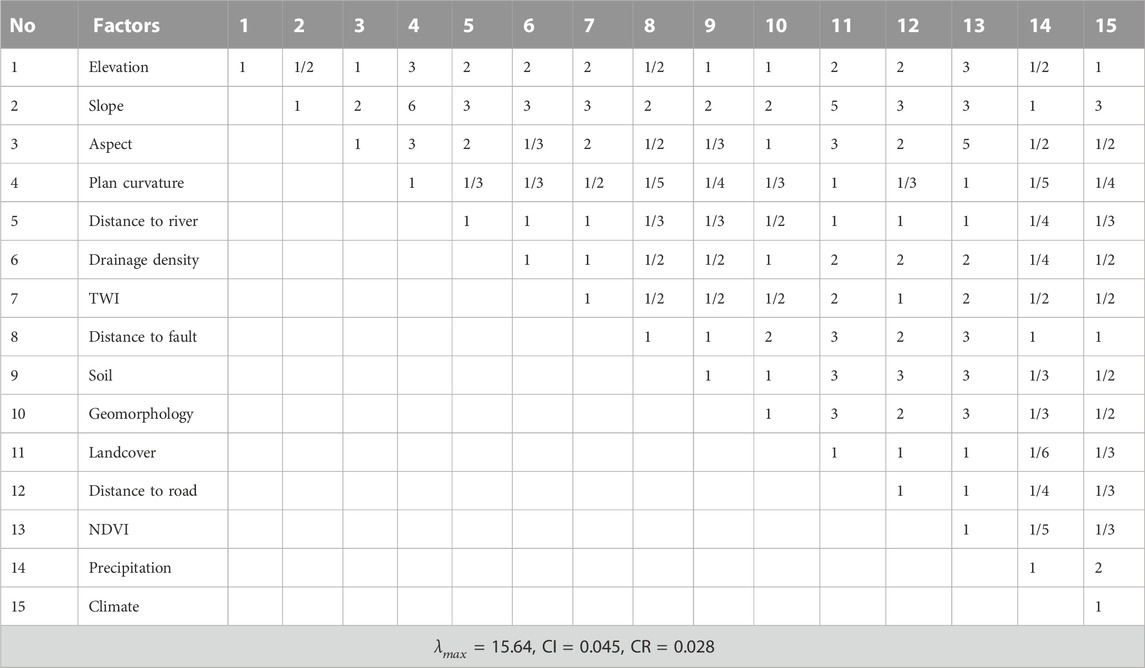
TABLE 3. Pairwise comparison matrix built on AHP method (
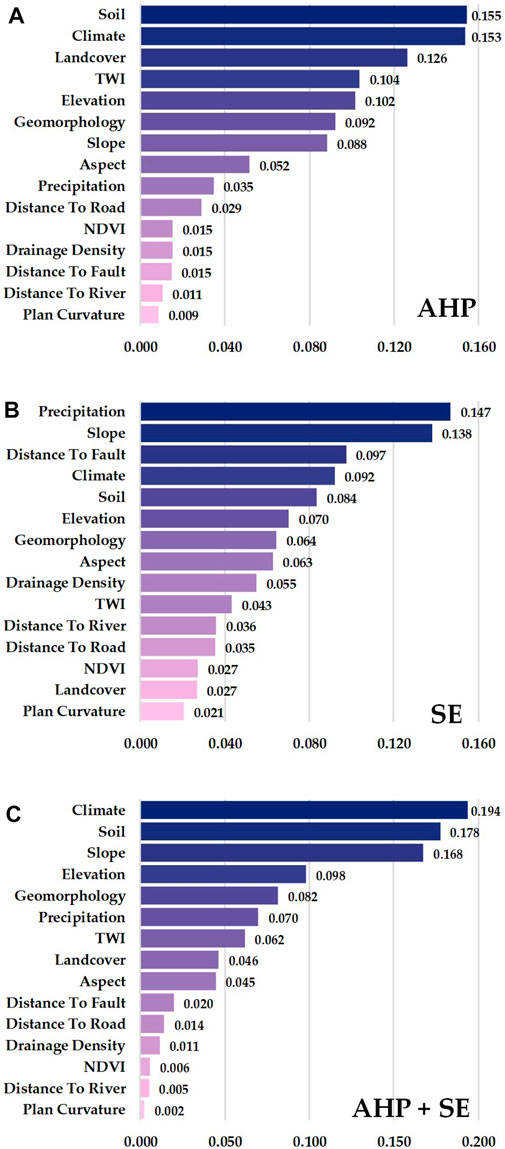
FIGURE 4. Assigned weight for (A) subjective-based AHP, (B) objective-based SE, and (C) integrated AHP and SE.
Figure 5 illustrated the distribution of landslide sensitivity using the AHP, SE, and the synergy of these two methods. The maps clearly demonstrated that the most sensitive landslides are located along the Truong Son mountain range in Vietnam, stretching from the northwest to the southeast. In contrast, coastal areas showed a very low to low proportion of landslide occurrences. The polar chart (Figure 5D) summarized the statistics area of the five levels of landslide susceptibility based on AHP, SE, and the integrated approach. Overall, the major landslide-prone areas belong to the high level in all three methods, on average, accounting for nearly a quarter of the total study area. In particular, the AHP method showed the highest percentage (29.83%) of the high landslide-prone category, while the SE method exhibited slightly different proportions for high and very high levels, i.e., 28.76% and 26.05%, respectively. The combined approach AHP–SE resulted in 28.97% for high risk and 21.93% for very high risk zones. The figures for moderate risk of landslide trigger in the three methods appeared to be similar, with negligible differences in area percentage, ranging from the lowest 21.32% (AHP) to the highest 22.70% (SE).
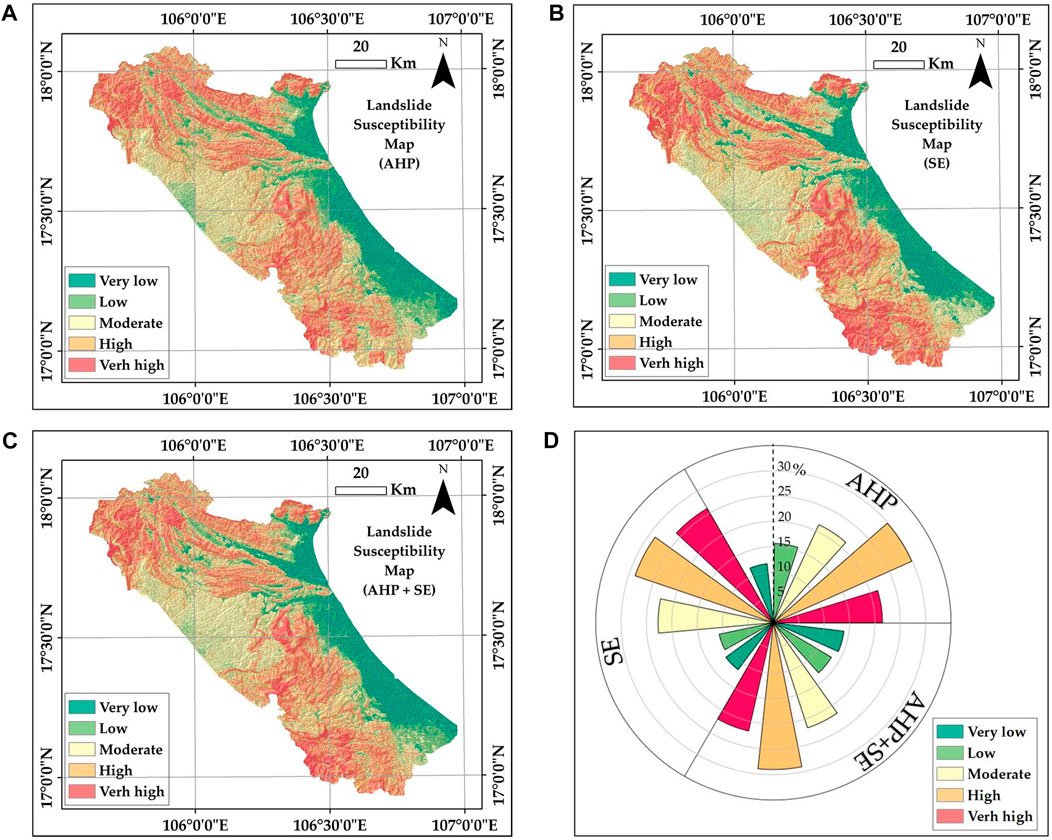
FIGURE 5. Maps of landslide susceptibility obtained by the methods of (A) AHP, (B) SE, (C) integration of SE and AHP, and (D) percentage area representing landslide sensitivity levels following corresponding methods.
Looking into the classes of low and very low susceptibility, it is evident that these classes resulted in the smallest percentage of the susceptibility area compared to the three remaining categories. In the SE, approximately 11% of the natural area was identified as having the least landslide probability, and the number remains unchanged for the level of low sensitivity. Using the AHP model, the proportions of very low and low levels were found to be 11.71% and 15.65% of the total area, respectively, whereas 14% and 13.30% of the area are shown in very low and low landslide susceptibility degrees according to the combined method AHP-SE. In comparison to categories of the high landslide sensitivity class, the statistical data for the level of very low susceptibility revealed significantly lower values, i.e., only one-third of the values obtained through the AHP and the SE method and half the number of the high landslide sensitivity class identified through the AHP–SE method. By comparing these three methods, the statistics strongly suggest that the examined area exhibited landslide predisposition mostly at high and very high levels.
Figure 6 summarized the performance of the SE, AHP, and the AHP–SE method for landslide susceptibility mapping based on ROC curves with AUC values and R-index for landslide probability levels. Overall, all three models were reliable, with the AUC higher than the random guess (0.5) and classified as a very good prediction (AUC ranging from 0.8–0.9). Interestingly, the integrated AHP–SE method outperformed both the two individual methods, with the AUC reaching the highest score of well over 0.87. Objective-based SE was better than subjective-based AHP, i.e., AUC values are nearly 0.85 and 0.81, respectively. Compared to the lowest AUC derived from the AHP, the synergy of the objective and subjective weighting method, AHP–SE, led to a notable improvement in the landslide susceptibility model by approximately 7%. The R-index derived for very high landslide sensitivity levels in AHP, SE, and AHP–SE maps is ̉63.35%, 71.09%, and 78.41%, respectively, indicating the best prediction of AHP–SE models.
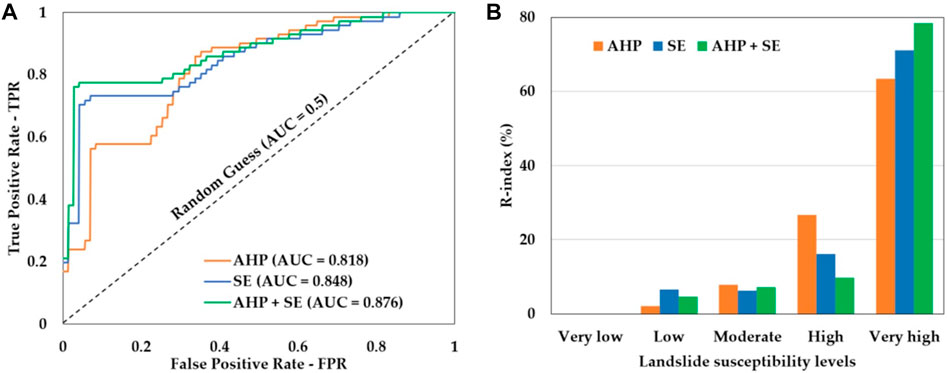
FIGURE 6. Performance of SE, AHP, and the integrated approach AHP–SE for landslide susceptibility mapping through (A) ROC curves with AUC values and (B) R-index of five landslide sensitivity categories.
Out of the 15 selected factors, the weighting approach subjectively and objectively resulted in different relative importance levels. For knowledge-based weighting using AHP, confirmation for the most important factor, slope, was also found in different case studies (Kayastha et al., 2013; Mondal and Maiti, 2013; Moragues et al., 2021; Agrawal and Dixit, 2022; Khalil et al., 2022). Slope is a widely used variable in the field of landslide hazard zonation (Pourghasemi et al., 2018; Reichenbach et al., 2018). Notwithstanding, its importance in relation to landslide sensitivity may vary depending on the specific circumstance. Recent research settings on different characteristics of the area found other factors to be more influential, such as land use (Guo et al., 2023) and lithology (Yalcin, 2008; Pourghasemi et al., 2013). Particularly in the tropical climate region, precipitation was recognized as the most significant component related to landslide sensitivity (Shahabi and Hashim, 2015). Related to the data-driven methods, the results indicated that calculation based on SE gave the most important factors of soil. It was also confirmed by the same method (Devkota et al., 2013; Agrawal and Dixit, 2022). For the integrated model, climate was the most influential factor in the landslide susceptibility model, especially in tropical monsoon areas. The factor was rarely used due to data availability and it is unnecessary in some general case studies. Here, we aimed to highlight the impact of the typical climate form under tropical monsoon areas as one of the key variables leading to the high degree of landslide triggers. An updated global map of landslide sensitivity strongly suggested that Southeast Asia, with its classical tropical environment, has one of the most frequent landslide occurrences (Stanley et al., 2021).
We also have a deep insight into the contribution of different landslide conditioning factors, which allows us to suggest the necessary datasets in regions with the same environmental conditions. Based on the AHP method, our subjective knowledge indicated that the top five important factors are soil, climate, land cover, TWI, and elevation. The AHP-based results suggested that each fundamental group contains at least one factor with a significant contribution to the landslide hazard predictive model. However, approaching data-based statistics, the SE method has shown that precipitation, slope, distance to fault, climate, and soil were estimated as the highest weight factors. For the combined AHP–SE, climate, soil, slope, elevation, and geomorphology become the highest weight factors of the landslide-prone predictive model. Considering both individual and integrated methods, two groups of land cover conditions and anthropogenic activities and hydrology contributed the least to the landslide susceptibility model. This is a confirmation for the most essential group of weather, topography, and geology compared to the two remaining groups of hydrology and natural–artificial conditions. The topography group also contained the most significant factor, slope, and the least important factor, plan curvature, in all the three methods.
It should be noted that subclasses in conditioning factors significantly affect the results of landslide susceptibility modeling, especially for high-weight factors. Figure 7 represented the percentage of landslide inventory validation recorded in each specific subclass, which analyzed the relationship between landslide occurrence and different subclasses in causal factors. In summary, the sensitivity of landslide over the case study area was observed mostly in hilly areas (98–268 m), steep slopes (18–27o), slope aspects of east and northeast, both concave and convex of planform curvature, distance to river under 100 m, drainage density below 0.58 km2/km, TWI ranging from 0.64 to 6.26, distance to fault higher than 500 m, soil class of Epi Lithi Ferralic Acrisols, geomorphology landform of slow gravity slope, land cover of tree cover, distance to road higher than 500 m, high NDVI values, daily rainfall spanning between 11.1 and 13.3 mm/day, and the climate form of tropical monsoon climate Ia1b separated by dry seasons (high temperature and moderator drought) and rainy seasons (from May to November with the total amount of precipitation 2,500–2,800 mm).
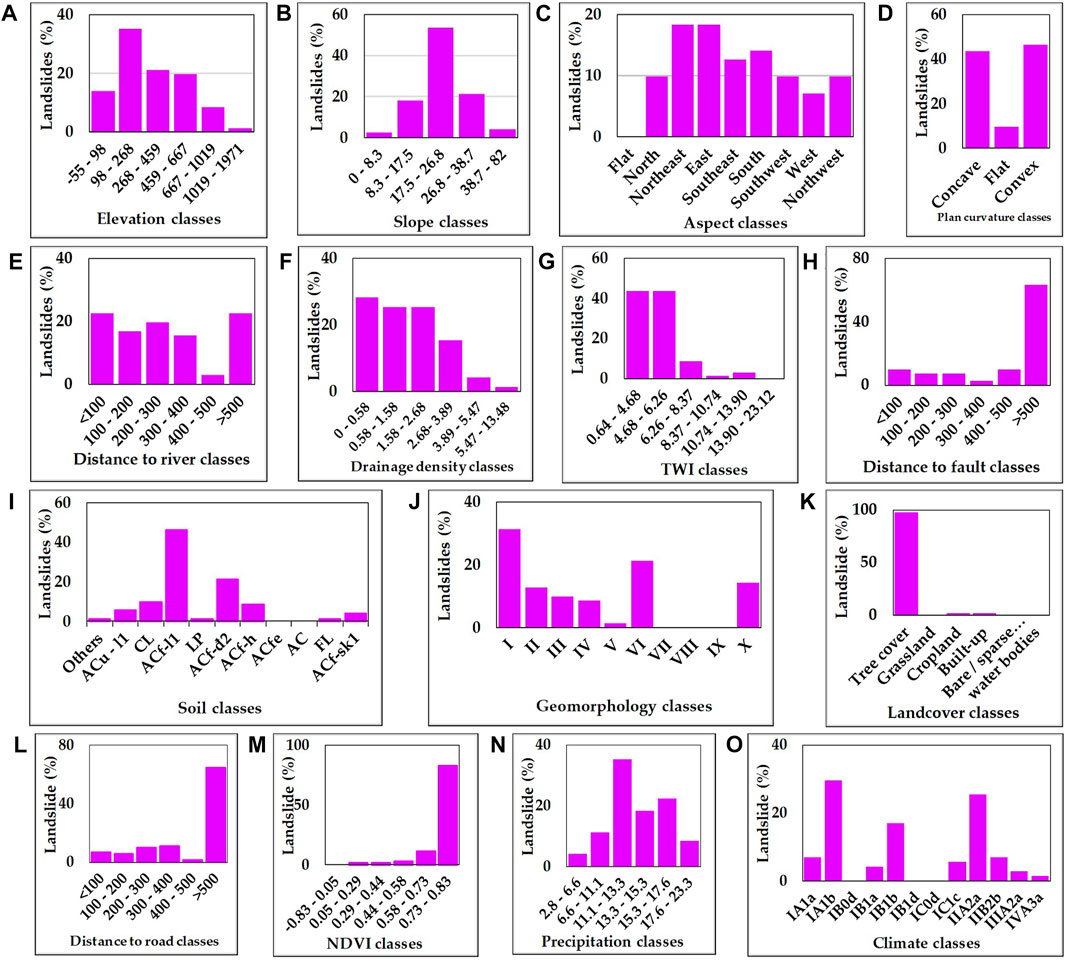
FIGURE 7. Percentage of landslide validation data based on each subclass of fifteen considered factors: (A) elevation; (B) slope; (C) aspect; (D) plan curvature; (E) distance to river; (F) drainage density; (G) TWI; (H) distance to fault; (I) soil; (J) geomorphology; (K) landcover; (L) distance to road; (M) NDVI, (N) precipitation; and (O) climate.
Among the followed methods, AHP is one of the most common techniques due to its easy approach and implementation (Tyagi et al., 2022). Even with the subjective limitation, AHP was still conducted in many applications of case studies (Pourghasemi et al., 2018; Yong et al., 2022). The method applied in our study was less accurate than the SE, with no significant difference, however. Previous experiences also confirmed the slightly lower performance than that of data-driven methods such as statistical analysis (Panchal and Shrivastava, 2021) and machine learning models (Khalil et al., 2022). Nonetheless questions about the requirement of expert knowledge contributing to the landslide susceptibility model still remained, with the continuous proposal for different combined approaches. Various studies demonstrated a better performance by integration of AHP with different strategies, i.e., WLC (Hung et al., 2016), FR (Mondal and Maiti, 2013), fuzzy (Agrawal and Dixit, 2022), and evidential belief function (EBF) (Althuwaynee et al., 2014). Furthermore, incalculable fluctuation of changing climate leads to ill-posed problems, while depending individually on data-driven methods (Gariano and Guzzetti, 2016; Zêzere et al., 2017), thus emphasizing the necessity of knowledge-based contribution in diverse landslide susceptibility models.
On the other hand, the objective-based weighting approach, SE, predicted better landslide sensitivity than the AHP with the confirmation of all the mentioned accuracy metrics. The method was applied in numerous works as demonstrated for the best model while being compared to LR (Devkota et al., 2013), Bayesian conditional probability model (Pourghasemi et al., 2012), AHP (Panchal and Shrivastava, 2021), statistical information value (Singh et al., 2021), and FR (Jaafari et al., 2014). These techniques employ mathematical models to determine criteria weights without incorporating the subjective preferences of decision-makers, thereby avoiding the potential influence of personal bias on the final decision outcome. Despite the fact that weights assigned by the relationship of history landslide records and thematic layers are explicit and objective, the method is affected by the resolution of spatial explanatory factors and both the quality and quantity of landslide inventory data (Zêzere et al., 2017).
In the light of various combined methods, we deployed the synergy of AHP and SE, as noticed for the lack of a combination in the field of landslide susceptibility assessment. Generally, both of the proposal weighting approaches have self-advantages and disadvantages. The SE is based on objective data, while the field dataset of landslide occurrences and the detail or resolution of the thematic layers affect the performance of the predictive process. The AHP is based on subjective decisions that may have the tendency of following rigid perspectives or epistemic uncertainty. To overcome the disadvantages and yield advantages in both the methods, we integrated subjective and objective approaches to deliver an optimal weight for each corresponding landslide-controlling factor. Statistical metrics of the AHP–SE method were revealed in this research. The performance of the combined approach was demonstrated to be more accurate compared to that of AHP and SE, thus increasing the reliability of the predictive model.
In the present study, we involved 15 factors in an effort to consider the entire prevalent landslide-predisposing aspects of topography, geology, hydrology, land cover environment and anthropogenic activities, and weather. However, it is hard to confirm the best selection of conditioning factors as the task is a major challenge in hazard prediction modeling. Among hundreds of factors (with their original name) used in the landslide susceptibility, more than 23 factors were mostly used (Reichenbach et al., 2018). Analysis of studies during 2005–2016 also indicated the same number of factors used more than 30 times (Pourghasemi et al., 2018). Due to the unavailability of standard guidelines to select the most effective factors, the optimal factors are mainly based on landslide type, examined area conditions, methods applied in available data, and scale requirements (Pourghasemi et al., 2018). The accuracy of models by adopting different factors was demonstrated by Gaidzik and Ramírez-Herrera (2021). Therefore, future implementation should involve quantitative analysis to suggest the most significant factors and to improve our profound understanding of how predisposing factors affected landslide susceptibility.
The geospatial data DEM is the main source used to generate different landslide-related spatial products such as slope, aspect, and curvature. Although various studies confirmed the unimpacted topographic product resolution on the performance of landslide susceptibility models (Tian et al., 2008; Chen et al., 2020), suggestions for the most congruous raster pixel size of the DEM were also discussed in detail. Gaidzik and Ramírez-Herrera (2021) indicated that a finer resolution of topographic data leads to better prediction; however, the quantity and quality of input data seem to be important with lower resolution. Lee et al. (2004) concluded that the proper resolution of 30 m, while constructing the map with scales ranging from 1:5,000 to 1:50,000 (Tian et al., 2008), implied that for a changed study area, the size decided the meaningful spatial resolution, while also mentioning that flat, ridge, and slope foot terrain shape is more difficult to predict than landslide probability in the case of lower DEM resolution. In addition, the choice of suitable methods is also mentioned, for instance, the FR applied in low-resolution products seemed to be better than the entropy-based method and WoE (Chen et al., 2020), or the AHP is appropriate in the medium-resolution scale (1:250,000–1:25,000) (Yong et al., 2022). Therefore, further analysis needs to be considered for calculating the spatial resolution of topographic products in specific conditions of the area and for selecting the most suitable input data, methodologies, and map scale results.
Apart from the proposed methods already applied in this study, further experiments should attempt to continue accessing different methods including statistics, expert-based methods, artificial intelligence solutions, and a synergy of these methods to choose the most suitable approach (Chakrabortty et al., 2022). Big data also leads to the uncertainty of traditional methods due to the complex analysis process. Combining advanced high-performance machine learning and deep learning models with big geospatial data may help in resolving complicated issues and significantly improving the performance of the landslide model. This could be a potential solution for the transferability of accurate landslide susceptibility models over different areas and for temporal analysis.
Our study demonstrated the successful prediction of landslide sensitivity over a Vietnamese coastal mountainous area through the subclass weighting FR and factor weighting of AHP and SE on 15 independent landslide-causative factors. By combining subjective and objective approaches, we improved the performance of the predictive model and provided statistical evidence to support our findings. Under the perspective of integrating expert-based knowledge and data-driven methods, we also emphasized the importance of considering climate patterns in tropical monsoon areas when assessing landslide susceptibility. Sensitivity analysis indicated the most impacted subclass for individual landslide causative variables, providing valuable insights for the considered area. Notwithstanding the proposed methods, it showed a promising solution; further research is needed to improve our understanding related to the influences of different conditioning factors, input spatial factors, data sampling methods, advanced techniques, and model transferability for large-scale spatiotemporal analysis. The research contributed to the field of GIS-based landslide sensitivity zonation in Vietnam, enabling the potential for early warning of disastrous hazards and mitigation efforts based on not only knowledge but also statistical evidence, especially in the context of uncertain future climate changes.
The raw data supporting the conclusion of this article will be made available by the authors, without undue reservation.
Conceptualization: NB and PHa; methodology: PHa, NB, and GT; software: PHg and GT; data curation: NB, GT, and PHg; investigation: PHa, NT, and NB; formal analysis: GT and PHg; writing—original draft preparation: PHa, NT, PHg, GT, and NB; writing—review and editing: PHa and NB. All authors contributed to the article and approved the submitted version.
This research was funded by the grant number CT0000.10/21-23.
This research was supported by the project CT0000.10/21-23. The authors thank the Vietnam Academy of Science and Technology (VAST) for funding the research project, grant number CT0000.10/21-23.
The authors declare that the research was conducted in the absence of any commercial or financial relationships that could be construed as a potential conflict of interest.
All claims expressed in this article are solely those of the authors and do not necessarily represent those of their affiliated organizations, or those of the publisher, the editors, and the reviewers. Any product that may be evaluated in this article, or claim that may be made by its manufacturer, is not guaranteed or endorsed by the publisher.
Agrawal, N., and Dixit, J. (2022). Assessment of landslide susceptibility for Meghalaya (India) using bivariate (frequency ratio and Shannon entropy) and multi-criteria decision analysis (AHP and fuzzy-AHP) models. All Earth 34, 179–201. doi:10.1080/27669645.2022.2101256
Althuwaynee, O. F., Pradhan, B., Park, H. J., and Lee, J. H. (2014). A novel ensemble bivariate statistical evidential belief function with knowledge-based analytical hierarchy process and multivariate statistical logistic regression for landslide susceptibility mapping. Catena (Amst) 114, 21–36. doi:10.1016/j.catena.2013.10.011
Beven, K. J., and Kirkby, M. J. (1979). A physically based, variable contributing area model of basin hydrology/Un modèle à base physique de zone d'appel variable de l'hydrologie du bassin versant. Hydrol. Sci. Bull. 24, 43–69. doi:10.1080/02626667909491834
Budimir, M. E. A., Atkinson, P. M., and Lewis, H. G. (2015). A systematic review of landslide probability mapping using logistic regression. Landslides 12, 419–436. doi:10.1007/s10346-014-0550-5
Bui, D. T., Pradhan, B., Revhaug, I., Nguyen, D. B., Pham, H. V., and Bui, Q. N. (2015). A novel hybrid evidential belief function-based fuzzy logic model in spatial prediction of rainfall-induced shallow landslides in the Lang Son city area (Vietnam). Geomatics, Nat. Hazards Risk 6, 243–271. doi:10.1080/19475705.2013.843206
Bui, D. T., Tsangaratos, P., Nguyen, V. T., Liem, N. V., and Trinh, P. T. (2020). Comparing the prediction performance of a Deep Learning Neural Network model with conventional machine learning models in landslide susceptibility assessment. Catena (Amst) 188, 104426. doi:10.1016/j.catena.2019.104426
Cellek, S. (2021). “The effect of aspect on landslide and its relationship with other parameters,” in Landslides. Rijeka: IntechOpen). Editors Y. Zhang, and Q. Cheng Ch. 2. doi:10.5772/intechopen.99389
Chakrabortty, R., Pal, S. C., Roy, P., Saha, A., and Chowdhuri, I. (2022). Novel ensemble approach for landslide susceptibility index assessment in a mountainous environment of India. Geocarto Int. 37, 13311–13336. doi:10.1080/10106049.2022.2076924
Chapter VIII Stream and Drainage Densities (1985). Chapter VIII stream and drainage densities. Dev. Water Sci. 101, 135–153. doi:10.1016/s0167-5648(08)70420-9
Chen, Z., Ye, F., Fu, W., Ke, Y., and Hong, H. (2020). The influence of DEM spatial resolution on landslide susceptibility mapping in the Baxie River basin, NW China. Nat. Hazards 101, 853–877. doi:10.1007/s11069-020-03899-9
Cong, N. C., Binh, N. Q., and Phuoc, V. N. D. (2020). “Landslide susceptibility mapping by combining the analytical hierarchy process and regional frequency analysis methods: A case study for quangngai province (vietnam),” in Apac 2019 - proceedings of the 10th international conference on asian and pacific coasts. doi:10.1007/978-981-15-0291-0_180
Dao, D. V., Jaafari, A., Bayat, M., Mafi-Gholami, D., Qi, C., Moayedi, H., et al. (2020). A spatially explicit deep learning neural network model for the prediction of landslide susceptibility. Catena (Amst) 188, 104451. doi:10.1016/j.catena.2019.104451
Devkota, K. C., Regmi, A. D., Pourghasemi, H. R., Yoshida, K., Pradhan, B., Ryu, I. C., et al. (2013). Landslide susceptibility mapping using certainty factor, index of entropy and logistic regression models in GIS and their comparison at Mugling-Narayanghat road section in Nepal Himalaya. Nat. Hazards 65, 135–165. doi:10.1007/s11069-012-0347-6
Froude, M. J., and Petley, D. N. (2018). Global fatal landslide occurrence from 2004 to 2016. Nat. Hazards Earth Syst. Sci. 18, 2161–2181. doi:10.5194/nhess-18-2161-2018
Funk, C., Peterson, P., Landsfeld, M., Pedreros, D., Verdin, J., Shukla, S., et al. (2015). The climate hazards infrared precipitation with stations - a new environmental record for monitoring extremes. Sci. Data 2, 150066. doi:10.1038/sdata.2015.66
Gaidzik, K., and Ramírez-Herrera, M. T. (2021). The importance of input data on landslide susceptibility mapping. Sci. Rep. 11, 19334. doi:10.1038/s41598-021-98830-y
Gariano, S. L., and Guzzetti, F. (2016). Landslides in a changing climate. Earth Sci. Rev. 162, 227–252. doi:10.1016/j.earscirev.2016.08.011
Guo, Z., Tian, B., Li, G., Huang, D., Zeng, T., He, J., et al. (2023). Landslide susceptibility mapping in the Loess Plateau of northwest China using three data-driven techniques-a case study from middle Yellow River catchment. Front. Earth Sci. (Lausanne) 10. doi:10.3389/feart.2022.1033085
Guzzetti, F., Reichenbach, P., Ardizzone, F., Cardinali, M., and Galli, M. (2006). Estimating the quality of landslide susceptibility models. Geomorphology 81, 166–184. doi:10.1016/j.geomorph.2006.04.007
Highland, L. M., and Bobrowsky, P. (2008). The landslide Handbook - a guide to understanding landslides. Reston, VA: US Geological Survey Circular.
Hodasová, K., and Bednarik, M. (2021). Effect of using various weighting methods in a process of landslide susceptibility assessment. Nat. Hazards 105, 481–499. doi:10.1007/s11069-020-04320-1
Hung, L. Q., Van, N. T. H., Duc, D. M., Ha, L. T. C., Van Son, P., Khanh, N. H., et al. (2016). Landslide susceptibility mapping by combining the analytical hierarchy process and weighted linear combination methods: A case study in the upper lo river catchment (vietnam). Landslides 13, 1285–1301. doi:10.1007/s10346-015-0657-3
Jaafari, A., Najafi, A., Pourghasemi, H. R., Rezaeian, J., and Sattarian, A. (2014). GIS-based frequency ratio and index of entropy models for landslide susceptibility assessment in the Caspian forest, northern Iran. Int. J. Environ. Sci. Technol. 11, 909–926. doi:10.1007/s13762-013-0464-0
Kayastha, P., Dhital, M. R., and De Smedt, F. (2013). Application of the analytical hierarchy process (AHP) for landslide susceptibility mapping: A case study from the tinau watershed, west Nepal. Comput. Geosci. 52, 398–408. doi:10.1016/j.cageo.2012.11.003
Khalil, U., Imtiaz, I., Aslam, B., Ullah, I., Tariq, A., and Qin, S. (2022). Comparative analysis of machine learning and multi-criteria decision making techniques for landslide susceptibility mapping of Muzaffarabad district. Front. Environ. Sci. 10. doi:10.3389/fenvs.2022.1028373
Kieu, L. Q., and Ngo, G. V. (2022). Landslide susceptibility assessment for warning of dangerous areas in Tan Uyen district, Lai Chau province, Vietnam. Geogr. Ann. Ser. A, Phys. Geogr. 104, 183–200. doi:10.1080/04353676.2022.2091915
Lee, S., Choi, J., and Woo, I. (2004). The effect of spatial resolution on the accuracy of landslide susceptibility mapping: A case study in boun, korea. Geosciences J. 8, 51–60. doi:10.1007/BF02910278
Lee, S., and Talib, J. A. (2005). Probabilistic landslide susceptibility and factor effect analysis. Environ. Geol. 47, 982–990. doi:10.1007/s00254-005-1228-z
Li, H., Mao, Z., Sun, J., Zhong, J., and Shi, S. (2022). Landslide susceptibility mapping using weighted linear combination: A case of gucheng town in ningxia, China. Geotechnical Geol. Eng. 41, 1247–1273. doi:10.1007/s10706-022-02333-0
Liao, M., Wen, H., and Yang, L. (2022). Identifying the essential conditioning factors of landslide susceptibility models under different grid resolutions using hybrid machine learning: A case of wushan and wuxi counties, China. Catena (Amst) 217, 106428. doi:10.1016/j.catena.2022.106428
Limbert, H., Limbert, D., Hieu, N., Phái, V. V., Kinh Bac, D., Phuong, T. H., et al. (2016). The discovery and exploration of hang Son Doong. Bol. Geol. Min. 127.
Ling, S., Zhao, S., Huang, J., and Zhang, X. (2022). Landslide susceptibility assessment using statistical and machine learning techniques: A case study in the upper reaches of the minjiang river, southwestern China. Front. Earth Sci. (Lausanne) 10. doi:10.3389/feart.2022.986172
Lombardo, L., Tanyas, H., and Nicu, I. C. (2020). Spatial modeling of multi-hazard threat to cultural heritage sites. Eng. Geol. 277, 105776. doi:10.1016/j.enggeo.2020.105776
Long, D. V., Cong, N. C., Cuong, N. T., Binh, N. Q., and Phuoc, V. N. D. (2022). “An assessment of terrain quality and selection model in developing landslide susceptibility map – a case study in mountainous areas of Quang Ngai province, vietnam,” in Lecture notes in mechanical engineering. doi:10.1007/978-981-16-3239-6_75
Long, N. T., and De Smedt, F. (2018). Analysis and mapping of rainfall-induced landslide susceptibility in A luoi district, thua thien Hue province, vietnam. WaterSwitzerl. 11, 51. doi:10.3390/w11010051
Ma, W., Dong, J., Wei, Z., Peng, L., Wu, Q., Wang, X., et al. (2023). Landslide susceptibility assessment using the certainty factor and deep neural network. Front. Earth Sci. (Lausanne) 10. doi:10.3389/feart.2022.1091560
Mirdda, H. A., Bera, S., and Chatterjee, R. (2022). Vulnerability assessment of mountainous households to landslides: A multidimensional study in the rural himalayas. Int. J. Disaster Risk Reduct. 71, 102809. doi:10.1016/j.ijdrr.2022.102809
Mondal, S., and Maiti, R. (2013). Integrating the Analytical Hierarchy Process (AHP) and the frequency ratio (FR) model in landslide susceptibility mapping of Shiv-khola watershed, Darjeeling Himalaya. Int. J. Disaster Risk Sci. 4, 200–212. doi:10.1007/s13753-013-0021-y
Moragues, S., Lenzano, M. G., Lanfri, M., Moreiras, S., Lannutti, E., and Lenzano, L. (2021). Analytic hierarchy process applied to landslide susceptibility mapping of the North Branch of Argentino Lake, Argentina. Nat. Hazards 105, 915–941. doi:10.1007/s11069-020-04343-8
Nhu, V. H., Hoang, N. D., Nguyen, H., Ngo, P. T. T., Thanh Bui, T., Hoa, P. V., et al. (2020). Effectiveness assessment of Keras based deep learning with different robust optimization algorithms for shallow landslide susceptibility mapping at tropical area. Catena (Amst) 188, 104458. doi:10.1016/j.catena.2020.104458
Nicu, I. C., and Asăndulesei, A. (2018). GIS-based evaluation of diagnostic areas in landslide susceptibility analysis of Bahluieț River Basin (Moldavian Plateau, NE Romania). Are Neolithic sites in danger? Geomorphology 314, 27–41. doi:10.1016/j.geomorph.2018.04.010
Nicu, I. C. (2017). Frequency ratio and GIS-based evaluation of landslide susceptibility applied to cultural heritage assessment. J. Cult. Herit. 28, 172–176. doi:10.1016/j.culher.2017.06.002
Pal, S. C., Chakrabortty, R., Saha, A., Bozchaloei, S. K., Pham, Q. B., Linh, N. T. T., et al. (2022). Evaluation of debris flow and landslide hazards using ensemble framework of Bayesian- and tree-based models. Bull. Eng. Geol. Environ. 81, 55. doi:10.1007/s10064-021-02546-2
Panchal, S., and Shrivastava, A. K. (2021). A comparative study of frequency ratio, shannon’s entropy and analytic hierarchy process (Ahp) models for landslide susceptibility assessment. ISPRS Int. J. Geoinf 10, 603. doi:10.3390/ijgi10090603
Pham, B. T., Vu, V. D., Costache, R., Phong, T. V., Ngo, T. Q., Tran, T. H., et al. (2022). Landslide susceptibility mapping using state-of-the-art machine learning ensembles. Geocarto Int. 37, 5175–5200. doi:10.1080/10106049.2021.1914746
Phong, T. V., Phan, T. T., Prakash, I., Singh, S. K., Shirzadi, A., Chapi, K., et al. (2021). Landslide susceptibility modeling using different artificial intelligence methods: A case study at muong lay district, vietnam. Geocarto Int. 36, 1685–1708. doi:10.1080/10106049.2019.1665715
Pourghasemi, H. R., Mohammady, M., and Pradhan, B. (2012). Landslide susceptibility mapping using index of entropy and conditional probability models in GIS: Safarood Basin, Iran. Catena (Amst) 97, 71–84. doi:10.1016/j.catena.2012.05.005
Pourghasemi, H. R., Moradi, H. R., and Fatemi Aghda, S. M. (2013). Landslide susceptibility mapping by binary logistic regression, analytical hierarchy process, and statistical index models and assessment of their performances. Nat. Hazards 69, 749–779. doi:10.1007/s11069-013-0728-5
Pourghasemi, H. R., Teimoori Yansari, Z., Panagos, P., and Pradhan, B. (2018). Analysis and evaluation of landslide susceptibility: A review on articles published during 2005–2016 (periods of 2005–2012 and 2013–2016). Arabian J. Geosciences 11, 193. doi:10.1007/s12517-018-3531-5
Ramli, M. F., Yusof, N., Yusoff, M. K., Juahir, H., and Shafri, H. Z. M. (2010). Lineament mapping and its application in landslide hazard assessment: A review. Bull. Eng. Geol. Environ. 69, 215–233. doi:10.1007/s10064-009-0255-5
Razavizadeh, S., Solaimani, K., Massironi, M., and Kavian, A. (2017). Mapping landslide susceptibility with frequency ratio, statistical index, and weights of evidence models: A case study in northern Iran. Environ. Earth Sci. 76, 499. doi:10.1007/s12665-017-6839-7
Reichenbach, P., Rossi, M., Malamud, B. D., Mihir, M., and Guzzetti, F. (2018). A review of statistically-based landslide susceptibility models. Earth Sci. Rev. 180, 60–91. doi:10.1016/j.earscirev.2018.03.001
Roodposhti, M. S., Aryal, J., Shahabi, H., and Safarrad, T. (2016). Fuzzy shannon entropy: A hybrid GIS-based landslide susceptibility mapping method. Entropy 18, 343. doi:10.3390/e18100343
Saaty, T. L. (1977). A scaling method for priorities in hierarchical structures. J. Math. Psychol. 15, 234–281. doi:10.1016/0022-2496(77)90033-5
Saaty, T. (1980). The analytical hierarchy process, planning, priority, resource allocation. McGraw-Hill International Book Company.
Sbroglia, R. M., Reginatto, G. M. P., Higashi, R. A. R., and Guimarães, R. F. (2018). Mapping susceptible landslide areas using geotechnical homogeneous zones with different DEM resolutions in Ribeirão Baú basin, Ilhota/SC/Brazil. Landslides 15, 2093–2106. doi:10.1007/s10346-018-1052-7
Scaioni, M., Longoni, L., Melillo, V., and Papini, M. (2014). Remote sensing for landslide investigations: An overview of recent achievements and perspectives. Remote Sens. (Basel) 6, 9600–9652. doi:10.3390/rs6109600
Shahabi, H., and Hashim, M. (2015). Landslide susceptibility mapping using GIS-based statistical models and Remote sensing data in tropical environment. Sci. Rep. 5, 9899. doi:10.1038/srep09899
Shannon, C. E. (1948). A mathematical theory of communication. Bell Syst. Tech. J. 27, 379–423. doi:10.1002/j.1538-7305.1948.tb01338.x
Singh, P., Sharma, A., Sur, U., and Rai, P. K. (2021). Comparative landslide susceptibility assessment using statistical information value and index of entropy model in Bhanupali-Beri region, Himachal Pradesh, India. Environ. Dev. Sustain 23, 5233–5250. doi:10.1007/s10668-020-00811-0
Sørensen, R., Zinko, U., and Seibert, J. (2006). On the calculation of the topographic wetness index: Evaluation of different methods based on field observations. Hydrol. Earth Syst. Sci. 10, 101–112. doi:10.5194/hess-10-101-2006
Stanley, T. A., Kirschbaum, D. B., Benz, G., Emberson, R. A., Amatya, P. M., Medwedeff, W., et al. (2021). Data-driven landslide nowcasting at the global scale. Front. Earth Sci. (Lausanne) 9. doi:10.3389/feart.2021.640043
Thanh, L. N., Fang, Y.-M., Chou, T.-Y., Hoang, T.-V., Nguyen, Q. D., Lee, C.-Y., et al. (2022). Using landslide statistical index technique for landslide susceptibility mapping: Case study: Ban khoang commune, Lao cai province, vietnam. Water (Basel) 14, 2814. doi:10.3390/w14182814
Tian, Y., Xiao, C., Liu, Y., and Wu, L. (2008). Effects of raster resolution on landslide susceptibility mapping: A case study of shenzhen. Sci. China, Ser. E Technol. Sci. 51, 188–198. doi:10.1007/s11431-008-6009-y
Titti, G., van Westen, C., Borgatti, L., Pasuto, A., and Lombardo, L. (2021). When enough is really enough? On the minimum number of landslides to build reliable susceptibility models. Geosci. Switz. 11, 469. doi:10.3390/geosciences11110469
Tyagi, A., Kamal Tiwari, R., and James, N. (2022). A review on spatial, temporal and magnitude prediction of landslide hazard. J. Asian Earth Sci. X 7, 100099. doi:10.1016/j.jaesx.2022.100099
Van Den Eeckhaut, M., and Hervás, J. (2012). State of the art of national landslide databases in Europe and their potential for assessing landslide susceptibility, hazard and risk. Geomorphology 139-140, 545–558. doi:10.1016/j.geomorph.2011.12.006
Wang, B., and Zhang, S. (2018). A subjective and objective integration approach of determining weights for trustworthy measurement. IEEE Access 6, 25829–25835. doi:10.1109/ACCESS.2018.2829622
Wang, S., Lin, X., Qi, X., Li, H., and Yang, J. (2022). Landslide susceptibility analysis based on a PSO-DBN prediction model in an earthquake-stricken area. Front. Environ. Sci. 10. doi:10.3389/fenvs.2022.912523
Wang, W. D., Guo, J., Fang, L. G., and Chang, X. S. (2012). A subjective and objective integrated weighting method for landslides susceptibility mapping based on GIS. Environ. Earth Sci. 65, 1705–1714. doi:10.1007/s12665-011-1148-z
Wang, Y., Feng, L., Li, S., Ren, F., and Du, Q. (2020). A hybrid model considering spatial heterogeneity for landslide susceptibility mapping in Zhejiang Province, China. Catena (Amst) 188, 104425. doi:10.1016/j.catena.2019.104425
Yalcin, A. (2008). GIS-based landslide susceptibility mapping using analytical hierarchy process and bivariate statistics in Ardesen (Turkey): Comparisons of results and confirmations. Catena (Amst) 72, 1–12. doi:10.1016/j.catena.2007.01.003
Yong, C., Jinlong, D., Fei, G., Bin, T., Tao, Z., Hao, F., et al. (2022). Review of landslide susceptibility assessment based on knowledge mapping. Stoch. Environ. Res. Risk Assess. 36, 2399–2417. doi:10.1007/s00477-021-02165-z
Zanaga, D., Van De Kerchove, R., Daems, D., De Keersmaecker, W., Brockmann, C., Kirches, G., et al. (2022). ESA WorldCover 10 m 2021 v200. doi:10.5281/ZENODO.7254221
Zêzere, J. L., Pereira, S., Melo, R., Oliveira, S. C., and Garcia, R. A. C. (2017). Mapping landslide susceptibility using data-driven methods. Sci. Total Environ. 589, 250–267. doi:10.1016/j.scitotenv.2017.02.188
Zhang, S., Bai, L., Li, Y., Li, W., and Xie, M. (2022). Comparing convolutional neural network and machine learning models in landslide susceptibility mapping: A case study in wenchuan county. Front. Environ. Sci. 10. doi:10.3389/fenvs.2022.886841
Zhou, S., Chen, G., Fang, L., and Nie, Y. (2016). GIS-based integration of subjective and objective weighting methods for regional landslides susceptibility mapping. Sustain. Switz. 8, 334. doi:10.3390/su8040334
Keywords: landslide susceptibility, analytic hierarchy process, Shannon entropy, subjective and objective weighting, tropical monsoon climate
Citation: Hoa PV, Tuan NQ, Hong PV, Thao GTP and Binh NA (2023) GIS-based modeling of landslide susceptibility zonation by integrating the frequency ratio and objective–subjective weighting approach: a case study in a tropical monsoon climate region. Front. Environ. Sci. 11:1175567. doi: 10.3389/fenvs.2023.1175567
Received: 27 February 2023; Accepted: 11 May 2023;
Published: 30 May 2023.
Edited by:
Sandipan Das, Symbiosis International University, IndiaReviewed by:
Rabin Chakrabortty, University of Burdwan, IndiaCopyright © 2023 Hoa, Tuan, Hong, Thao and Binh. This is an open-access article distributed under the terms of the Creative Commons Attribution License (CC BY). The use, distribution or reproduction in other forums is permitted, provided the original author(s) and the copyright owner(s) are credited and that the original publication in this journal is cited, in accordance with accepted academic practice. No use, distribution or reproduction is permitted which does not comply with these terms.
*Correspondence: Nguyen An Binh, bmFiaW5oQGhjbWlnLnZhc3Qudm4=
Disclaimer: All claims expressed in this article are solely those of the authors and do not necessarily represent those of their affiliated organizations, or those of the publisher, the editors and the reviewers. Any product that may be evaluated in this article or claim that may be made by its manufacturer is not guaranteed or endorsed by the publisher.
Research integrity at Frontiers
Learn more about the work of our research integrity team to safeguard the quality of each article we publish.