
95% of researchers rate our articles as excellent or good
Learn more about the work of our research integrity team to safeguard the quality of each article we publish.
Find out more
ORIGINAL RESEARCH article
Front. Environ. Sci. , 11 April 2023
Sec. Environmental Informatics and Remote Sensing
Volume 11 - 2023 | https://doi.org/10.3389/fenvs.2023.1175363
This article is part of the Research Topic Advances of Spectroscopy and Artificial Intelligence in Environmental Monitoring and Remote Sensing View all 6 articles
 Xin Xu1,2
 Jihui Wang1*Jianan Li1*Axin Fan1,2Yuhan Zhang1,2Chang Xu1Haolin Qin1,2Feng Mu1,2Tingfa Xu1,2
The world’s rapid industrialisation and population expansion have led to water pollution, causing significant disruption to the activities of humans, animals, and plants. Organic contamination content in water is commonly evaluated by measuring the chemical oxygen demand (COD). However, traditional COD detection methods often require additional reagents, resulting in secondary contamination and extended detection time. In this study, we propose and implement a reflective detection system that measures the UV-Vis absorption spectra of COD in water without contact measurement. We compared the modeling results of the transmissive and reflective detection systems using three regression analysis algorithms. We also assessed the modeling results using various spectral preprocessing and different feature selection bands. The results of the standard samples confirmed the viability of the reflective detection system for detecting COD, with the impressive coefficient of determination (R2) of 0.98892, the root mean square error (RMSE) of 2.86776, and the detection time of only 47.6 s. For the transmissive detection system, the R2 was 0.99976, the RMSE was 0.41979, and the detection time was 162.4 s. Overall, this study proposes two referenceable detection methods for measuring COD concentrations, which can be adapted to suit various job demands.
Water resources are fundamental to sustaining life for humans, animals, and plants. However, due to the rapid development of the world population and industrial technologies, water resources are being both wasted and polluted. The utilization of wastewater can also pose significant risks to both human health and the environment, as highlighted by recent studies (Garg et al., 2021; Lin et al., 2022). Given the global shortage of water resources, an increasing number of people are becoming aware of the pressing need to address water pollution issues. As a result, there is a growing urgency to monitor water pollution levels.
Various sources, such as mining, industrial wastes, pesticides and fertilizers, and urban development, have caused different types of pollution to water resources, as highlighted in recent studies (Hasan et al., 2019; Liu et al., 2021). Among these sources, organic pollution is a significant contributor to water quality contamination (Bao et al., 2012). Chemical oxygen demand (COD) is a commonly used indicator to determine the degree of organic pollution in water (Siwiec et al., 2018; Al-Kubaisi, 2021). It quantifies the amount of oxidant consumed during the oxidation process of reducing substances. Higher COD concentrations represent a greater degree of organic pollution in water. The upper limit concentrations of COD for various water bodies differ among different countries (Hespanhol and Prost, 1994; Blok and Balk, 2020). For instance, in China’s surface water environmental quality standard (GB3838-2002), the COD content of water in agricultural and general landscapes water areas should not exceed 40 mg/L (Jing et al., 2017). As China is the world’s most populous nation, its national standard serves as a reference for this study.
Measuring the concentration of COD is a crucial step in preventing and controlling water pollution. The conventional method for detecting COD is dichromate oxidation (Li et al., 2018). After treating the sample with potassium dichromate, residual potassium dichromate is measured either colorimetrically using spectrophotometry or by titration with ferrous ammonium sulfate, called titrimetric (Wayne, 1997). However, this method presents challenges such as incomplete oxidation and interference from chloride ions. Nowadays, popular detection techniques include the wet chemical method (Kolb et al., 2017), electrochemical (Wang et al., 2022), ozone oxidation (Pisutpaisal and Sirisukpoca, 2014), and others. However, the use of extra chemicals in the wet chemical method leads to secondary contamination of the water body, and the electrochemical method can be challenging in practice. The ozone method is associated with several safety hazards. Ogura (1969) first developed a COD detection method based on UV-Vis spectrophotometry, which eliminates the need for sample digestion and extra chemical reagents, thus preventing secondary contamination. Hence, spectral analyzing detection technique for COD measurement has become an essential trend.
With the development of optical technology, there are various methods for determining COD, including single-wavelength (Shi et al., 2020), double-wavelength (Minchao et al., 2013; Zhang et al., 2020), multi-wavelength (Lv et al., 2011), and broad-spectrum spectrometry (Ye et al., 2022). Broad-spectrum spectrometry is particularly advantageous due to its wider range of absorption spectral bands compared to the other methods. It is possible to design correction models when using this method to measure COD in real wastewater to compensate for the errors introduced by multiple interfering substances such as turbidity, acidity, and alkalinity. Therefore, broad-spectrum spectrometry is considered more accurate and stable for measuring COD. Various algorithms can impact the accuracy and robustness of the predictive model. Multiple linear regression (MLR) (Cao et al., 2014) and partial least squares regression (PLSR) (Chen et al., 2019; Li et al., 2019) are fundamental statistical techniques. In some research, machine learning algorithms have been used to build prediction models that yield superior outcomes. For instance, Huang et al. (2022) developed a prediction model for COD concentration in textile desizing wastewater using random forest regression (RFR). However, determining the most suitable modeling algorithm can be challenging due to variations in testing methods, system parameter settings, and water sample sources.
In light of the limited improvement offered by the modified algorithm, the researcher shifted focus to enhancing the accuracy and applicability of COD detection techniques through system improvements. One such system is the laser fluorescence Raman ratio (LFRR) approach presented by Che et al. (2022) for measuring COD concentration. However, this method requires the probe to be in direct contact with the water sample, making it susceptible to wear and tear. Ágústsson et al. (2014) designed a non-contact COD measurement system based on the diffuse reflection principle. However, this system used optical fibers as diffuse light receivers instead of integrating spheres, resulting in partial loss of luminous flux and causing system errors. Furthermore, the angle between the emitter and collector was not fixed, resulting in low system robustness.
In the present study, we propose a system for reflective detection that employs absorption spectra to detect COD without the need for supplementary chemicals. The system comprises a deuterium–halogen light source, a reflective sample stage, a Y-type optical fiber, and a fiber spectrometer. Initially, the light is transmitted from the light source to the probe through the input port of the Y-type optical fiber and then vertically irradiated onto the surface of the COD sample liquid. Subsequently, the light carrying the sample information enters the optical fiber probe and is transmitted to the fiber spectrometer through the output port of the Y-type optical fiber. Finally, the software calculates the absorption spectra of the samples. Therefore, this innovative technique facilitates contactless measurements.
It is worth noting that in this study, we assess the accuracy of the COD prediction model not only based on the reflective detection system but also the transmissive detection system, which is the commonly used method in absorbance spectroscopy detection. We evaluate the performance of PLSR, support vector regression (SVR) (Awad et al., 2015), and RFR algorithms to determine the most suitable modeling algorithm. Furthermore, we compare the accuracy of the COD prediction models constructed using various preprocessing techniques and different numbers of feature bands based on random forest (RF) feature selection (Niu et al., 2020). To evaluate the modeling results, we utilize root mean square error (RMSE) and coefficient of determination (R2) of the model’s training and test sets. The results of the standard samples demonstrate that the transmissive detection system yields the R2 value of 0.99976 and the RMSE of 0.42979, whereas the reflective detection system yields the R2 of 0.98892 and the RMSE of 2.86776, which confirms the feasibility of our proposed method. The method obviates the need for cuvettes and direct contact with water samples, reduces maintenance costs, and minimizes instrument wear and tear errors, which simplifies the practical use of the instrument. Furthermore, we conduct experiments on COD environmental water samples to verify the feasibility and validity of the measurement method. Our research offers several combinations of two detection methods and different algorithms for COD measurement, which can be chosen depending on the specific requirements of the task.
The principle of molecular absorption spectroscopy stipulates that the absorption spectrum is produced by the absorption of photons by a substance, which causes it to jump from a lower to a higher energy level. Molecular spectra, including UV-Vis absorption spectra, result from the leap of valence electrons of molecules. After absorbing light radiation of a certain energy, the outer valence electrons of organic substances can move from lower to higher energy levels. By measuring the change of the absorption intensity of the molecules in the solution at different wavelengths, the substance of the sample can be quantitatively analyzed. Since organic matter typically exhibits strong absorption at certain wavelengths of UV-Vis light, UV-Vis absorption spectroscopy can be utilized to measure COD in a sample.
Surface water in China is classified into five categories according to the national standard GB3838-2002, based on environmental functions and protection objectives. Class I & II have a maximum COD content of 15 mg/L and are typically found in source areas, national nature reserves, and primary protection zones of domestic drinking water sources. Aquaculture areas and other fishery waters are classified as Class III, with a maximum COD content of 20 mg/L. Industrial water and water for recreational use without direct contact with people are categorized as Class IV, and the COD content should not exceed 30 mg/L. Class V is suitable for water used in agriculture and for general landscape requirements, with a maximum COD content of 40 mg/L. To meet the practical requirements, this study includes these systems and their adjacent values in the chosen COD concentrations. Table 1 provides a detailed distribution of the 34 standard COD concentrations with different intervals from 0 mg/L to 100 mg/L.
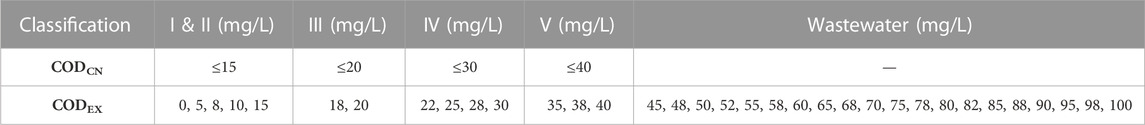
TABLE 1. The COD concentrations in standard water samples. CODCN is COD concentration of the Chinese national standard in surface water. CODEX is COD concentration of experimental water samples.
In accordance with the national standard for determining water quality chemical oxygen demand (COD) (GB11914-89), the solute used in COD standard solutions is potassium hydrogen phthalate. In this study, the COD standard solutions were prepared by Aoke Reference Materials of China, with potassium hydrogen phthalate as the solute and six times purified water as the solvent. After qualifying the detected concentration, a standard substance certificate was issued for each COD concentration. The standard water sample for each COD concentration was 50 mL.
The transmissive detection system is founded upon the Lambert-Beer law (Mäntele and Deniz, 2017), which delineates the relationship between the degree of light absorption by a substance, the thickness of the absorbing medium, and the substance concentration. Thus, this law is commonly used for absorption spectroscopy. Figure 1A depicts the propagation of light as it travels through the solution. According to the Lambert-Beer law, when a parallel monochromatic light passes vertically through a uniform non-scattering absorbing substance, its absorbance A is proportional to both the concentration c of the absorbing substance and the thickness L of the absorbing layer, while it is inversely related to the transmittance T. These relationships are mathematically expressed as follows:
where A denotes the absorbance, IT0 represents the intensity of the incident light, IT refers to the intensity of the transmitted light, T indicates light transmittance, k represents the absorption coefficient, c denotes the concentration of light-absorbing substances, and L represents the path length. The transmissive detection system is mainly composed of a light source, cuvettes, fiber lens, fibers, and a fiber spectrometer, as shown in Figure 2A.
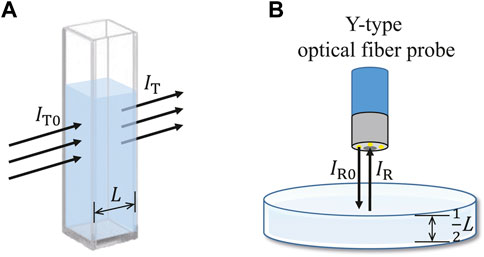
FIGURE 1. (A) The principle of the transmissive detection system. (B) The principle of the reflective detection system.
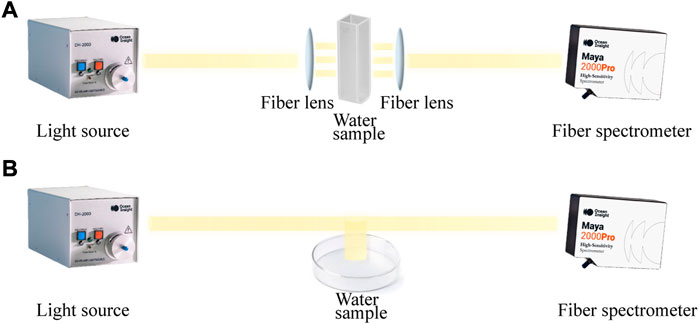
FIGURE 2. (A) Schematic diagram of the transmissive detection system. (B) Schematic diagram of the reflective detection system.
The transmissive detection system, designated as T in this paper, is depicted in Line T of Figure 3 and was established in the laboratory as shown in Figure 4. To prevent oversaturation of the spectrometer, a fiber optic attenuator was utilized for transmissive measurements. Throughout the test, a shaded sample holder (Thorlabs, CVH100) was employed to avoid errors in the test data caused by ambient light. Table 2 details the manufacturer, model, and spectral range of each component in our experimental transmissive detection system. As COD exhibits absorption peaks in the UV band, the established system operates at UV-Vis wavelengths ranging from 200 nm to 1,090 nm.
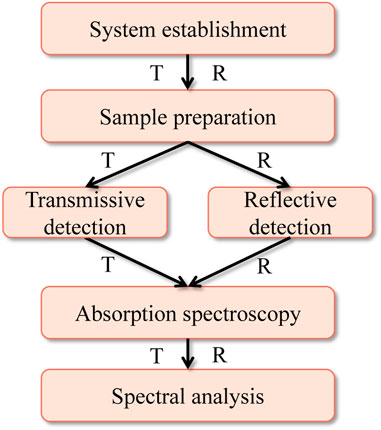
FIGURE 3. COD detection procedure of two systems. The flowchart on the left is named as Line T, and the flowchart on the right is named as Line R. T refers to the transmissive detection system, and R refers to the reflective detection system.
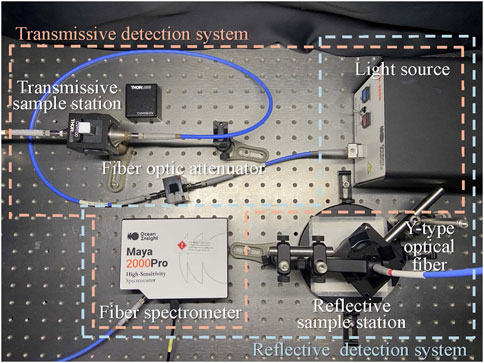
FIGURE 4. The transmissive detection system and the reflective detection system established in the laboratory.
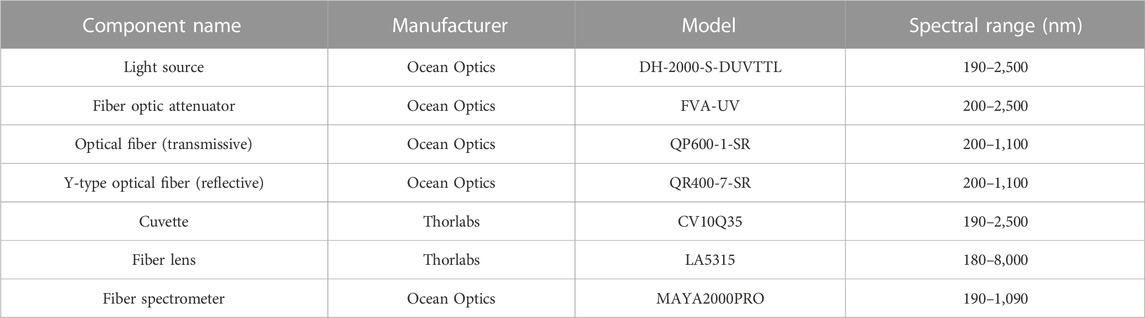
TABLE 2. The manufacturer, model and spectral range of each component.
For each different concentration of the COD standard assay, we used a pipette gun (Thermo, 100–1,000 μL). To improve the experimental results, we washed the cuvette with 1 mL of water sample of the same concentration to be measured. Next, 3 mL of the water sample was aspirated into the cuvette for testing in the transmissive detection system. To achieve a high signal-to-noise ratio, measurements were performed within an integration time of 50 ms, and the average number of scans was set to 5. We used 0 mg/L of COD standard solution as the reference solution. To record the bright spectrum and dark spectrum in absorbance mode, we first put the reference solution into the cuvette holder using Ocean Optics’ Ocean View software. Then, the solution to be measured was placed into the holder, and the software generated an absorbance spectrum. To improve data volume and reduce errors, we saved 300 absorption spectra for each concentration of water samples. We calculated the absorbance spectra of each concentration of COD samples using Ocean Optics’ Ocean View software. Figure 5A shows the absorbance spectra of some concentrations of COD samples measured using the transmissive detection system.
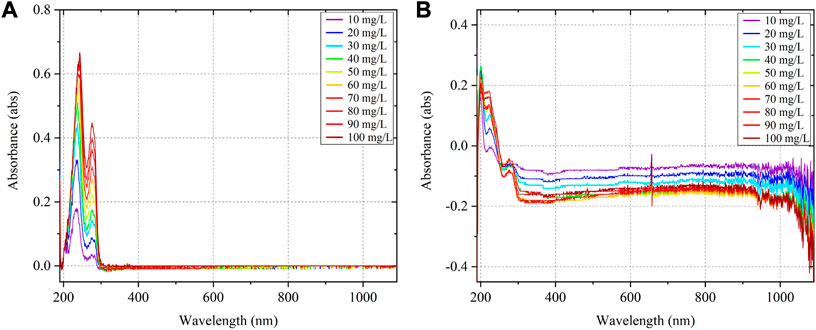
FIGURE 5. (A) Absorption spectra of 10 concentrations of COD samples obtained by transmissive method. (B) Absorption spectra of 10 concentrations of COD samples obtained by reflective method.
The Y-type optical fiber probe consists of 6 illuminating fibers around 1 reading fiber. The Y-type optical fiber input port consisting 6 fibers connects to the light source and the Y-type optical fiber output port consisting 1 fiber connects to the fiber spectrometer. The principle of the reflective detection system is shown in the Figure 1B. After the illumination light IR0 irradiates the water sample, the light IR enters the reading fiber of the probe. The light IR is composed of the light I1 and the light I2. The light I1 is reflected by the water surface, and the light I2 is reflected after entering the water. The mathematical expression is:
where R is the reflectivity. According to Eq. 1, the absorbance AR of the reflective system can be expressed as:
Also, because of Eq. 3 and Eq. 2, T can be expressed as:
Equation 6 is brought into Eq. 5:
Therefore, Eq. 7 shows that there is a relation between the absorbance measured by reflective method and the concentration and the reflectivity of the sample solution.
As shown in Figure 2B, the reflective system mainly consists of a light source, petri dishes, a Y-type optical fiber and a fiber spectrometer. The reflective detection system, designated as R in this paper, is depicted in Line R of Figure 3 and was established in the laboratory as shown in Figure 4. In addition, the reflective sample stage consists of an adjustable fiber probe holder (Thorlabs, RPS), a lens sleeve (Thorlabs, SM2L10), and petri dishes. Table 2 contains the manufacturer, model number and spectral range of the relevant components. The spectral range of the system is 200–1,090 nm. We pipette 4 mL of water samples into petri dishes each time. Place petri dishes with the water sample to be measured in the center of the test rack panel and rotate down the shade to avoid the influence of environmental light. Other measurement procedures are the same as those for the transmissive detection system. Figure 5B shows the average absorbance spectra of some concentrations of COD samples measured using the reflective detection system.
We experimented with 34 concentrations of COD solutions under different systems, and 300 spectral curves were recorded for each concentration. Thus, 10,200 spectra of COD solution were obtained under transmissive and reflective detection systems, respectively. The data set was roughly divided into training set and test set according to 3:1, and the concentration distribution of training set and test set was kept uniform. Thus, 26 groups were selected as the training set for model building, and the remaining 8 groups were used as the test set, as listed in Table 3.
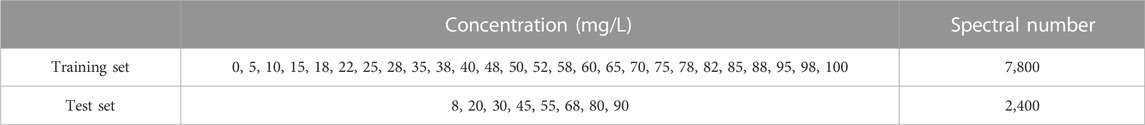
TABLE 3. COD solution sample division.
Regression analysis is commonly used for the prediction of the data. In this study, three regression analysis algorithms were used to model the raw absorption spectral data of UV-Vis COD solutions measured by two systems. PLSR is a multiple linear regression modeling method. The models using PLSR have better accuracy of fit, especially in the presence of multiple correlations and small sample sizes. Support vector machine (SVM) have been widely used in areas such as pattern recognition. In addition to solving classification problems, SVM can also solve regression problems. SVR is an important branch of SVM. SVR finds a regression plane such that all the data in a set of data are closest to that plane. It is worth noting that the kernel function of SVR can be very flexible to solve various regression problems. After comparing various kernel functions, we chose the linear kernel function for this study, whose penalty coefficient generally took the default value of 1. RF refers to a classifier that uses multiple trees to train and predict samples. RF can also be used for regression analysis. RFR randomly draws samples, builds multiple uncorrelated decision trees, and obtains predictions in a parallel approach. In this study, the number of trees is 500, and the number of randomly selected features for each tree is 200.
To objectively evaluate the prediction effect of the COD model, this paper uses R2 and RMSE as the performance evaluation index of the model. The calculation formulas of each evaluation index are as follows:
where yi denotes the theoretical value of sample i,
The experimental setup is kept consistent with the different algorithms used in this paper. The modeling of the COD solution was completed by the above algorithm. Then, the test set of 8 concentrations was input into the model. The predicted results and efficiency metric are listed in the Table 4. The sum of the running times of the modeling and prediction test sets is used as the efficiency metric time. Based on the results of the test set, 6 comparison curves were plotted between the predicted and theoretical COD values of the model as shown in Figure 6. The absorption spectra of the COD samples measured by the transmissive detection system have a better fit than those measured by the reflective detection system when comparing Figures 6A–C with Figures 6D–F. The degree of effectiveness of the information included in the light received by the optical fiber probe varies because of the different measurement methods. The receiving probe of a reflective detection system contains the part of the light that is reflected from the water surface by the incident light. The COD in the water does not absorb this part of the light, resulting in an inability to produce an absorption spectrum. Therefore, when the incident light intensity is the same, the prediction accuracy of the model of the absorption spectra measured by the transmissive detection system is higher than those measured by the reflective detection system.
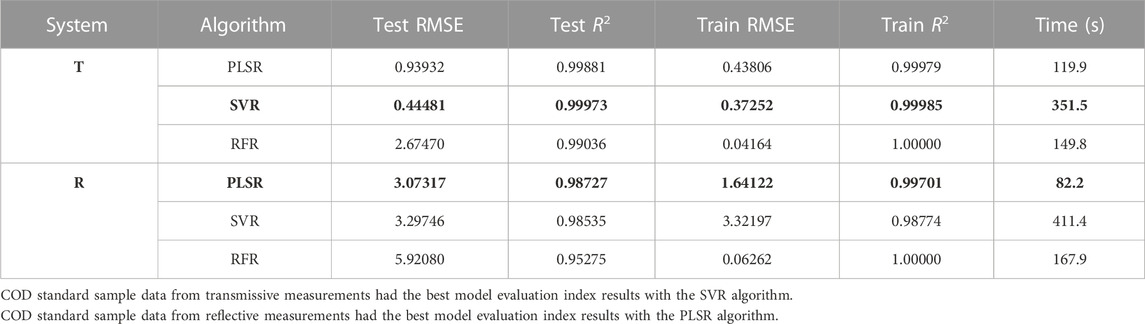
TABLE 4. Modeling results using different regression analysis algorithms.
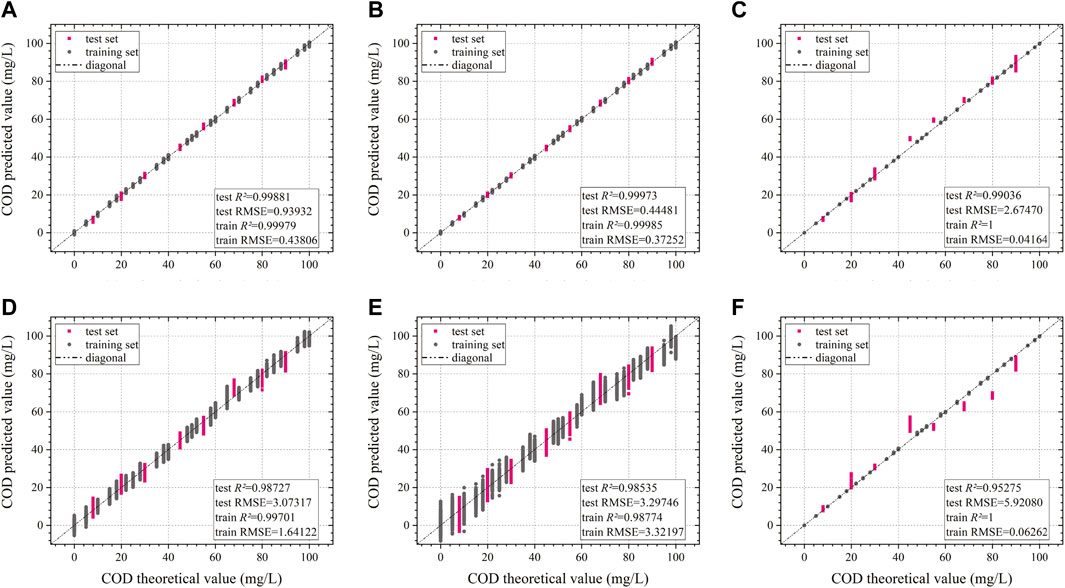
FIGURE 6. Comparison curves between predicted and theoretical COD values in the training set and test set of six models. (A) The model of PLSR in transmissive detection. (B) The model of SVR in transmissive detection. (C) The model of RFR in transmissive detection. (D) The model of PLSR in reflective detection. (E) The model of SVR in reflective detection. (F) The model of RFR in reflective detection.
In addition, Figure 6B shows that the data measured from the transmissive detection system performs better with the SVR algorithm for modeling. While, the data from the reflective detection system is more accurate with the PLSR algorithm than the other two algorithms in Figure 6D. SVR is ideal for modeling in the transmissive detection system because it uses a linear kernel function and there is a linear link between the COD concentration and absorption spectra. The PLSR is appropriate for multiple regression, and the absorbance of the reflective detection system is related to the COD concentration, as well as the reflectivity of different COD concentrations. For this reason, PLSR is a useful modelling approach for this system. Particularly, Figures 6C, F shows that the experiments by the RFR algorithm all appear to be overfitted. The reason for this situation is that RFR is prone to overfitting when handling noisy classification or regression situations. It is no longer being considered for future experiments. What’s more, the efficiency metrics in the last column of Table 4 show that the PLSR algorithm requires less time than other algorithms to build the model. Thus, the PLSR algorithm has a large speed advantage.
Figure 5 demonstrates that the absorbance spectra includes information about the composition and concentration of the sample itself, as well as information from outside the sample. Examples of interference factors include the status of the sample, the noise of the experimental equipment, the experimental environment during operation, and the mistake generated by the experimental staff. These interferences can impact subsequent spectral analysis results. Hence, the spectra should always be preprocessed before to application in order to increase spectral reliability and stability (Jiao et al., 2020). In this paper, multiplicative scattering correction (MSC), standard normal variate (SNV), mean centering, normalize, moving average smoothing (MAS) and Savitzky-Golay (SG) smoothing methods are used for spectral preprocessing. Using various preprocessing methods based on the COD prediction model described in Section 3.2, the results of their predictions are listed in Table 5.
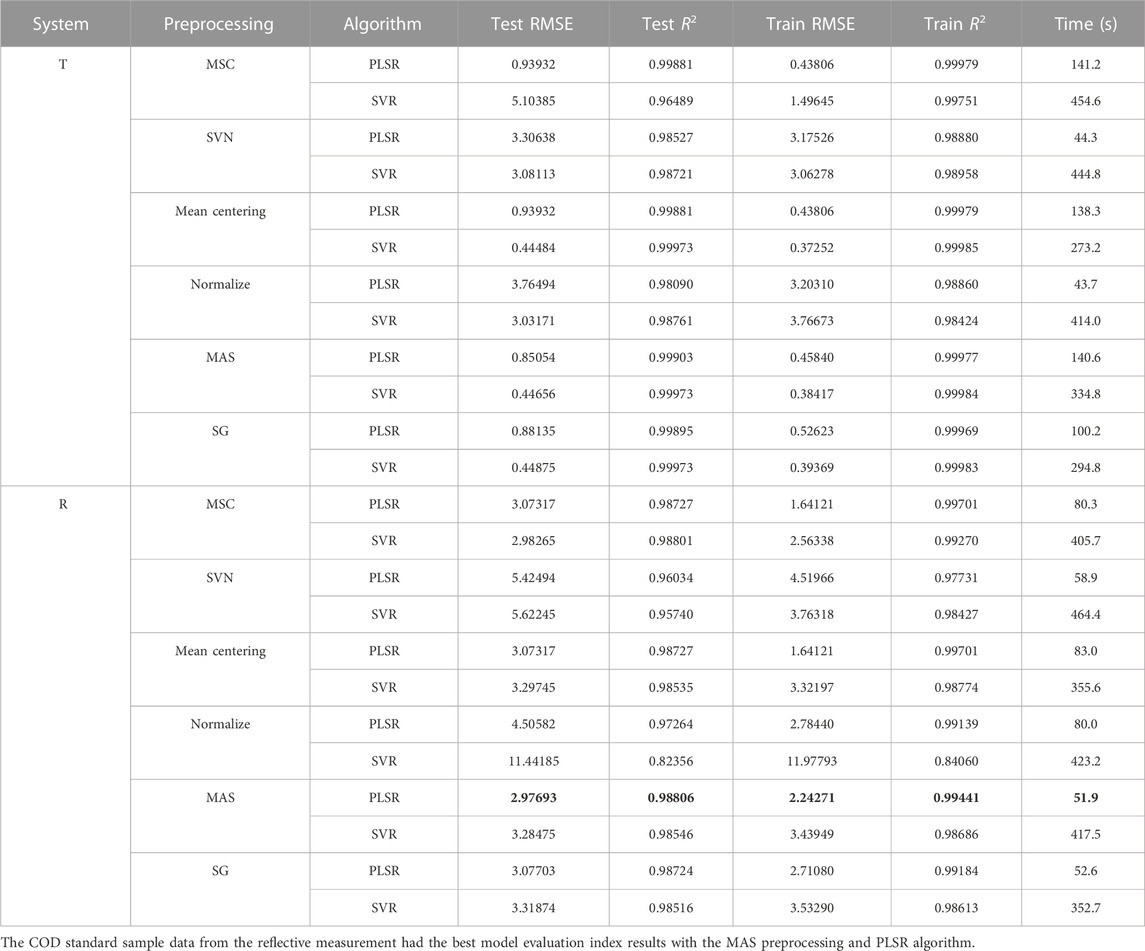
TABLE 5. Modeling results using different preprocessing methods.
Comparing the Tables 4, 5 reveals that the data of the transmissive detection system without preprocessing after SVR modeling is superior, with the test set of R2 of 0.99973. Consequently, various preprocessing method presented in this research are inapplicable prior to SVR modeling of raw spectral data collected by this system. As indicated by the prediction results, the spectral data collected from the reflective detection system may be modeled by the PLSR algorithm after MAS, achieving the test set of R2 of 0.98806.
Too many features will increase the model’s complexity and introduce more noisy data that are more susceptible to overfitting. A feature selection method can pick modeling-relevant features and shorten the modeling process’s runtime. Use the RF method for feature selection in this study based on Section 3.3. The number of trees is 1,000, and the number of randomly-selected features for each tree is the square root of the total number of features. When the bands have been feature selected, each band is given a score; a higher score indicates a greater contribution to the prediction result. According to their scores, the bands are ordered from the largest to the smallest. According to the rearranged spectra, the number of feature bands is picked while building the model.
On the basis of the preceding model, feature selection was conducted to pick varying numbers of feature bands for modeling, and the results are listed in Table 6. Generally, feature selection enhances the accuracy of the model’s predictions. Nevertheless, the prediction accuracy of the model was low when 50 feature bands were used. Due to the large number of relevant bands, selecting too few feature bands during the modeling process might result in underfitting. The detection system is more closely correlated with the amount of effective feature bands based on the modeling findings of various algorithms. 75% or more of the total number of bands are effective in the reflective detection system. And, the transmissive type’s effective spectral bands contribute to between 10% and 50%. The higher number of effective spectral bands may make the model more robust and less susceptible to external test conditions. As shown in Figure 7A, the transmissive detection system has a greater prediction accuracy when 700 feature bands are used in modeling with the SVR algorithm. As illustrated in Figure 7B, the reflective detection system has a superior model fit utilizing the PLSR algorithm when 2000 feature bands are picked after MAS preprocessing method. In addition, the column of efficiency metric time in Table 6 lists that the PLSR algorithm has a huge efficiency advantage over SVR, as well as in Table 2 in Section 3.2 and Table 3 in Section 3.3.
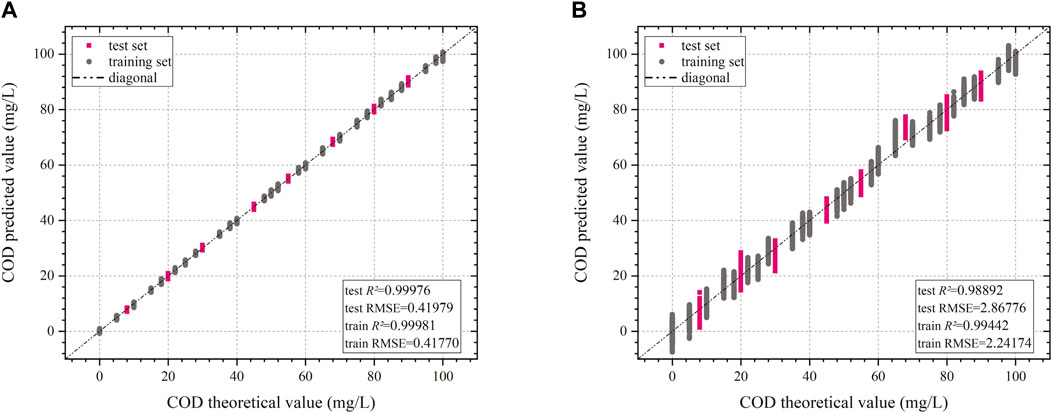
FIGURE 7. Comparison curves between predicted and theoretical COD values in the training set and test set of two models. (A) The model of SVR with 700 feature bands in transmissive detection. (B) The model of MAS and PLSR with 2000 feature bands in reflective detection.
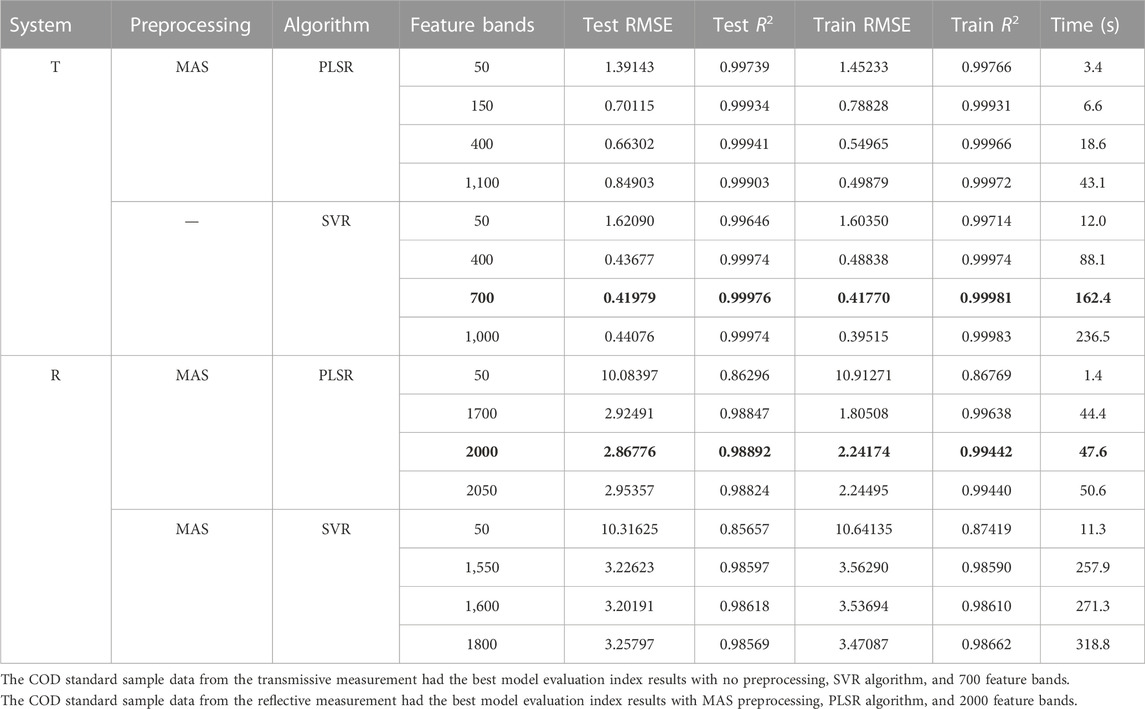
TABLE 6. Modeling results using different numbers of feature bands.
Cross-validation (Peter et al., 2019), also known as rotation estimation, is a statistical method used to evaluate the skill of machine learning models. The basic idea of cross-validation is to split a dataset into multiple non-overlapping subsets and perform multiple rounds of training and testing on these subsets. Then, the results of the multiple rounds of validation are averaged to evaluate the generalization and performance of the model. K-fold cross-validation is a prevalent cross-validation method. First, the dataset is randomly split into K mutually exclusive subsamples, a single subsample is kept as the test set, and the other K-1 samples are used for training. Then, the dataset is repeated K times for training and testing until each subsample has been predicted. Thus, the model is evaluated by averaging the results of the performance indexes of K times. Notably, the stability of the model evaluated by this method depends heavily on the K values chosen. As the value of K becomes larger, the size difference between subsets becomes smaller. The K value for the size of the dataset is a special case of K-fold cross-validation, which is called leave-one-out cross-validation (LOOCV). Therefore, we chose LOOCV to evaluate the generalizability and performance of the model that performed best in Section 3.4.
First, the dataset was divided into 34 subsets by concentration. We used one subset as the test set and trained the remaining subsets into the model, rotating it 34 times until each subset was predicted. The dataset obtained from the transmissive detection system was modeled using 700 feature bands and the SVR algorithm. And, the dataset obtained from the reflective detection system was modeled using MAS preprocessing, 200 feature bands and the PLSR algorithm. We use the average of the RMSE of each round and the R2 calculated from the predictions of all test sets as the model evaluation indexes. The transmissive RMSE of LOOCV is 0.504 and R2 is 0.99966. And the reflective RMSE of LOOCV is 3.22935 and R2 is 0.98439. Overall, the results of LOOCV do not worsen drastically comparing with those of Section 3.4 for the same parameters. The experimental results of LOOCV further demonstrate the well generalization and performance of the best performing model in Section 3.4.
To further verify the feasibility and effectiveness of the transmissive and reflective detection systems, experiments were conducted on environmental water samples. Compared with the standard water samples, COD environmental water samples also contain other substances besides potassium hydrogen phthalate.
First, we chose to configure the COD environmental samples using natural drinking water from Nongfu Spring as the solvent. The natural drinking water of Nongfu Spring contains many mineral elements such as potassium, sodium, calcium and magnesium, and the pH value is 7.3 ± 0.5. Then, we chose potassium hydrogen phthalate as the solute. Since the Chinese national standard defines COD concentration in surface water over 40 mg/L as wastewater, the COD concentration ranged from 0 mg/L to 50 mg/L with an interval of 5 mg/L. In addition, we added turbidity index to the COD solution prepared from drinking natural water of Nongfu Spring. Urban and rural domestic water supply turbidity testing limit for normal conditions do not exceed 1 NTU. Therefore, the prepared COD environmental water samples for various types of indicators are listed in Table 7.
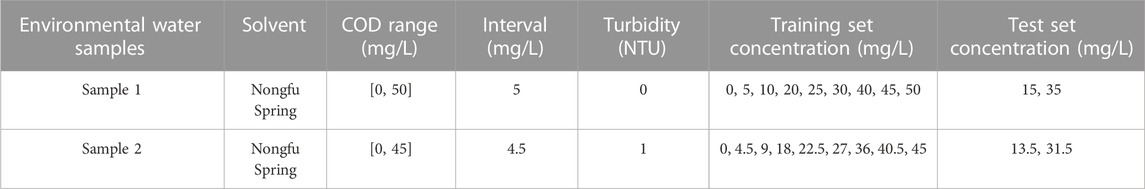
TABLE 7. Environmental water sample concentrations and divisions.
COD environmental water samples (50 mL) ranging from 0 mg/L to 50 mg/L with an interval of 5 mg/L were prepared by Aoke Reference Materials of China, which also produces turbidity standards (50 mL, 10 NTU). According to Table 7, we prepared two sets of samples using a pipette gun (Thermo, 100–1,000 μL). The experimental water volume was 3 mL for the transmissive detection system and 4 mL for the reflective detection system. We measured the transmittance absorbance and reflectance absorbance of COD environmental samples according to the system and method mentioned in Section 2.
We conducted experiments on two sets of sample solutions under different systems and 300 spectral curves were recorded for each sample. Similarly, the data set for each sample set is roughly divided into a training set and a test set in the ratio of 3:1. Therefore, 9 concentrations in each group of water samples were selected as the training set for building the model, and the remaining 2 concentrations were used as the test set, as listed in Table 7. Also, we used the combination of the best performing algorithms in Section 3.4 to perform regression analysis of the absorbance measured by the two systems. Based on the above parameters, the modeling results in the three sets of COD environmental water samples are listed in Table 8.
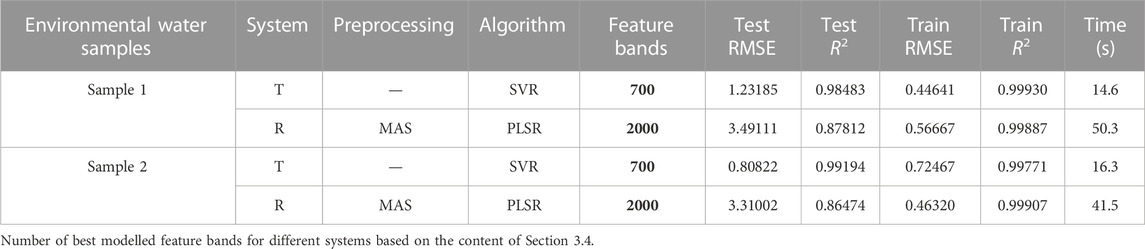
TABLE 8. Environmental water sample modeling results.
In conclusion, the predicted results for the two sets of COD environmental water samples are satisfactory. For this reason, environmental samples are modeled based on preprocessing, feature selection, and regression algorithms that perform better in standard samples. In addition, the SVR algorithm has a huge efficiency advantage compared to PLSR in environmental samples. However, this performance differs from that of the standard samples. The extreme sensitivity of the SVR algorithm to the size of the sample size may cause this phenomenon. So with small sample sizes, the SVR algorithm could provide a greater speed advantage. Therefore, the two methods mentioned in this paper can effectively predict the COD concentration in environmental water samples.
This study details the establishment of a non-contact COD measurement system using reflective detection of absorption spectra. Three regression analysis algorithms were utilized to compare the modeling performance of absorbance spectra obtained from the transmissive and reflective detection systems. The reflective raw spectral data underwent MAS preprocessing and feature selection to improve the accuracy of the predictive models. The results of the standard samples showed that the PLSR algorithm applied to data measured using the reflective detection system yielded a better fit, with the R2 value of 0.98892 and RMSE of 2.86776. Conversely, feature selection and SVR algorithm applied to data measured using the transmissive detection system resulted in greater prediction accuracy, with the R2 value of 0.99976 and RMSE value of 0.41979. The reflective method required 47.6 s, while the transmissive method required 162.4 s, indicating that the reflective method is more time-saving.
The reflective detection system has been demonstrated to be a viable solution for non-contact measurement of COD solution concentration, as evidenced by various experimental results. Further development of algorithms has the potential to enhance the predictive accuracy of these systems. In laboratory testing scenarios with less corrosive solutions and minimal solid contaminants, transmissive detection system exhibit superior prediction accuracy. However, reflective detection, as a non-contact method, presents a promising solution to outdoor emergency detection issues. Additionally, the absorption properties of substances to light make reflective detection a powerful tool for identifying additional water quality pollutants. This research enables users to select and combine different detection systems and algorithms based on their specific requirements.
The raw data supporting the conclusion of this article will be made available by the authors, without undue reservation.
XX, JW, and JL contributed to conception and design of the study. XX and AF organized the database and performed the statistical analysis. XX wrote the first draft of the manuscript. YZ, CX, HQ, and AF wrote sections of the manuscript. All authors contributed to manuscript revision, read, and approved the submitted version.
This work was supported by the National Key Scientific Instrument and Equipment Development Project of China (No. 61527802).
The authors declare that the research was conducted in the absence of any commercial or financial relationships that could be construed as a potential conflict of interest.
All claims expressed in this article are solely those of the authors and do not necessarily represent those of their affiliated organizations, or those of the publisher, the editors and the reviewers. Any product that may be evaluated in this article, or claim that may be made by its manufacturer, is not guaranteed or endorsed by the publisher.
Ágústsson, J. S., Akermann, O., Barry, D. A., and Rossi, L. (2014). Non-contact assessment of cod and turbidity concentrations in water using diffuse reflectance uv-vis spectroscopy. Environ. Sci. Process. impacts 16 (8), 1897–1902. doi:10.1039/c3em00707c
Al-Kubaisi, M. H. D. (2021). Application of organic indicators and overall index to assess the level of water pollution in habbaniya lake, Iraq. Iraqi Geol. J. 54, 93–102. doi:10.46717/igj.54.2a.7ms-2021-07-28
Awad, M., and Khanna, R. (2015). Efficient learning machines: Theories, concepts, and applications for engineers and system designers. Springer nature, 268.
Bao, L.-J., Maruya, K. A., Snyder, S. A., and Zeng, E. Y. (2012). China’s water pollution by persistent organic pollutants. Environ. Pollut. 163, 100–108. doi:10.1016/j.envpol.2011.12.022
Blok, J., and Balk, E. M. (2020). “Environmental regulation in the European Community,” In Fundamentals of Aquatic Toxicology. CRC Press, 775–802.
Cao, H. X., Qu, W.-T., and long Yang, X. (2014). A rapid determination method for chemical oxygen demand in aquaculture wastewater using the ultraviolet absorbance spectrum and chemometrics. Anal. Methods 6, 3799–3803. doi:10.1039/c4ay00198b
Che, X., Tian, Z., Sun, F., Liu, Q., Bi, Z., Chen, H., et al. (2022). Research on chemical oxygen demand based on laser fluorescence-Raman spectroscopy. Front. Phys. doi:10.3389/fphy.2022.1055049
Chen, H., Xue, H., Liu, J., Li, Z., and Hou, Y. (2019). “Research on COD detection method based on UV-Vis spectroscopy,” In Ninth International Symposium on Precision Mechanical Measurements 11343, 167–171.
Garg, S., Chowdhury, Z. Z., Faisal, A. N. M., Rumjit, N. P., and Thomas, P. (2022). “Impact of industrial wastewater on environment and human health,” in Advanced Industrial Wastewater Treatment and Reclamation of Water: Comparative Study of Water Pollution Index during Pre-industrial, Industrial Period and Prospect of Wastewater Treatment for Water Resource Conservation, 197–209.
Hasan, M. K., Shahriar, A., and Jim, K. U. (2019). Water pollution in Bangladesh and its impact on public health. Heliyon 5, e02145. doi:10.1016/j.heliyon.2019.e02145
Hespanhol, I., and Prost, A. (1994). Who guidelines and national standards for reuse and water quality. Water Res. 28, 119–124. doi:10.1016/0043-1354(94)90125-2
Huang, D., Tian, Y., Yu, S., Wen, X., Chen, S., Gao, X., et al. (2022). Inversion prediction of cod in wastewater based on hyperspectral technology. J. Clean. Prod. 385, 135681. doi:10.1016/j.jclepro.2022.135681
Jiao, Y., Li, Z., Chen, X., and Fei, S. (2020). Preprocessing methods for near-infrared spectrum calibration. J. Chemom. 34, e3306. doi:10.1002/cem.3306
Jing, S., Ji, D. F., Mao, L., Chen, Y., Sun, Y., Huo, S., et al. (2017). Developing surface water quality standards in China. Resour. Conservation Recycl. 117, 294–303. doi:10.1016/j.resconrec.2016.08.003
Kolb, M., Bahadir, M., and Teichgräber, B. (2017). Determination of chemical oxygen demand (cod) using an alternative wet chemical method free of mercury and dichromate. Water Res. 122, 645–654. doi:10.1016/j.watres.2017.06.034
Li, J., Luo, G., He, L., Xu, J., and Lyu, J. (2018). Analytical approaches for determining chemical oxygen demand in water bodies: A review. Crit. Rev. Anal. Chem. 48, 47–65. doi:10.1080/10408347.2017.1370670
Li, J., Tong, Y., Guan, L., Wu, S., and Li, D. (2019). A turbidity compensation method for COD measurements by UV–vis spectroscopy. Optik 186, 129–136. doi:10.1016/j.ijleo.2019.04.096
Lin, L., Yang, H., and Xu, X. (2022). “Effects of water pollution on human health and disease heterogeneity: A review,” in Frontiers in environmental science.
Liu, Y., Wang, P., Gojenko, B., Yu, J.-J., Wei, L., Luo, D., et al. (2021). A review of water pollution arising from agriculture and mining activities in central Asia: Facts, causes and effects. Environ. Pollut. 291, 118209. doi:10.1016/j.envpol.2021.118209
Lv, Y., Xiang, Z., Chen, K., and Shao, L. (2011). “A new method of COD testing with BP neural network,” in Proceedings of 2011 International Conference on Electronics and Optoelectronics IEEE 4, V4-272.
Mäntele, W., and Deniz, E. (2017). Uv-vis absorption spectroscopy: Lambert-beer reloaded. Spectrochimica acta. Part A, Mol. Biomol. Spectrosc. 173, 965–968. doi:10.1016/j.saa.2016.09.037
Minchao, S., Fengyi, X., Chenglong, S., Jinye, L., and Weijian, L. (2013). Double wavelengths ultraviolet absorption method for organic wastewater cod measurement and its instrument design. Chin. J. Environ. Eng. 7, 396–400.
Niu, D., Wang, K., Sun, L., Wu, J., and Xu, X. (2020). Short-term photovoltaic power generation forecasting based on random forest feature selection and ceemd: A case study. Appl. Soft Comput. 93, 106389. doi:10.1016/j.asoc.2020.106389
Ogura, N. (1969). Ultraviolet absorbing materials in natural waters. Nippon. Kagaku Kaishi 90, 601–611. doi:10.1246/nikkashi1948.90.7_601
Peter, S. C., Dhanjal, J. K., Malik, V., Radhakrishnan, N., Jayakanthan, M., Sundar, D., et al. (2019). Encyclopedia of bioinformatics and computational biology. Editor S. Ranganathan, M. Grib-skov, K. Nakai, and C. Schönbach, 661–676.
Pisutpaisal, N., and Sirisukpoca, U. (2014). Development of rapid chemical oxygen demand analysis using ozone as oxidizing agent. Energy Procedia 50, 711–718. doi:10.1016/j.egypro.2014.06.087
Shi, Z., Chow, C. W. K., Fabris, R., Liu, J., and Jin, B. (2020). Alternative particle compensation techniques for online water quality monitoring using uv–vis spectrophotometer. Chemom. Intelligent Laboratory Syst. 204, 104074. doi:10.1016/j.chemolab.2020.104074
Siwiec, T., Reczek, L., Michel, M. M., Gut, B., Hawer-Strojek, P., Czajkowska, J., et al. (2018). Correlations between organic pollution indicators in municipal wastewater. Archives Environ. Prot. 44, 50–57.
Wang, X., Wu, D., Yuan, D., and Wu, X. (2022). A nano-lead dioxide-composite electrochemical sensor for the determination of chemical oxygen demand. J. Environ. Chem. Eng. 10, 107464. doi:10.1016/j.jece.2022.107464
Wayne, B. (1997). The science of chemical oxygen demand technical information series. USA: Hach Company, 22.
Ye, B., Cao, X., Liu, H., Wang, Y., Tang, B., Chen, C., et al. (2022). Water chemical oxygen demand prediction model based on CNN and ultraviolet-visible spectroscopy. Front. Environ. Sci., 2037.
Keywords: UV-Vis absorption spectroscopy, chemical oxygen demand, water quality, partial least squares, support vector machine
Citation: Xu X, Wang J, Li J, Fan A, Zhang Y, Xu C, Qin H, Mu F and Xu T (2023) Research on COD measurement method based on UV-Vis absorption spectra of transmissive and reflective detection systems. Front. Environ. Sci. 11:1175363. doi: 10.3389/fenvs.2023.1175363
Received: 27 February 2023; Accepted: 27 March 2023;
Published: 11 April 2023.
Edited by:
Geer Teng, University of Oxford, United KingdomReviewed by:
Bo Huang, Chongqing University, ChinaCopyright © 2023 Xu, Wang, Li, Fan, Zhang, Xu, Qin, Mu and Xu. This is an open-access article distributed under the terms of the Creative Commons Attribution License (CC BY). The use, distribution or reproduction in other forums is permitted, provided the original author(s) and the copyright owner(s) are credited and that the original publication in this journal is cited, in accordance with accepted academic practice. No use, distribution or reproduction is permitted which does not comply with these terms.
*Correspondence: Jihui Wang, d2poemhhb2ppZUBiaXQuZWR1LmNu; Jianan Li, bGlqaWFuYW5AYml0LmVkdS5jbg==
Disclaimer: All claims expressed in this article are solely those of the authors and do not necessarily represent those of their affiliated organizations, or those of the publisher, the editors and the reviewers. Any product that may be evaluated in this article or claim that may be made by its manufacturer is not guaranteed or endorsed by the publisher.
Research integrity at Frontiers
Learn more about the work of our research integrity team to safeguard the quality of each article we publish.