 Yipin Fan
 Jing Ning
- College of Management, Ocean University of China, Qingdao, China
In the context of China’s comprehensive poverty alleviation efforts, this study explores the differences in the re-poverty risk between households that have been lifted out of poverty before and after policy withdrawal, as well as the sensitivity of different family types to their livelihood capital. The study used data from 45,141 out-of-poverty households in Yucheng County, Henan Province, from 2016 to 2020, and combined the poverty vulnerability theory and short-fall risk method to evaluate the re-poverty risk. The Tobit model was used to explore the influence of livelihood capital on the re-poverty risk. The study found that the overall re-poverty risk is 1.13%, which increases to 18.09% after direct poverty alleviation policy is withdrawn. The risk of working families is significantly lower than farming families. All kinds of livelihood capital significantly reduce the re-poverty risk, with natural capital playing the most significant role. For different family types, the marginal contribution of financial capital to reducing the re-poverty risk is relatively larger in working households, while that of natural capital is larger in farming households. Specifically, labor capacity, arable land area, local leaders, and loans have a more significant inhibitory effect on the re-poverty risk. These findings provide valuable insights for formulating policies related to increasing household income and preventing the occurrence of re-poverty.
1 Introduction
Poverty is one of today’s most significant global challenges. As of 2015, more than 700 million people, or 10 percent of the world’s population, were still living in extreme poverty, struggling to meet the most basic needs such as healthcare, education, access to water and sanitation, mainly in regions such as Southern Asia and sub-Saharan Africa (United Nations, 2020). Poverty has a long-term negative impact on a country, including but not limited to exacerbating social conflicts, restricting economic development, and even affecting political stability. The United Nations has made ending poverty a top priority for sustainable development (Rosa, 2017). Fortunately, with the joint efforts of countries and organizations worldwide, global poverty has been effectively alleviated: the global incidence of poverty has decreased from 36.3% in 1990% to 8.4% in 2019 (World Bank, 2020). Among those countries struggling to reduce poverty, China, the largest developing country and once home to the largest number of poor people in the world (499.1 million in 1990), has made remarkable progress - ending absolute poverty in 2020 (Bikales, 2021). China’s success in poverty alleviation provides a reference for other countries to overcome poverty and promotes the anti-poverty process in the world (World Bank and the People’s Republic of China Development Research Center of the State Council, 2022).
Although worldwide poverty has improved, a thorny problem is gradually surfacing. People newly lifted out of poverty are vulnerable to an external shock that pushes them back into poverty, which is an inescapable problem in reducing poverty (Liu et al., 2018). Re-poverty, also known as returning to poverty or falling back into poverty, refers to the situation in which families or individuals who have been lifted out of poverty returns to the poverty again (Pan et al., 2021). It is considered to be a common economic and social phenomenon in the process of poverty alleviation. Re-poverty runs through the struggle against poverty and has a severely negative impact on poverty alleviation. It has not only directly eroded the achievements of poverty alleviation, but also reduced the confidence of the poor in the process of lifting themselves out of poverty successfully (Long and Liu, 2016). In addition, the difficulty of poverty alleviation will be increased, which may cause a severe waste of public resources (Dong et al., 2020). As a result, China, which has been completely lifted out of poverty, and any other developing countries still suffering from poverty, should pay attention to minimizing the occurrence of re-poverty in the process of poverty alleviation.
As global efforts to alleviate poverty continue, understanding the concept of re-poverty risk becomes increasingly important. Re-poverty risk refers to the probability that individuals or households, having escaped poverty, will experience a decline in their economic wellbeing and fall back into impoverished conditions (Zhang et al., 2022). This risk is often associated with various factors, such as economic instability, natural disasters, or health crises, and can be influenced by the availability and effectiveness of social safety nets and poverty reduction policies (Li Q. et al., 2022; X; Xu and Yang, 2022). In the past, re-poverty was primarily regarded as a byproduct of poverty, receiving little attention (Li et al., 2016; D; Zhou, Cai, and Zhong, 2021). However, as global poverty alleviation efforts progress and the number of impoverished individuals significantly decreases, stabilizing the economic status of households that have escaped poverty and preventing re-poverty have become pressing concerns for both governments and the academic community (Pan et al., 2021).
At present, research on re-poverty is still in its nascent stage, primarily focusing on the causes of re-poverty, strategies to address it, and the identification and mitigation of re-poverty risk. In terms of re-poverty causes, Senapati (2020) believes that idiosyncratic shocks (micro-level shocks such as illness or death of family members) and covariate shocks (meso-and macro-level shocks such as epidemic and economic reforms) are the leading causes of poverty and re-poverty among households and individuals. Ying and colleagues (2022), employing structural equation modeling, demonstrated that health shocks are the direct cause of poverty among potentially impoverished and poverty-avoiding populations. According to Dong et al. (2020), the burdens of education, medical care, and aging are the main reasons; Luo et al. (2020); Ur Rahman et al. (2021) believe that COVID-19 has significantly increased the likelihood of low-income families re-poverty, which is significantly correlated with education level and age of the householder. Ge and others (2022) contend that the main reason for the sudden decline in income and subsequent re-poverty of low-income households is due to the home isolation and travel restrictions imposed during pandemics. Moreover, Wang and Zhou (2022) argue that improperly managed relocation efforts are also one of the contributing factors to re-poverty among agricultural households.
Regarding countermeasures to prevent re-poverty, scholars have focused on improving regional services such as healthcare, education, and infrastructure. Song et al. (2021) argues that improving the efficiency of the New Rural Cooperative Healthcare System (NRCMS) plays the key role in preventing re-poverty caused by illness in China. Pan et al. (2021) discussed the temporal and spatial characteristics of China’s return to poverty and proposed countermeasures from the perspective of promoting urbanization and improving infrastructure. Xu et al.(2022) posit that clan-based networks can help rural households access lower-cost loans and find suitable employment opportunities, consequently reducing their risk of re-poverty.
In terms of identifying and mitigating re-poverty risk, existing studies have approached the issue from the perspective of poverty vulnerability, using various assessment methods to evaluate the risk of re-poverty. He and colleagues (2022), employing decision tree and logistic regression methods based on poverty vulnerability, measured re-poverty risk and demonstrated that improvements in ecological conditions and appropriate lending can effectively alleviate the issue of re-poverty. Zhang (2022) and Wang et al. (2023) have used BP neural networks to evaluate re-poverty risk based on poverty vulnerability, asserting that enhancing health and education in rural households is a crucial strategy for reducing this risk. Wu et al.(2022) proposed a method utilizing focused embedded logistic regression to identify rural households with potential re-poverty risk. Although some scholars have made efforts to study the causes and countermeasures of re-poverty, and others have introduced innovative methods to evaluate the risk of returning to poverty, a comprehensive quantitative assessment of re-poverty risk and its effective prevention have not been adequately addressed.
To fill the gaps in the research field of re-poverty risk, in this study, we selected 45,141 out-of-poverty households from Yucheng County in Henan Province, China, as the research object to evaluate and analysis their re-poverty risk. The remainder of this paper proceeds as follows: Section 2 relates to the related theoretical analysis and hypotheses. Section 3 presents the method, which includes data sources, assessment of re-poverty risk and influence effect analysis. Section 4 presents results and Section 5 presents discussion. In the final part Section 6, we present our conclusions and relevant implications.
2 Theoretical background and hypotheses
Risk is widely defined as (exposure to) the possibility of loss, damage, injury, or other adverse or unwelcome circumstance (Althaus, 2005; Aven, 2012). In poverty research, poverty risk is interpreted as the fact that some non-poor people have a high probability of falling into poverty when they experience external adverse shocks, also known as poverty vulnerability or vulnerability to poverty (Chaudhuri, Jalan, and Suryahadi, 2002; Bayudan-Dacuycuy and Lim, 2014; Ward, 2016; Sahasranaman, 2021). In quantifying poverty risk, the VEP approach is the most traditional and widely used, characterized as an ex-ante measure of the probability that a household will be poor in the future (Chaudhuri and Christiaensen, 2002). In practice, McCulloch and Calandrino (2003) directly use the intertemporal mean and variance of household income to estimate the parameters of future income distribution. Other researchers have used the probability of future income below the poverty line to measure poverty vulnerability based on their estimation of future income distribution (Kamanou and Morduch, 2002; Hoddinott and Quisumbing, 2003; Günther and Harttgen, 2009; Duclos et al., 2010; Gloede et al., 2015; Azeem et al., 2017). Therefore, the re-poverty risk studied in this paper is defined as the probability of an ending-poverty household falling into poverty again and measured by the probability of their future income falling below the poverty line.
Livelihood capital, by definition, consists of natural capital, physical capital, financial capital, human capital, and social capital, which is directly related to vulnerability of livelihood (DFID, 2000). According to previous studies, livelihood capital has been widely used to analyse poverty and vulnerability to poverty (Guo et al., 2019; Maingi, 2021). The existing studies suggest that improving livelihood capital (such as human, physical and social capital) positively affects poverty alleviation (Dartanto et al., 2020,; Guerry et al., 2015; Harrison, Montgomery, and Jeanty, 2019; Kheir, 2018). Re-poverty, like poverty, is one of the results of rural residents’ livelihood activities and may also be influenced by the accumulation of household livelihood capital. Natural capital is often represented by the area of land available to households, and households rich in natural capital typically have higher farm incomes (Guedes et al., 2014). Physical capital usually reflects the material living conditions of a family, and households with sufficient physical capital usually have a higher living standard and income level (Mercier, Ngenzebuke, and Verwimp, 2020). Financial capital is composed of financial income and credit capacity. Households with high financial capital have sufficient sources of funds (Senadjki et al., 2017). Human capital mainly represents the individual ability of family members, which is reflected in educational background, skills, and other aspects. Families with high human capital have higher employment competitiveness and production capacity and can create higher income (Olopade et al., 2019). Social capital is reflected in family interpersonal resources and cooperation ability. Households with high social capital tend to have more opportunities (Cheng, Wang, and Chen, 2022). As a result, the improvement of livelihood capital can directly or indirectly increase household income, thus reducing the occurrence of re-poverty.
Indeed, livelihood capital can significantly affect a household’s re-poverty risk. The magnitude of the re-poverty risk and the effect of household livelihood capital is also influenced by other factors. Related research found that supportive policies are one of the most important external factors (Hyman, Larrea, and Farrow, 2005). Kuang et al.(2019) found that fiscal and financial policies can reduce poverty by positively influencing the economic development of poverty-stricken counties and households. In the study of poverty in Asian, Gao and He (2022) believes that social assistance policy such as the unconditional cash transfer programmeDibao in China and Pantawid Pamilyang Program in the Philippines is effective measures to reduce poverty. In China’s proven targeted poverty alleviation policy, targeted cash and material subsidies to different levels of low-income families are an important part (Y. Zhou et al., 2018). However, policy support can also bring some disadvantages. The welfare dependency theory argues that the receipt of social assistance and benefits can be a major cause of people’s unemployment or poverty (Miller, 2004). Dependence on welfare policies manifests not only in the deliberate keeping of unemployment or poverty by families or individuals to receive subsidies but also in the temporary lifting out of poverty that relies heavily on subsidies (Y. Xu and Carraro, 2017). As a result, this paper argues that policy subsidies in cash will affect the household’s real re-poverty risk and further interfere with the effect of household livelihood capital.
On the other hand, household income structures are an essential internal factor that may influence re-poverty risk. Due to the widening income gap between the non-farm and agricultural sectors, rural households in many developing countries have experienced profound changes in the income structure (Y. Liu and Li, 2017; Rigg et al., 2018). At present, the income of farmers in developing countries is mainly divided into three parts: income from agricultural activities, non-farm income, and transfer payments (Haggblade, Hazell, and Reardon, 2010). Existing studies believe that non-agricultural income has gradually become the primary source of income for rural households, which has played an essential role in raising total household income and alleviating poverty (Addai et al., 2022). Duong et al. (2021) found that rural households’ participation in off-farm work can effectively raise their income levels. Shao-ping et al., 2021 proved empirically that rural households’ participation in non-farm employment could significantly reduce the risk of falling into poverty. Some scholars believe that households mainly engaged in farming or non-farm work result from actively selecting household livilihood strategies and are affected by household livelihood capital (Cai et al., 2019; Mao et al., 2020). They found that households with more natural capital are more likely to choose agricultural income as their primary source, while households with more human capital choose non-farm work. Therefore, there are differences in the re-poverty riks among households with different income structures and the sensitivity to livelihood capital.
Based previous research, especially on the impact of policy subsidies and the differences between households with different income structures, this paper proposes two hypotheses:
H1: The re-poverty risk exists among households in China, which will increase with the withdrawal of subsidies. Moreover, the re-poverty risk is higher for farming households (i.e., the primary source of income is farm income) than for working households (i.e., the primary source of income is non-farm work income).
H2: Increasing household livelihood capital will significantly reduce the re-poverty risk. However, this reduction effect is interfered with by subsidy policies and varies among households between farming and working families.
3 Methodology
3.1 Data sources
This paper takes rural out-of-poverty families in Yucheng County, Henan Province, as the research object, mainly considers the following aspects: First of all, Henan province, as a province with a sizeable rural population and an important grain-producing area in China, has achieved phased results in poverty alleviation in recent years despite the active implementation of targeted poverty alleviation policies. However, affected by subjective and objective factors such as natural disasters and major diseases, some families in Henan province who have been lifted out of poverty still have a certain degree of risk of returning to poverty. In 2019, Yucheng county successfully lifted itself out of poverty. In 2020, with 3449 poor families successfully lifted out of poverty, the whole county has completed the task of poverty alleviation. In addition to the short time of poverty alleviation, its regional characteristics and population size also reflect traditional counties in China. Therefore, it is representative to select Yucheng County in Henan Province as the research area at the intersection of poverty alleviation and rural revitalization. Secondly, there are 601 administrative villages in Yucheng County, Henan Province, covering 49,685 out-of-poverty families. There are various types of family structure in these families, and the factors leading to poverty are also different, which have the essential characteristics of the existing out-of-poverty families in China. Therefore, it is of universal significance to use the family data of Yucheng County in Henan Province. To sum up, taking Yucheng County of Henan Province as the research area, it is of great research value to discuss the risk of re-poverty of out-of-poverty families in China and the prevention measures.
The primary data source in this study is the statistical data of Yucheng County in 2020 in China’s poverty alleviation registration system, which has recorded data of all poverty households in China since 2014. This database covers 39 types of data of 49,685 out-of-poverty families, basic information such as gender, age, education level of householders, and family size, to detailed information such as source of income, land size, and material assets. These data provide a comprehensive picture of the living conditions of families in poverty alleviation. In addition, relevant data from 2016 to 2020 in the Targeted Poverty Alleviation Big Data Management Platform of Henan Province were used in this study to supplement and verify the data of out-of-poverty families. Due to the absence of a few critical variables, 4,553 households were excluded after data screening. Finally, the date of 45,141 out-of-poverty households are used to evaluate the re-poverty risk.
3.2 Re-poverty risk assessment
In specific calculation, we adopt the Shorfall-risk (SR) method in the field of finance (Leibowitz and Langetieg, 1989). As a method used in calculations of unilateral tail risk, SR focuses on calculating the probability that a target value (e.g., return rate, net asset value) will fall below a specific value over a period of time (Coggeshall and Wu, 2005; Leibowitz, Bova, and Hammond, 2010). Therefore, combined with the concept of re-poverty risk mentioned above, the SR method is appropriate to use in this paper to assess the re-poverty risk as the probability of household income falling below the poverty line in the next year (López-Calva and Ortiz-Juarez, 2014). We construct a re-poverty risk assessment model based on three steps. Firstly, identify the threshold value that determine whether re-poverty has occurred; Secondly, calculate the future income of out-of-poverty households; Finally, construct a assessment model to assess the re-poverty risk. The detailed process of each step is as follows.
3.2.1 Determining thresholds and calculating income
Poverty is a multidimensional concept that includes economic, cultural, rights, and other aspects. However, due to difficulties in data collection, complex evaluation methods, and subjectivity, various countries and regions still use income or expenditure as the evaluation standard in practice. Therefore, this study takes those families’ per capita net income as the threshold value to evaluate the risk of re-poverty. Based on China’s absolute poverty line in recent years, this paper finally set the re-poverty line as 4240 yuan after adjusting the price level.
After that, the primary task of predicting the income of out-of-poverty families is to determine the distribution of household income. This study assumes that the future per capita net income of the residents from the out-of-poverty families in Yucheng County obeys a normal distribution (Bain and Engelhardt, 2000). The reasons are as follows: First, risks are best measured in probability distribution functions (Jorion, 2007, 80). Second, the re-poverty risk in this study is determined by the probability that farmers’ future income is lower than the poverty line, and it is not affected by real income’s positive or negative value. Third, it conforms to the requirements of the risk calculation method selected in this study.
Subsequently, we calculate the average growth rate of the household per capita net income. In this study, the geometric average growth rate was used to describe the income changes of out-of-poverty families. Because the target families have been lifted out of poverty earlier (2–3 years ago), their income is relatively stable, and infrastructure such as roads and networks is relatively perfect. Poverty alleviation support policies and subsidies will be relatively stable over the next 5 years. As a result, the growth rate after deducting special subsidies for poverty alleviation can be calculated as follows:
In formula 1,
Finally, the model of household per capita net income is constructed as follows:
In formula 2,
3.2.2 Build the risk assessment model
Combined with the SR model and results in Formula 2, a risk assessment model for re-poverty was established (Figure 1).
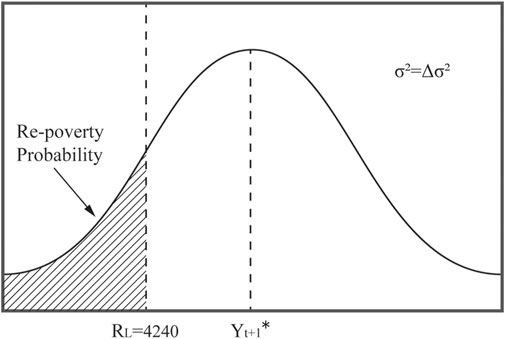
FIGURE 1. Re-poverty risk assessment model.
Based on the Monte Carlo simulation method, this study uses the distribution function of the NumPy program library in Python language to directly generate the random number ε that meets the standard normal distribution and puts ε into formula (2) to obtain the predicted household income data in the next year. The above process was repeated 10,000 times for each rural out-of-poverty family and obtained 10,000 predicted results for each family’s future income to improve prediction accuracy.
It can be concluded that the probability lower than
3.2.3 Result processing
In order to better study the hypothesis and explore the differences between families with different income structures before and after the withdrawal of policy subsidies, this paper makes the following treatment based on the above results.
(1) The result in 3.2.3 is defined as
(2) The re-poverty risk after the withdrawal of policy subsidies is defined as
In formula 3,
Then this paper takes the proportion of primary income as the classification standard (D. Xu et al., 2019) and screens out working and farming families based on
(3) The re-poverty risk after the withdrawal of policy subsidies in working families that the primary source of family income is wage income (
(4) The re-poverty risk the withdrawal of policy subsidies in farming families that the primary source of family income is agricultural production (
3.3 Influence effect analysis
3.3.1 Variable selection and definition
This paper takes livelihood capital as an explanatory variable to explore the impact of livelihood capital on the re-poverty risk (Table 1).
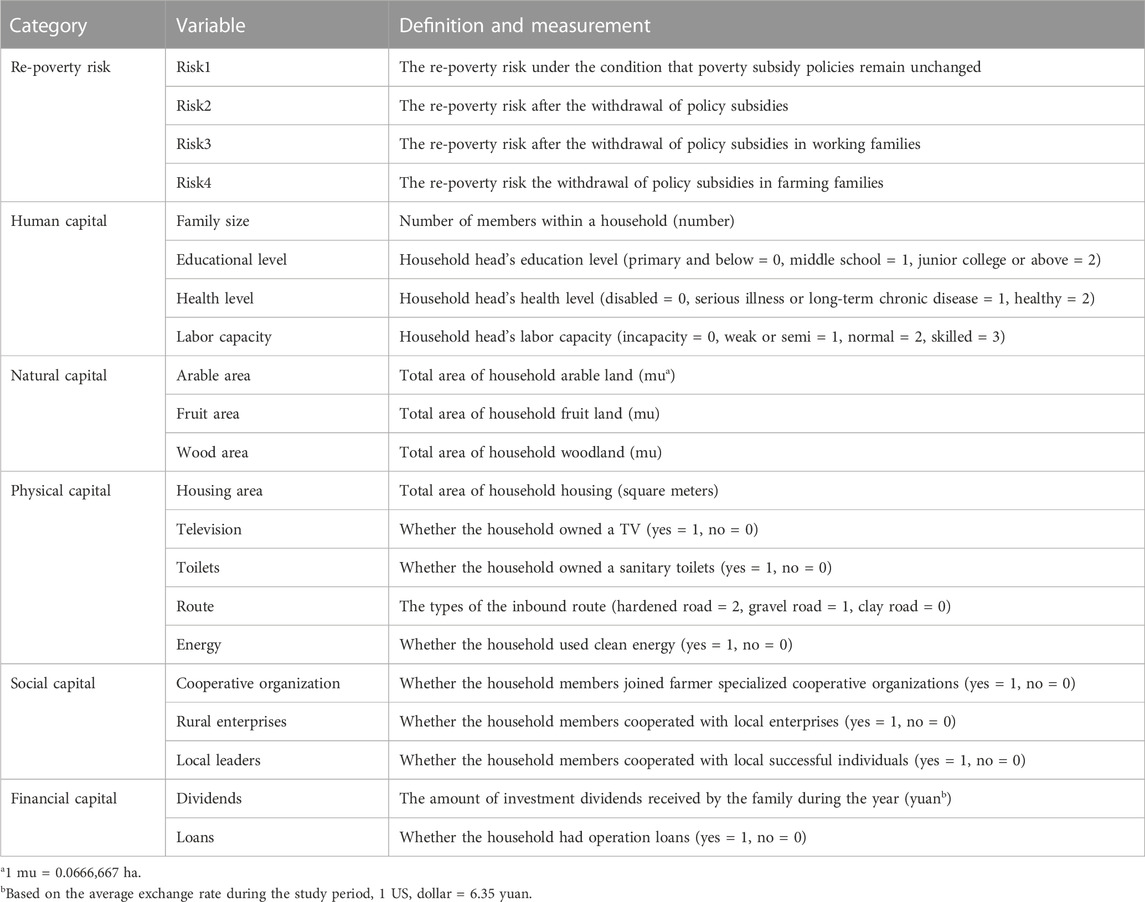
TABLE 1. Definition and measurement of re-poverty risk and livhood capital.
3.3.1.1 Explained variables
This section analyzes the four risks (
3.3.1.2 Explanatory variables
As the core component of the sustainable analysis framework, livelihood capital is composed of human capital, natural capital, material capital, social capital, and financial capital (DFID, 2000). Regarding the research by Cao et al. (2016), LIU et al. (2021), Wang, Lan, et al. (2021), and other studies, variables in the database were classified into various dimensions of livelihood capital. The detailed information was as follows:
Human capital in this study consists of four variables, including family size, head education level, head health level, and head labor ability.
Natural captial in this study consists of three variables, including cultivated area, fruit area, and forest area.
Physical capital in this study consists of five variables, including housing area, route type (route), whether there is a TV (television), whether there is a sanitary toilet (toilte), and whether clean energy is used (energy).
Social capital in this study consists of three variables, including whether to join farmer cooperative organizations (cooperative organizations), whether to be led by leading enterprises (rural enterprises), whether to be led by entrepreneurial leaders (local leaders).
Financial capital in this study consists of two variables, including whether there are investment dividends (dividends), whether there are operating loans (loans). It is important to note that household income is essential to financial capital. However, since the calculation and determination of the re-poverty risk in the explained variables are derived from farmers’ household income, in order to avoid endogenous errors, income is no longer taken as the explanatory variable of financial capital.
3.3.2 Tobit model
In this study, the dependent variable in the model was rural households’ re-poverty risks, which is a kind of censored data limited by the numerical characteristics between 0 and 1. Therefore, based on the risk assessment of re-poverty risks in the previous section, this study used two-limited Tobit models to analyze the impact of livelihood capital on the re-poverty risk. The Tobit model, introduced by James Tobin in 1958, is designed for analyzing estimations with censored dependent variables, offering a robust approach to handle such data constraints (Tobin, 1958). And the whole process was implemented by Stata 14.0.
3.3.2.1 Regression analysis of livelihood capital dimension
To discuss and compare the impact of different kinds of livelyhood capitals on the re-poverty risk, this study used the min-max normalization method to conduct dimensionless processing on different dimensions of these five capitals (Han, Pei, and Kamber, 2011).
In formula 4,
Then the regression equation of factors affecting the re-poverty risk is as follows:
In formula 5, the explained variable
3.3.2.2 Regression analysis of single livelihood capital variable dimension
Multiple linear regression is also used to analyze all variables under a single livelihood capital, and the regression model is constructed as follows:
In the above formula,
The influence of alternative livelihood capital variables on the risk of re-poverty can be examined within the Tobit model framework by substituting the explanatory variables in formula 6. Because of the limitation of length, no more tautology here. It should be noted that this study utilizes a 5-year dataset of farm household income to assess the re-poverty risk, yet time series data are not employed in the impact effect analysis section. And the primary objective of this research is to investigate the relationship between livelihood capital and the risk of re-impoverishment. Consequently, the Johansen cointegration and Granger causality tests are not applied in this context, as they are not suited to the study’s specific focus and methodology.
4 Results
4.1 Results of re-poverty risk messurement
Based on the income data of 45141 out-of-poverty families in Yucheng County from 2016 to 2020, the re-poverty risk are calculated according to the relevant model steps in the above chapter -
(1) According to the values of
(2) According to the value of
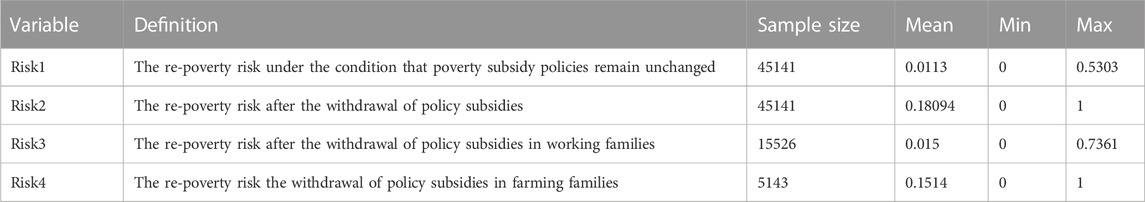
TABLE 2. Results of re-poverty risk messurement.
4.2 Results of influence effect analysis
4.2.1 Descriptive statistical analysis
Preliminary statistics and analysis were made on the sample data, and relevant variables and descriptive statistical analysis were shown in Table 3.
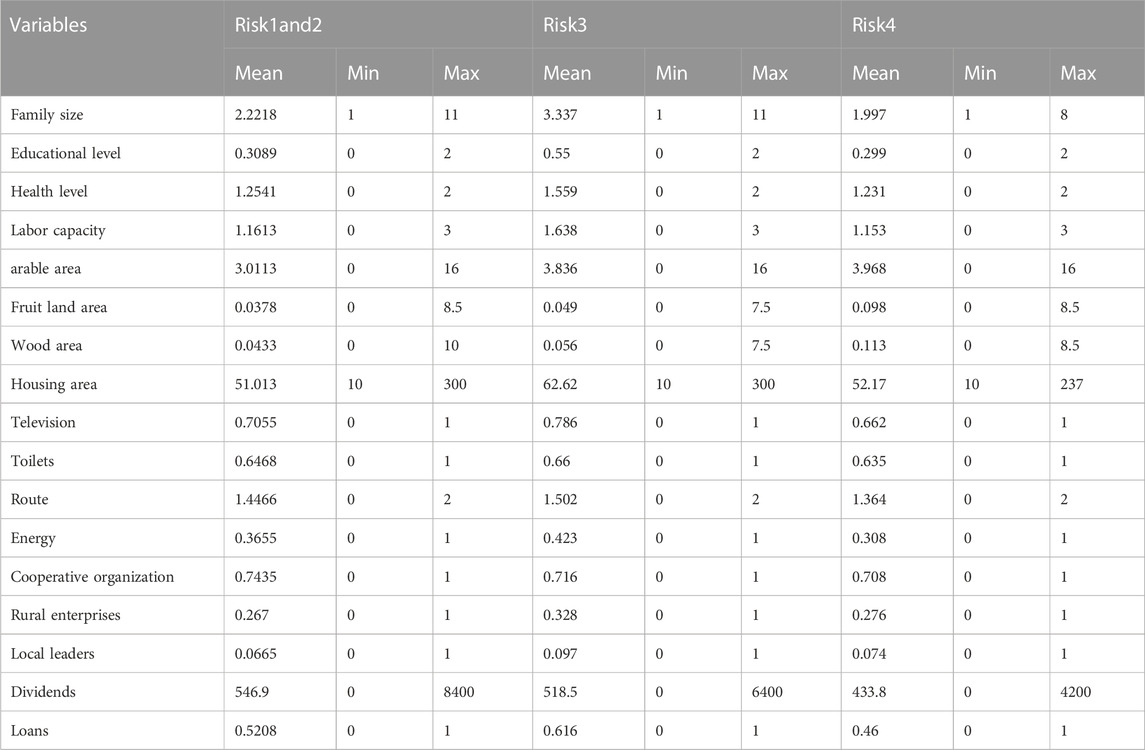
TABLE 3. Relevant variables and descriptive statistical analysis.
It can be seen that, on the whole, the livelihood capital of families in Yucheng County is inadequate. As for human capital, the aging population is a primary problem for these families, the average head of household is 67 years old. The low quantity and quality of the labor force is another dilemma facing out-of-poverty families. Most families have only two effective workers, their education level is still at middle school or below, and their labor skills are weak. As for natural capital, apparently, arable land is the primary kind of local agricultural land, and the average household area is about 3 mu. As for physical capital, compared with non-poor families, there is still a gap in all aspects, especially the average housing area is only 50 square meters, and the utilization rate of clean energy only accounts for 30%.As for social capital, 74.35% of the local poverty-stricken families joined agricultural production cooperation organizations, while only 2.63% cooperated with enterprises, and less than 1% cooperated with individuals. Even though half of the households have loans, the average household income from investment dividends is just 546.9.
Through horizontal comparison, it is clear that almost all kinds of the capital of working families are significantly better than the average of farming families and the total sample. Working families have the most significant advantage in financial capital.
For example, the average head of a migrant household is about 56 years old, 10 years younger than the farming household and the total sample. Similarly, the average number of laborers in working families is 3.34, compared with less than 2 in farming families. As for natural capital, however, farming families have a slight advantage over working families, especially in the wood area (0.113 and 0.056 mu per household, respectively). As for physical and social capital, although working families still have some advantages, the gap is not significant. In terms of financial capital, the average investment dividend income of the two types of families is lower than that of the overall sample, while the working families have higher household loans.
4.2.2 Empirical results analysis
4.2.2.1 The influence of aggregate livelihood capitals on the re-poverty risks
It can be seen from Table 4 that human capital, natural capital, physical capital, and social capital generally have a significant negative impact on the re-poverty risk; that is, the greater the human capital, natural capital, physical capital, and social capital does out-of-poverty families have, the lower the re-poverty risk.

TABLE 4. Tobit regression estimates of aggregate livelihood capital to re-poverty riska.
From the perspective of policy withdrawal, comparing model1 and model2, it can be concluded that the withdrawal of poverty alleviation policy significantly enhances the inhibitory effect of various livelihood capitals on the re-poverty risk. In addition, according to Model 2, natural capital have the most outstanding marginal contribution to reducing the re-poverty risk for out-of-poverty families after the withdrawal of poverty alleviation policies (each additional unit can reduce the risk by 98.5%).
From the primary source of household income, all types of livelihood capital have a significant restraining effect on the re-poverty risk for both working families and farming families. Specifically, financial capital has most significant impact for working families to reduce re-poverty risk (−5.42%) while farming families are more dependent on natural capital (−25%).
4.2.2.2 The influence of livelihood capital variables on the re-poverty risk
As for human capital variables (Table 5), it can be seen from Models 5 and 6 that the education level and labor capacity of the householder and family size have significantly impacts on the re-poverty risk. The withdrawal of poverty alleviation subsidy policy also increases the marginal effect of each variable on restraining the re-poverty risk. Among them, head’s labor capacity has the most significant negative impact on the re-poverty risk. From the primary source of household income, whether the main source of household income is wage income or farming income, the marginal contribution of householders’ labor capacity to reducing the re-poverty risk is always the largest (-0.279% and −5.21%, respectively). However, family size will significantly increase the re-poverty risk in working families (0.22%), compared with the health level in farming families (1.25%).
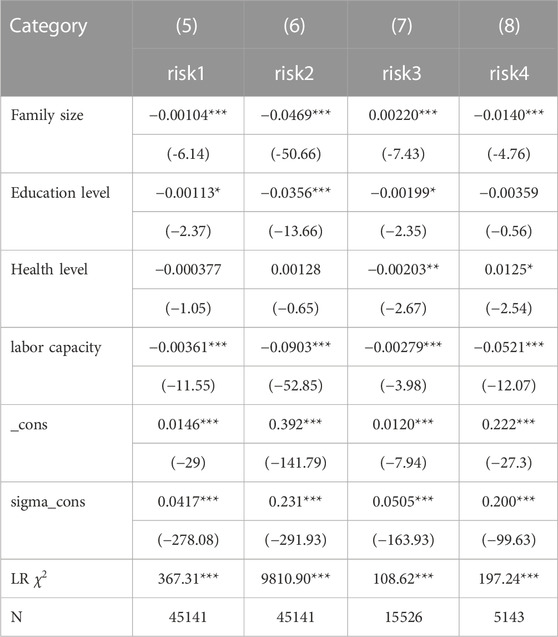
TABLE 5. Tobit regression estimates of human capital variables to re-poverty risk.
As for nature capital variables (Table 6), by comparing models 9 and 10, it can be seen that the increase of various natural capital variables after the withdrawal of the poverty alleviation policy can significantly reduce the households’ re-poverty risk. Among them, natural capital were not significant. Specifically, Specifically, farming families are more dependent on arable land than working families to reduce the re-poverty risk (-0.883% and −0.0495%, respectively).
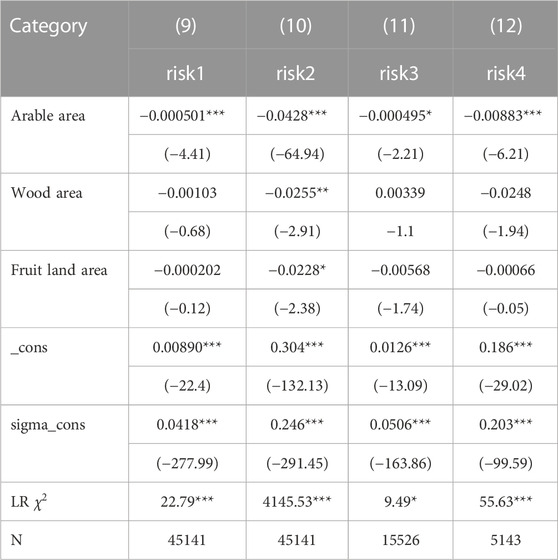
TABLE 6. Tobit regression estimates of natural capital variables to re-poverty risk.
As for physical variables (Table 7), based on models 13 and 14, although each variable of physical capital significantly impacts the re-poverty risk, the withdrawal of the poverty alleviation subsidy policy still strengthens their negative impact significantly. Among these variables, television ownership had the most significant negative marginal effect on reducing the re-poverty risk (-2.1%). From the perspective of primary household income, all the material capital variables significantly negatively impact the re-poverty risk in working families (model 15). In contrast, only energy type, housing area, and road type variables significantly impact the re-poverty risk in farming families (model 16).
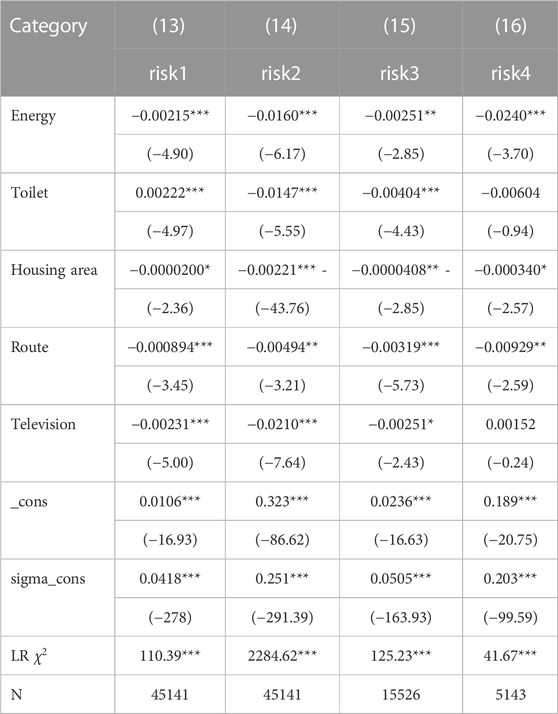
TABLE 7. Tobit regression estimates of physical capital variables to re-poverty risk.
As for social capital (Table 8), regardless of whether the poverty alleviation support policies were withdrawn or not, all social capital variables had a significant restraining effect on the re-poverty risk, and the contribution of local leaders is most prominent (-8.25% after policies withdrawn). From the perspective of primary household income, all social capital variables have a significant negative effect on both working and farming families, and the local leadership variable is also the most significant (-0.902% and −3.1%, respectively).
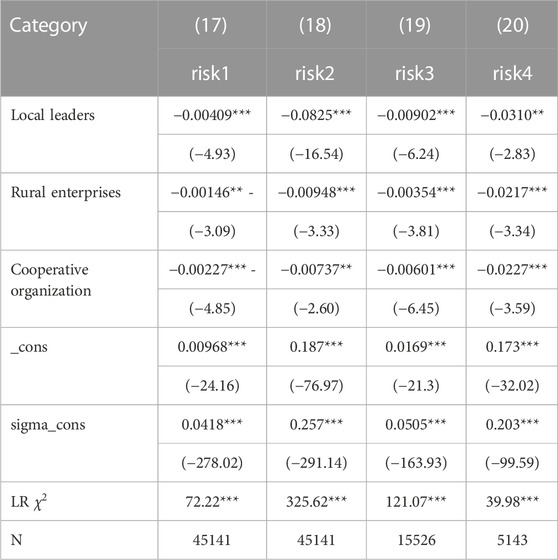
TABLE 8. Tobit regression estimates of social capital variables to re-poverty risk.
As for financial capital (Table 9), financial capital variables also significantly negatively impact the re-poverty risk before and after the policy withdrawal. The most significant variable in financial capital, Loans, is the marginal effect that rises from −2.81% to −12.8% after the policy is withdrawn. From the perspective of primary household income, loans are also the most significant variable within financial capital. Having loans reduced the re-poverty risk by 2.8% for working families and 11.7% for farming families.
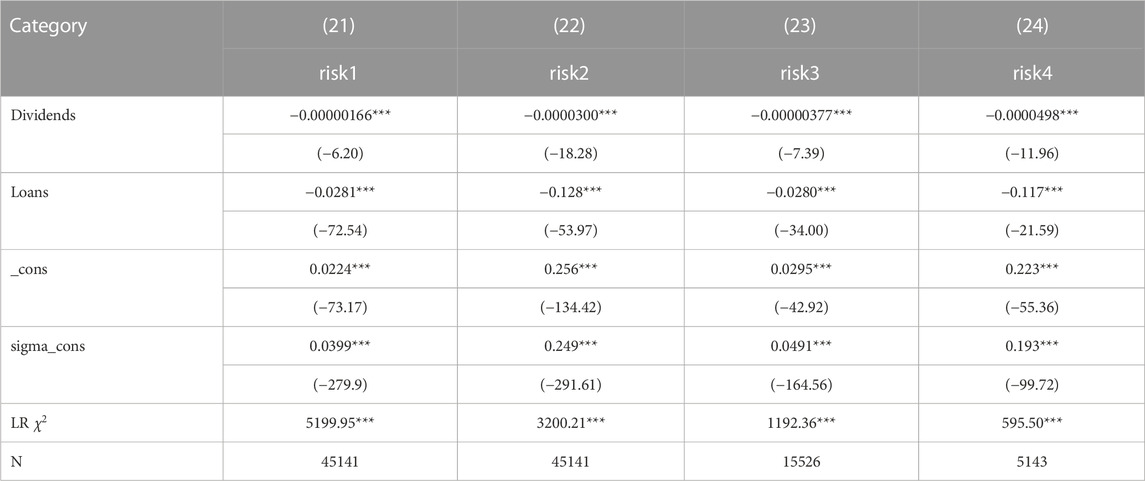
TABLE 9. Tobit regression estimates of financial capital variables to re-poverty risk.
5 Discussion
This study took all out-of-poverty households in Yucheng Country as the research object, used the shortfall-risk model to evaluate the re-poverty risk before and after the policy withdrawal and for families with different income structures, and analysed the impact of livelihood capital on the re-poverty risk. Compared with the existing research, the marginal contributions of this study are as follows: firstly, this study developed an effective model to assess household’s re-poverty risk based on their recent income; this can identify high-risk households and offer timely help to prevent them from falling back into poverty. Secondly, taking Yucheng County as an example, the study revealed the dependence of China’s overall poverty alleviation on subsidy policies. Besides, this study further classified farmers on the premise of policy withdrawal, which made the results and implications have more targeted and practical significance.
Consistent with the research by Liu et al. (2020), Nguyen et al. (2020), Wang et al. (2020), Wang, Lan, et al. (2021) and other studies, this study also found that all types of livelihood capital can significantly alleviate poverty and reduce the re-poverty risk. For example, some scholars believe that natural capital and human capital have the most significant effect on poverty alleviation and reducing re-poverty risk (Guerry et al., 2015; Huay and Bani, 2018; Xu et al., 2019). The research results of this paper confirm this conclusion. Most of the existing studies are based on the population sample perspective to explore the impact of livelihood capital and its variables. However, this study sub-divided family types into working and farming families to explore further the impact of livelihood capitals and variables on the re-poverty risk after the policy withdrawal.
On the aggregate livelihood capital level, it is found that the impact of livelihood capital on the re-poverty risk differs between working and farming families. Financial capital has the most significant marginal effect on reducing the re-poverty risk for working families, while natural capital is the most significant livelihood capital for farming families. The possible reason is that the income channels of migrant families are more diversified, and financial capital is the best embodiment of a family’s total income capacity. In addition, as the overall household human capital in Yucheng County is still at a low level, the impact of human capital on the risk of returning to poverty is not prominent. In contrast, the household income of farming families is mainly derived from agricultural production activities, while the quality of natural capital directly determines the efficiency and output of farmers’ participation in agricultural production. Therefore, natural capital directly determines the income of peasant households to some extent, thus affecting their re-poverty risk.
On livelihood capital variables level, labor capacity, arable land area, local leaders, and loans are the most significant variables in their livelihood capital dimensions, regardless of the total sample, migrant households, or farming households. It is worth noting that compared with previous studies, the results of this study show the following differences. In the dimension of human capital, for example, there is a significant positive correlation between family size and the re-poverty risk in working families, and the health level of the household head has the same trend in farming families. The possible reason for the abnormalities is that migrant families may not be able to transform the family population into the labor force due to the limitation of the minimum working age. Instead, an excessive population will increase the living burden, thus causing an increase in the re-poverty risk. For farming families, it may be because of welfare policies such as serious illness subsidies, families troubled by diseases will get more excess returns, thus affecting the re-poverty risk for farming families.
Furthermore, this study has several limitations that warrant attention in future research. For instance, the research focused on Yucheng County as the study area. Although Yucheng County is representative of the majority of out-of-poverty families in China in terms of population, income structure, and other aspects, the findings may not be directly applicable to more complex regions, such as western China and ethnic minority areas. Additionally, this study is based on secondary data, which might introduce inherent limitations, such as inconsistencies in data collection or measurement methods, and potential biases or inaccuracies in the original data. Future studies could strive to address these limitations by collecting primary data or employing a more comprehensive approach. Lastly, this study primarily concentrates on the dimension of family income when calculating the re-poverty risk. Nonetheless, as the rural revitalization strategy is implemented, the life satisfaction and happiness of these households also merit consideration, indicating potential avenues for future research.
6 Conclusions and implications
Though the above analysis, the following conclusions can be stated.
(1) Under normal circumstances, the overall re-poverty risk of households in Yucheng County of Henan Province does exist and is at a relatively low level (1.13%). However, the withdrawal of the subsidy policy will increase the re-poverty risk to 18.09%, which means nearly one-fifth of the out-of-poverty families will fall back into poverty. The re-poverty risk in working families is significantly lower than that in farming families (1.50% and 15.14%, respectively).
(2) Human, natural, physical, social, and financial capital, all kinds of livelihood capital, significantly restraining the re-poverty risk. The withdrawal of the subsidy policy will enhance the inhibitory effect of livelihood capital on the re-poverty risk. Differences in the impact of households with different income structures do exist.
Overall, natural capital plays the most significant role in reducing risk, followed by human capital and physical capital. From the perspective of the primary source of household income, the marginal contribution of financial capital to reducing the re-poverty risk in working households is the largest, while that of natural capital in farming households. Specifically, after the exit of poverty alleviation subsidies, labour capacity, arable land area, local leaders and loans have a more significant inhibitory effect on the re-poverty risk. And comepared with working families, the re-poverty risk is more sensitive to livelihood capital for out-of-poverty households with mainly agricultural income.
The CPC Central Committee and The State Council developed an policy that a 5-year transition period were set up after comprehensive poverty alleviation to consolidate poverty alleviation achievements and promote the implementation of the rural revitalization strategy. In the context of this policy, the results of this study have important policy implications. On the one hand, for example, this study proves the necessity of maintaining the poverty alleviation subsidy policy for 5 years through empirical results. The difference in the re-poverty risk before and after the withdrawal of poverty alleviation policy proves that the dependence of out-of-poverty families on poverty alleviation subsidy policy is still at a high level. This suggests that instead of focusing on the numerical results of poverty alleviation, we should pay more attention to the actual living conditions of these families after the withdrawal of policies and put policies focus on improving the economic independence of these families. Besides, based on the result that the re-poverty risk of working families is significantly lower than farming families, the government should create multiple employment opportunities for farming families to widen their income source. On the other hand, the results of the impact effect analysis in this study provide some contributions to the implementation of the policy. For instance, it is necessary to increase investment in human and natural capital in poverty areas, improve the labor capacity of households, increase the area of cultivated land and production efficiency, promote cooperation between residents and local leaders, and provide a variety of loans and financial services. In addition, the government should also take household income structure into account when implementing specific policies. Under the premise of limited policy resources, the government should focus on promoting the financial capital for working families and increasing the accumulation of natural capital for farming families.
Data availability statement
The data analyzed in this study is subject to the following licenses/restrictions: The data will be used in subsequent studies. Requests to access these datasets should be directed to the corresponding author. Requests to access these datasets should be directed to HQ, cWluaG9uZ0BvdWMuZWR1LmNu.
Author contributions
YF and HQ contributed to the conception, design, and formal analysis of the study. YF performed the methodology, software, data curation, and writing–original draft preparation. HQ performed the validation, investigation, and writing–review and editing. JN performed the writing–review and editing and supervision. All authors contributed to manuscript revision, read, and approved the submitted version.
Acknowledgments
This is a short text to acknowledge the contributions of specific colleagues, institutions, or agencies that aided the efforts of the authors. We would like to express our gratitude to Ding Ding, Dasheng Fan, and Kongjiang Zhu for their invaluable assistance in data collection and processing. Their expertise and dedication have been essential to the success of this study. We are deeply indebted to them for their generosity and support.
Conflict of interest
The authors declare that the research was conducted in the absence of any commercial or financial relationships that could be construed as a potential conflict of interest.
Publisher’s note
All claims expressed in this article are solely those of the authors and do not necessarily represent those of their affiliated organizations, or those of the publisher, the editors and the reviewers. Any product that may be evaluated in this article, or claim that may be made by its manufacturer, is not guaranteed or endorsed by the publisher.
References
Addai, K. N., Ng’ombe, J. N., and Lu, W. (2022). Disaggregated impacts of off-farm work participation on household vulnerability to food poverty in Ghana. J. Econ. Inequal. 21, 83–104. doi:10.1007/s10888-022-09543-9
Althaus, C. E. (2005). A disciplinary perspective on the epistemological status of risk. Risk Anal. 25 (3), 567–588. doi:10.1111/j.1539-6924.2005.00625.x
Aven, T. (2012). The risk concept—historical and recent development trends. Reliab. Eng. Syst. Saf. 99, 33–44. doi:10.1016/j.ress.2011.11.006
Azeem, M. M., Mugera, A. W., Schilizzi, S., and Siddique, K. H. M. (2017). An assessment of vulnerability to poverty in Punjab, Pakistan: Subjective choices of poverty indicators. Soc. Indic. Res. 134 (1), 117–152. doi:10.1007/s11205-016-1419-x
Bain, L. J., and Engelhardt, M. (2000). Introduction to probability and mathematical statistics. Belmont, Calif: Duxbury Press.
Bayudan-Dacuycuy, C., and Lim, J. A. (2014). Chronic and transient poverty and vulnerability to poverty in the Philippines: Evidence using a simple spells approach. Soc. Indic. Res. 118 (1), 389–413.
Bikales, B. (2021). “Reflections on poverty reduction in China,” in Report supported by the Swiss agency for development and cooperation.
Cai, J., Wang, T., Xia, X., Chen, Y., Lv, H., and Ni, L. (2019). Analysis on the choice of livelihood strategy for peasant households renting out farmland: Evidence from western poverty-stricken areas in China. Sustainability 11 (5), 1424. doi:10.3390/su11051424
Cao, M., Xu, D., Xie, F., Liu, E., and Liu, S. (2016). The influence factors analysis of households’ poverty vulnerability in southwest ethnic areas of China based on the hierarchical linear model: A Case study of liangshan Yi autonomous prefecture. Appl. Geogr. 66, 144–152. doi:10.1016/j.apgeog.2015.11.016
Chaudhuri, S., Jalan, J., and Suryahadi, A. (2002). Assessing household vulnerability to poverty from cross-sectional data: A methodology and estimates from Indonesia. doi:10.7916/D85149GF
Cheng, X., Wang, J., Kevin, Z., and Chen, (2022). Does villager social capital hinder poverty targeting? Evidence from poverty-stricken county of western China. China Econ. Rev. 71, 101728. doi:10.1016/j.chieco.2021.101728
Coggeshall, S., and Wu, G. (2005). Asset allocation and long-term returns: An empirical approach. Available at SSRN 873184.
Dartanto, T., Faizal Rahmanto, M., and Otsubo, S. (2020). Intragenerational economic mobility in Indonesia: A transition from poverty to the middle class in 1993–2014. Bull. Indonesian Econ. Stud. 56 (2), 193–224. doi:10.1080/00074918.2019.1657795
DFID (2000). Sustainable livelihoods guidance sheets. London: Department for International Development.
Dong, X., Guo, Z., Shi, J., Lu, X., Zhang, C., and Tang, X. (2020). “Research on the causes of Re-poverty based on the data analysis of S county,” in Third international conference on social science, public health and education (SSPHE 2019) (Atlantis Press), 158–161.
Duclos, J-Y., Araar, A., and Giles, J. (2010). Chronic and transient poverty: Measurement and estimation, with evidence from China. J. Dev. Econ. 91 (2), 266–277. doi:10.1016/j.jdeveco.2009.09.002
Duong, P. B., Pham Tien, T., and Ancev, T. (2021). Impacts of off-farm employment on welfare, food security and poverty: Evidence from rural vietnam. Int. J. Soc. Welf. 30 (1), 84–96. doi:10.1111/ijsw.12424
Gao, Q., and Alex, J. H. (2022). Poverty alleviation in Asia: Future directions in measurement, monitoring, and impact evaluation. J. Asian Public Policy 15 (1), 32–42. doi:10.1080/17516234.2021.2014627
Gloede, O., Menkhoff, L., and Hermann, W. (2015). Shocks, individual risk attitude, and vulnerability to poverty among rural households in Thailand and vietnam. World Dev. 71, 54–78. doi:10.1016/j.worlddev.2013.11.005
Guedes, G. R., VanWey, L. K., HullMariangela, J. R. A., and Barbieri, A. F. (2014). Poverty Dynamics, ecological Endowments, and land use among Smallholders in the Brazilian Amazon. Soc. Sci. Res. 43, 74–91. doi:10.1016/j.ssresearch.2013.09.002
Guerry, A. D., Stephen, P., Jane Lubchenco, , Chaplin-Kramer, R., Daily, G. C., Griffin, R., et al. (2015). Natural capital and ecosystem services informing decisions: From promise to practice. Proc. Natl. Acad. Sci. 112 (24), 7348–7355. doi:10.1073/pnas.1503751112
Günther, I., and Harttgen, K. (2009). Estimating households vulnerability to idiosyncratic and covariate shocks: A novel method applied in Madagascar. World Dev. 37 (7), 1222–1234. doi:10.1016/j.worlddev.2008.11.006
Guo, S., Lin, L., Liu, S., Wei, Y., Xu, D., Li, Q., et al. (2019). Interactions between sustainable livelihood of rural household and agricultural land transfer in the mountainous and hilly regions of sichuan, China. Sustain. Dev. 27 (4), 725–742.
Haggblade, S., Hazell, P., and Reardon, T. (2010). The rural non-farm economy: Prospects for growth and poverty reduction. World Dev. 38 (10), 1429–1441. doi:10.1016/j.worlddev.2009.06.008
Harrison, J. L., Montgomery, C. A., and Wilner Jeanty, P. (2019). A spatial, simultaneous model of social capital and poverty. J. Behav. Exp. Econ. 78, 183–192. doi:10.1016/j.socec.2018.09.001
Hoddinott, J., and Quisumbing, M. A. R. (2003). Data sources for microeconometric risk and vulnerability assessments. Citeseer.
Huay, C. S., and Bani, Y. (2018). Remittances, poverty and human capital: Evidence from developing countries. Int. J. Soc. Econ. 45 (8), 1227–1235. doi:10.1108/IJSE-10-2017-0454
Hyman, G., Larrea, C., and Farrow, A. (2005). Methods, results and policy implications of poverty and food security mapping assessments. Food Policy 30 (5–6), 453–460. doi:10.1016/j.foodpol.2005.10.003
Jorion, P. (2007). VALUE at RISK:the new benchmark for managing financial risk. 3rd ed. The McGraw-Hill Companies, Inc. Available at: https://www.lehmanns.de/shop/wirtschaft/7092292-9780071464956-value-at-risk-3rd-ed.
Kheir, V. B. (2018). The nexus between financial development and poverty reduction in Egypt. Rev. Econ. Political Sci. 3 (2), 40–55. doi:10.1108/REPS-07-2018-003
Kuang, X., Liu, H., Guo, G., and Cheng, H. (2019). The nonlinear effect of financial and fiscal policies on poverty alleviation in China—an empirical analysis of Chinese 382 impoverished counties with PSTR models.” edited by stefan cristian gherghina. PLOS ONE 14 (11), e0224375. doi:10.1371/journal.pone.0224375
Leibowitz, M. L., Anthony, B., and Brett Hammond, P. (2010). The endowment model of investing: Return, risk, and diversification, 534. John Wiley and Sons.
Leibowitz, M. L., and Langetieg, T. C. (1989). Shortfall risk and the asset allocation decision: A simulation analysis of stock and bond risk profiles. J. Portfolio Manag. 16 (1), 61–68. doi:10.3905/jpm.1989.409236
Li Q., Q., Sun, P., Li, B., and Mohiuddin, M. (2022). Impact of climate change on rural poverty vulnerability from an income source perspective: A study based on CHIPS2013 and county-level temperature data in China. Int. J. Environ. Res. Public Health 19 (6), 3328. doi:10.3390/ijerph19063328
Li, Y., Su, B., and Liu, Y. (2016). Realizing targeted poverty alleviation in China. China Agric. Econ. Rev. 8 (3), 443–454. doi:10.1108/CAER-11-2015-0157
Liu, J., Huang, F., Wang, Z., Shuai, C., and Li, J. (2020). Understanding the role of rural poor’s endogenous impetus in poverty reduction: Evidence from China. Sustainability 12 (6), 2487. doi:10.3390/su12062487
Liu, M-Y., Xiao-long, F., San-gui, W., and Yu, Z. (2021). Does poverty-alleviation-based industry development improve farmers’ livelihood capital? J. Integr. Agric. 20 (4), 915–926. doi:10.1016/S2095-3119(20)63449-9
Liu, Y., Guo, Y., and Zhou, Y. (2018). Poverty alleviation in rural China: Policy changes, future challenges and policy implications. China Agric. Econ. Rev. 10 (2), 241–259. doi:10.1108/CAER-10-2017-0192
Liu, Y., and Li, Y. (2017). Revitalize the world’s countryside. Nature 548 (7667), 275–277. doi:10.1038/548275a
Long, H., and Liu, Y. (2016). Rural restructuring in China. Rural Restruct. China 47, 387–391. doi:10.1016/j.jrurstud.2016.07.028
López-Calva, L. F., and Ortiz-Juarez, E. (2014). A vulnerability approach to the definition of the middle class. J. Econ. Inequal. 12 (1), 23–47. doi:10.1007/s10888-012-9240-5
Luo, R-F., Cheng-fang, L., Jing-jing, G., Wang, T. Y., Hua-yong, Z., Peng-fei, S., et al. (2020). Impacts of the COVID-19 pandemic on rural poverty and policy responses in China. J. Integr. Agric. 19 (12), 2946–2964. doi:10.1016/S2095-3119(20)63426-8
Maingi, S. W. (2021). Safari tourism and its role in sustainable poverty eradication in east Africa: The Case of Kenya. Worldw. Hosp. Tour. Themes 13 (1), 81–94. doi:10.1108/WHATT-08-2020-0084
Mao, S., Qiu, S., Li, T., and Tang, M. (2020). Rural households’ livelihood strategy choice and livelihood diversity of main ethnic minorities in chongqing, China. Sustainability 12 (19), 8166. doi:10.3390/su12198166
McCulloch, N., and Calandrino, M. (2003). Vulnerability and chronic poverty in rural sichuan. World Dev. 31 (3), 611–628.
Mercier, M., Rama Lionel, N., and Verwimp, P. (2020). Violence exposure and poverty: Evidence from the Burundi civil war. J. Comp. Econ. 48 (4), 822–840. doi:10.1016/j.jce.2020.04.005
Miller, C. (2004). “Producing welfare,” in Jo campling (London: Macmillan Education UK). doi:10.1007/978-1-4039-3850-3
Nguyen, P. T. M., Song Van, N., Tai Do, D., Thi Thuy Nguyen, Q., Dinh, T. T., and Hang Phan Thu, N. (2020). A study on the poverty of mountain people depending on forests. J. Asian Finance Econ. Bus. 7 (7), 519–529. doi:10.13106/jafeb.2020.vol7.no7.519
Olopade, B. C., Henry, O., Oladosun, M., and John Asaleye, A. (2019). Human capital and poverty reduction in OPEC member-countries. Heliyon 5 (8), e02279. doi:10.1016/j.heliyon.2019.e02279
Pan, Y., Chen, J., Yan, X., Lin, J., Ye, S., Xu, Y., et al. (2021). Identifying the spatial–temporal patterns of vulnerability to Re-poverty and its determinants in rural China. Appl. Spatial Analysis Policy 15, 7–8. doi:10.1007/s12061-021-09407-1
Rigg, J., Albert, S., Phongsiri, M., and Sripun, M. (2018). More farmers, less farming? Understanding the truncated agrarian transition in Thailand. World Dev. 107, 327–337. doi:10.1016/j.worlddev.2018.03.008
Rosa, W. (2017). “Goal 1. End poverty in all its forms everywhere,” in A new era in global health: Nursing and the united Nations 2030 (Agenda for Sustainable Development), 249.
Sahasranaman, A. (2021). Long-term Dynamics of poverty transitions in India. Asian Dev. Rev. 38 (02), 213–235. doi:10.1142/S0116110521500049
Senadjki, A., Mohd, S., Bahari, Z., and Abdul Fatah Che, H. (2017). Assets, risks and vulnerability to poverty traps: A study of northern region of Malaysia. J. Asian Finance, Econ. Bus. 4 (4), 5–15. doi:10.13106/jafeb.2017.vol4.no4.5
Senapati, A. K. (2020). Assessing the vulnerability of agricultural households to covariate and idiosyncratic shocks: A Case study in odisha, India. Clim. Dev. 12 (2), 183–197. doi:10.1080/17565529.2019.1611532
Shao-ping, L., Yong-qing, D., Zhang, L. X., and Cheng-fang, L. (2021). Off-farm employment and poverty alleviation in rural China. J. Integr. Agric. 20 (4), 943–952. doi:10.1016/S2095-3119(21)63616-X
Song, K., Liu, W. B., Yan, Q., Tian, M-N., and Pan, W-T. (2021). Efficiency analysis of new rural cooperative medical system in China: Implications for the COVID-19 era. Front. Psychol. 12, 1478. doi:10.3389/fpsyg.2021.686954
Tobin, J. (1958). Estimation of relationships for limited dependent variables. Econ. J. Econ. Soc., 24–36.
United Nations (2020). Ending poverty. United Nations. 2020. Available at: https://www.un.org/en/global-issues/ending-poverty.
Ur Rahman, I., Deng, J., Liu, J., and Shafi, M. (2021). Socio-economic status, resilience, and vulnerability of households under COVID-19: Case of village-level data in sichuan province. PLOS ONE 16 (4), 1–22. doi:10.1371/journal.pone.0249270
Wang, C., Wang, Y., Fang, H., Gao, B., Weng, Z., and Tian, Y. (2020). Determinants of rural poverty in remote mountains of southeast China from the household perspective. Soc. Indic. Res. 150 (3), 793–810. doi:10.1007/s11205-020-02348-1
Wang, S., Guo, Y., and He, Z. (2023). Analysis on the measurement and dynamic evolution of multidimensional return to poverty in Chinese rural households. Soc. Indic. Res. 165 (1), 31–52. doi:10.1007/s11205-022-03000-w
Wang, W., Lan, Y., and Wang, X. (2021). Impact of livelihood capital endowment on poverty alleviation of households under rural land consolidation. Land Use Policy 109, 105608. doi:10.1016/j.landusepol.2021.105608
Wang, Y., and Zhou, L. H. (2022). What are the keys to influence the life satisfaction of eco-migrants in the northern foot of the qilian mountains? A test based on the livelihood risk interaction. J. Mt. Sci. 19 (11), 3227–3245. doi:10.1007/s11629-021-6956-3
Ward, P. S. (2016). Transient poverty, poverty Dynamics, and vulnerability to poverty: An empirical analysis using a balanced panel from rural China. World Dev. 78, 541–553. doi:10.1016/j.worlddev.2015.10.022
World Bank and the People’s Republic of China Development Research Center of the State Council (2022). Four decades of poverty reduction in China: Drivers, insights for the world, and the way ahead. Washington, DC: World Bank. doi:10.1596/978-1-4648-1877-6
World Bank (2020). Poverty and shared prosperity 2020: Reversals of fortune. The World Bank. Available at: https://www.worldbank.org/en/publication/poverty-and-shared-prosperity.
Wu, Y-X., Hu, Z-N., Wang, Y-Y., and Fan, M. (2022). Rare potential poor household identification with a focus embedded logistic regression. IEEE Access 10, 32954–32972. doi:10.1109/ACCESS.2022.3161574
Xu, D., Deng, X., Guo, S., and Liu, S. (2019). Sensitivity of livelihood strategy to livelihood capital: An empirical investigation using nationally representative survey data from rural China. Soc. Indic. Res. 144 (1), 113–131. doi:10.1007/s11205-018-2037-6
Xu, F., Zhang, X., and Di, Z. (2022). Do rural clan-based networks reduce the risk of a return to poverty? Evidence from China. J. Int. Dev. (Accessed April 4, 2023) doi:10.1002/jid.3710
Xu, X., and Yang, H. (2022). Elderly chronic diseases and catastrophic health expenditure: An important cause of borderline poor families’ return to poverty in rural China. Humanit. Soc. Sci. Commun. 9 (1), 1–10. doi:10.1057/s41599-022-01310-5
Xu, Y., and Carraro, L. (2017). Minimum income programme and welfare dependency in China. Int. J. Soc. Welf. 26 (2), 141–150. doi:10.1111/ijsw.12247
Zhang, R., He, Y., Cui, W., Yang, Z., Ma, J., Xu, H., et al. (2022). Poverty-returning risk monitoring and analysis of the registered poor households based on BP neural network and natural Breaks: A Case study of Yunyang District, Hubei province. Sustainability 14 (9), 5228. doi:10.3390/su14095228
Zhou, D., Cai, K., and Zhong, S. (2021). A statistical measurement of poverty reduction effectiveness: Using China as an example. Soc. Indic. Res. 153 (1), 39–64. doi:10.1007/s11205-020-02474-w
Keywords: re-poverty risk, rural poverty, alleviation policy, tobit model, risk assessment, household income, poverty reduction
Citation: Fan Y, Ning J and Qin H (2023) Investigating the effectiveness of livelihood capital in reducing re-poverty risk: an empirical analysis of policy withdrawal and income structures in rural China. Front. Environ. Sci. 11:1175315. doi: 10.3389/fenvs.2023.1175315
Received: 22 March 2023; Accepted: 11 April 2023;
Published: 26 April 2023.
Edited by:
Sławomir Kalinowski, Polish Academy of Sciences, PolandReviewed by:
Mariusz Malinowski, Poznan University of Life Sciences, PolandElkhan Richard Sadik-Zada, Ruhr University Bochum, Germany
Copyright © 2023 Fan, Ning and Qin. This is an open-access article distributed under the terms of the Creative Commons Attribution License (CC BY). The use, distribution or reproduction in other forums is permitted, provided the original author(s) and the copyright owner(s) are credited and that the original publication in this journal is cited, in accordance with accepted academic practice. No use, distribution or reproduction is permitted which does not comply with these terms.
*Correspondence: Hong Qin, cWluaG9uZ0BvdWMuZWR1LmNu