 Weifeng Zhou
 Huijuan Hu
 Tianfei Cheng
- 1East China Sea Fishery Research Institute, Chinese Academy of Fishery Sciences, Shanghai, China
- 2College of Marine Sciences, Shanghai Ocean University, Shanghai, China
Fisheries provide high-quality protein for many people, and their sustainable use is of global concern. Light trapping is a widely used fishing method that takes advantage of the phototropism of fish. Remote sensing technology allows for the monitoring of lit fishing vessels at sea from the air at night, which supports the sustainable management of fisheries. To investigate the potential of different nighttime light remote sensing data for lit fishing vessel identification and applications, we used the fuzzy evaluation method to quantitatively assess images in terms of their radiometric and geometric quality, and Otsu’s method to compare the effects of lit fishing vessel identification. Three kinds of nighttime lighting data from the Defense Meteorological Satellite Program/Operational Linescan System (DMSP/OLS), Visible infrared imaging radiometer suite day/night band (VIIRS/DNB), and Luojia1-01(LJ1-01) were analyzed, compared, and application pointers were constructed. The results are as follows. ①In the image radiation quality evaluation, the information entropy, clarity, and noise performance of the LJ1-01 image are higher than those of the DMSP/OLS and VIIRS/DNB images, where the information entropy value of the LJ1-01 image is nearly 10 times that of VIIRS/DNB and 23 times that of DMSP/OLS. The average gradient value is 14 times that of the image from VIIRS/DNB and 1,600 times that of DMSP/OLS, while its noise is only about 2/3 of the VIIRS/DNB image and 1/3 of the DMSP/OLS image. In the geometric quality assessment, the geometric positioning accuracy and ground sampling accuracy of the VIIRS/DNB image is the best among the three images, with a relative difference percentage of 100.1%, and the LJ1-01 and DMSP/OLS images are relatively lower, at 96.9% and 92.3%, respectively. ② The detection of squid fishing vessels in the Northwest Pacific is taken as an example to compare the identification effects of three types of data: DMSP/OLS, VIIRS/DNB, and LJ1-01. Among these data, DMSP/OLS can effectively identify the position of the lit fishing boat, and VIIRS/DNB images can accurately estimate the spatial position and number of lit fishing boats with large distances. However, in the case of fishing boats gathering or clustering, the number of fishing vessels could not be identified. This led to the detected number of lit fishing vessels being less than the real value. For the VIIRS/DNB and LJ1-01 images with a 5′×8′ span in the same spatiotemporal range using the same batch of pelagic squid fishing vessels, LJ1-01 extracted 18 fishing vessels. VIIRS/DNB extracted 15, indicating that LJ1-01 can distinguish multiple fishing vessels in the lighted overlapping area, thus accurately identifying the number of fishing vessels. The application pointing table generated based on the results of the three data analyses can provide a reference for sensor/image selection for nighttime light remote sensing fishery applications and a basis for more refined fishing vessel identification, extraction, and monitoring.
1 Introduction
In recent years, the global demand for aquatic products has grown with the increase in the global population, improvement in the standard of living, and rise in food prices (Subasinghe et al., 2009; Ottinger et al., 2016; Li, 2020; Azra et al., 2021). As one of the oldest industries in the history of marine development, marine fishing has always been an important source of fishery products and the mainstay of fisheries (Hilborn et al., 2020). According to the FAO’s The State of World Fisheries and Aquaculture 2022, global capture fisheries and aquaculture production will reach 214 million tons in 2020, and 17% of the world’s animal protein intake will come from fish products (Rousseau et al., 2019). Since the 20th century, marine capture fisheries have accounted for more than 70%–80% of the world’s total fisheries production (Rousseau et al., 2019). However, over the last 50 years, the proportion of global fish stocks within bio-sustainable limits has been on the decline (FAO, 2022), About a quarter of fish stocks are overexploited, depleted, or recovering from depletion (17%, 7%, and 1%, respectively) (Beddington et al., 2007). This indicates a continuing decline in the state of the world’s marine fisheries resources. The distribution of fishing vessels is a direct reflection of fishing efforts, which indicates the intensity of human exploitation of fishery resources.
Meanwhile, to a considerable extent, the distribution of fishing vessels is also a manifestation of the variability of fishery resources, which is essential to the quantitative assessment of the spatiotemporal distribution of fishery resources. (Uchida and Wilen, 2004; Jung et al., 2013). Managers generally collect the number and catch of fishing vessels in different areas to assess the status of fishery resources; this allows them to formulate protective policies, develop management policies, reduce fishing, and protect fishery resources (Seo, 2005). However, most countries rely on sales records of catches, direct shipboard collections, and fishermen’s questionnaires to assess fishery resources (Blanco et al., 2007; Barkai and Meredith, 2010; Yang et al., 2023). These assessment methods can only obtain a single type of data, and the acquisition of this data relies chiefly on individual record-keeping efforts, which are often subjective and inaccurate (Rudd and Branch, 2017).
Light trapping is a method of using artificial light to lure scattered fish into groups to increase catches by using the phototropism of different fish groups (Ben, 1976). Light trapping has been widely used to catch various kinds of fish and benthic organisms in the ocean (Ortiz et al., 2016; Solomon and Ahmed, 2016; Nguyen et al., 2017). The catch accounts for about 10% of the world’s marine fishing production (FAO, 2022). Light trapping has the advantages of high efficiency, low cost, and high yield (Syah et al., 2016). However, the number of lit fishing vessels has been increasing, leading to negative impacts such as overfishing, bycatch, plastic, garbage, and greenhouse gas emissions due to artificial light (Mills et al., 2014; Solomon and Ahmed, 2016). In an era of declining global fish species diversity (FAO, 2022), this poses a potential threat to developing global sustainable fisheries. Sustainable fisheries are a prerequisite for the “blue growth” of healthy marine ecosystems (Eikeset et al., 2018). It is important to understand the changes in the distribution of lit fishing vessels to help understand the fishing efforts and illegal fishing (Chen, 2021).
There are various ways of monitoring lit fishing vessels, but methods based on the on-site survey, port sampling survey, and fishing logbook collection have issues such as a small observation range and being time-consuming and laborious (Huang et al., 2018). In addition, the fishing vessel monitoring system and the general shipboard automatic identification system (AIS) also have problems. The terminal cannot be used when it is closed, small vessels without equipment cannot be monitored, and the system maintenance cost is high (Li et al., 2021). The use of nighttime light images to obtain visible/near-infrared electromagnetic spectrum information under cloud-free conditions at night, thus recording the lighting situation of fishing vessels at sea, can directly reflect real human activities (Huang et al., 2014; Li et al., 2016; Exeter et al., 2021) and has the merits of a high timeliness, wide observation range, and low cost (Elvidge et al., 2001; Klemas, 2013; Liu et al., 2015). Most of the current sensors with night light detection capability are not open to the public, making their application scope limited (Levin et al., 2020). Among them, Defense Meteorological Satellite Program/Operational Linescan System, DMSP/OLS, visible infrared imaging radiometer suite day/night band (VIIRS/DNB), and Luojia1-01(LJ1-01) have been widely studied and applied due to the convenience of image acquisition and wide coverage (Cheng et al., 2016; Elvidge et al., 2017; Li et al., 2019). However, most of the current studies on these three kinds of satellite images in fisheries focus on a single data type or a single area (Waluda et al., 2004; Wang et al., 2020; Zhong et al., 2020), without systematically sorting out the differences between the three kinds of night light remote sensing data with regard to the image quality values and lit fishing vessel identification effect, which results in issues with fishing vessel extraction and management.
Therefore, we quantitatively analyzed the advantages and disadvantages of night light remote sensing data from DMSP/OLS, VIIRS/DNB, and LJ1-01 based on the image quality values and lit fishing vessel identification effect to create an image selection reference for carrying out lit fishing vessel identification work and evaluating night light images in fisheries. We also constructed application pointers to explore the advantages of different data, thus providing a basis for fisheries’ resource protection.
2 Materials and methods
In this paper, we compared images from DMSP/OLS, VIIRS/DNB, and LJ1-01. For the image quality values, we calculated the information entropy, the average gradient value, and the average Inverse Coefficient of Variation (
2.1 Research data
The DMSP/OLS and VIIRS/DNB single-day images were obtained from the National Geophysical Data Center (NGDC) of the NOAA (National Oceanic and Atmospheric Administration). The LJ1-01 images were obtained from the Hubei Data and Application Center of the High-Resolution Earth Observation System. Because the images do not have the intersection of space and time, and to ensure the consistency of the extracted lit fishing vessel types, images from the squid fishing area in the North Pacific Ocean were selected. The imaging time, coverage, and sources are shown in Table 1.
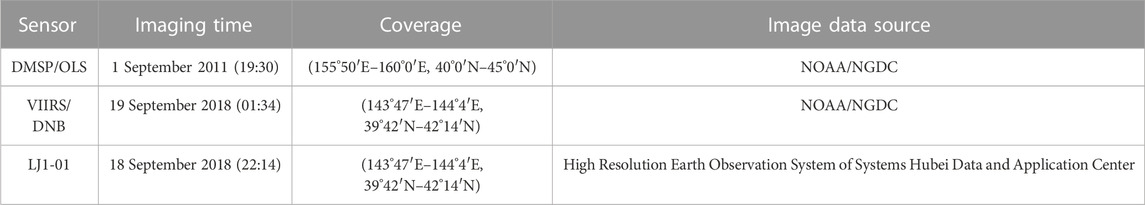
TABLE 1. Satellite data of nighttime light.
2.2 Methods
2.2.1 Numerical evaluation method of the image quality
The quality evaluation of remote sensing digital images is mainly determined via radiometric quality and geometric quality (Yin et al., 2014). To make a comprehensive evaluation of the quality of the remote sensing images, we introduced the fuzzy evaluation method (Wang, 2004; Liang et al., 2019).
(1) Radiation quality
Radiation quality is the most critical and complex index in the quality evaluation of remote-sensing images (Wang, 2014). The radiation quality of nighttime light images has important effects on the identification of illuminated fishing vessels, including the information richness, clarity, and noise of the image. Therefore, three indicators (information entropy, sharpness, and noise) were selected for evaluation (Li, 2009). Sharpness was expressed by the average gradient value of the image elements, and the noise was expressed by the
1 Information entropy is the average amount of information contained in an image (Zhen, 2006): the larger the entropy value, the more information it contains (Deng, 2009). The formula for calculating image entropy is expressed as follows (Liu et al., 1999):
where
2 Sharpness reflects the contrast of small details in an image and the clarity of its boundaries (Wang, 2000): the larger the average gradient value
where
3 The effect of noise throughout the entire imaging process results in reduced image quality (Fu et al., 2013). We used the average
where
(2) Geometric quality
The geometric quality evaluation of single-band images generally includes the accuracy of the geometric positioning and ground sampling, as follows (Eikeset et al., 2018).
1 The geometric positioning accuracy of the image directly affects the overall accuracy (Tao and Zhang, 2017). We referred to Li’s geometric positioning accuracy evaluation based on Google Earth images using road network intersections as matching points to compare the Root Mean Squared Errors (RMSE) (Liu et al., 2019).
2 The ground sample distance (GSD) directly reflects the resolution of the image. The ground sample distance is the average distance between the center points of multiple pairs of image elements in the same area as measured by Mercator projection. Figure 1
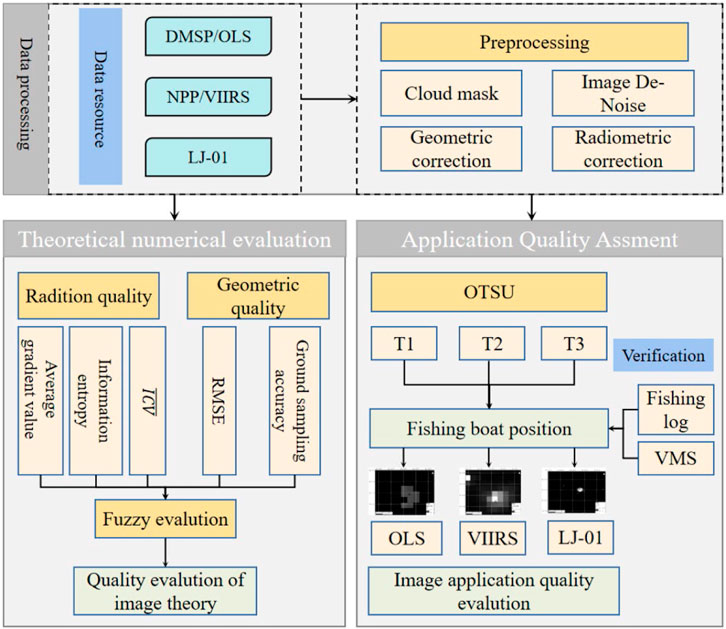
FIGURE 1. Flow chart of the evaluation process.
2.2.2 Fuzzy evaluation method
In the fuzzy comprehensive evaluation, we first determine the factor universe U and the comment universe V. The factor universe refers to the evaluation indicators considered in the evaluation, and the comment universe refers to the quality level in the evaluation (Yi, 1983). In this study, the factor universe U included the five evaluation factors, and the comment universe V set the three grades of excellent, good, and qualified. The fuzzy evaluation matrix can be calculated by combining the evaluation results and the fuzzy evaluation threshold:
where the element
2.2.3 lit fishing vessels extraction
(1) Image preprocessing
The preprocessing steps mainly include cloud mask processing, image denoising, radiometric correction, and geometric correction. Clouds and noise are common problems with all three images, where radiometric calibration is required for the DMSP/OLS images (Elvidge et al., 1999), and negative values and outliers need to be removed for the VIIRS/DNB images. LJ1-01 performs radiometric brightness conversion processing and geometric correction of images using road network intersections (Liu et al., 2019).
(2) lit fishing vessel extraction
To compare the effect of lit fishing vessel recognition for the three data, we used Otsu’s method, a widely used algorithm for image thresholding segmentation, to extract the lit fishing vessels (Xu et al., 2011). Otsu’s method divides the image into two parts, background, and foreground, according to the grayscale characteristics of the image. Given that the variance is a measure of the uniformity of grayscale distribution, the larger the interclass variance between the foreground and background of the image, the greater the difference between the two, allowing the interclass variance to maximize the segmentation, indicating the minimum probability of misclassification. For the image
The objective function g(t) is then established,
where
3 Results and analysis
3.1 Numerical evaluation of image quality
The results of the remote sensing image quality assessment can be used as a reference to evaluate an image’s merit (Liu et al., 2011). Using Eqs 1–3, the information entropy, average gradient value, and
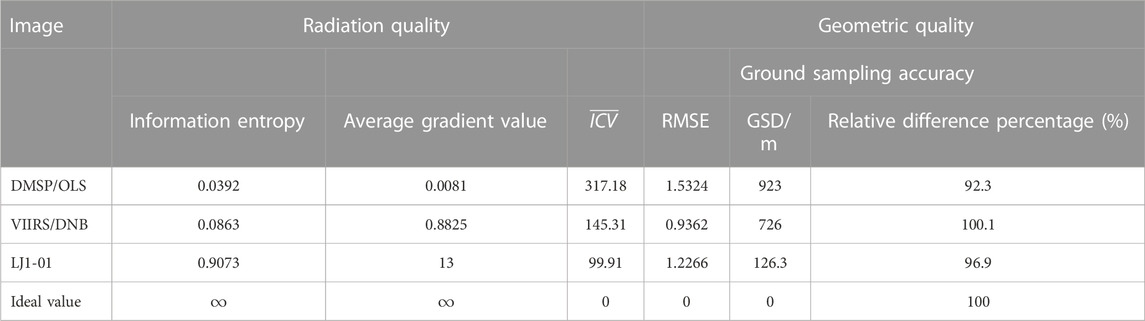
TABLE 2. Quantitative indicators of image radiation quality and geometric quality.
In the identification of fishing vessels from light images, the higher the radiation quality of the images, the better it is for the monitoring and identification of lit fishing vessels. As can be seen from Table 2, in the radiation quality evaluation, the DMSP/OLS image is deficient in radiation quality compared with the latter two, mainly in the average gradient value and the ICV. The average gradient value is about 1/100 of the VIIRS/DNB image and 6/10,000 of the LJ1-01 image. The ICV is two times that of the VIIRS/DNB image and three times that of the LJ1-01 image, indicating that the image needs to be corrected to be more accurate by a researcher at a later stage. Compared with the DMSP/OLS image, each index of VIIRS/DNB significantly improved the radiation quality. However, there are still considerable deficiencies in the information entropy of the DMSP/OLS and VIIRS/DNB images, which are 1/10 and 1/23 of LJ1-01, respectively. LJ1-01 is an order of magnitude ahead and has a much lower average

TABLE 3. Fuzzy evaluation index threshold.
The higher geometric quality helps to reduce the deviation between the identified fishing vessel position and the actual position and also helps to improve the identification ability of small lit fishing vessels. The DMSP/OLS and LJ1-01 images are relatively close in RMSE. Still, their spatial resolution difference leads to a larger gap in the ground sampling distance index, and LJ1-01 is slightly higher than DMSP/OLS in the relative difference percentage. However, the spatial resolution of VIIRS/DNB is limited, resulting in a large difference in the ground sampling distance.
The combined fuzzy scoring results show that the LJ1-01 image has the highest score among the three images, followed by the VIIRS/DNB and DMSP/OLS images.
3.2 Comparison of the recognition effect of lit fishing vessels
Due to the difference in the archiving time of the DMSP/OLS, VIIRS/DNB, and LJ1-01 images and the different times of night imaging by the three satellites (Table 4), we were unable to match the same type of lit fishing vessels everywhere in the same time and space. However, the lit fishing vessels entering the North Pacific squid fishing area generally have strict regulations on their vessel size (Fei et al., 2022), so the lighted image pixels extracted from DMSP/OLS, VIIRS/DNB, and LJ1-01 single-day data can be spatiotemporally matched by tracking the same type of North Pacific squid fishing vessels with the vessel position data. The difference between the imaging time of VIIRS/DNB and LJ1-01 images is about 4 h, but the lit fishing vessels operate very slowly. Their positions do not change much, so they can be compared in the same time and space. In summary, the same type of North Pacific squid fishing vessels was selected for this paper to ensure that the vessel sizes were similar and displayed with the same spatial extent overlay (Figure 2). The vessel position data of the calibrated DMSP/OLS images were obtained from the fishing logs collected by the Squid Fishing Technology Group of Shanghai Ocean University, China Oceanic Fisheries Branch, and the VIIRS/DNB and LJ1-01 images were obtained from the Earth Observation Group (EOG) published on the NOAA website (https://eogdata.mines.edu/vbd/). The VBD data are shown in Table 4.
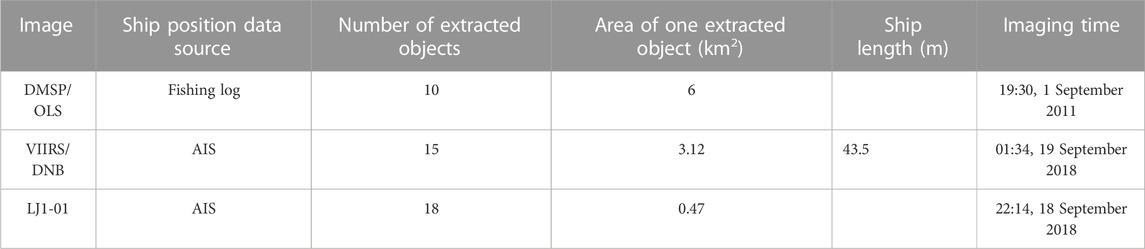
TABLE 4. Three kinds of nighttime light data and fishing vessel information.
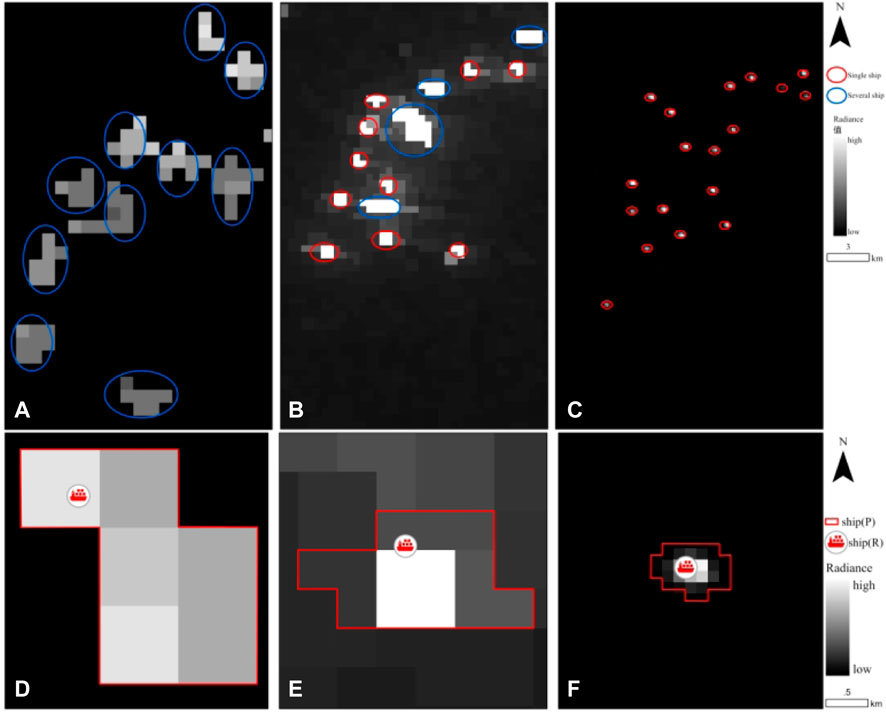
FIGURE 2. Three kinds of nighttime light data and ship positions superimposed on a map [(A, B, C) are DMSP/OLS, VIIRS/DNB, and LJ1-01 images superimposed with 5′ × 8′ span, respectively. The red circle in the map is for a single lit fishing vessel, and the blue circle is for multiple lit fishing vessels; (D, E, F) are DMSP/OLS, VIIRS/DNB, and LJ1-01, respectively, superimposed with a 1′40″ × 1′40″ span superimposed display, in which ship (P) is the fishing vessel position extracted by the Otsu method and ship (R) is the real vessel position.).
Lit fishing vessels attract phototropic fish using intense electric lights that can be adjusted. Therefore, the light sources captured by the satellite-based low light data often represent the boundary of the fishing vessel, and the lights are composed of the refraction and reflection of the seawater. As shown in Figures 2A, D and Table 4, each extracted object occupies six pixels on average. The area occupied by the lights of the fishing vessels is the largest at the same resolution, and the shape tends to be rectangular. The difference in the pixel values is not obvious. The fishing vessel is located in the upper left of the extracted object, mainly because of the low spatial resolution of the DMSP/OLS image (1 km), and the vessel is affected by the position of light suspension and the time length of the imaging, which led to the light halo effect. It is also affected by the noise generated by processes such as atmospheric transmission (Deng, 2009), making it suffer from uneven values of background radiance. Therefore, DMSP/OLS images have limitations in identifying the number of lit fishing vessels and the type of fishing vessels.
As shown in Figures 2B, F and Table 4, the average number of image elements for each extracted object is 13, which is significantly smaller than that for the DMSP/OLS image. The pixel values are basically the same and differ considerably from the surrounding non-lighted images. The position of the fishing vessel is located at the top left of the light image, similar to the DMSP/OLS image. This is mainly due to the comprehensive improvements made to the sensor VIIRS for OLS, not only to improve the spatial resolution but also to improve the radiation resolution of the sensor. However, influenced by the imaging time and the fishing vessel’s movement, the fishing vessel still has an obvious light vignetting phenomenon. Compared with DMSP/OLS, it can identify single fishing vessels with larger spacing and distinguish whether there is a gathering of fishing vessels (as shown in the blue circles in Figures 2A, B). Fishing operations are often concentrated near the same fishing ground, and the aggregation of fishing vessels can lead to the superimposed brightness of light sources scattered or diffused from the edges by the lights. It then becomes impossible to distinguish whether the light is caused by a single fishing vessel with stronger lights itself or the aggregation of multiple ships, which causes difficulties with the identification of the number of fishing vessels. The root cause is the insufficient spatial resolution of VIIRS/DNB images.
As shown in Figures 2C, F, the LJ1-01 and VIIRS/DNB images in the same space-time show the same batch of lit fishing vessels at night, a total of 18 vessels. However, the VIIRS/DNB image only shows 15 consecutive lighted objects, which is more accurate than the first two images in extracting the number of fishing vessels. The lit fishing vessels of LJ1-01 show a circle with the light source as the center to diffuse around, and the area occupied by the light elements is the smallest and closest to the actual vessel size (Table 4). The difference in the DN value in the center of the light object is not obvious, and the DN value at the edge gradually decreases. The deviation of the vessel position from the center of the light object is lower compared with the previous two. This is mainly because the spatial resolution of LJ1-01 has been significantly improved, which enables LJ1-01 to accurately estimate the number of lit fishing vessels and extract the distribution of fishing vessels, avoiding the overlapping of lights of closely spaced fishing vessels. It provides a theoretical basis for estimating the size of fishing vessels based on the number of pixels, while the shorter imaging time also reduces the phenomenon of light haloing to provide a more accurate factual location of fishing vessels without relying too much on auxiliary data such as those from the AIS.
4 Discussion
DMSP/OLS, VIIRS/DNB, and LJ1-01 images were used as research objects to evaluate the image quality values and lit fishing vessel identification effects. Based on the fuzzy evaluation method, the image quality values were comprehensively compared in regards to their radiation quality (information richness, clarity, and noise) and geometric quality (geometric positioning accuracy and geometric sampling distance), and the comparison of quantified theoretical values. The number and size of the identified lit fishing vessels reflect the differences in the practical applications of different nighttime light data. The theoretical basis and practical basis were adopted for the image selection of spatial distribution extraction of lit fishing vessels and dynamic monitoring of fishing vessels.
The three images had significant differences in their theoretical values and application practices, and each type of image had its own characteristics. Therefore, based on the characteristics of the three types of data, we summarized and organized them together with the product information to build an application pointing table that shows the actual scenario of lit fishing vessels, allowing for the selection of data to assess the fishery resources and management of the fishery, and finely locates the fishing vessels. Table 5 can serve as a reference for researchers.
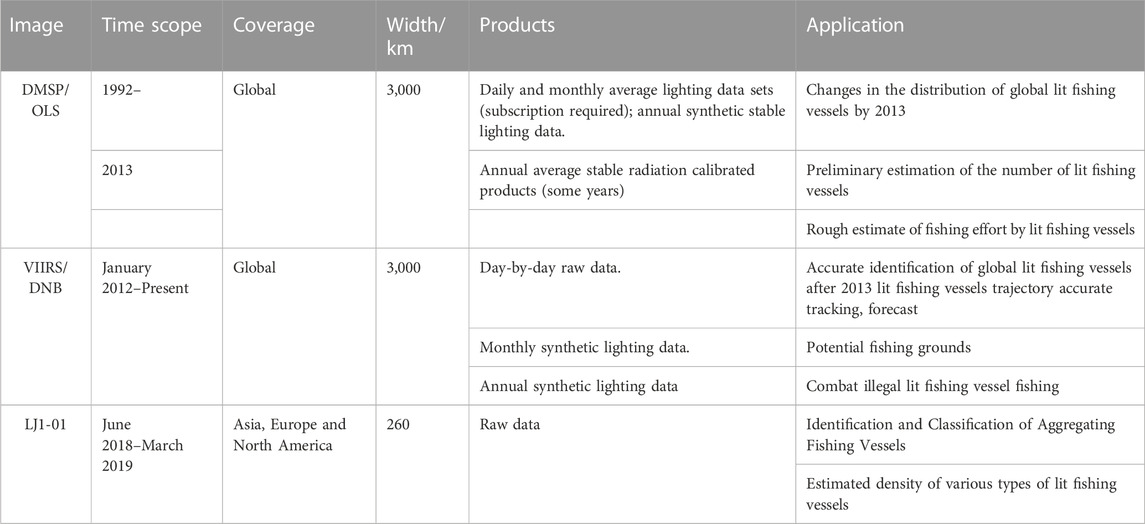
TABLE 5. Nighttime light data applications.
DMSP/OLS was the earliest source of nighttime lighting data. Despite the lower sensor spatial and radiometric resolution, it has the longest archival time and offers rich data products. Its technical system laid the foundation for subsequent improvements in the quality of nighttime light images (Elvidge et al., 1999) and provided an important data source for all oceans and for global fishing vessel extraction and fisheries resource assessment (Huang et al., 2014). It allows for the estimation of the number of lit fishing vessels and the understanding of the global dynamic distribution of lit fishing vessels. The changes in fishery resources can be understood from the dynamic distribution of lit fishing vessels.
For regional-scale fisheries management applications, VIIRS/DNB can perform more detailed lit fishing vessel location identification while predicting potential fishing grounds and combating illegal lit fishing vessels. This is due to the improved radiation quality and geometric quality of VIIRS/DNB compared to DMSP/OLS, improved light saturation phenomenon, and higher sensitivity to weak light sources. This is reflected in the fact that VIIRS/DNB has the best ground sampling accuracy and root-mean-square error among the three. It can accurately identify the distribution of fishing vessels while addressing the weakness of DMSP/OLS, which cannot identify aggregated fishing vessels.
To carry out more refined fishing vessel positioning and information extraction, nighttime light images of LJ1-01 quality need to be selected. Although LJ1-01 has a short emission time, insufficient existing data, and limited coverage (the data include Asia, Europe, and North America), its rich information, high clarity, and high spatial resolution can identify and manage lit fishing vessels in key areas and achieve a finer positioning of the vessels. The radiation quality advantage of LJ1-01 enables it to detect targets with weaker lights, specifically in the comparison of the lit fishing vessel identification effect. LJ1-01 not only identifies the location of fishing vessels more accurately but also distinguishes the lit fishing vessels that cannot be identified by VIIRS/DNB images. LJ1-01 further realizes the monitoring and management of the number of lit fishing boats with the advantage of high spatial resolution.
5 Conclusion
Remote sensing images of nighttime lights provide a unique perspective for observing human activities at night. A comprehensive comparative analysis of the images from DMSP/OLS, VIIRS/DNB, and LJ1-01, in terms of both image quality values and lit fishing vessel recognition effects, can help managers select and use the appropriate data. LJ1-01 imagery scored the highest in the theoretical numerical evaluation, followed by VIIRS/DNB and DMSP/OLS images. LJ1-01 images have a significant advantage in both detail and texture features. Combined with the application pointing table, DMSP/OLS can provide a long time series of global fishery resource changes. VIIRS/DNB can provide fishery information, such as the trajectory of fishing vessels and the distribution of fishing grounds. LJ1-01 can realize the monitoring and management of the number of lit fishing boats to lay the foundation for the fine positioning of fishing vessels.
The application direction table can match the best data sources and find new knowledge datasets for monitoring fishing vessels at different scales and research objects. In the future, the remote sensing monitoring of long-time series can be used to build a complete observation network for fishery monitoring and management, while the night light images, combined with high-resolution remote sensing data, can be used to carry out quantitative research.
Data availability statement
The original contributions presented in the study are included in the article/Supplementary Material, further inquiries can be directed to the corresponding author.
Author contributions
WZ contributed to the design of the study. HH collected all the nightlight images. The data processing was conducted by HH and TC, and analyzed by HH and WZ. HH wrote the first draft of the manuscript. WZ contributed to sections of the manuscript. All authors contributed to the article and approved the submitted version.
Funding
This research was funded by Central Public-interest Scientific Institution Basal Research Fund, ECSFR, CAFS (2022ZD0402), and CAFS (NO. 2022XT0702).
Acknowledgments
We thank LetPub (www.letpub.com) for its linguistic assistance during the preparation of this manuscript.
Conflict of interest
The authors declare that the research was conducted in the absence of any commercial or financial relationships that could be construed as a potential conflict of interest.
Publisher’s note
All claims expressed in this article are solely those of the authors and do not necessarily represent those of their affiliated organizations, or those of the publisher, the editors and the reviewers. Any product that may be evaluated in this article, or claim that may be made by its manufacturer, is not guaranteed or endorsed by the publisher.
References
Azra, M. N., Okomoda, V. T., Tabatabaei, M., Hassan, M., and Ikhwanuddin, M. (2021). The contributions of shellfish aquaculture to global food security: Assessing its characteristics from a future food perspective. Front. Mar. Sci. 8, 897. doi:10.3389/fmars.2021.654897
Barkai, A., and Meredith, G. (2010). OLFISH Electronic Logbook: Bridging the gap between Fisher, manager and scientist through cohesive data-logging. ICESCM2010/R:01.
Beddington, J. R., Agnew, D. J., and Clark, C. W. (2007). Current problems in the management of marine fisheries. Science 316 (5832), 1713–1716. doi:10.1126/science.1137362
Ben, Y. M. (1976). Fishing with light. FAO fishing manuals. Farnham, Surrey (UK): Fishing News Books Ltd.
Blanco, M., Sotelo, C., Chapela, M. J., and Pérez-Martín, R. (2007). Towards sustainable and efficient use of fishery resources: Present and future trends. Trends Food Sci. Technol. 18, 29–36. doi:10.1016/j.tifs.2006.07.015
Bouali, M., and Ladjal, S. (2011). Toward optimal destriping of MODIS data using a unidirectional variational model. Ieee Trans. Geoscience Remote Sens. 49, 2924–2935. doi:10.1109/TGRS.2011.2119399
Cheng, T., Zhou, W., Xu, H., and Wei, F. (2016). “Estimation of fishing vessel numbers close to the terminator in the pacific northwest using OLS/DMSP data,” in Proceedings of the international conference on geo-informatics in resource management and sustainable ecosystem (Spinger).
Deng, B. (2009). Measurement method of remote sensing information. Doctor Thesis. Wuhan: Wuhan University.
Eikeset, A. M., Mazzarella, A. B., Davíðsdóttir, B., Klinger, D. H., Levin, S. A., Rovenskaya, E., et al. (2018). What is blue growth? The semantics of “sustainable development” of marine environments. Mar. Policy 87, 177–179. doi:10.1016/j.marpol.2017.10.019
Elvidge, C. D., Baugh, K. E., Dietz, J. B., Bland, T., Sutton, P. C., and Kroehl, H. W. (1999). Radiance calibration of DMSP-OLS low-light imaging data of human settlements. Remote Sens. Environ. 68, 77–88. doi:10.1016/s0034-4257(98)00098-4
Elvidge, C. D., Baugh, K., Zhizhin, M., Hsu, F., and Ghosh, T. (2017). VIIRS night-time lights. Int. J. Remote Sens. 38, 5860–5879. doi:10.1080/01431161.2017.1342050
Elvidge, C. D., Imhoff, M. L., Baugh, K. E., Hobson, V. R., Nelson, I., Safran, J., et al. (2001). Night-time lights of the world: 1994–1995. ISPRS J. Photogrammetry Remote Sens. 56, 81–99. doi:10.1016/s0924-2716(01)00040-5
Exeter, O. M., Htut, T., Kerry, C. R., Kyi, M. M., Mizrahi, M., Turner, R. A., et al. (2021). Shining light on data-poor coastal fisheries. Front. Mar. Sci. 7, 7. doi:10.3389/fmars.2020.625766
Fei, Y., Yang, S., Fan, W., Shi, H., Zhang, H., and Yuan, S. (2022). Relationship between the spatial and temporal distribution of squid-jigging vessels operations and marine environment in the North Pacific ocean. J. Mar. Sci. Eng. 10, 550. doi:10.3390/jmse10040550
Fu, P., Sun, Q., Ji, Z., and Chen, Q. (2013). A method of SNR estimation and comparison for remote sensing mages. Acta Geod. Cartogr. Sinica 42, 559–567.
Hilborn, R., Amoroso, R. O., Anderson, C. M., Baum, J. K., Branch, T. A., Costello, C., et al. (2020). Effective fisheries management instrumental in improving fish stock status. Proc. Natl. Acad. Sci. 117 (4), 2218–2224. doi:10.1073/pnas.1909726116
Huang, Q., Yang, X., Gao, B., Yang, Y., and Zhao, Y. (2014). Application of DMSP/OLS nighttime light images: A meta-analysis and a systematic literature review. Remote Sens. 6, 6844–6866. doi:10.3390/rs6086844
Huang, W., Li, Y., Yu, J., and Chen, G. (2018). Spatial distribution of light falling-net fishery vessels and its relationship withthe ocean vortex in the northwestern Luzon Island base on remote sensing. Haiyang Xuebao 40, 10–19.
Jung, S., Ha, S., and Na, H. (2013). Multi-decadal changes in fish communities jeju island in relation to climate change. Korean J. Fish. Aquatic Sci. 46 (2), 186–194. doi:10.5657/kfas.2013.0186
Klemas, V. (2013). Fisheries applications of remote sensing: An overview. Fish. Res. 148, 124–136. doi:10.1016/j.fishres.2012.02.027
Levin, N., Kyba, C. C. M., Zhang, Q., Sánchez De Miguel, A., Román, M. O., Li, X., et al. (2020). Remote sensing of night lights: A review and an outlook for the future. Remote Sens. Environ. 237, 111443. doi:10.1016/j.rse.2019.111443
Li, D., Zhao, X., and Li, X. (2016). Remote sensing of human beings – A perspective from nighttime light. Geo-spatial Inf. Sci. 19, 69–79. doi:10.1080/10095020.2016.1159389
Li, K. M. (2009). Research on quality evaluation of remote sensing image based on fuzzy set. Master Thesis. Henan: Henan Polytechnic University.
Li, X., Li, X. Y., Li, D. R., He, X. J., and Jendryke, M. (2019). A preliminary investigation of Luojia-1 night-time light imagery. Remote Sens. Lett. 10, 526–535. doi:10.1080/2150704X.2019.1577573
Li, X., Xiao, Y., Su, F., Wu, W., and Zhou, L. (2021). AIS and VBD data fusion for marine fishing intensity mapping and analysis in the northern part of the south China sea. ISPRS Int. J. Geo-Information 10, 277. doi:10.3390/ijgi10050277
Li, Y. (2020). Feeding the future: Plant-based meat for global food security and environmental sustainability. Cereal Foods World 65, 4.
Liang, S., Wang, D., He, T., and Yu, Y. (2019). Remote sensing of earth’s energy budget: Synthesis and review. Int. J. Digital Earth 12, 737–780. doi:10.1080/17538947.2019.1597189
Liu, G. X., Yan, H., Zheng, S. X., and Wei, D. Y. (1999). The development of entropy concept and its application in accuracy theory. J. South China Univ. Technol. Nat. Sci. Ed. 11, 16–20.
Liu, H., Yuan, H., and Li, H. X. (2011). Research on remote sensing image quality assessment methods. Mod. Electron. Technol. 34 (10), 24–26.
Liu, L., Chen, S., and Sun, C. (2019). Assessing the ability of Luojia 1-01 imagery to detect feeble nighttime lights. Sensors 19, 3708. doi:10.3390/s19173708
Liu, Y., Saitoh, S. I., and Hirawake, T. (2015). Detection of squid and pacific saury fishing vessels around Japan using VIIRS day/night band image. Proc. Asia-Pacific Adv. Netw. 39, 28. doi:10.7125/apan.39.3
Mills, E., Gengnagel, T., and Wollburg, P. (2014). Solar-LED alternatives to fuel-based Lighting for night fishing. Energy Sustain. Dev. 21, 30–41. doi:10.1016/j.esd.2014.04.006
Nguyen, K. Q., Paul, K., Winger, D., CoreyMorris, , Scott, S., et al. (2017). Artificial lights improve the catchability of snow crab (Chionoecetes opilio) traps. Aquaculture & Fisheries.
Ortiz, N., Mangel, J. C., Wang, J., Alfaro-Shigueto, J., Pingo, S., Jimenez, A., et al. (2016). Reducing green turtle bycatch in small-scale fisheries using illuminated gillnets: The Cost of Saving a Sea Turtle. Mar. Ecol. Prog. Ser. 545, 251–259. doi:10.3354/meps11610
Ottinger, M., Clauss, K., and Kuenzer, C. (2016). Aquaculture: Relevance, distribution, impacts and spatial assessments - a review. Ocean Coast. Manag. 119, 244–266. doi:10.1016/j.ocecoaman.2015.10.015
Rousseau, Y., Watson, R. A., Blanchard, J. L., and Fulton, E. A. (2019). Evolution of global marine fishing fleets and the response of fished resources. Proc. Natl. Acad. Sci. 116 (25), 12238–12243. doi:10.1073/pnas.1820344116
Rudd, M. B., and Branch, T. A. (2017). Does unreported catch lead to overfishing? Fish. Fish 18, 313–323. doi:10.1111/faf.12181
Seo, J-W. (2005). Fish fauna and ecological characteristics of dark chub (Zacco temminckii) population in the mid-upper region of Gam Stream. Korean J. Ecol. Environ. 38 (2), 196–206.
Solomon, O. O., and Ahmed, O. O. (2016). Fishing with light: Ecological consequences for coastal habitats. Int. J. Fish. Aquatic Stud. 4 (2), 474–483.
Subasinghe, R., Soto, D., and Jia, J. (2009). Global aquaculture and its role in sustainable development. Rev. Aquac. 1 (1), 2–9. doi:10.1111/j.1753-5131.2008.01002.x
Syah, A. F., Saitoh, S. I., Alabia, I. D., and Hirawake, T. (2016). Predicting potential fishing zones for Pacific saury (Cololabis saira) with maximum entropy models and remotely sensed data. Fish. Bull. 114, 330–342. doi:10.7755/fb.114.3.6
Tao, W. C., and Zhang, Y. B. (2017). Effect of control point accuracy on geometric correction of remote sensing images. J. North China Univ. Technol. Nat. Sci. Ed. 39 (04), 7–14+27.
Uchida, H., and Wilen, J. E. (2004). “Japanese coastal fisheries management and institutional designs: A descriptive analysis,” in Conference proceedings or journal (International Institute of Fisheries Economics and Trade).
Waluda, C. M., Yamashiro, C., Elvidge, C. D., Hobson, V. R., and Rodhouse, P. G. (2004). Quantifying light-fishing for Dosidicus gigas in the Eastern Pacific using satellite remote sensing. Remote Sens. Environ. 91, 129–133. doi:10.1016/j.rse.2004.02.006
Wang, R. (2014). Comprehensive evaluation andAdaptive restoration of remotely sensed images. Doctor Thesis. Wuhan: Wuhan Unversity.
Wang, X., Mu, X., and Yan, G. (2020). Quantitative analysis of aerosol influence on suomi-NPP VIIRS nighttime light in China. IEEE J. Sel. Top. Appl. Earth Observations Remote Sens. 13, 3557–3568. doi:10.1109/jstars.2020.3003480
Wang, Y. (2000). Preliminary study on the evaluation method of image quality of digital remote sensing image. Remote Sens. Inf. 1, 32–33.
Wang, Z. A. (2004). Research on the metric modlfor remote sensing entropy and qulity. Doctor. Wuhan: Wuhan University.
Xu, X., Xu, S., Jin, L., and Song, E. (2011). Characteristic analysis of Otsu threshold and its applications. Pattern Recognit. Lett. 32, 956–961. doi:10.1016/j.patrec.2011.01.021
Yang, C., Han, H., Zhang, H., Shi, Y., Su, B., Jiang, P., et al. (2023). Assessment and management recommendations for the status of Japanese sardine Sardinops melanostictus population in the Northwest Pacific. Ecol. Indic. 148, 110111. doi:10.1016/j.ecolind.2023.110111
Yi, G. (1983). Selection of parameters and operators in fuzzy integrated evaluation. Logging Technol. 6, 21–29.
Yin, L., Zhu, J., Cai, G., and Wang, J. H. (2014). CYP17 inhibitors-abiraterone, C17,20-lyase inhibitors and multi-targeting agents. J Mapp. Spatial Geogr. Inf. 37 (12), 32–42. doi:10.1038/nrurol.2013.274
Zhen, X. (2006). Research on methods for computing the volume of information of remote sensing image. Doctor Thesis. Shandong: Shandong University of science and technology.
Keywords: lit fishing vessel identification, DMSP/OLS, VIIRS/DNB, LJ1-01, remote sensing
Citation: Zhou W, Hu H and Cheng T (2023) Multi-nighttime-light data comparison analysis based on image quality values and lit fishing vessel identification effect. Front. Environ. Sci. 11:1174894. doi: 10.3389/fenvs.2023.1174894
Received: 01 March 2023; Accepted: 25 May 2023;
Published: 05 June 2023.
Edited by:
Shuisen Chen, Guangzhou Institute of Geography, ChinaReviewed by:
Bin Ai, Sun Yat-sen University, ChinaZhuosen Wang, University of Maryland, College Park, United States
Copyright © 2023 Zhou, Hu and Cheng. This is an open-access article distributed under the terms of the Creative Commons Attribution License (CC BY). The use, distribution or reproduction in other forums is permitted, provided the original author(s) and the copyright owner(s) are credited and that the original publication in this journal is cited, in accordance with accepted academic practice. No use, distribution or reproduction is permitted which does not comply with these terms.
*Correspondence: Weifeng Zhou, emhvdV93ZkBob3RtYWlsLmNvbQ==