 Tim H. M. van Emmerik
 Louise J. Schreyers
 Yvette A. M. Mellink
 Ty Sok
 Mauricio E. Arias
94% of researchers rate our articles as excellent or good
Learn more about the work of our research integrity team to safeguard the quality of each article we publish.
Find out more
BRIEF RESEARCH REPORT article
Front. Environ. Sci. , 09 May 2023
Sec. Toxicology, Pollution and the Environment
Volume 11 - 2023 | https://doi.org/10.3389/fenvs.2023.1173946
This article is part of the Research Topic Exploring the Combined Effect of Climate Change and Pollution on Freshwater Ecosystems View all 5 articles
Plastic pollution in rivers is of increased global concern. Rivers act both as pathways for land-based plastic waste into the ocean, and as plastic reservoirs for long-term retention. Reliable observations are key to designing, optimizing and evaluating strategies to prevent and reduce plastic pollution. Several measurement methods have been developed to quantify macroplastic (
Plastic pollution in aquatic environments has detrimental effects and poses severe threats on ecosystem health, and human livelihood (Borrelle et al., 2020; MacLeod et al., 2021; Villarrubia-Gómez et al., 2022). Several efforts are underway to prevent and reduce plastic pollution locally, regionally, and globally (March et al., 2022; Silva Filho and Velis, 2022). Reliable observational data on the state of plastic pollution are key to quantify and understand plastic sources, sinks, and transport dynamics. Furthermore, observational evidence is required to make effective policy, and assess the efficacy of any prevention and reduction measures (Wendt-Potthoff et al., 2020; Edelson et al., 2021).
Rivers are considered as main pathways for land-based plastic pollution into the ocean (González-Fernández et al., 2021; Meijer et al., 2021). However, most mismanaged plastic waste never makes it into the marine environment, and accumulates in and around rivers for long time periods (Weiss et al., 2021; van Emmerik et al., 2022c). Yet, river plastic monitoring is still very sporadic. For most rivers around the world, observational data has limited spatial and temporal coverage, or is not available at all (Meijer et al., 2021; Lebreton et al., 2022). Additional challenges are caused by the use of different measurement methods, resulting in variation in the units, environmental compartments included, or calculated variables. Available data are, therefore, often not directly comparable (van Emmerik et al., 2023). Recent efforts have started to harmonize river plastic monitoring methods and strategies. The harmonization efforts to date have mainly focused on providing guidelines for the design of new monitoring strategies (González-Fernández and Hanke, 2017; Wendt-Potthoff et al., 2020). However, method harmonization may also offer opportunities to combine existing data collected through different methods.
In this paper, we present a simple harmonization approach that allows to estimate floating river plastic transport using data collected through different techniques. We applied the method to the Mekong river around Phnom Penh, Cambodia, where it forms a complex river network with the Tonlé Sap and Bassac rivers (Haberstroh et al., 2021a). The available data were collected through net sampling from boats in the wet season of 2019, and through visual counting from bridges in the dry season of 2022 (Haberstroh et al., 2021a; van Emmerik et al., 2023). We use the available raw data to estimate the total amount of floating plastic items and their mass transport. The results shed new light on the spatial and temporal variability of plastic transport dynamics in the Mekong.
Here, we show that both the floating item and mass plastic transport can be several orders of magnitude higher in the wet season (June-November) compared to the dry season (December-May). Furthermore, our results highlight that river plastic transport dynamics are complex, especially in the Mekong-Tonlé Sap-Bassac system. The flow direction in the Tonle Sap reverses between the wet and dry seasons, driven by the difference in hydraulic head between Tonlé Sap Lake (Northwest of Phnom Penh) and the Mekong river (Arias et al., 2012). This reversing, in combination with the strong seasonality in river discharge, makes that the difference between plastic transport upstream and downstream of Phnom Penh changes considerably between the wet and dry season. The results emphasize the consistent role of Phnom Penh as entry point of plastic pollution. We identified uncertainties in the different transport estimates due to the size range, extrapolation from observation width to the full river width, and omission of subsurface plastic transport. However, the results underscore the importance of seasonality for accurately monitoring and quantifying river plastic pollution. With this paper we aim to provide a next step towards harmonization of river plastic monitoring methods. Furthermore, we demonstrate that by combining data in a harmonized way we can reveal plastic transport dynamics in complex river systems.
The Mekong river is nearly 5,000 km long, and its basin spans across China, Thailand, Laos, Cambodia and Vietnam. We focused on the area around Phnom Penh, the capital city of Cambodia. Here, the Mekong is joined by the Tonlé Sap river, which connects to the Tonlé Sap Lake around 100 km upstream of Phnom Penh (Figure 1). The flow direction in the Tonlé Sap river switches during the year. During the wet season, the discharge flows from the Mekong towards Tonlé Sap Lake, and during the dry season the Tonlé Sap flows into the Mekong. The direction depends on the difference in hydraulic head between Tonlé Sap Lake and the Mekong (Arias et al., 2012; Kummu et al., 2014). Directly downstream of the Mekong-Tonlé Sap confluence, the Mekong splits into the main Mekong branch and the Bassac river, which both end in the Mekong delta. We compare data at four locations: Mekong Upstream, Mekong Downstream, Tonlé Sap and Bassac (Figure 1). The wet and dry season data at Mekong Upstream and Tonlé Sap were taken at nearly the same locations. For Bassac and Mekong Downstream, the distance between the measurement locations were 10 km and 40 km, respectively. The data used in this study was collected using net sampling, and the visual counting method. Net sampling was done in August and September 2019 during the wet season (Haberstroh et al., 2021a). Visual counting was done in February and March 2022, during the dry season van Emmerik et al. (2023). Local discharge data was only available during the wet season. Therefore we retrieved discharge data at Kratie, close to the Cambodia-Loation border around 200 km upstream of Phnom Penh, from the Mekong River Commission Data Portal (https://portal.mrcmekong.org/).
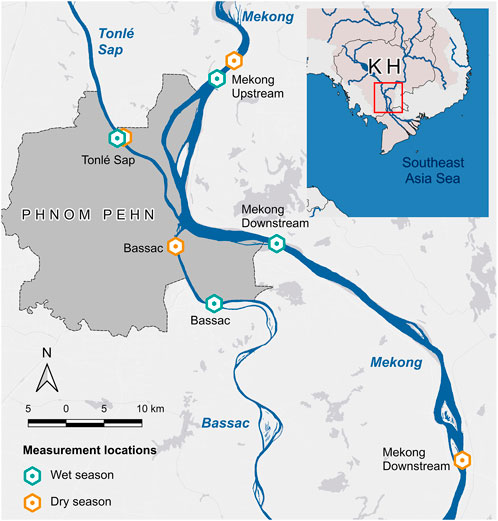
FIGURE 1. Overview of the study site, including the four measurement locations at Mekong Upstream, Mekong Downstream, Tonlé Sap and Bassac. Note that between the wet and dry season measurements, some locations were shifted due to method limitations.
We used the macroplastic data provided by Haberstroh et al. (2021a). Samples were taken at all four measurement locations on 2 days during the wet season in August and September 2019. A 500 μm Neuston net with a frame of 0.5 × 1 m2 was used, equipped with removable floats and weights. The sampling volume was determined by multiplying the flow velocity through the net and the area of the aperture. Flow velocity was measured using a acoustic Doppler current profiler (ADCP, Sontek River Surveyor, YSI Inc., Yellow Springs, Ohio, United States), mounted on a floating board. The mean flow velocity over the depth between 0.2 m (top of the net) and 1.2 m (bottom of the net) was used. The surface samples were collected at five to seven points across the river with at the upper 0.2 m of the water column (Figure 2A). The net was deployed from a semi-stationary boat, with sampling duration between 6 and 15 min. The collected sample was sieved and the large macroplastics (
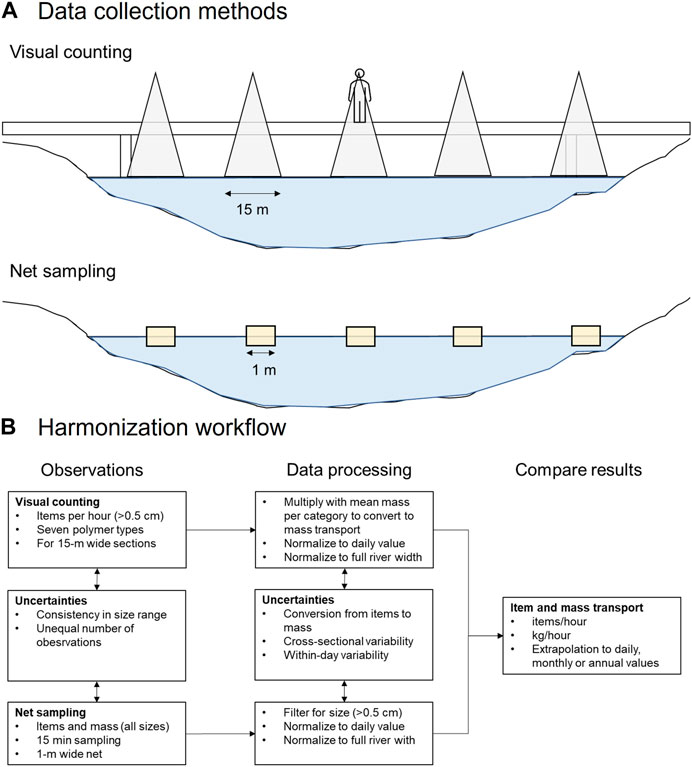
FIGURE 2. (A) Overview of the two methods used for data collection: (1) Visual counting from bridges. This was done at five points across the river width, for which 15 m-wide segments were observed, (2) Net sampling from boats. This was done at five points across the river width using a 1 m-wide net (B). Workflow for harmonizing the raw data from two different measurement methods to calculate the floating plastic item and mass transport.
We used the data provided by van Emmerik et al. (2023). During the dry season floating plastic transport was measured using the visual counting method (González-Fernández and Hanke, 2017). All floating plastic items were counted from bridges for a duration ranging from two to five minutes. At all locations, five equidistantly measurement points were selected, all with an observation track width of 15 m (Figure 2A). The observation height from the bridges varied between 10–15 m for Mekong Upstream, Tonlé Sap and Bassac, and 20–25 m for Mekong Downstream. In general it is assumed that all plastic items larger than 2.5 cm can be seen from bridges up to 15 m, but the minimum detectable item size may increase to 5 cm for bridges up to 30 m (González-Fernández et al., 2021; van Emmerik et al., 2022a). In practice most items down to 0.5 cm can be seen, especially if they are brightly colored and when the width-to-length ratio is close to unity. The counted items were classified in one of the seven polymer categories using a list of typical items that belong to each category (van Emmerik et al., 2022a); PET (polyethylene terephthalate), POsoft (soft polyolefin), POhard (hard polyolefin), PS (polystyrene), ML (multilayer), EPS (expanded polystyrene) and other plastic. Each observation point was measured at least four times per day. At all locations data were collected on the same 4 days (26 February, 28 February, 1 March, and 4 March 2022).
To harmonize the data from the net sampling and the visual counting, we developed a workflow to calculate the same variables (item and mass transport) using similar scaling principles (Figure 2B). The plastic item transport Tn [items/hour] and plastic mass transport Mn [kg/d] based on the net sampling were estimated using the following equations.
With total sampled plastic items Cn [items], the duration of the sampling d [min], the time scale of interest t (e.g., 60 for hourly values, 1,440 for daily values), the river width W [m], net width bn [m], and fraction of items that are macroplastics Rm. Note that the river width is not constant over time. For our assessment, we used different river width values for the wet and dry season (Table 1). For the mass transport, we used the total sampled plastic mass mn.
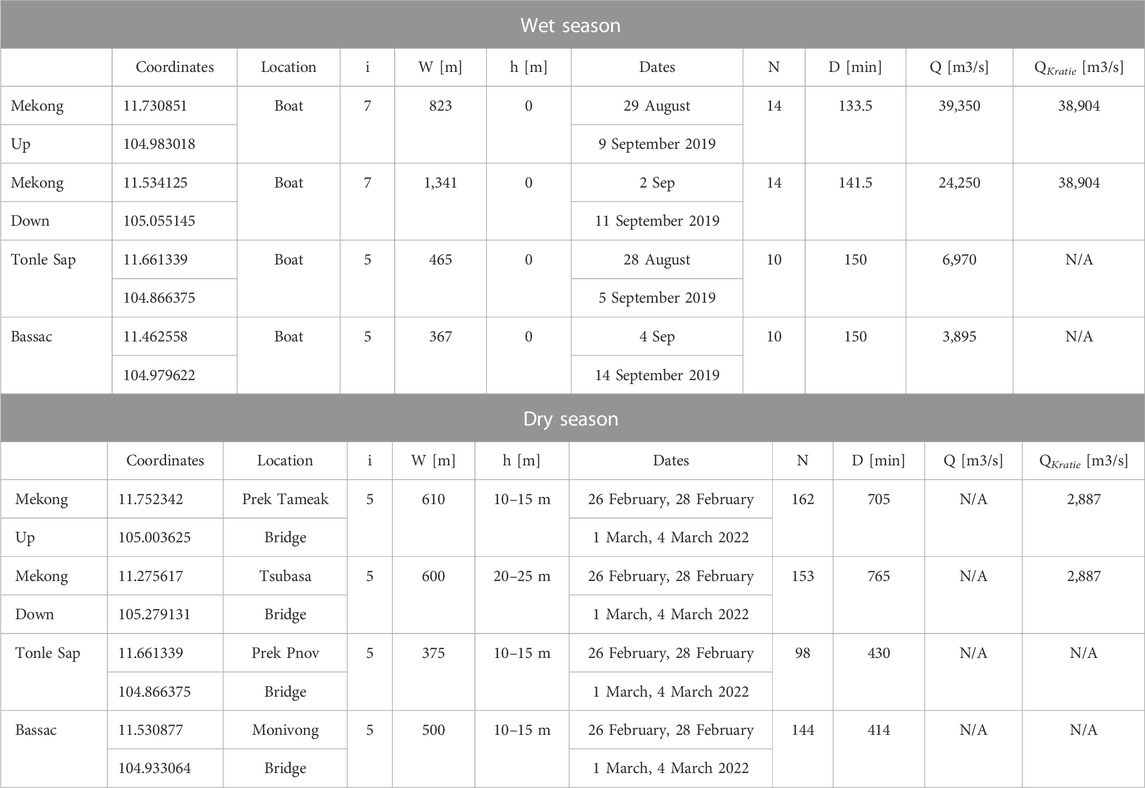
TABLE 1. Overview of the measurement locations where the sampling was done during the wet season and the dry season, including number of observation points i, river width W, distance to surface h, number of observations N, total duration of observations D, discharge at the measurement location Q and upstream discharge at Kratie QKratie.
The item transport Tv based on the visual counting were estimated using the following equation:
With total counted plastic items Cv [items], duration d [min], and observation track width bv.
The mass transport was calculated using three different methods (van Emmerik et al., 2022a): using the mean item mass for each polymer category (Mv,1), using the overall mean item mass (Mv,2), and using the overall median item mass (Mv,3). We used the following equations:
With total counted items Cv per category j, mean mass
During the wet season, the floating plastic transport in the main Mekong branch increased from 3.3 ⋅ 106 items/day upstream to 7.3 ⋅ 106 items/day downstream (Figure 3A). The transport in the Bassac was 0.9 ⋅ 106 items/day, and in the Tonlé Sap 4.1 ⋅ 106 items/day were flowing towards the Lake. In the dry season, the floating transport increased from 1.9 ⋅ 104 to 4.8 ⋅ 104 items/day in the Mekong (Figure 3B). In the Tonlé Sap, the transport was 4.3 ⋅ 104 items/day towards the Mekong. The item transport in the Bassac was 4.6 ⋅ 104 items/day.
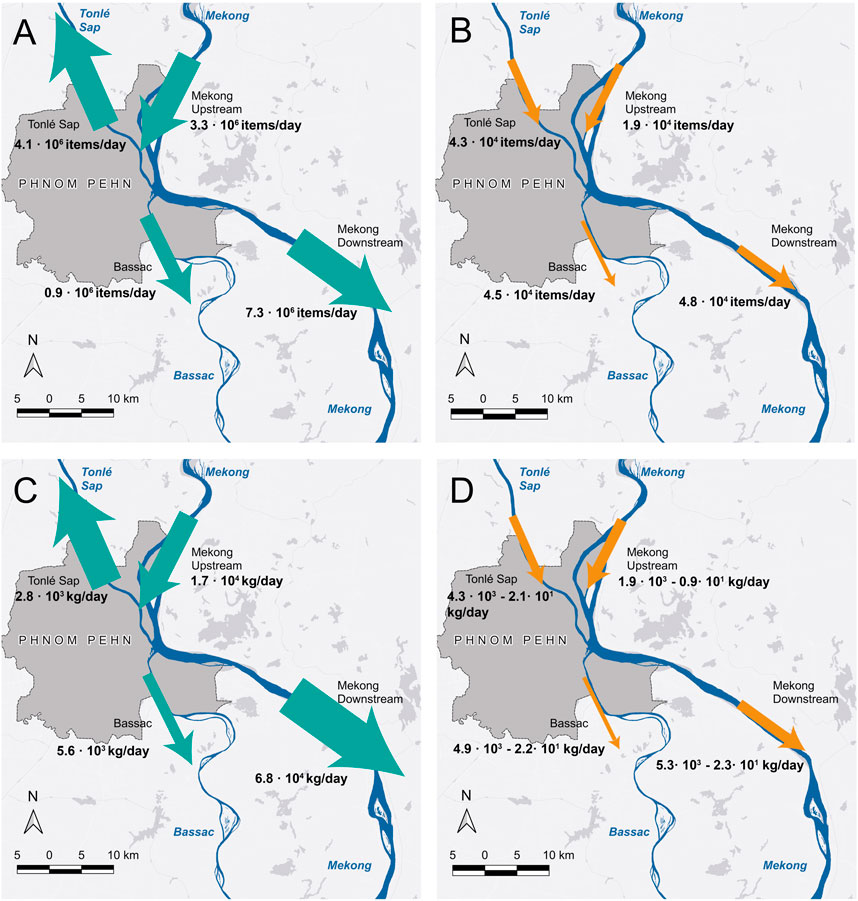
FIGURE 3. Item and mass transport for the Mekong, Tonlé Sap and Bassac measured in the wet and the dry season (A). Item transport measured in the wet season (Aug-September 2019) (B). Item transport measured in the dry season (March 2022) (C). Mass transport measured in the wet season (Aug-September 2019) (D). Mass transport measured in the dry season (March 2022). Note that the range in the dry season mass transport estimates is due to using different calculation methods (see Methods). Also note the reverse of the plastic transport direction in the Tonlé Sap river between the wet and dry seasons.
Mass transport increased from 1.7 ⋅ 103 to 6.8 ⋅ 103 kg/day between the upstream and downstream point along the Mekong (Figure 3C). The transport in the Bassac and Tonlé Sap were 0.5 ⋅ 103 and 2.8 ⋅ 103 kg/day, respectively. We calculated the floating mass transport in the dry season using three methods, which range over one order of magnitude (Figure 3D). In the Mekong main branch, the mass transport increased from 9.2 ⋅ 100 to 1.9 ⋅ 102 kg/day upstream to 2.3 ⋅ 101 to 5.3 ⋅ 102 kg/day downstream. The transport in the Tonlé Sap and Bassac are estimated at 2.1 ⋅ 101–0.4 ⋅ 103 and 2.2 ⋅ 101–0.5 ⋅ 103 kg/day, respectively.
For the item transport, we found a 20 to 170 time increase between the wet and dry season. The latest increase was found in the main Mekong branch (170 and 153 for upstream and downstream, respectively). Transport in the Tonlé Sap river was 95 times larger in the wet season, but even more important is the flow reversal. During the dry season, the Tonlé Sap flows into the Mekong. The smallest increase was found in the Bassac (20 times).
For the mass transport, the difference between wet and dry largely depends on the chosen calculation method for the visual estimates. The estimates using the mean item mass (Mv,1 and Mv,2), the multiplication factors are one order of magnitude lower than for the estimates using the median item mass (Mv,3). The largest increase (based on Mv,1 and Mv,2) was again found for the upstream (9–15 times) and downstream (13–23 times) Mekong locations. Tonlé Sap and Bassac increased with a factor 7 to 11, and 1 to 2, respectively. The difference based on Mv,3, the amplification was 186 (upstream) and 294 (downstream) for the Mekong, 138 for Tonlé Sap, and 23 for the Bassac.
The discharge in Kratie, at the Cambodian-Laotian border, was 2,887 m3/s in the dry season (2022) and 38,904 m3/s in the wet season (2019). The average measured discharge during the wet season at the Mekong Up and Mekong down locations was 39,350 m3/s and 24,250 m3/s, respectively. Discharge increased with a factor 13.5, which is of similar magnitude as the lower amplification factor of plastic mass transport, but much lower than the amplification factor for the item transport. In other rivers it was found that plastic transport generally increases disproportionally to the increase in discharge. In the Seine, plastic transport increased with a factor ten when discharge increased only a factor three (van Calcar and van Emmerik, 2019). A recent study in the Meuse found a power law relation between discharge and plastic transport, suggesting a non-linear response of plastic transport to discharge (van Emmerik et al., 2022b). The disproportional increase of plastic transport to discharge is generally explained by additional mobilization of plastic towards the river, and remobilization of accumulated plastics on the riverbanks and floodplain due to increased water level and flow velocities.
During the wet season the Tonlé Sap river flows from the main Mekong branch towards the Tonlé Sap Lake, with an estimated plastic transport of 2.8 ⋅ 103 kg/day. In the dry season the flow reverses, resulting in 2.1 ⋅ 101–4.3 ⋅ 102 kg/day. Given that the inflow from the Mekong into the Tonlé Sap during the wet season is 7–138 times higher that the backflow during the dry season, the Mekong may be a main source of plastic pollution found in the Tonlé Sap river and Lake. The overall mass balance also changes considerably, and specifically the difference between the total upstream and downstream transport. In the wet season, the total downstream transport (Tonlé Sap, Bassac and Mekong Downstream) is 3.8 (items) to 5.9 (mass) times larger than the upstream transport (Mekong Upstream). In the dry season, the increase from upstream (Mekong Up and Tonlé Sap) to downstream (Bassac and Mekong Down) is only a factor 1.5 (item) to 1.5–1.7 (mass). The mass balance suggests that during the wet season, even more plastic enters the river system from Phnom Penh (Haberstroh et al., 2021a). Also in other urban areas connected to natural river it has been found that during periods of increased rainfall and discharge, more plastic are mobilized and transported into rivers (Tasseron et al., 2022; Treilles et al., 2022). To better quantify and understand sources of riverine plastic, also the seasonality of entry processes should be considered.
In this paper we present a first harmonization effort that combines macroplastic observations collected through different methods, in different time periods. Although the data collection has been relatively well documented, several assumptions may have introduced sources of uncertainty in the item and mass transport estimates. First, we assumed a similar size range (
Second, the extrapolation to the full river width is considered more uncertain for the net sampling due to the limited sampling area. With five to seven 1-m wide sampling points, the share of the observed width ranged between 0.5% and 1.4%. Visual counting from bridges had five 15-m wide observation points, equalling 12.3%–20.0% of the total river width. Depending on the river, location within the river, and the time, the cross-sectional distribution of floating plastic can range from uniformly distributed to heavily concentrated. For example, the Rhine showed a concentrated profile with 50% of the transport occurring within near to 20% of the width (90% in nearly 60%). Other rivers, such as the Chao Phraya and Ciliwung show a close to uniformly distributed profile (50% and 90% of transport in 50% and 90% of the width, respectively) (van Calcar and van Emmerik, 2019).
Finally, we only considered surface transport in this study. The original study by Haberstroh et al. (2021a) demonstrated that the vertical profile of plastic item and mass concentration is highly variable. During periods with the highest surface concentrations, the subsurface concentrations were relatively low (up to 2,000 times). However, in some cases the highest concentrations were measured below the surface. Given a depth between 15 and 30 m in the study area (Haberstroh et al., 2021a), the subsurface transport may be considerably higher than the floating transport only. In our study we purposefully focused on floating plastic transport only. Depending on the plastic characteristics and flow regime, items may be transported closer to or further from the surface (Haberstroh et al., 2021b; Valero et al., 2022). During the dry season, relatively high portions of positively buoyant plastics were observed (PET: 9% vs. 1% (Expanded) PS: 29% vs. 3%). In the wet season the majority of items were PP and PE (85% wet, vs. 39% dry), which are more likely to also be found below the surface. The difference in total plastic transport between the wet and dry season may therefore be even be higher.
In our paper we show how data collected through different methods can be combined to derive the same metrics of floating plastic transport. In the proposed harmonization workflow it is crucial to extrapolate to the river width, and to the same unit of time (hours or days). It is therefore important that the spatial extent and duration of measurements are clearly reported. For image-based techniques the temporal dimension may be challenging, as these are often done on single images taken at a certain moment in time (Geraeds et al., 2019). These observations should be complemented with either additional images, or flow velocity estimates, to convert the observations to transport per unit of time. Extrapolation from the observation width to the total river width should not be an issue with most conventional monitoring methods (e.g., net width, image footprint, observation track width), as long as the dimensions are reported. However, the river width can change over time (Table 1), and therefore needs to be measured as well. Further work should focus on exploring how to directly compare the estimates of river plastic transport based on different methods, for example, through simultaneous data collection efforts. Although such efforts require additional resources, it may help to reduce the uncertainties as discussed in this paper.
Combining the data collected during the wet and dry season confirms the strong seasonality of plastic transport. Previous work found that plastic item transport can vary one to two orders of magnitude during the year (van Calcar and van Emmerik, 2019; Schirinzi et al., 2020; Cesarini et al., 2023). Here, we demonstrate that also the floating plastic mass transport can increase with a factor of 9–294 during the wet season compared to the dry season. Especially during periods of high discharge and extreme events (e.g., floods), plastic mobilization and transport are amplified. For reliable long-term monitoring and annual transport estimates, it is therefore crucial that also during such periods data is collected. Not all methods are however suitable to be applied during extreme flow conditions. During floods, large debris and debris patches can make net sampling challenging and dangerous, both from boats or bridges (van Emmerik et al., 2022b). Visual counting from bridges or image-based techniques provide a safe alternative. Our paper may provide guidance on how multiple methods can be combined for long-term measurement strategies under varying flow conditions.
Finally, the results from our paper demonstrate the complexity of river plastic transport dynamics. Within the field of plastic pollution research, rivers have often been considered as conduits for land-based plastic waste towards the ocean. The morphology, hydrology, connection to urban areas, and seasonality are just some of the factors that result in highly non-linear and discontinuous plastic transport processes (Haberstroh et al., 2021c; van Emmerik et al., 2022a). This becomes even more complex because of the diversity of plastic characteristics, including polymer type, effective buoyancy, and geometry. Increased evidence supports the hypothesis that most mismanaged plastic waste does not enter the sea, but rather accumulates in and around rivers where they may be retained for long periods of time (Tramoy et al., 2020; van Emmerik et al., 2022c). Only through improved observational capacities the appropriate data can be collected to better understand and quantify river plastic transport dynamics.
In this paper we demonstrate how floating plastic data collected through different methods can be harmonized and combined to gain new insights in river plastic transport. We used data from net sampling in the wet season, and visual counting in the dry season to estimate the plastic item and mass transport.
In all branches of the Mekong-Tonlé Sap-Bassac system the floating plastic transport increased considerably in the wet season compared to the dry season. The largest increase was found in the main Mekong branch, with 153–170 times more item transport and 9 to 294 times more mass transport. The transport in the Tonlé Sap and Bassac were up to 138 and 23 times more in the wet season, respectively. The results revealed a strong seasonal variation in plastic transport.
The mass balance of the Mekong-Tonlé Sap-Bassac system changed substantially between the seasons. During the wet season the Tonlé Sap river flows from the main Mekong towards Tonlé Sap Lake, but reverses during the dry season. The total increase in the total transport from upstream to downstream of Phnom Penh changed from a factor 1.5–1.7 (wet season) to 3.8–5.9 (dry season). The results underscore the role of Phnom Penh as potential major entry point of plastic pollution, especially during the wet season.
Further harmonization efforts should focus on reducing the uncertainties when combining data from different methods. The most important sources of uncertainty were assumed to be caused by the considered size ranges, the extrapolation from the observation points to the full river width, and omission of submerged share of total plastic transport. We recommend the development of guidelines to further align practical choices independently of the selected method, including size range, portion of the river width to be sampled, and measurement duration.
This paper shows that river plastic transport dynamics can be highly complex, especially around confluences, tributaries, and urban areas. Improved data collection is key to better understand and quantify the plastic sources, sinks, and pathways. With our paper we aim to contribute to further harmonization and development of plastic pollution monitoring strategies in aquatic systems.
The datasets presented in this study can be found in online repositories. The names of the repository/repositories and accession number (s) can be found below: The visual counting observations during the dry season are openly available through http://doi.org/10.4121/21763220. The net sampling data are openly available through http://doi.org/10.1088/1748-9326/ac2198.
Conceptualization: TvE and LS; methodology: TvE and LS; formal analysis: TvE, LS, and MA; investigation—data collection: TvE, LS, and YM; visualization: LS; data curation: TvE; writing–original draft: TvE and LS; writing–reviewing and editing: all authors; supervision: TvE; project administration: TvE; funding acquisition: TvE.
This research was partly funded by the World Water Quality Alliance (WWQA) a programme supported by the UN Environment Programme (UNEP) and the Joint Research Centre (JRC) of the European Commission. The work of TvE is supported by the Veni research program The River Plastic Monitoring Project with project number 18211, which is (partly) funded by the Dutch Research Council (NWO).
We thank the staff and students from the Institute of Technology of Cambodia who participated in the 2022 data collection. We thank Christian Schmidt and Katrin Wendt-Potthoff for their feedback on an earlier version of this manuscript.
The authors declare that the research was conducted in the absence of any commercial or financial relationships that could be construed as a potential conflict of interest.
All claims expressed in this article are solely those of the authors and do not necessarily represent those of their affiliated organizations, or those of the publisher, the editors and the reviewers. Any product that may be evaluated in this article, or claim that may be made by its manufacturer, is not guaranteed or endorsed by the publisher.
Arias, M. E., Cochrane, T. A., Piman, T., Kummu, M., Caruso, B. S., and Killeen, T. J. (2012). Quantifying changes in flooding and habitats in the tonle sap lake (Cambodia) caused by water infrastructure development and climate change in the mekong basin. J. Environ. Manag. 112, 53–66. doi:10.1016/j.jenvman.2012.07.003
Borrelle, S. B., Ringma, J., Law, K. L., Monnahan, C. C., Lebreton, L., McGivern, A., et al. (2020). Predicted growth in plastic waste exceeds efforts to mitigate plastic pollution. Science 369, 1515–1518. doi:10.1126/science.aba3656
Castro-Jiménez, J., González-Fernández, D., Fornier, M., Schmidt, N., and Sempéré, R. (2019). Macro-litter in surface waters from the Rhone river: Plastic pollution and loading to the NW Mediterranean Sea. Mar. Pollut. Bull. 146, 60–66. doi:10.1016/j.marpolbul.2019.05.067
Cesarini, G., Crosti, R., Secco, S., Gallitelli, L., and Scalici, M. (2023). From city to sea: Spatiotemporal dynamics of floating macrolitter in the tiber river. Sci. Total Environ. 857, 159713. doi:10.1016/j.scitotenv.2022.159713
de Lange, S. I., Mellink, Y., Vriend, P., Tasseron, P. F., Begemann, F., Hauk, R., et al. (2023). Sample size requirements for riverbank macrolitter characterization. Front. Water 4. doi:10.3389/frwa.2022.1085285
Edelson, M., Håbesland, D., and Traldi, R. (2021). Uncertainties in global estimates of plastic waste highlight the need for monitoring frameworks. Mar. Pollut. Bull. 171, 112720. doi:10.1016/j.marpolbul.2021.112720
Geraeds, M., van Emmerik, T., de Vries, R., and bin Ab Razak, M. S. (2019). Riverine plastic litter monitoring using unmanned aerial vehicles (uavs). Remote Sens. 11, 2045. doi:10.3390/rs11172045
González-Fernández, D., Cózar, A., Hanke, G., Viejo, J., Morales-Caselles, C., Bakiu, R., et al. (2021). Floating macrolitter leaked from Europe into the ocean. Nat. Sustain. 4, 474–483. doi:10.1038/s41893-021-00722-6
González-Fernández, D., and Hanke, G. (2017). Toward a harmonized approach for monitoring of riverine floating macro litter inputs to the marine environment. Front. Mar. Sci. 4, 86. doi:10.3389/fmars.2017.00086
Haberstroh, C. J., Arias, M. E., Yin, Z., Sok, T., and Wang, M. C. (2021a). Plastic transport in a complex confluence of the mekong river in Cambodia. Environ. Res. Lett. 16, 095009. doi:10.1088/1748-9326/ac2198
Haberstroh, C. J., Arias, M. E., Yin, Z., and Wang, M. C. (2021b). Effects of hydrodynamics on the cross-sectional distribution and transport of plastic in an urban coastal river. Water Environ. Res. 93, 186–200. doi:10.1002/wer.1386
Haberstroh, C. J., Arias, M. E., Yin, Z., and Wang, M. C. (2021c). Effects of urban hydrology on plastic transport in a subtropical river. Acs Es&T Water 1, 1714–1727. doi:10.1021/acsestwater.1c00072
Kummu, M., Tes, S., Yin, S., Adamson, P., Józsa, J., Koponen, J., et al. (2014). Water balance analysis for the tonle sap lake–floodplain system. Hydrol. Process. 28, 1722–1733. doi:10.1002/hyp.9718
Lebreton, L., Kooi, M., Mani, T., Mintenig, S., Tekman, M., van Emmerik, T., et al. (2022). Plastics in freshwater bodies. Plastics and the ocean: Origin, characterization, fate, and impacts, 199–225.
MacLeod, M., Arp, H. P. H., Tekman, M. B., and Jahnke, A. (2021). The global threat from plastic pollution. Science 373, 61–65. doi:10.1126/science.abg5433
March, A., Roberts, K. P., and Fletcher, S. (2022). A new treaty process offers hope to end plastic pollution. Nat. Rev. Earth Environ. 3, 726–727. doi:10.1038/s43017-022-00361-1
Meijer, L. J., van Emmerik, T., van der Ent, R., Schmidt, C., and Lebreton, L. (2021). More than 1000 rivers account for 80% of global riverine plastic emissions into the ocean. Sci. Adv. 7, eaaz5803. eaaz5803. doi:10.1126/sciadv.aaz5803
Schirinzi, G. F., Köck-Schulmeyer, M., Cabrera, M., González-Fernández, D., Hanke, G., Farré, M., et al. (2020). Riverine anthropogenic litter load to the mediterranean sea near the metropolitan area of Barcelona, Spain. Sci. Total Environ. 714, 136807. doi:10.1016/j.scitotenv.2020.136807
Silva Filho, C. R., and Velis, C. A. (2022). United nations’ plastic pollution treaty pathway puts waste and resources management sector at the centre of massive change. Waste Manag. Res. 40, 487–489. doi:10.1177/0734242x221094634
Tasseron, P., Begemann, F., Joosse, N., van der Ploeg, M., van Driel, J., and van Emmerik, T. (2022). Urban water systems as entry points for river plastic pollution. preprint on ResearchSquare.
Tramoy, R., Gasperi, J., Colasse, L., and Tassin, B. (2020). Transfer dynamic of macroplastics in estuaries—new insights from the seine estuary: Part 1. Long term dynamic based on date-prints on stranded debris. Mar. Pollut. Bull. 152, 110894. doi:10.1016/j.marpolbul.2020.110894
Treilles, R., Gasperi, J., Tramoy, R., Dris, R., Gallard, A., Partibane, C., et al. (2022). Microplastic and microfiber fluxes in the seine river: Flood events versus dry periods. Sci. Total Environ. 805, 150123. doi:10.1016/j.scitotenv.2021.150123
Valero, D., Belay, B. S., Moreno-Rodenas, A., Kramer, M., and Franca, M. J. (2022). The key role of surface tension in the transport and quantification of plastic pollution in rivers. Water Res. 226, 119078. doi:10.1016/j.watres.2022.119078
van Calcar, C., and van Emmerik, T. v. (2019). Abundance of plastic debris across European and Asian rivers. Environ. Res. Lett. 14, 124051. doi:10.1088/1748-9326/ab5468
van Emmerik, T., de Lange, S., Frings, R., Schreyers, L., Aalderink, H., Leusink, J., et al. (2022a). Hydrology as a driver of floating river plastic transport. Earth’s Future 10, e2022EF002811. doi:10.1029/2022ef002811
van Emmerik, T., Frings, R., Schreyers, L., Hauk, R., de Lange, S., and Mellink, Y. (2022b). River plastic during floods: Amplified mobilization, limited river-scale dispersion. preprint on ResearchSquare.
van Emmerik, T., Kirschke, S., Schreyers, L., Nath, S., Schmidt, C., and Wendt-Potthoff, K. (2023). Estimating plastic pollution levels in rivers through harmonized monitoring strategies. [Preprint]. doi:10.21203/rs.3.rs-2401406/v1
van Emmerik, T., Mellink, Y., Hauk, R., Waldschläger, K., and Schreyers, L. (2022c). Rivers as plastic reservoirs. Front. Water 3, 212. doi:10.3389/frwa.2021.786936
van Emmerik, T., Strady, E., Kieu-Le, T.-C., Nguyen, L., and Gratiot, N. (2019). Seasonality of riverine macroplastic transport. Sci. Rep. 9, 13549–9. doi:10.1038/s41598-019-50096-1
Villarrubia-Gómez, P., Cornell, S. E., Almroth, B. C., Ryberg, M., and Eriksen, M. (2022). Plastics pollution and the planetary boundaries framework. preprint on EarthArXiv.
Vriend, P., Van Calcar, C., Kooi, M., Landman, H., Pikaar, R., and Van Emmerik, T. (2020). Rapid assessment of floating macroplastic transport in the Rhine. Front. Mar. Sci. 7, 10. doi:10.3389/fmars.2020.00010
Weiss, L., Ludwig, W., Heussner, S., Canals, M., Ghiglione, J.-F., Estournel, C., et al. (2021). The missing ocean plastic sink: Gone with the rivers. Science 373, 107–111. doi:10.1126/science.abe0290
Keywords: macroplastic, hydrology, water quality, Cambodia, floating plastic, marine litter, microplastic
Citation: van Emmerik THM, Schreyers LJ, Mellink YAM, Sok T and Arias ME (2023) Large variation in Mekong river plastic transport between wet and dry season. Front. Environ. Sci. 11:1173946. doi: 10.3389/fenvs.2023.1173946
Received: 25 February 2023; Accepted: 14 April 2023;
Published: 09 May 2023.
Edited by:
Tania Martellini, University of Florence, ItalyReviewed by:
Giuseppe Suaria, National Research Council, ItalyCopyright © 2023 van Emmerik, Schreyers, Mellink, Sok and Arias. This is an open-access article distributed under the terms of the Creative Commons Attribution License (CC BY). The use, distribution or reproduction in other forums is permitted, provided the original author(s) and the copyright owner(s) are credited and that the original publication in this journal is cited, in accordance with accepted academic practice. No use, distribution or reproduction is permitted which does not comply with these terms.
*Correspondence: Tim H. M. van Emmerik, dGltLnZhbmVtbWVyaWtAd3VyLm5s
Disclaimer: All claims expressed in this article are solely those of the authors and do not necessarily represent those of their affiliated organizations, or those of the publisher, the editors and the reviewers. Any product that may be evaluated in this article or claim that may be made by its manufacturer is not guaranteed or endorsed by the publisher.
Research integrity at Frontiers
Learn more about the work of our research integrity team to safeguard the quality of each article we publish.