 Ana Ri
 Huijun An*
- College of Forestry, Inner Mongolia Agricultural University, Hohhot, China
This work aims to propose a more accurate assessment method for forest health in natural larch pine forests of the Arxan by integrating remote sensing technology with tree crown feature analysis. Currently, forest health assessment of natural Larch pine forests relies mainly on ground surveys, and there is a gap in the application of remote sensing technology in this field. This work introduces deep learning technology and proposes a spectral-Gabor space discrimination and classification model to analyze multi-spectral remote sensing image features. Additionally, quantitative indicators, such as tree crown features, are incorporated into the forest health assessment system. The health status of natural Larch pine forests is evaluated using forest resource survey data. The results show that the health levels of natural Larch pine forests in different areas vary and are closely related to factors such as canopy density, community structure, age group, and slope. Both quantitative and qualitative indicators are used in the analysis. The introduction of this innovative method enhances the accuracy and efficiency of forest health assessment, providing significant support for forest protection and management. In addition, the classification accuracy of the health assessment model suggested that the maximum statistical values of average classification accuracy, average classification effectiveness, overall classification accuracy, and Kappa were 74.19%, 61.91%, 63.18%, and 57.63%, respectively. This demonstrates that the model can accurately identify the health status of natural larch forests. This work can effectively assess the health status of the natural larch forest in the Arxan and provide relevant suggestions based on the assessment results to offer a reference for the sustainable development of the forest system.
Introduction
As one of the important components of the Earth’s ecosystem, forests contain substantial species essential for soil and water conservation, climate improvement, and air purification (Torres et al., 2021; Ecke et al., 2022). Statistics show that the Three-North Shelter Forest Program extends from northeast China to northern China and northwest China, with a total area of nearly 1.5 million square kilometers. Its afforestation area in desertified areas has exceeded 300,000 square kilometers, and the total proportion of green area has reached more than 80% of the desertification land area in China (Cherubini et al., 2021). The resources and services provided by this protective forest are highly correlated with the health of the forest ecosystem. For example, species rich and healthy forests produce sufficient timber and ecological services while maintaining the food chain and biodiversity in the forest well; forests with simple structures and in a critical state of health are only able to sustain basic tree survival (Iglhaut et al., 2019; Guimarães et al., 2020; Carnegie et al., 2022). The natural Larch pine forests in the Greater Khingan Mountains are currently facing a state of system destabilization, decreased vitality, and forest area reduction due to various factors, including climate change, human activities, and pests. These changes have resulted in more frequent occurrences of severe weather phenomena, such as dust storms, which have had adverse effects on both the ecological environment and socio-economic development in the area. Therefore, the understanding of tree characteristics and health assessment in forest ecosystems has become the focus of research scholars in related fields.
Of course, due to the complexity of the forest ecosystem, the understanding of the health status of forest trees in the forest isn’t the same, and there is no unified forest health assessment standard. Saha et al. (2021a) employed advanced geospatial techniques to evaluate the forest health status of the Buxa Natural Reserve in the Himalayan Mountains, revealing varying degrees of forest pests and human interference in the region. In a similar vein, Malik et al. (2020) utilized geospatial analysis to investigate seasonal changes in the vegetation status of the subtropical deciduous forest, indicating significant fluctuations throughout the seasons. Moreover, Saha et al. (2021b) assessed and analyzed forest cover dynamics using a forest canopy density model, which demonstrated a close correlation between forest cover spatial distribution and changes in topography and land use types. Forestry remote sensing technology has been extensively studied by scholars as a means of evaluating forest species, structure, growth, and health status using airborne or satellite remote sensing data. Pal et al. (2018) combined the forest canopy density model with satellite data to achieve remote sensing monitoring and mapping of forest cover in the Sali Basin of West Bengal. Ahmadi et al. (2023) used high-resolution remote sensing technology to predict the distribution of major tree species in forests with insufficient climate data. Their findings suggested that integrating high-resolution remote sensing data could improve the accuracy of species distribution models. Despite these advancements, a unified standard for forest health assessment has yet to be established. Additionally, remote sensing data quality is affected by factors such as clouds, fog, and occlusion, resulting in limited accuracy in tree crown feature extraction. Therefore, the effective extraction of spectral features in remote sensing images is extremely important. The deep learning algorithm can mine the relationship between data through independent learning of remote sensing images, which can greatly improve the accuracy and stability of image classification and recognition while improving efficiency, like reference (Tian et al., 2021).
In conclusion, it is of great significance to explore the health status and assessment methods of natural larch forests under the guidance of forestry remote sensing integrated with the analysis of canopy characteristics for the sustainable development of subsequent forest systems and the formation of biodiversity. The innovations of this work are as follows. First, the health status of natural larch forests is analyzed by collecting 2A sentinel standard reflectance images with a spatial resolution of 10 m and forest class II survey data using Gurban Forest Farm of the Arxan Forestry Bureau as the study area. Secondly, the health of natural larch forests is assessed by quantitative and qualitative indicators. Third, a feature extraction and classification model based on spectral-Gabor spatial discriminant analysis is proposed to analyze the features of the acquired multi-spectral remote sensing images. Finally, the performance of the health assessment method and model reported here is verified through experimental analysis to provide a reference for the follow-up health status analysis and ecologically sustainable development of the forest system.
Recent related work
Advances in forest health evaluation and analysis
Many scholars have researched the state of forest health. Cortés et al. (2020) discussed predictive genomic approaches. They found that these approaches promise to increase the accuracy of adaptive selection and reduce generation intervals. Besides, exploring genome-wide prediction methods can help detect novel allelic variants in tree germplasm and reveal the genomic potential for adaptation to different environments. Jakovljević et al. (2021) con-ducted passive ozone measurements and monitoring of forest health indicators in holly oak (Quercus ilex L.), brash oak (Quercus stellata), Larch pine (Pinus koraiensis Sieb. et Zucc.), and black pine (Pinus thunbergii Parlatore) forests. Results showed that the ozone levels of all species were close to reaching a reasonable upper limit (100 ppb) for passive monitoring of air quality in forest sites, with the highest values for the uptake-based indicator on black pepper. At the same time, the relationship between environmental variables and forest health response indicators could be found to be significantly related to the soil moisture content at different depths of canopy defoliation; besides, tree growth is related to different forest health response indicators. Kayet et al. (2022) assessed and predicted the forest health risk in forest areas affected by mining based on the Analytic Hierarchy Process model of multi-criteria analysis. In total, they considered parameters including climate, natural or landform, forestry, topography, environmental, and anthropogenic factors. Very high-risk grades were found in mines surrounding forest subdivisions, based on FHR assessment and prediction results, with FHR negatively correlated with distance from mine and leaf flour dust concentration. Their research provided fundamental guidance for effective planning and management of forestry research in mining-affected areas. Tan et al. (2021) assessed the impact of nature-based solutions in urban design on forest ecosystem service performance based on a spatially explicit modeling approach by using a recent nature-centered town in Singapore as a case study. The authors found that designing towns with ecosystem services in mind and incorporating nature-based solutions into the urban design can help improve performance in delivering ecosystem services, with significant benefits for tree health assessments in forests.
Current situation of AI applied to remote sensing image recognition
Since each sample in hyperspectral remote sensing images consists of high-dimensional features and contains rich remote sensing features, feature selection, and mining become even more difficult. Algorithms such as deep learning in artificial intelligence technology can independently learn and mine features in images, effectively improving the ability to identify features in remote sensing images. Scholars in many related fields have conducted research. Ge et al. (2020) compared the classification performance of k-nearest neighbor, random forest (RF), support vector machine (SVM), and artificial neural network (ANN) in land use and cover change (LUCC) in Chinese oases. They found that ANN, SVM, and RF achieved statistically similar accuracy. The RF algorithm performed well in several aspects, such as stability, ease of use, and processing time during parameter adjustment. It was capable of analyzing spectral indices (e.g., NDVI, MSAVI2, and MNDWI) and providing a reference for the extraction of LUCC information in arid regions with oasis-desert mosaic landscapes. Alam et al. (2021) applied the convolutional neural network to the semantic segmentation of remote sensing images. The authors also improved the encoder-decoder CNN structure SegNet with index pool-ing and U-net, making it suitable for remote sensing Multi-object Semantic Segmentation of Images. The results showed that the comprehensive algorithm could segment multi-object remote sensing images. Cai et al. (2021) proposed a multi-attention residual integrated network algorithm. The analysis of multiple multi-class public data sets revealed that the algorithm adds feature fusion while reducing redundant features, which makes the recognition capability of hyperspectral images effectively improved. Han et al. (2022) presented a building extraction method for remote sensing images combining traditional digital image processing methods and convolutional neural networks. Experiments showed that the method improves detection accuracy and reduces computation time compared with the Region-CNN algorithm.
To sum up, the research and analysis of the above-mentioned scholars indicate that forests, as one of the important components of the Earth’s ecosystem, are closely related to the sustainable development of the economy and the improvement of social benefits to evaluate the health of forests.
Research area and methodology
Study area
Arxan Forestry Bureau is located in the northeast of the Inner Mongolia Autonomous Region and the middle and low mountainous area in the south of the main line of the Greater Khingan Mountains. It belongs to the transitional zone type of forest and forest grassland and has a typical volcanic landform type (Quesada-Román and Mata-Cambronero, 2021). Figure 1 displays the geographical location of the study area.

FIGURE 1. Geographical map of the study area.
As shown in Figure 1, the research area is located in the Gurban Forest Farm of Arxan Forestry Bureau. The dominant tree species are white birch and larch, and the natural larch forest is taken as the research object. The elevation of Gurban Forestry Station of the Arxan Forestry Bureau gradually decreases from east to west, with an average elevation of 1023m; the annual average temperature is −3.2°C; the annual extreme maximum temperature is 34.1°C; the annual ex-treme minimum temperature is −45.7°C; the frost-free period is 77 days; the rainfall is 451.2 mm. Overall, it is characterized by cold and humid, long winter, and large temperature differences between day and night. At the same time, due to the influence of climate factors, the snow cover is thinner in sunny slopes and river valleys where there are no trees and vegetation, and the snow cover is unevenly distributed due to the effect of wind blowing (Dainelli et al., 2021). Ruidas et al. (2022b) and Ruidas et al. (2021) have conducted a vulnerability assessment of water resources based on hydro-geochemical characteristics. The study revealed that water resources in lakes were impacted by both human activities and natural processes, emphasizing the importance of effective management and planning of water resources.
The soil in the study area was gray forest soil and brown coniferous forest soil in order with the elevation increasing. Moreover, the regional distribution law is mainly reflected in the formation of different recessed soils due to the redistribution of water and heat caused by changes in topography and landform. For example, meadow soil is distributed on both sides of rivers and valleys and in the low and flat areas of marshes; swamp soil is distributed lower than meadow soil, and the soil is humid, with seasonal or perennial water accumulation on the surface; stony soil is only distributed on the gravel ejected by modern volcanoes, and there are large pores. The Gurban Forest Farm of the Arxan Forestry Bureau is located on the gentle slope of the middle section of Greater Khingan Mountains, a forest-grass transition area from forest land to meadow, and the soil type is brown coniferous soil (Chen et al., 2022). Ruidas et al. (2022a) proposed a metaheuristic optimization process integrating rainfall and geological data to develop 15 flood-susceptibility factors. The study found that this approach could accurately assess flood susceptibility.
The vegetation types of the Arxan Forestry Bureau include forest, shrub, meadow, swamp, and aquatic plants. Its forest vegetation is clearly distributed vertically and roughly divided into four vegetation zones: the forest zone domi-nated by the zonal plant Xing’an larch (Larix gmelinii (Rupr.) Kuzen) (above 1200 m in elevation), the mixed conifer-broad forest formed by Xing’an larch and white birch (Betula platyphylla Suk.) (1000–1200 m in elevation), the forest-steppe zone (below 1000 m), and the stone pond forest (1100–1250 m) (Wang et al., 2021; Yang, 2022). The larch forest in Gurban Forest Farm of Arxan Forestry Bureau has neat margins and is a middle-aged forest with a forest age of 29 years. The average tree height is 16 m; the average diameter is 15 cm; the canopy density is 0.85; the soil type is brown coniferous soil. The understory shrub is rose thorn with a coverage of 5%, and the herb is sedge with a coverage of 60%. There are logging residues piled up under the forest. The birch forest is a natural forest with an age of about 21 years. The average tree height is 7 m, the average diameter is 8 cm, and the canopy density is 0.7.
Data acquisition and processing
This work downloads the Sentinel-2A remote sensing image data of the research area of the study area from https://scihub.copernicus.eu/. The Sentinel-2A data has a spatial resolution of 10 m. Among all the optical images, the Sentinel-2A data is the only one that contains three bands in the red edge range. This feature is useful for monitoring the vegetation health of the natural larch forest in the study area. The information is very effective. The image was produced at 12 September 2019 and radiation calibration and atmospheric correction are further performed on the Sentinel-2A image. Figure 2 reveals the preprocessed Sentinel-2A image in the study area.
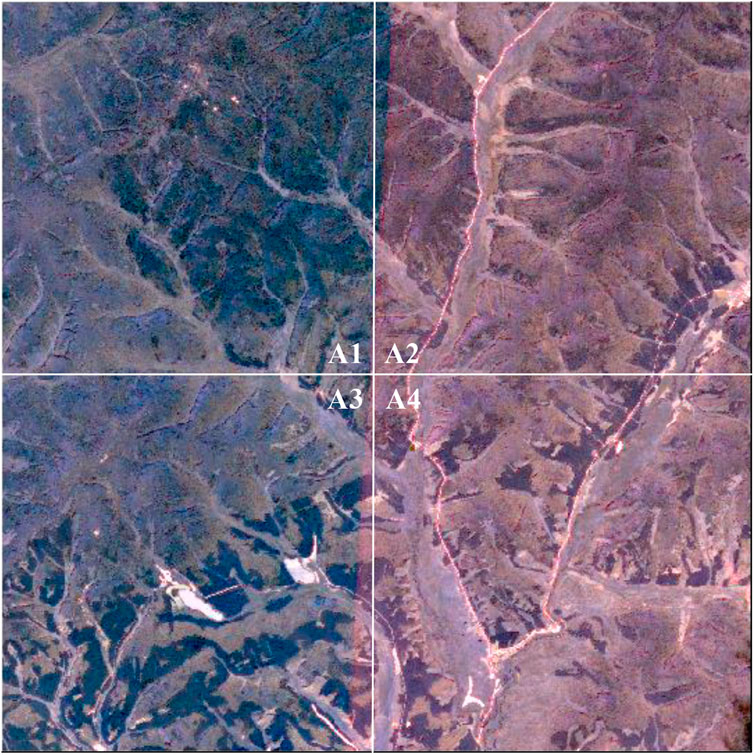
FIGURE 2. Sentries in the study area: 2A preprocessing result map (four sample plots, namely, (A1–A4)).
As shown in Figure 2, the acquired Sentinel-2A image is preprocessed to obtain a Sentinel-2A image pixel with a size of 2000 * 2000. It is evenly divided into four sample plots for research, namely, A1, A2, A3, and A4. The natural larch forest remote sensing images in the study area were extracted from the sentinel spectral image. The classification accuracy was evaluated for the health status of the larch forest in the study area by using the following spectral-Gabor spatial discriminant method (Diez et al., 2021).
Further, the forest resource type II survey data were collected in the study area. The type II data includes community conditions such as tree species structure canopy density, understory shrub coverage, herbaceous coverage, and tree crown characteristics, as well as environmental conditions such as slope, aspect, soil type, and soil thickness. Arc GIS 10.1 software was utilized to confirm the sample data, reasonably move slightly to reduce the edge effect, and divide the obtained samples into training samples and verification samples. There are 337 training samples and 186 validation samples. Table 1 lists the specific statistics.
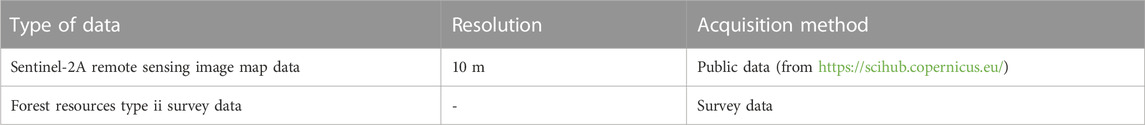
TABLE 1. List of data sources.
Analysis of health assessment methods of natural larix pine
According to the characteristics of the basic data used here, this work uses different indicators to comprehensively evaluate the health level of each evaluation object (small class) in the study area. The state of each indicator is divided into several grades. Then, a score is assigned to each grade. Finally, the health evaluation index system of the natural larch forest is constructed, as shown in Figure 3.
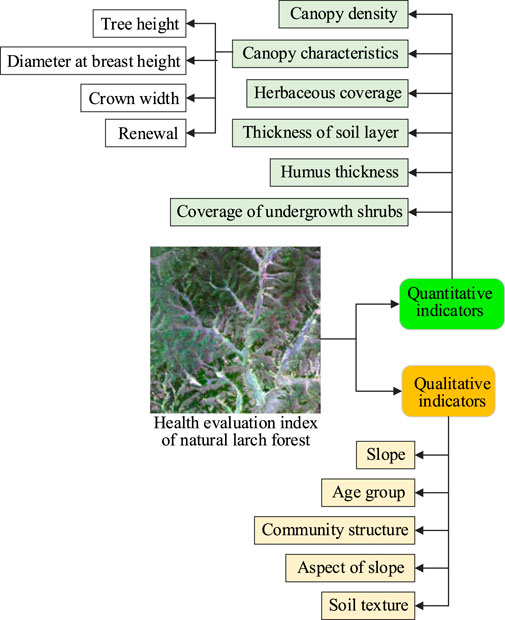
FIGURE 3. Health evaluation index system of natural larch forest.
The health evaluation system illustrated in Figure 3 presents a comprehensive approach for assessing the health status of natural larch forests in the Gurban Forest Farm, utilizing both quantitative and qualitative indicators. In addition to the quantitative indicators such as depression, shrub cover, herbaceous cover, soil thickness, and humus thickness, this study incorporates canopy characteristics including tree height, diameter at breast height, crown width, and regeneration as qualitative indicators. The quantitative indices are categorized into five classes based on index values measured in the forest resources second-class survey data. The qualitative indices, such as community structure, age group, slope, slope direction, and soil texture, are classified into 3 to 8 classes according to the forest resources second-class survey protocols in China. The inclusion of both quantitative and qualitative indicators provides a more comprehensive evaluation of forest health status.
Among the quantitative indicators, the indicator of depression reflects the proportion of the total projected area of the tree canopy on the ground in direct sunlight to the total area of the forest stand and the density of the stand. Both un-derstory shrub cover and herbaceous cover indicators influence forest ecosystem health from the perspective of forest community hierarchy and species diversity. Soil and humus provide support for various life activities of trees, shrubs, and grasses in the forest through nutrient supply. Therefore, soil layer thickness and humus thickness ultimately affect the health of the forest ecosystem. In addition, the tree height, DBH, crown width, and regeneration of pine trees in natural deciduous forests reflect the health status of forest resources from the perspective of system vitality (Falťan et al., 2021; Pan et al., 2022). Figure 4 illustrates the classification of each indicator.
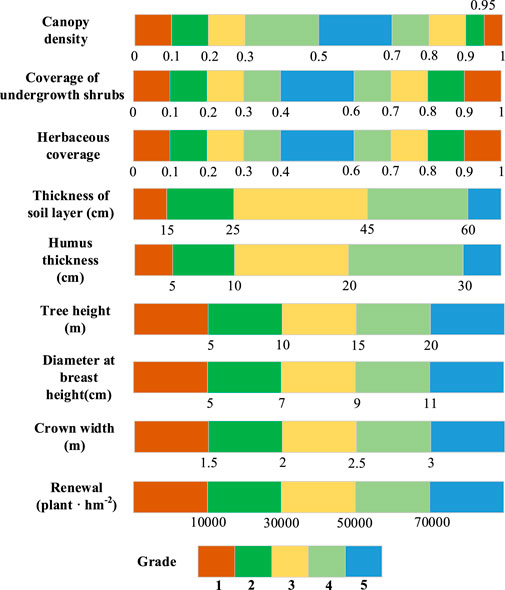
FIGURE 4. Classification of quantitative indicators for forest health assessment.
As shown in Figure 4, among the quantitative indicators, the scores of each level are calculated as follows. Level 1 means 100 points; level 2 means 80 points; level 3 means 65 points; level 4 means 50 points; level 5 means 35 points.
The qualitative indicators used in this work include community structure, age group, slope, slope direction, and soil texture, as shown in Table 2. Community structure reflects the species diversity and stability of the forest community, age group is used to assess the age structure in the forest, while slope and slope direction are important factors affecting the moisture in the terrain. Soil texture is another important physical property that influences soil aeration, water retention, and fertility status.
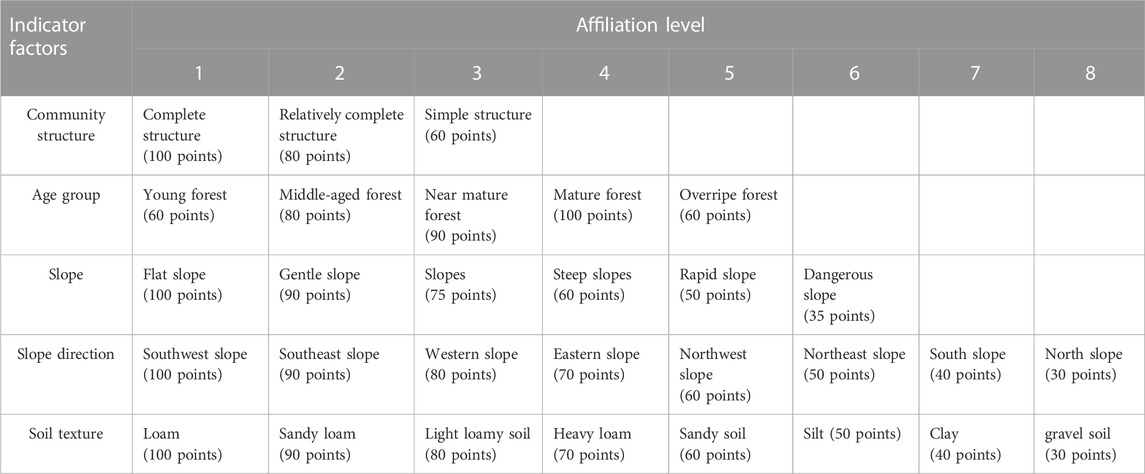
TABLE 2. Forest health evaluation qualitative indicator ranking.
The weight value of the health evaluation index of the larch forest was determined by AHP to evaluate the health degree of the natural larch forest in the forest. Finally, the health level is divided into four levels according to the health value of each index and the specific conditions of the research area: healthy (>4 points), sub-health (3-4 points), general health (2-3 points), and unhealthy (<2 points).
Spectral feature extraction and health classification model design and analysis
This work preprocesses the acquired spectral data information to obtain the Sentinel-2A multi-spectral map and extracts its features to reduce the information redundancy caused by the high-dimensionality and band nature of the data set.
First, the principal component analysis (PCA) method is used to obtain the principal components of remote sensing images. Secondly, Gabor filters of different scales and directions are performed on the extracted principal component images to obtain Gabor spatial features of many different scales and directions. Third, the original spectral features and the obtained Gabor space features are fused in a certain way to form a fusion feature. Besides, the fusion feature is further modeled. The scatter matrix between classes and the scatter matrix within a class in the fusion feature space is constructed to describe the compactness of different types of objects and the same type of objects. The optimal transformation matrix is obtained by transforming the feature space. Finally, the transformation matrix is used to transform the original high-dimensional data into the fusion space to enhance the nonlinear feature learning ability and generalization performance of subsequent classifiers, thereby improving the overall classification accuracy.
When using the spectral-Gabor space discriminant method to extract information from the Sentinel-2A multi-spectral image, the training sample set is defined as, which can be written as Eq. 1.
In Eq. 1,
The data set needs to be preprocessed before feature extraction due to the high dimensionality of the acquired spectral remote sensing image data set and the correlation and redundancy between bands. Firstly, PCA (Cruz-Ramos et al., 2021) is used to extract
In Eq. 3, f refers to the central angular frequency of the complex sinusoidal plane wave;
In Eq. 4 and Eq. 5,
The two-dimensional convolution result
Denote
Moreover, the spectral feature matrix
It is necessary to minimize the distance within a class while maximizing the distance between classes to improve the classification performance of spectral features in spectral remote sensing images. Therefore, the fusion feature optimization model shown in Eq. 11 is established.
In Eq. 11,
In Eqs 12, 13, c refers to the number of classes;
The projection feature matrix x a test sample f can be obtained through optimal transformation
Eqs 9, 10 indicate the Gabor space feature matrix
In solving Eq. 15, the first step is to maximize the inter-class scatter matrix in the spectral-Gabor space by Singular Value Decomposition (SVD). The second step is to solve the generalized eigenvalue problem. The key problem of using SVD to maximize the inter-class scatter matrix in the spectral-Gabor space is to deal with the optimization problem shown in Eq. 16. First, it is essential to deal with the following optimization problem A.
Based on the above discussion, the spectral remote sensing image dataset L acquired in this work is processed by PCA method. Then the spatial features are extracted by Gabor filter clusters, which can be written as Eq. 17.
Then, the feature space transformation is used to obtain effective feature vectors to reduce the computational complexity while improving the classification accuracy. Eq. 18 describes the optimal transformation matrix
In Eq. 18,
The Sentinel-2A multi-spectral remote sensing image obtained is used as a data set to evaluate the performance of the spectral feature extraction and health classification model based on spectral-Gabor spatial discrimination reported here. It provides rich detailed features for the subsequent nonlinear feature learning of the classifier from different scales and different directions, including a total of 14 features. They are consistent with the quantitative and qualitative indicators mentioned above. At the same time, the model reported here is compared with the benchmark model PCA, linear discriminant analysis (LDA) (Dos Reis et al., 2020), Kernel PCA (KPCA) (He et al., 2021), Kernel Discriminant Analysis (KDA) (Shen et al., 2019), and the model proposed by Kayet et al. (2022) in terms of four evaluation metrics for performance verification. The four assessment criteria are the average classification accuracy (AA), the average classification effectiveness (AV), the overall classification accuracy (OA), and Kappa.
Results
Result analysis of factor indicators
Figures 5, 6 provide the analysis results of the quantitative and qualitative indicators to evaluate the health status of natural larch forests in different sites in the study area.
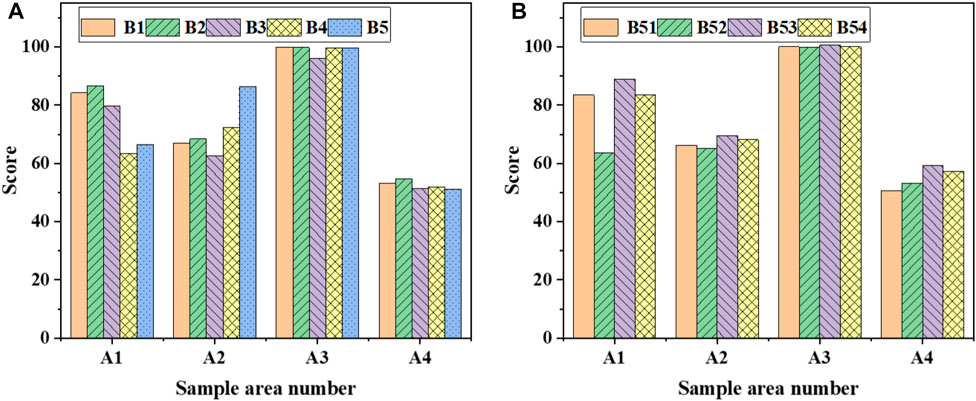
FIGURE 5. Results of quantitative indexes in various fields (A) quantitative indicators (B1: canopy density; B2: understory shrub coverage; B3: herb coverage; B4: soil layer thickness; B5: humus thickness); (B) quantitative indicators related to tree crown characteristics (B51: tree height; B52: DBH; B53: crown width; B54: renewal).
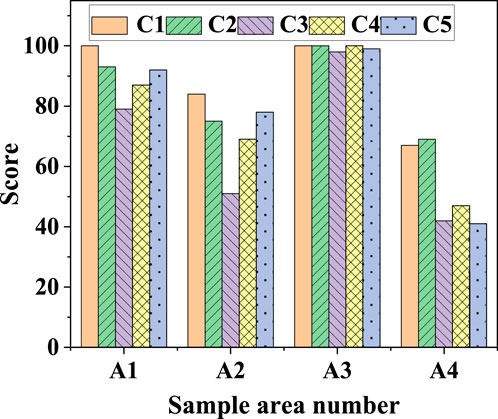
FIGURE 6. Score results of qualitative indicators of forest health assessment (C1: community structure; C2: age group; C3: slope; C4: aspect; C5: soil texture).
As shown in Figure 5, among the quantitative indicators, the scores of canopy density, understory shrub coverage, herbaceous coverage, soil layer thickness, and humus thickness in the A3 sample plot are all higher than 9.5 points, which are in a certain range. Specifically, the canopy density is 0.5–0.7; the understory shrub coverage is 0.4–0.6; the herb coverage is 0.4–0.6; the soil layer thickness is higher than 60 cm; the humus thickness is higher than 30 cm. In addition, the scores of plots A1 and A2 are all between 60 and 90, meaning that each quantitative index is at the second or third level. The score of plot A4 is about 50, indicating that each quantitative indicator performs at level four. In addition, the tree height, DBH, crown width, and regeneration grading effects reflecting the vitality of the forest system in each site are discussed. It is found that the overall performance is still the same as in A3 plots. The tree height, DBH, crown width, and regeneration in plots A1 and A2 are grade 2 or grade 3, while the scores of tree height, DBH, crown width, and re-generation in plot A4 are the lowest, which are grade 4. The health of natural larch forests in each sample plot is best in A3, followed by A1 and A2, and the worst in A4.
According to Figure 6, the scores of all qualitative indicators in the A3 sample plots are at level 1. In other words, the community structure is basically intact, the number of age groups is mostly mature forests, the slope is basically flat, the slope orientation is basically southwest, and the soil texture is loamy. However, plots A1 and A2 are classified as grade two or grade three; plot A4 has the worst performance in classification and is basically simple in terms of com-munity structure, age group, slope, aspect, and soil texture. In terms of structure, young forests or over-mature forests account for more, and the slope is steeper, and the slope also shows a northward direction, and the soil texture is mostly gravel soil type. From the analysis of the qualitative index factors, it can be found that the health of natural larch forests in each sample site is best in A3, followed by A1 and A2, and the worst in A4.
Figure 7 classifies the health classes of natural larch forests from healthy, sub-healthy, generally healthy, and un-healthy according to the specific conditions of various places in the study area.
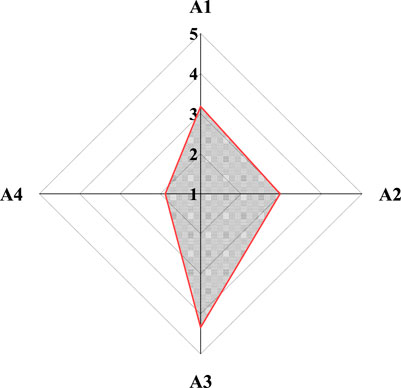
FIGURE 7. Health classification results of natural larch forests in various fields.
According to the weights of each index in Figure 7, the health classification of natural larch forests in the four sample plots A1, A2, A3, and A4 are not the same. In plot A1, the health evaluation score of the natural larch forest is 3.1798 points, which can be divided into the sub-health level. In plot A2, the health evaluation score of the natural larch forest is 2.9687 points, which can be divided into the general health grade. In plot A3, the health evaluation score of the natural larch forest is 4.3354 points, which can be divided into the health grade. In plot A4, the health evaluation score of the natural larch forest is 1.8764 points, which can be classified as unhealthy.
Classification accuracy analysis
Furthermore, the spectral feature extraction based on the Spectrum-Gabor space discrimination and health classification model is employed to analyze the recognition accuracy of each index. The model is compared with benchmark models PCA, LDA, KPCA, KDA, and the model proposed by Kayet et al. (2022) in terms of four evaluation indicators: AA, AV, OA, and Kappa coefficient, as shown in Figure 8.
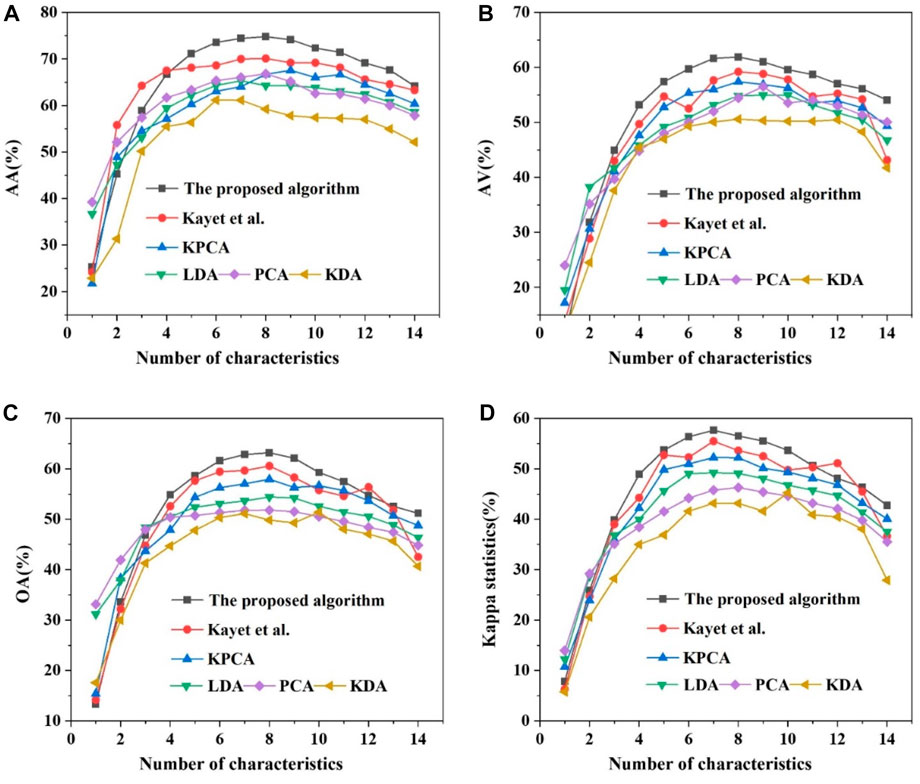
FIGURE 8. Classification results of each evaluation index under different algorithms (A) AA; (B) AV; (C) OA; (D) Kappa).
As shown in Figure 8, the statistical values of AA, AV, OA, and Kappa are analyzed with the Sentinel-2A multi-spectral remote sensing image as the data source. It can be found that with the increase in the number of features, the statistical values of AA, AV, OA, and Kappa all first increase rapidly and then reach a relatively stable state. The AA, AV, OA, and Kappa statistical values of the model reported here are the highest. This may be due to the fact that the method used here can demonstrate its superb feature extraction ability and the nonlinear feature learning ability and generalization performance of the subsequent classifier. The model proposed by Kayet et al. (2022) has the second-highest classification accuracy, and the KDA algorithm has the worst classification results. Moreover, the classification accuracy of the model reported here is optimal when the feature data is 7 or 8; the maximum statistical values of AA, AV, OA, and Kappa are 74.19%, 61.91%, 63.18%, and 57.63%, respectively. Therefore, the model can accurately identify the health status of natural larch forests.
Discussion and suggestion
Discussion
This work reveals that an accurate assessment of the health status of natural larch forests in the Arxan Forestry Bureau can be achieved through the analysis of remote sensing data and feature extraction methods. The results highlight significant differences in the health status of different plots. Plot A1 showed the lowest health status and was classified as sub-healthy, while plot A4 exhibited the worst health status and was classified as unhealthy. The most significant indicators for assessing the health status of natural forests were found to be quantitative indicators such as canopy density, understory shrub cover, humus thickness, tree height, and canopy regeneration. Among these, age group, soil texture, and community structure were identified as having the most significant impact on the health status of natural forests.
Further analysis of the spectral-Gabor spatial discriminant method proposed in this work for spectral feature extraction reveals higher precision and accuracy than those achieved by scholars in related fields (Reddy, 2021; Thakur et al., 2021). Compared with Fernandez-Carrillo et al. (2020), this study uses more refined remote sensing data and feature extraction methods, providing better reflection of the health status of natural Larch pine forests.
This work has some limitations that need to be acknowledged. Firstly, the sample size is relatively small, including only four plots, which may not comprehensively reflect the health status of natural larch forests in the Greater Khingan Mountains. Secondly, the impact of human activities and climate change has not been considered, indicating the need to include more factors in assessing the health status of natural larch forests. Therefore, future research should focus on increasing the sample size, integrating more data sources and feature extraction methods, and comprehensively considering the effects of various factors on natural larch forest health to improve the accuracy and reliability of health assessment.
Suggestion
Based on the aforementioned discussion, this work proposes three recommendations:
Firstly, it is highly recommended to manage and protect the sub-healthy and unhealthy natural larch forests. The density of forest stands in natural larch forests can be optimized by adopting ecological thinning, replanting, understory mowing and irrigation, and pruning and shaping (Weller et al., 2021). In this way, the natural larch and understory irrigation can grow normally in the natural larch forest, increasing the health grade in the study area.
Secondarily, the community hierarchy in natural larch forests should be adjusted to enhance intra-forest permeability and ventilation by strengthening the management of canopy and depression and by thinning, single plant selection, or pruning (Schuldt et al., 2020; Lin et al., 2022). Ultimately, the natural larch forest will have a multi-level community structure. It is feasible to achieve biodiversity by adjusting the age structure, soil texture, and other measures. Therefore, the richer the biodiversity, the more stable the community structure, and the more pronounced the forest benefits.
Lastly, it is recommended to integrate multiple data sources for the health assessment of natural forests. Along with remote sensing data, other data sources such as topography and hydrological data should be incorporated to enhance the accuracy and reliability of the health assessment. Additionally, regular monitoring of the distribution and health status of natural Larch pine forests should be performed using remote sensing technology. The timely data acquisition capability of remote sensing should be combined with field survey data to promptly assess the health status of natural Larch pine forests.
Conclusion
In this work, a novel approach is proposed for assessing the health status of natural larch forests in the Arxan by incorporating tree crown features and utilizing a spectral-Gabor space discrimination analysis and classification model to extract multispectral remote sensing image features. The results demonstrate the effectiveness of this approach in accurately assessing the health status of natural larch forests. Furthermore, this work highlights the close relationship between forest health status and environmental factors, human disturbances, and other factors, providing scientific evidence for developing targeted protection and management measures for sustainable development of natural larch forests. This work also presents a promising method for monitoring forest health on a global scale, which can rapidly and accurately evaluate forest health status and provide critical support for forest protection and management. The findings of this work have significant implications for the sustainable utilization of forest resources and ecological environment protection, indicating its substantial scientific research value and social significance. Still, there are some deficiencies here. For example, natural larch is the dominant species in natural larch forests in the study area, and a few other replanting species still present, such as artificial larch forests. Therefore, future research will further distinguish the tree species in the study area to enhance the precision and confidence of the results.
Data availability statement
The original contributions presented in the study are included in the article/supplementary material, further inquiries can be directed to the corresponding author.
Author contributions
AR: methodology, data analysis and writing original draft preparation. HA: results validations, investigation, review and editing. All authors contributed to the article and approved the submitted version.
Conflict of interest
The authors declare that the research was conducted in the absence of any commercial or financial relationships that could be construed as a potential conflict of interest.
Publisher’s note
All claims expressed in this article are solely those of the authors and do not necessarily represent those of their affiliated organizations, or those of the publisher, the editors and the reviewers. Any product that may be evaluated in this article, or claim that may be made by its manufacturer, is not guaranteed or endorsed by the publisher.
References
Ahmadi, K., Mahmoodi, S., Pal, S. C., Saha, A., Chowdhuri, I., Nguyen, T. T., et al. (2023). Improving species distribution models for dominant trees in climate data-poor forests using high-resolution remote sensing. Ecol. Model. 475, 110190. doi:10.1016/j.ecolmodel.2022.110190
Alam, M., Wang, J. F., Guangpei, C., Yunrong, L. V., and Chen, Y. (2021). Convolutional neural network for the semantic segmentation of remote sensing images. Mob. Netw. Appl. 26 (1), 200–215. doi:10.1007/s11036-020-01703-3
Cai, W., Wei, Z., Liu, R., Zhuang, Y., Wang, Y., and Ning, X. (2021). Remote sensing image recognition based on multi-attention residual fusion networks. ASP Trans. Pattern Recognit. Intelligent Syst. 1 (1), 1–8. doi:10.52810/TPRIS.2021.100005
Carnegie, A. J., Tovar, F., Collins, S., Lawson, S. A., and Nahrung, H. F. (2022). A coordinated, risk-based, national forest biosecurity surveillance Program for Australian forests. Front. For. Glob. Change 4, 218. doi:10.3389/ffgc.2021.756885
Chen, H., Cao, J., Zhu, H., and Wang, Y. (2022). Understanding household vulnerability and relative poverty in forestry transition: A study on forestry-worker families in China’s greater khingan Mountains state-owned forest region. Sustainability 14 (9), 4936. doi:10.3390/su14094936
Cherubini, P., Battipaglia, G., and Innes, J. L. (2021). Tree vitality and forest health: Can tree-ring stable isotopes be used as indicators? Curr. For. Rep. 7 (2), 69–80. doi:10.1007/s40725-021-00137-8
Cortés, A. J., Restrepo -Montoya, M., and Bedoya- Canas, L. E. (2020). Modern strategies to assess and breed forest tree adaptation to changing climate. Front. Plant Sci. 11, 583323. doi:10.3389/fpls.2020.583323
Cruz-Ramos, C., Garcia-Salgado, B. P., Reyes-Reyes, R., Ponomaryov, V., and Sadovnychiy, S. (2021). Gabor features extraction and land-cover classification of urban hyperspectral images for remote sensing applications. Remote Sens. 13 (15), 2914. doi:10.3390/rs13152914
Dainelli, R., Toscano, P., Di Gennaro, S. F., and Matese, A. (2021). Recent advances in unmanned aerial vehicles forest remote sensing—a systematic review. Part II: Research applications. Forests 12 (4), 397. doi:10.3390/f12040397
Diez, Y., Kentsch, S., Fukuda, M., Caceres, M. L. L., Moritake, K., and Cabezas, M. (2021). Deep learning in forestry using uav -acquired rgb data: A practical review. Remote Sens. 13 (14), 2837. doi:10.3390/rs13142837
Dos Reis, A. A., Werner, J. P., Silva, B. C., Figueiredo, G. K., Antunes, J. F., Esquerdo, J. C., et al. (2020). Monitoring pasture aboveground biomass and canopy height in an integrated crop–livestock system using textural information from PlanetScope imagery. Remote Sens. 12 (16), 2534. doi:10.3390/rs12162534
Ecke, S., Dempewolf, J., Frey, J., Schwaller, A., Endres, E., Klemmt, H. J., et al. (2022). UAV-based forest health monitoring: A systematic review. Remote Sens. 14 (13), 3205. doi:10.3390/rs14133205
Falťan, V., Petrovi č, F., Gábor, M., Šagát, V., and Hruška, M. (2021). Mountain landscape dynamics after large wind and bark beetle disasters and subsequent logging—case studies from the carpathians. Remote Sens. 13 (19), 3873. doi:10.3390/rs13193873
Fernandez-Carrillo, A., Patoč ka, Z., Dobrovolný, L., Franco-Nieto, A., and Revilla-Romero, B. (2020). Monitoring bark beetle forest damage in Central Europe. A remote sensing approach validated with field data. Remote Sens. 12 (21), 3634. doi:10.3390/rs12213634
Ge, G., Shi, Z., Zhu, Y., Yang, X., and Hao, Y. (2020). Land use/cover classification in an arid desert-oasis mosaic landscape of China using remote sensed imagery: Performance assessment of four machine learning algorithms. Glob. Ecol. Conservation 22, e00971. doi:10.1016/j.gecco.2020.e00971
Guimarães, N., Pádua, L., Marques, P., Silva, N., Peres, E., and Sousa, J. J. (2020). Forestry remote sensing from unmanned aerial vehicles: A review focusing on the data, processing and potentialities. Remote Sens. 12 (6), 1046. doi:10.3390/rs12061046
Han, Q., Yin, Q., Zheng, X., and Chen, Z. (2022). Remote sensing image building detection method based on Mask R-CNN. Complex & Intelligent Syst. 8 (3), 1847–1855. doi:10.1007/s40747-021-00322-z
He, X., Yuan, X., Zhang, D., Zhang, R., Li, M., and Zhou, C. (2021). Delineation of urban agglomeration boundary based on multisource big data fusion—a case study of guangdong–Hong Kong–Macao greater bay area (GBA). Remote Sens. 13 (9), 1801. doi:10.3390/rs13091801
Iglhaut, J., Cabo, C., Puliti, S., Piermattei, L., O’Connor, J., and Rosette, J. (2019). Structure from motion photogrammetry in forestry: A review. Curr. For. Rep. 5 (3), 155–168. doi:10.1007/s40725-019-00094-3
Jakovljević, T., Lovreškov, L., Jelić, G., Anav, A., Popa, I., Fornasier, M. F., et al. (2021). Impact of ground-level ozone on Mediterranean forest ecosystems health. Sci. Total Environ. 783, 147063. doi:10.1016/j.scitotenv.2021.147063
Kayet, N., Pathak, K., Chakrabarty, A., Kumar, S., Chowdary, V. M., and Singh, C. P. (2022). Risk assessment and prediction of forest health for effective geo-environmental planning and monitoring of mining affected forest area in hilltop region. Geocarto Int. 37 (11), 3091–3115. doi:10.1080/10106049.2020.1849413
Lin, C. Y., Fu, C. Y., Liu, Y., Zhang, M. Q., Liu, Y., Wu, W. Y., et al. (2022). Assessing the changes of the monetary value of mangrove ecosystem services in China and its application. Front. Environ. Sci. 10, 1656. doi:10.3389/fenvs.2022.1018801
Malik, S., Pal, S. C., Das, B., and Chakrabortty, R. (2020). Intra-annual variations of vegetation status in a sub-tropical deciduous forest-dominated area using geospatial approach: A case study of Sali watershed, bankura, West Bengal, India. Geol. Ecol. Landscapes 4 (4), 257–268. doi:10.1080/24749508.2019.1633219
Pal, S. C., Chakrabortty, R., Malik, S., and Das, B. (2018). Application of forest canopy density model for forest cover mapping using LISS-IV satellite data: A case study of Sali watershed, West Bengal. Model. Earth Syst. Environ. 4, 853–865. doi:10.1007/s40808-018-0445-x
Pan, H., Liu, M., Ge, H., and Chen, S. (2022). Semi-supervised spatial–spectral classification for hyperspectral image based on three-dimensional Gabor and co-selection self-training. J. Appl. Remote Sens. 16 (2), 028501. doi:10.1117/1.JRS.16.028501
Quesada- Román, A., and Mata- Cambronero, E. (2021). The geomorphic landscape of the Barva volcano, Costa Rica. Phys. Geogr. 42 (3), 265–282. doi:10.1080/02723646.2020.1759762
Reddy, C. S. (2021). Remote sensing of biodiversity: What to measure and monitor from space to species? Biodivers. Conservation 30 (10), 2617–2631. doi:10.1007/s10531-021-02216-5
Ruidas, D., Pal, S. C., Islam, A. R. M. T., and Saha, A. (2021). Characterization of groundwater potential zones in water-scarce hardrock regions using data driven model. Environ. Earth Sci. 80, 809–818. doi:10.1007/s12665-021-10116-8
Ruidas, D., Chakrabortty, R., Islam, A. R. M. T., Saha, A., and Pal, S. C. (2022a). A novel hybrid of meta-optimization approach for flash flood-susceptibility assessment in a monsoon-dominated watershed, Eastern India. Environ. Earth Sci. 81 (5), 145. doi:10.1007/s12665-022-10269-0
Ruidas, D., Pal, S. C., Saha, A., Chowdhuri, I., and Shit, M. (2022b). Hydrogeochemical characterization based water resources vulnerability assessment in India’s first Ramsar site of Chilka lake. Mar. Pollut. Bull. 184, 114107. doi:10.1016/j.marpolbul.2022.114107
Saha, A., Ghosh, M., and Pal, S. C. (2021a). Forest health assessment using advanced geospatial technology in Buxa reserve forest, sub-Himalayan West Bengal, India. For. Resour. Resil. conflicts, 49–61. doi:10.1016/B978-0-12-822931-6.00004-6
Saha, A., Ghosh, M., Pal, S. C., Chowdhuri, I., Chakrabortty, R., Roy, P., et al. (2021b). “Assessment of forest cover dynamics using forest canopy density model in Sali river basin: A spill channel of damodar river,” in Spatial modeling in forest resources management: Rural livelihood and sustainable development, 365–384. doi:10.1007/978-3-030-56542-8_15
Schuldt, B., Buras, A., Arend, M., Vitasse, Y., Beierkuhnlein, C., Damm, A., et al. (2020). A first assessment of the impact of the extreme 2018 summer drought on Central European forests. Basic Appl. Ecol. 45, 86–103. doi:10.1016/j.baae.2020.04.003
Shen, H., Zhou, M., Li, T., and Zeng, C. (2019). Integration of remote sensing and social sensing data in a deep learning framework for hourly urban PM2. 5 mapping. Int. J. Environ. Res. public health 16 (21), 4102. doi:10.3390/ijerph16214102
Tan, B. A., Gaw, L. Y. F., Masoudi, M., and Richards, D. R. (2021). Nature-based solutions for urban sustainability: An ecosystem services assessment of plans for Singapore’s first “forest town”. Front. Environ. Sci. 9, 610155. doi:10.3389/fenvs.2021.610155
Thakur, T. K., Patel, D. K., Thakur, A., Kumar, A., Bijalwan, A., Bhat, J. A., et al. (2021). Biomass production assessment in a protected area of dry tropical forest ecosystem of India: A field to satellite observation approach. Front. Environ. Sci. 9, 757976. doi:10.3389/fenvs.2021.757976
Tian, Y., Yang, C., Huang, W., Tang, J., Li, X., and Zhang, Q. (2021). Machine learning-based crop recognition from aerial remote sensing imagery. Front. Earth Sci. 15(1), 54–69. doi:10.1007/s11707-020-0861-x
Torres, P., Rodes -Blanco, M., Viana -Soto, A., Nieto, H., and García, M. (2021). The role of remote sensing for the assessment and monitoring of forest health: A systematic evidence synthesis. Forests 12 (8), 11341134. doi:10.3390/f12081134
Wang, S., Zhong, R., Liu, L., and Zhang, J. (2021). Ecological effect of ecological engineering projects on low-temperature forest cover in Great Khingan Mountain, China. Int. J. Environ. Res. Public Health 18 (20), 10625. doi:10.3390/ijerph182010625
Weller, D. L., Love, T. M., and Wiedmann, M. (2021). Comparison of resampling algorithms to address class imbalance when developing machine learning models to predict foodborne pathogen presence in agricultural water. Front. Environ. Sci. 9, 701288. doi:10.3389/fenvs.2021.701288
Keywords: forestry remote sensing, health assessment, natural larch forests, spectrum-gabor, sustainable development
Citation: Ri A and An H (2023) Health assessment of natural larch forest in arxan guided by forestry remote sensing integrated with canopy feature analysis. Front. Environ. Sci. 11:1171660. doi: 10.3389/fenvs.2023.1171660
Received: 22 February 2023; Accepted: 15 May 2023;
Published: 25 May 2023.
Edited by:
Prof-Maged Marghany, Syiah Kuala University, IndonesiaCopyright © 2023 Ri and An. This is an open-access article distributed under the terms of the Creative Commons Attribution License (CC BY). The use, distribution or reproduction in other forums is permitted, provided the original author(s) and the copyright owner(s) are credited and that the original publication in this journal is cited, in accordance with accepted academic practice. No use, distribution or reproduction is permitted which does not comply with these terms.
*Correspondence: Huijun An, ZGVhbmltYXVAMTYzLmNvbQ==