 Yonghui Lian
 Yaqi Li
 Hong Cao
- School of Finance, Capital University of Economics and Business, Beijing, China
This study examines the influence of corporate ESG performance on green innovation based on the data of 2024 A-share listed firms in China from 2009 to 2020. We find that ESG performance has a significantly positive impact on green innovation. Mechanism analysis reveals that excellent ESG performance contributes to relieving financing constraints, enhancing the level of corporate human capital, and improving management myopia, thus positively influencing corporate green innovation. Heterogeneity analysis shows that the positive effect of ESG performance on green innovation is more pronounced in firms with strong innovation capacity, non-state enterprises, firms in non-polluting industries, firms located in areas with high marketization, and firms in poor macroeconomic environments. Further analyses prove that good ESG performance also helps to enhance the quality of green innovation, the efficiency of green innovation, and the proportion of collaborative green innovation. These results offer important implications for improving firm ESG performance and promoting corporate green innovation.
1 Introduction
In the past few decades, the sloppy economic development, reckless environmental destruction, and massive energy consumption have led to a dramatic increase in greenhouse gas emissions around the world (Zhang, 2022), earthquakes, tsunamis, and other natural retributions are coming one after another. However, while energy demand is still essential for all countries today, environmental protection is a pressing issue, especially true for China. Pollution is very severe on average in China and highly variable both geographically and temporally (Dong et al., 2021), and for this reason, in September 2020, China’s President Xi Jinping promised at the United Nations General Assembly that China would strive to realize carbon peaking by 2030 and reach carbon neutrality by 2060. As a broad and profound economic and social systemic change, achieving carbon peaking and carbon neutrality requires not only the support of green innovation but also advanced investment concepts to guide and motivate more social capital to invest in green technologies, green projects, and green enterprises. As an investment concept and corporate evaluation standard that focuses on corporate performance in terms of environmental protection, social externality, and corporate governance, rather than just focusing on corporate financial performance, ESG will be an essential grip for implementing carbon peaking and carbon neutrality goals. Therefore, this paper intends to answer the question: How does firm ESG performance influence corporate green innovation?
The issue mentioned above involves both the literature on the influencing factors of corporate green innovation and the economic consequences of corporate ESG performance. On the one hand, past research mainly discussed the impact of environmental regulation policies such as government subsidy policy, environmental protection law, green credit policy, and emissions trading system on green innovation of companies (Bai et al., 2019; Zhang et al., 2019; Liu et al., 2021b; Wang et al., 2022; Zhang et al., 2022), but less research has examined the factors affecting green innovation from the micro-firm level. On the other hand, existing research has investigated the effects of corporate ESG performance on financial performance, with most of the research supporting the idea that good ESG performance can have positive economic consequences (Cooper and Uzun, 2015; Sassen et al., 2016; Wang and Sarkis, 2017; Albuquerque et al., 2019; Okafor et al., 2021). However, less research has investigated the influence of ESG performance on corporates’ innovation behavior, especially green innovation.
In this paper, we empirically investigate the impact of firm ESG performance on corporate green innovation using a sample of 2024 listed firms in China’s Shanghai and Shenzhen A-shares from 2009 to 2020. The results suggest that enterprises with better ESG performance receive more green patents, confirming the positive effect of ESG in promoting green innovation. Examining the mechanisms by which ESG performance affects corporate green innovation, we find that good ESG performance can alleviate corporate financing constraints, improve corporate human capital levels, and inhibit management myopia. Heterogeneity analysis shows that the role of ESG in promoting green innovation depends on the innovation capability of the firm, the nature of ownership, the industry, the region where the firm is located, and the macroeconomic environment. Specifically, ESG performance plays a more significant role in green innovation for firms with high innovation capacity, non-state-owned firms, firms in non-polluting industries, firms located in areas with high marketization, and poorer macroeconomic environments. Further analyses find that good ESG performance also helps promote the quality of green innovation, the efficiency of green innovation, and the proportion of collaborative green innovation.
This study has contributed to the literature in the following aspects. Firstly, the influence of firm ESG performance on green innovation is investigated in an integrated manner. Unlike the existing literature that examines the impact of a single dimension of E, S, or G on corporate innovation (Kim et al., 2019; Wu et al., 2020b; Hu et al., 2020; Liu et al., 2021a; Forcadell et al., 2021), this study provides recent evidence from China that ESG as a whole can promote green innovation in firms, and the findings hold up under a series of robustness tests and exogenous policy shocks. Secondly, this study reveals the mechanisms of ESG’s effect on green innovation. The financing constraint alleviation mechanism, the human capital enhancement mechanism, and the management myopia disincentive mechanism of ESG correspond to the financial, human, and managerial factors required for innovation activities, respectively. Thirdly, this study extensively explores the various factors that affect the green innovation enhancement effect of ESG. By examining the moderating effect played by a series of factors internal and external to the enterprise between ESG performance and green innovation, the conditions for the influence of ESG on boosting corporate green innovation are clarified. Finally, this study explores in-depth the impact of ESG on the quantity, quality, and efficiency of green innovation, and finds that good ESG performance can enhance corporate green innovation in all aspects, further extending the literature on the economic consequences of corporate ESG and the factors influencing green innovation.
2 Conceptual framework
Capital, human capital, and management are essential for firms to innovate. First, corporate innovation, especially green innovation, requires much capital. It is well documented that financing constraints can hinder enterprise innovation (Aghion et al., 2012; Cornaggia et al., 2015). Second, human capital is the driving force and source of green innovation. High-quality human capital positively influences a firm’s innovation strategy and innovation capability, increasing the likelihood of R&D and the probability of success (Marvel and Lumpkin, 2007; Dyreng et al., 2010; Ayyagari et al., 2011). Finally, management plays a vital part in green innovation decisions and implementation. Green innovation has the characteristics such as high risk and long cycle time, which requires management to have a long horizon. On the contrary, if management is seriously short-sighted, they will be more inclined to choose investment projects with short duration and low risk and reduce investment in green innovation (He and Tian, 2013).
Based on resource dependency theory and stakeholder theory (Barney, 1991; Frooman, 1999; Kassinis and Vafeas, 2006), good ESG performance can help firms obtain stakeholders’ trust and support, and then gain the critical resources needed for green innovation. Specifically, good ESG performance can improve corporate green innovation through three channels: relieving corporate financing constraints, enhancing corporate human capital, and restraining management myopia.
2.1 ESG’s financing constraint mitigation effect
Firms with good ESG performance have good business performance, lower corporate risk, and lower information asymmetry, which reduces external investors’ concerns about corporate solvency and growth capacity, thus alleviating the financing constraints faced by firms.
Firstly, ESG helps improve firms’ business performance. Social responsibility-sensitive clients are willing to buy products from firms with good ESG performance at higher prices. By improving ESG performance, firms meet these consumers’ needs to express their values, thus creating a competitive advantage of differentiation that can lead to higher product premiums (Gardberg and Fombrun, 2006).
Secondly, ESG helps reduce corporate risk. Good ESG performance helps firms accumulate moral and reputational capital, which plays an insurance effect. This effect allows firms better cope with adverse external shocks. In case of a deteriorating external environment, the probability of losing customers, facing financing difficulties, and the likelihood of a stock price crash will increase. Firms with good ESG performance have already established a strong trust to get stakeholders’ support and get through the difficulties (Lins et al., 2017). The insurance effect can also reduce damages brought by adverse events. Stakeholders are more tolerant of firms with good ESG performance and more willing to contribute the events to firms’ careless mistakes rather than maliciousness (Godfrey, 2005).
Thirdly, ESG helps decrease information asymmetry between enterprises and external investors. Firms with good ESG performance are mindful of maintaining their relationships with stakeholders and are therefore more active in disclosing information on their environmental, social responsibility, and enterprise governance activities. The information, mainly “soft information” and non-financial information, make business situations available to stakeholders and effectively reduces information asymmetry.
2.2 ESG’s human capital enhancement effect
Caring for employees is a significant component of corporate social responsibility. Firms with good ESG performance provide comprehensive career development, safety, and security services for their employees, which can attract good employees and improve their sense of job security and motivation, thus promoting corporate green innovation (Vilanova et al., 2009).
Firstly, according to the social identity theory, socially responsible firms can increase the willingness of job seekers to work for the firm (Greening and Turban, 2000), thus attracting more talented employees. In addition, companies that care about the interests of their staff share common goals and values with their staff, and staffs have a stronger sense of pride and recognition with the firm. This will encourage staff to work hard consciously, and the internal motivation of employees to innovate is stronger.
Secondly, firms with good ESG performance pay more attention to their employees’ welfare and health and can offer a good salary package, which directly increases employees’ sense of job security and satisfaction (Aguilera et al., 2007; Wu et al., 2020a). Green innovation often comes with a high risk of failure; if failure is not tolerated, it is difficult to produce quality innovations. Employees with strong occupational safety worries less about innovation failure and are therefore more motivated to carry out green innovation.
Thirdly, according to the efficiency wage theory, firms can motivate employees by increasing their wages, benefits, and improving the work environment. Green innovation is a long-term process, and firms offering employees higher than market-clearing wages increase not only employees’ moral effort at their tasks (Akerlof and Katz, 1989) but also stimulate employees’ working enthusiasm (Stiglitz, 1974) and creativity, which can bring more green innovation output to the firm.
2.3 ESG’s management myopia mitigation effect
Technological innovation is a high-risk and long-cycle activity, and this asks firms to reward successful long-term innovations and bear short-term failures rather than focusing on short-term gains. For catering to stock market investors, listed companies often engage in short-sighted behavior, neglecting long-term corporate development and thus hindering innovation.
As a value that focuses on the long-term sustainable development of enterprises, ESG requires firms to have a long-term strategic vision. Firms with good ESG performance encourage management to make long-term investments and create a favorable atmosphere for innovation, thus enhancing green innovation. For one thing, firms with good ESG performance are more tolerant of green innovation failures. High tolerance for innovation failures improves the security of managerial positions and helps alleviate managers’ short-sighted behaviors (Aghion et al., 2013), thereby promoting green innovation. For another thing, firms with good ESG performance have better corporate governance and fewer agency problems. Managers are more effectively motivated and disciplined, which helps alleviate the short-sightedness of the management and enhance the innovation enthusiasm and innovation ability of the management.
Combining the above arguments, we expect that firm ESG performance could positively influence corporate green innovation.
3 Research design
3.1 Data sources and sample selection
Referring to existing studies (Feng et al., 2022; Wu et al., 2022; Li et al., 2023), we measure firms’ ESG performance based on the Sino-Securities Index (SSI) ESG Rating System, which currently provides the most widely covered and frequently updated ESG rating data in China. The SSI ESG rating data were derived from the WIND database, and other data were collected from the CSMAR database. It is noteworthy that the ESG rating systems for China’s listed firms are all relatively young, and the current SSI ESG rating system has only been publishing data since 2008 Q3. Therefore, we use China’s listed enterprises in the A-share market from 2009 to 2020 as the initial study sample. Besides, firms in the financial and real estate industries, firms under special treatment (ST) or particular transferred (PT), firms with missing key financial data including total asset size and operating income are excluded. Finally, we obtained unbalanced panel data of 2024 firms × 12 years, a total of 13,998 firm-year observations.
3.2 Empirical model and variable definitions
The following regression model is adopted to test the influence of ESG performance on corporate green innovation:
Where i, j, t index firm, industry and year, respectively. The dependent variable GI indicates green innovation performance. Referring to Chang et al. (2015), corporate green innovation is measured in terms of the number of green patents granted to a company in the same year. For solving the issue of right-skewed allocation of green patent grant data, the natural logarithm of the green patents granted number plus one, namely, GIi,t = ln (1 + green patent granted to enterprise i in year t), is adopted.
The independent variable, ESG, measures firms’ ESG performance. The SSI ESG rating system divides the firms’ ESG rating into three levels and nine grades, and the symbols are C, CC, CCC, B, BB, BBB, A, AA, AAA. When the rating is C, ESG is assigned as 1, and the value increases by 1 for each level up. For example, ESG is assigned a value of 3 for the rating of CCC, 6 for BBB, and 9 for AAA.
The controls variables are as follows: firm size (SIZE), computed as the natural logarithm of total assets; leverage (LEV), measured as the total liabilities divided by the total assets; return on equity (ROE), computed as net profit divided by total equity; Tobin’s Q (TOBIN), computed as the market value of total asset divided by the book value of total asset; corporate cash holdings (CASH), calculated as the proportion of the sum of cash and cash equal to total assets; capital intensity (CAPINT), measured by the natural logarithm of the net fixed assets per capita; employee productivity (SALESPP), measured by the natural logarithm of the per capita operating income; the shareholding proportion of the biggest shareholder (FIRST); board independence (INDEP), assessed by the ratio of independent directors in the board; the dummy variable DUAL, representing the duality of CEO; and the dummy variable SOE, representing the nature of firm ownership, which equals 1 for state-owned companies and 0 for non-state-owned companies. Besides, we add industry fixed effects and time fixed effects to the model to mitigate possible omitted variable problems1.
4 Empirical results and discussion
4.1 Descriptive statistics and correlations analysis
In this study, all continuous variables at the 1% and 99% percentile of their distribution are winsorized to mitigate outliers’ effect on the study results. Table 1 reports the results of descriptive statistics for all variables. The average value of GI is 1.428, and its standard deviation is about 0.945, with a maximum value of 6.924 and a minimum value of 0.693, showing a considerable change of green innovation among different companies. The mean and median values of ESG are 6.547 and 6.000, showing that the average ESG rating of the sample companies is between BBB and A. As for the control variables, the distributions of the financial and corporate governance variables are all within a reasonable range.
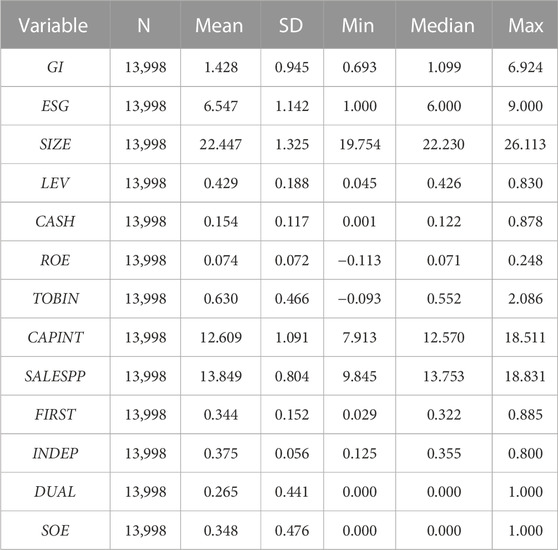
TABLE 1. Summary statistics.
Before regression analysis on the model (1), we report the correlation matrix of all the variables to prevent serious multicollinearity problems. The absolute values of the correlation coefficients between the explanatory variables in Table 2 are mostly below 0.4, and those between ESG and the control variables are also generally small. Therefore, the model setting in this study is less susceptible to interference from the problem of multicollinearity2. It is worth noting that the correlation coefficient between GI and ESG is significantly positive, implying that enterprises with better ESG performance are prone to have higher levels of green innovation3.
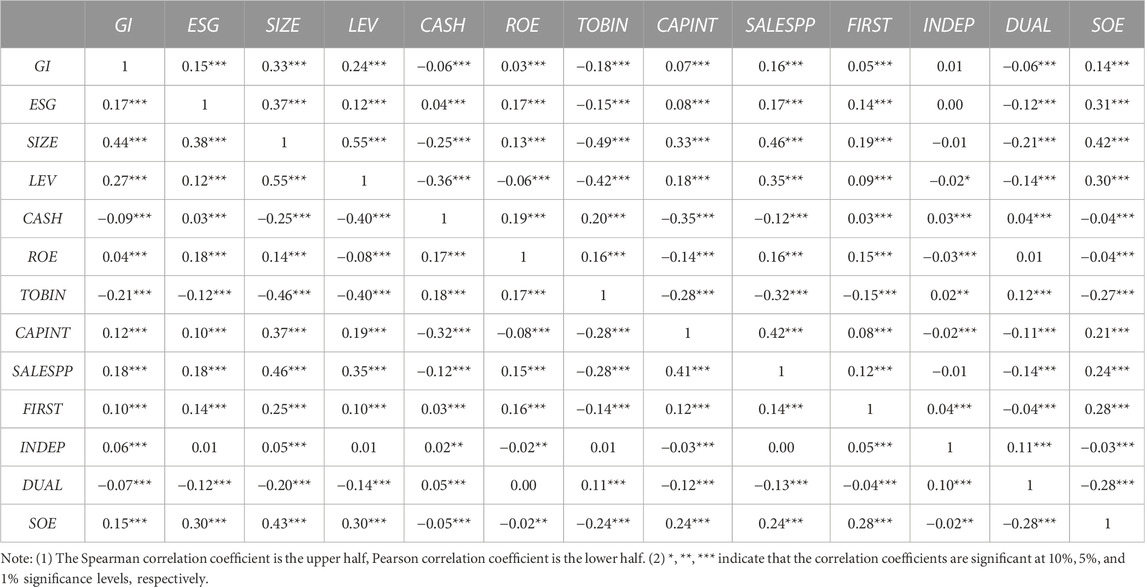
TABLE 2. Correlations matrix.
4.2 Baseline regression results
Table 3 shows the estimated results of baseline regression of ESG performance on corporate green innovation, where all standard errors are adjusted for clustering at the enterprise level. The regression in column (1) does not control for any variables, column (2) controls for industry fixed effects and year fixed effects, and column (3) further controls for firm financial characteristics and corporate governance characteristics. We focus on the estimated coefficients of ESG in each column of the regressions. In terms of the coefficient sign, the ESG coefficient is considerably positive at the 1% level in all column regressions, conforming to the previous analysis of the correlation coefficients in Table3. In terms of economic significance, in the regression results in column (3), for example, if a firm’s ESG rating improves by one notch (e.g., from BBB to A), the resulting level of green innovation increases by 0.039, and this change represents 3.13% of the mean (standard deviation) of the GI of the sample companies (4.73%). Thus, our regression results indicate that ESG performance positively influences corporate green innovation, which is both statistically and economically relevant.

TABLE 3. Baseline estimation results.
4.3 Robustness test regression results
4.3.1 Alternative measures of green innovation
To check the robustness of the findings when applying other methods to measure green innovation, we adopt different green innovation proxy indicators to re-estimate the model (1). Columns (1)–(3) of Table 4 report the results, where GAPPLYi,t = ln (1+the overall number of green patent applications of enterprise i in year t), GGINVi,t = ln (1+the overall number of green patent inventions granted to enterprise i in year t), and GGUMi,t = ln (1+the overall number of green patent of utility model granted to enterprise i in year t). The ESG coefficient in columns (1)–(3) of Table 4 remains significantly positive, suggesting that our baseline regression results are robust.
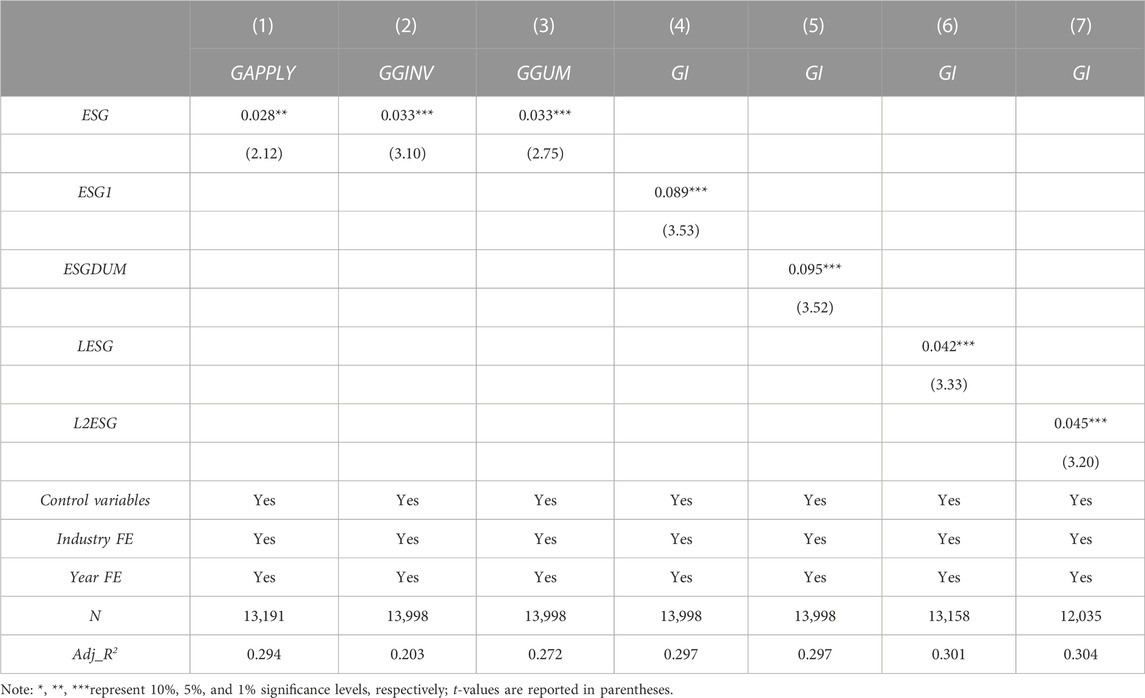
TABLE 4. Robustness tests by replacing core variable measurement.
4.3.2 Alternative measures of ESG performance
First, we use a different assignment method than the baseline regression. When a firm has an ESG rating of C, CC, or CCC, it is assigned a value of 1, 2 for B, BB, or BBB, and 3 for A, AA, or AAA. Second, we construct the dummy variable ESGDUM, and assign it to 1 when the ESG rating of the company is A, AA, or AAA; otherwise, it is 0. Third, we use one-period lagged ESG (LESG) or two-period lagged ESG (L2ESG) as the independent variable4. The results reported in columns (4)–(7) of Table 4 suggest that changing the ESG measure does not alter the conclusions obtained from the baseline regression.
4.3.3 Addressing potential endogeneity concerns
First, we estimate a two-way fixed-effect model. Although this paper controls for multiple control variables, industry fixed effects, and time fixed effects in the model (1), there may still be some time-invariant firm heterogeneity that affects the estimation results. To alleviate the problems caused by time-invariant firm-level unobservable missing variables in the model (1), we replace industry-fixed effects with firm-fixed effects. The estimated coefficient of ESG in column (1) of Table 5 remains considerably positive at the 1% statistical level.
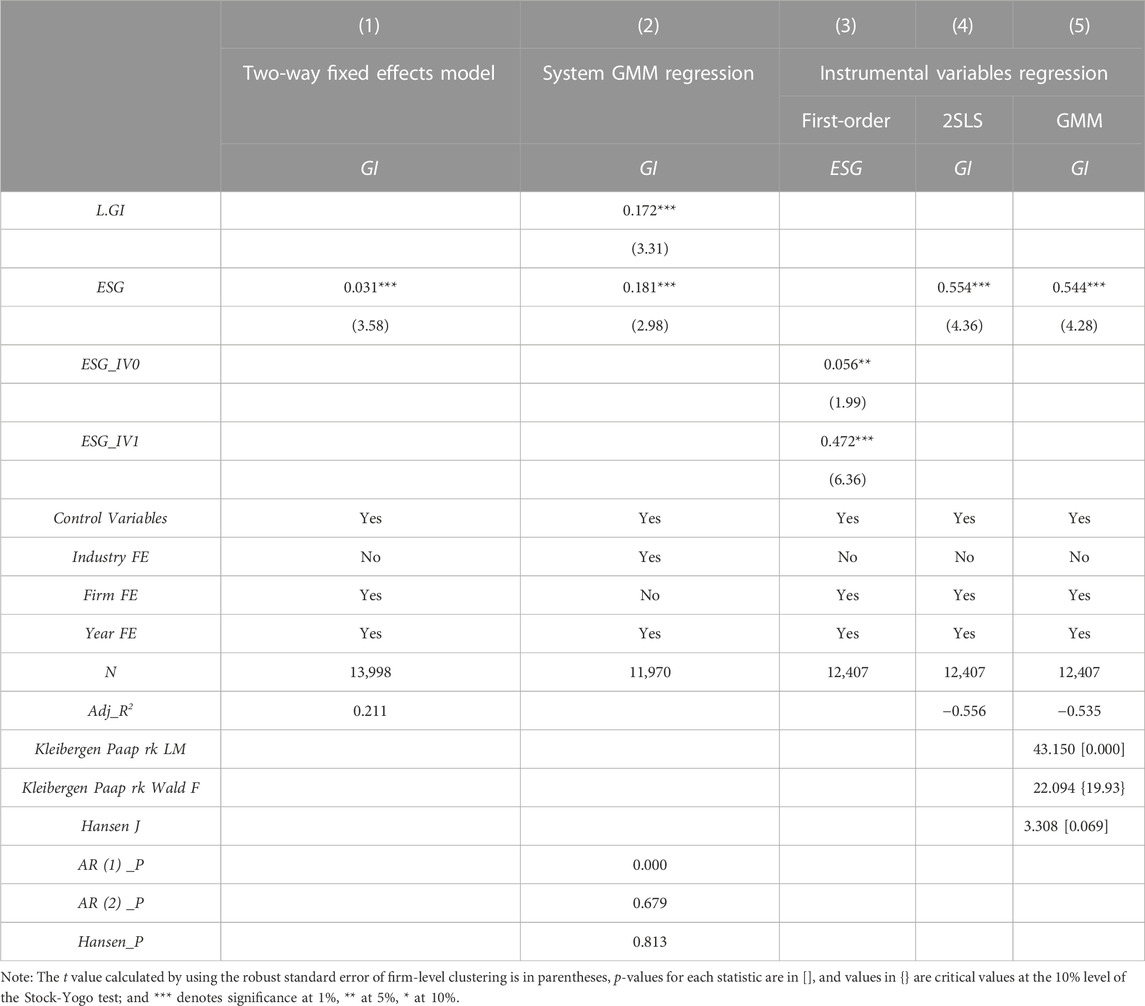
TABLE 5. Regression results dealing with endogeneity.
Second, we use the system GMM regression. The serial correlation test suggests that the difference of error terms has no second-order autocorrelation, and the Hansen test cannot reject the null hypothesis that all instrumental variables are valid. According to the regression results in column (2) of Table 5, ESG can still significantly and positively influence corporate green innovation.
Third, we conducted the instrumental variable (IV) regression. We use two instrumental variables, of which ESG_IV1 is the mean of the lagged one-period ESG value of other listed firms in the same city, and ESG_IV2 is the mean of the lagged one-period ESG value of other listed firms in the same industry. The instrumental variables were estimated using two-stage least squares (2SLS) and generalized moments estimation (GMM). In column (4) of Table 5, we adopted the IV-2SLS method for the second stage of regression. The ESG’s coefficient is considerably positive at the 1% level and is greater than that in the baseline regression. In column (5) of Table 5, we applied the GMM approach. Since we do not assume independent and identical distribution of the disturbance terms, we use Kleibergen-Paap RK Wald F statistic, Kleibergen-Paap RK LM statistic, and Hansen J statistic to test the unidentifiable problem, weak instrumental variable problem, and over-identification problem, respectively. The corresponding test results in column (5) of Table 5 suggest that the instrumental variables are valid. And the coefficients of ESG remain significantly positive, indicating that the conclusions still hold after controlling for the endogeneity problem.
4.3.4 DID analysis
We have already demonstrated that environmental practices, cleaner production, and environmental responsibility can drive green innovation in companies. Throughout the world, policymakers have also developed and implemented a series of regulations that facilitate the promotion of sustainable development (Lubin and Esty, 2010). In order to achieve the SDGs, the Chinese government has also promulgated the “Guidelines for the Construction of Green Financial System” (2016 Guidelines), and the research sample of this paper covers the period 2009–2020, a policy year that resides in which one cannot help but speculate whether the policy shock will have an impact on the previous results? Therefore, referring to Zhang (2022), we also validate the policy effect with the unique setting of the 2016 guide release and consider it as a quasi-natural experiment. Then we construct a DID model to examine the impact of corporate ESG performance on green innovation under the exogenous shock. The model as follows:
Where Postt is a dummy variable for the time of “Guidelines” release and takes the value of 1 when t is greater than or equal to 2016 and 0 when t belongs to the years 2009–2015. Treati indicates whether the firm i is for has a higher ESG performance. We divide the sample into treatment and control groups according to the median of the variable ESG and assign the values of 1 and 0, respectively. μi and ωt are individual firm fixed effects and year fixed effects, respectively. To avoid the problem of multicollinearity, Postt and Treati do not appear separately in the model.
Before formally regressing the DID model, we used the event study method to test for parallel trends in the treatment and control groups by constructing period dummy variables with 2009 as the base period and cross-multiplying each period dummy variable with the policy dummy variable (Post) to be included in model (2) for estimation, and Figure 1 illustrates the estimation results. The right side of Figure 1 shows the results of changing the way Treati is defined. Figure 1 shows that there is no significant difference in the level of green innovation output between firms with higher ESG performance and firms with lower ESG performance before the publication of the “Guidelines,” and the coefficient estimates fluctuate around 0, satisfying the parallel trend hypothesis.
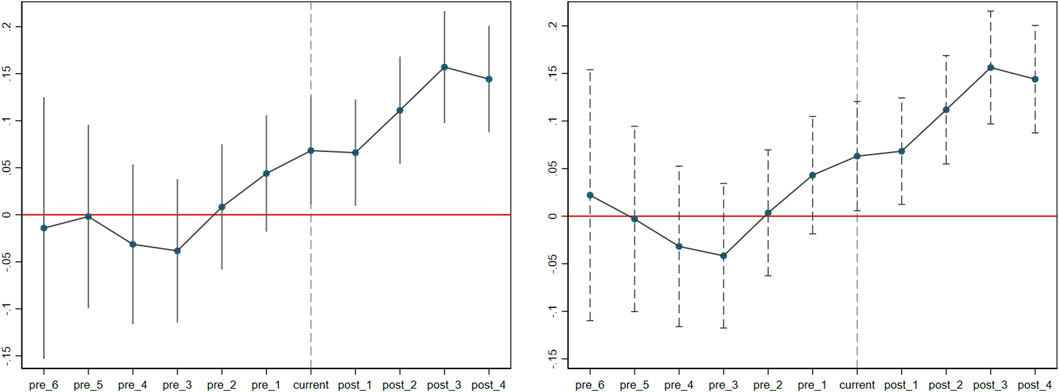
FIGURE 1. The dynamic impact of ESG policy on green innovation.
To test the robustness of the baseline regression estimation results, we conduct robustness tests by replacing the criteria for defining firms’ high and low ESG performance and excluding other policy disturbances. First, we change the Treati measure by dividing the firms into three groups according to their ESG performance: highest, middle and lowest, and define the highest group as the treatment group and the lowest group as the control group. Then, considering that the introduction of the “Green Credit Guidelines” in 2012 may also have an impact on the relationship between corporate ESG performance and green innovation, we draw on the approach of Zhang (2022) by excluding the sample of 2012 and previous years and further shortening the sample interval to 2013–20205.
Table 6 describes the regression results of ESG’s impact on corporate green innovation after the release of the “Guidelines.” We identify firms with ESG scores greater than or equal to the median ESG score as the treatment group and else as the control group. In particular, the first column of Table 6 shows the results of DID model with the sample from 2009 to 2020. Considering that the introduction of green credit guidelines in China in 2012 may affect the ESG performance of firms and thus confound the results, in columns (2) we report the results of repeating the DID regression in the first column with the 2013 to 2020 sample. The coefficient of the interaction term Treat*Post in columns (1) and (2) are statistically significant and positive at least at the 5% level, indicating that corporate ESG performance still significantly contributes to green innovation under random shocks, verifying the robustness of the baseline regression results.
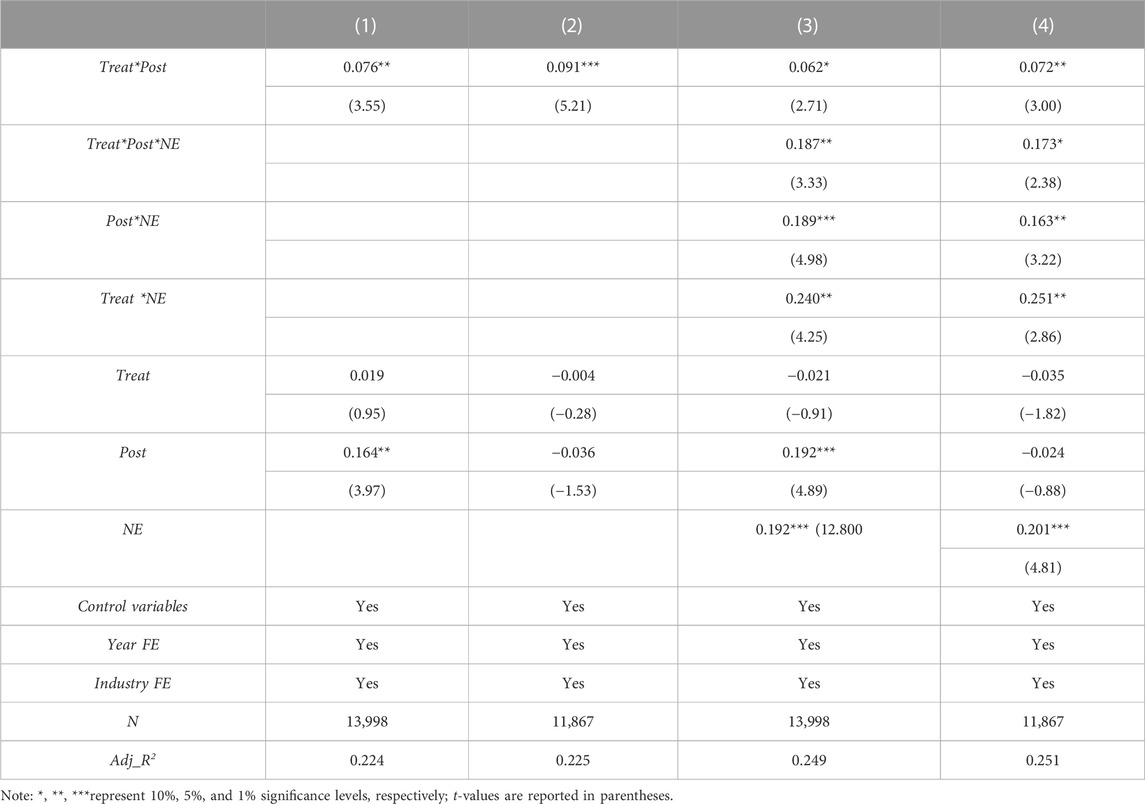
TABLE 6. Robustness test by DID and DDD model.
We further examine whether the promotion effect of ESG on green innovation is greater in new energy firms than in non-new energy listed firms under the influence of green financial system regulation shock. The model is as follows:
where NE is set as a dummy variable for whether a company is a new energy listed company. NE takes 1 when a company is a new energy listed company; otherwise, it takes 0. The triple difference model constructed is shown in model (3), where Post × Treat × NE is the triple interaction term. The corresponding regression results are reported in columns (3) and (4) of Table 6. The coefficients of the triple interaction term Post × Treat × NE are significantly positive, indicating that ESG can substantially promote the green innovation of new energy companies under the impact of the “Guidelines.” Therefore, compared to other types of firms, Chinese new energy enterprises are at the forefront of green innovation, which confirms the potential of new energy enterprises in promoting environmental protection and carbon neutrality, and provides a room for further research on new energy enterprises.
5 Analysis of impact mechanisms
5.1 ESG performance, financing constraints, and green innovation
Fazzari et al. (1988) constructed the investment-cash flow sensitivity model, which we use here to test whether ESG performance can alleviate corporate financing constraints. Since firms have lower internal financing costs than external financing costs, firms with more severe financing constraints rely more on internal cash flows for investment and thus exhibit greater investment-cash flow sensitivity. Therefore, the impact of ESG on corporate financing constraints can be evaluated by investigating the influence of ESG on investment-cash flow sensitivity. We construct the following model:
INV is cash paid for the acquisition of intangible assets, fixed assets, and other long-term assets; CF is net cash flows from operating activities; both are normalized to total assets.
In addition, we directly studied the influence of ESG performance on the SA index, put forward by Hadlock and Pierce (2010), which reflects the extent of financial constraints of firms. The corresponding regression results are shown in columns (1)–(3) of Table 7. Column (1) shows that the investment cash flow sensitivity is significantly positive, suggesting a certain degree of financing restrictions China’s listed firms face. Column (2) shows that the investment cash flow sensitivity will be lower in the case of a higher level of ESG, suggesting that ESG can reduce the reliance of corporate investment on internal financing. Column (3) shows that ESG can significantly reduce the SA index. In summary, ESG does play a role in alleviating corporate financing constraints, which is consistent with Wu D. et al. (2020), who found that corporate social responsibility can alleviate financing constraints.
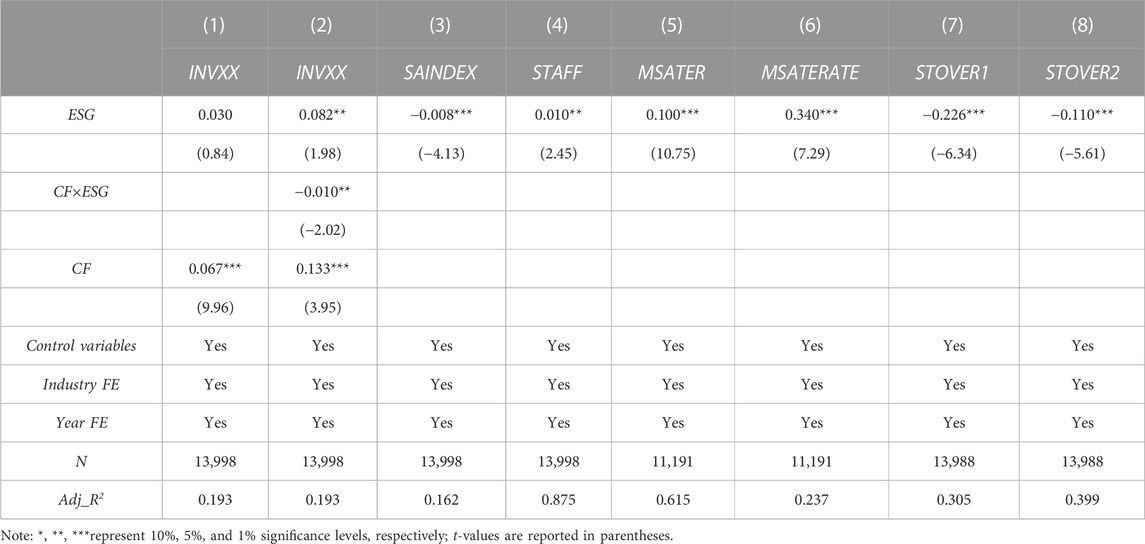
TABLE 7. Mechanism test results.
5.2 ESG performance, human capital, and green innovation
Firms with good ESG performance can enhance the attractiveness of their employees and thus improve their human capital, which is mainly shown in the increase of the number of staffs and the improvement of the quality of staffs. We adopt the following variables as proxy indicators of human capital: the total number of staffs in the enterprise in the current year (STAFF), the total number of staffs with master’s degree or above (MASTER), and the ratio of staffs with master’s degree or above to the total number of staffs in the enterprise in the current year (MASTERATE). Of the three human capital indicators, STAFF measures the quantity of human capital, while MASTER and MASTERATE focus on the quality of human capital. Columns (4)–(6) of Table 7 show the results of the regression by replacing the explanatory variables in the model (1) with the human capital indicators, where the coefficients of ESG are considerably positive, indicating that companies with good ESG performance can increase their attractiveness to high-quality employees. The higher the percentage of high-quality employees in a company, the higher the possibility of green innovation and innovation success (Van Uden et al., 2017). In summary, good ESG performance can promote corporate green innovation by improving corporate human capital.
5.3 ESG performance, management myopia, and green innovation
It is known that managers may act short-sightedly if shareholders frequently trade for speculative purposes (Stein, 1988). Therefore, we use stock turnover to assess the degree of the short-sightedness of corporate management. The stock turnover is respectively measured using the annual turnover rate STOVER1 on the overall number of shares and the annual turnover rate STOVER2 on the number of shares outstanding. Columns (7)–(8) of Table 7 report the corresponding regression results. The coefficients of ESG are all considerably negative at the 1% level, showing that ESG can restrain management myopia. Wu et al. (2020a) found that social responsibility can alleviate the problem of management short-sightedness, and the regression results reconfirm this view. In summary, firms with good ESG performance will focus more on long-term corporate growth and thus promote corporate green innovation.
6 Heterogeneity analyses
6.1 The role of ESG performance in green innovation: Strong innovation capability vs. weak innovation capability
In general, firms with strong innovation capabilities have an innovation advantage over those with weak innovation capabilities. Therefore, we believe that the impact of ESG performance on green innovation may vary depending on the strength of a firm’s innovation capability.
Firstly, companies with strong innovation capabilities have certain competitive advantages. With their existing innovation resources and the favorable resources acquired through improved ESG performance, companies can alleviate the resource constraints they face to a certain extent. This resource advantage enhances firms’ willingness to innovate proactively and increases the likelihood of successful green innovation. Moreover, innovation activities of firms with strong innovation capabilities are more sustainable (Noailly and Smeets, 2015), which indicates that firms with strong innovation capabilities are more focused on long-term corporate development and can effectively curb management myopia. Secondly, companies with strong innovation capabilities require lower unit costs to innovate compared to firms with weak innovation capabilities (Wu et al., 2021), and therefore will engage in more green innovation. In contrast, firms with weak innovation capabilities are limited by conditions such as resource constraints and high unit costs of innovation inputs, and the level of green innovation output may be significantly lower than that of firms with strong innovation capabilities. In this paper, the total number of green patents granted to the sample enterprises is divided into two groups according to the quartiles, and the sample enterprises are divided into those with strong innovation ability and those with weak innovation ability. From the regression results in columns (1) and (2) in Table 8, we can see that ESG performance can significantly improve the green innovation level of firms with strong green innovation capability.
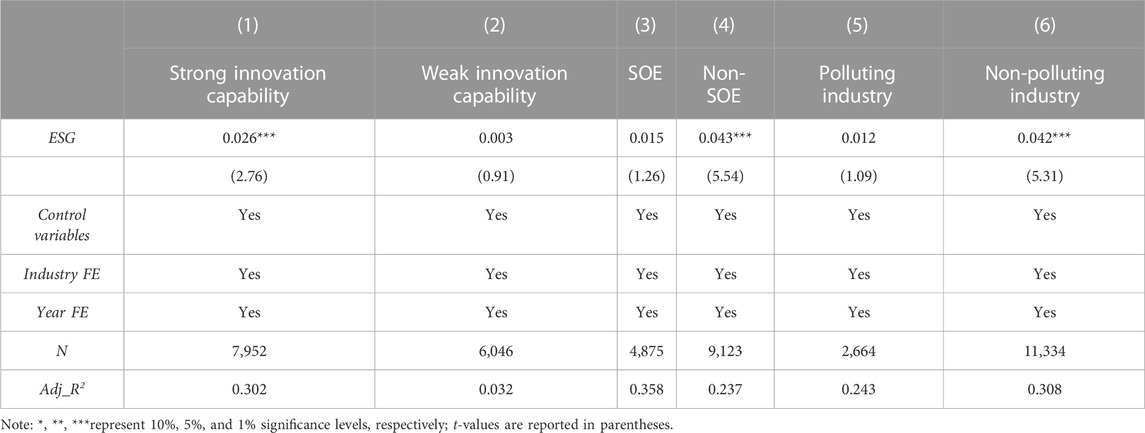
TABLE 8. Heterogeneity analysis results: Based on firm characteristics.
6.2 The role of ESG performance in green innovation: SOE vs. Non-SOE
The nature of ownership has been an essential academic concern for firms in China. We believe that the effect of ESG performance on green innovation may vary relying on the nature of firms’ ownership for the following reasons.
For one thing, the nature of ownership affects the motivation of firms to participate in ESG activities. State-owned enterprises pursue multiple goals, such as political goals, social goals, and economic goals. Among these goals, SOEs’ first consideration when engaging in ESG practices is political rather than economic goals. In contrast, non-SOEs have clear profit goals and will strive to verify their ESG performance to maintain their competitiveness and place more emphasis on R&D investment (Lin et al., 2014) to obtain economic returns. For another, the nature of ownership affects the effectiveness of gaining support from stakeholders by improving firms’ ESG performance. SOEs have more political connections and closer ties with the government and banks, making obtaining government and bank support easier without resorting to good ESG performance. Non-SOEs do not have this facility and need to improve their ESG performance by improving ESG investment, thus enhancing the information environment with the outside world, reducing information asymmetry, and thus obtaining resource support from various stakeholders.
Based on the above discussion, it is expected that the enhancement role of ESG performance in green innovation is stronger for non-SOEs than SOEs. The results of the grouped regressions are shown in columns (3)–(4) of Table 8. The coefficient of ESG is insignificant in SOEs but significantly positive in non-SOEs, which shows that the ESG performance of SOEs is less effective in enhancing green innovation than that of non-SOEs.
6.3 The role of ESG performance on green innovation: Polluting industry vs. non-polluting industry
In China’s industrial structure transition to green and low-carbon, polluting industries are facing greater challenges than non-polluting industries. Therefore, this paper relaxes the assumption of industry homogeneity and divides listed companies into two categories, polluting industry companies and non-polluting industry companies6 to explore the green innovation effect of corporate ESG performance on companies in different industry types.
For one thing, the difficulty of green innovation varies among firms with diverse industry natures. Compared with firms in non-polluting industries, enterprises in polluting industries face multiple pressures of capacity optimization, technology iteration and upgrading, and production cost increase. It is more difficult for them to carry out green innovation to achieve substantive purposes such as improving production technology, increasing resource utilization, and reducing environmental pollution. For another, the difficulty of obtaining resources varies among firms with different industry natures. Fang and Na (2021) found that Chinese companies in the polluting industry could not effectively increase market attention, especially from institutional investors, even if they obtained more green patents. Therefore, it may be more difficult for companies in polluting industries to access resources, further hindering green innovation.
Therefore, we conjecture that the ESG performance of firms in non-polluting industries is better than firms in polluting industries in terms of enhancing green innovation. The results of the grouped regressions are shown in columns (5)–(6) of Table 8. The coefficient of ESG is insignificant in the polluting industry group, but it is considerably positive in the non-polluting industry group, validating our conjecture.
6.4 The role of ESG on green innovation: The effect of marketization
The marketization process results from a set of economic, social, legal, and political system reforms. There are significant regional imbalances in China’s marketization process. Regions with high marketization generally show characteristics such as low government interference and a sound legal environment. Hence, the impact of marketization on the relationship between ESG performance and green innovation is analyzed from the perspectives of regional government intervention and regional legal environment.
For one thing, in case of a greater extent of government intervention, the promotion effect of ESG on corporate green innovation will be weaker. In areas with a higher degree of government inference, to fulfill the performance assessment of local government officials, the government will require enterprises to undertake some social responsibility activities. In this case, it can affect firms’ resource allocation, crowd out their resources for green innovation activities, and weaken the positive influence of ESG on green innovation. Moreover, in areas with a high degree of government interference, the government has a crucial say in the allocation of scarce resources, which will make firms pay more attention to the relationship with the government and more minor to other stakeholders. Therefore, it is not conducive to firms’ green innovation activities.
For another, the better the legal environment, the stronger the promotional role of ESG in corporate green innovation. Porta et al. (1998) show that legal protection has the effect of allocating capital efficiently and maintaining capital market stability. In regions with better legal systems, firms will choose to comply with the law and reduce their involvement in social responsibility activities as a whitewash. At the same time, they focus on their ESG performance, use the positive information conveyed by ESG to obtain positive feedback from stakeholders, gain the trust and recognition of each stakeholder, and thus establish long-term relationships and sign contracts. Investors will promise to ask for lower risk compensation from the firm and reduce the cost of obtaining resources. If a dispute arises during the contracting process, a better legal environment can also better resolve the dispute and protect the interests of both parties.
In summary, we expect that the positive role of firm ESG performance in green innovation is more significant in regions with a greater extent of marketization. The “Marketization Indicator of China’s Provinces (2018)" published by Wang et al. (2019) provides data on the extent of marketization of China’s provinces, municipalities, and autonomous regions. The overall marketization index (MKI) is used to measure the extent of marketization in each region, and its’ two sub-indicators, namely, “government-market relations” (GMI) and “intermediary organization development and law” (MLI), are used to measure the extent of government interference and the legal environment. The larger the MKI, GMI, and MLI, the higher the extent of marketization, the lower the extent of government inference, and the better the legal environment in each region. Table 9 shows that the coefficient of MKI×ESG in column (1) is considerably positive, indicating that in case of a greater degree of marketization, the effect of ESG on enhancing the level of firms’ green innovation output will be more significant. The results in columns (2)–(3) further indicate that the weaker the government inference and the better the legal environment, the more ESG performance can promote corporate green innovation.

TABLE 9. Heterogeneity analysis results: Based on marketization process and macroeconomic environment.
6.5 The role of ESG on green innovation: The effect of the macroeconomic environment
Firms not only consider macroeconomic performance but also respond to economic policy uncertainty when engaging in green innovation. Therefore, we further investigate the moderating effect of the macroeconomic environment on the relationship between corporate ESG performance and green innovation. In this paper, we use the year-over-year GDP growth ratio (gdp) for each province in China, the year-over-year broad money supply M2 growth ratio (m2), and the economic policy uncertainty index (EPU) as indicators of macroeconomic performance. As one of the government’s strategies for regulating macroeconomic operations, the fluctuations of monetary policy significantly affect the micro behaviors of enterprises. In a period of monetary policy tightening, enterprises face an information environment with a high degree of uncertainty, which makes financing more difficult. However, firms with good ESG performance better inform their stakeholders about the development of the firm, and stakeholders, after correctly assessing the firm’s motivation to engage in ESG activities, generate moral capital for the firm (Godfrey, 2005). In times of economic policy uncertainty, the expenditure on ESG activities can be considered as premiums and ESG performance plays an insurance role (Peloza, 2006) to protect firms against risks and reduce the negative impact on their green innovation activities.
In Table 9, the coefficients of gdp × ESG and m2 × ESG in columns (4) and (5) are significantly negative, while the coefficient of EPU × ESG in column (6) is significantly positive, indicating that ESG has an insurance effect during the macroeconomic downturn. Probably companies can obtain support from shareholders, creditors, and other stakeholders through their established corporate reputation to alleviate the shortage of capital, so ESG can still significantly promote green innovation.
7 Further analysis
7.1 Influence of ESG on the quality of corporate green innovation
In the study of corporate innovation, it is generally assumed that firms conduct R&D activities and obtain patents in order to promote technological advances and gain competitive merit. However, in reality, firms’ innovation is sometimes only a strategic behavior (Dosi et al., 2006; Hall and Harhoff, 2012; Tong et al., 2014). It does not aim at completely improving firms’ technical competitiveness but gaining some kind of benefits, which is often manifested in catering to government policies and regulations. Tong et al. (2014) observed that the second amended patent law in China had motivated SOEs to apply for patents, especially utility model and design patents. However, there was not a tremendous rise in invention patent applications. The innovation strategies of SOEs show that the government requires SOEs to realize a certain number of patent applications but ignores the quality of patents. Therefore, is the phenomenon that ESG performance could significantly raise the quantity of green innovation found in the previous analysis due to the strategic innovation behavior adopted by enterprises? To answer this question, we further analyze the influence of ESG performance on the quality of enterprise green innovation.
As Aldieri (2015) points out, the more a patent is subsequently cited, the higher the importance and quality. Therefore, the number of quotations of green patents by year after excluding self-citations is adopted here to indicate the quality of green innovation. In addition, green patents include green invention patents and green utility model patents. Hence, we also assess the quality of green innovation by the ratio of the total number of green invention patents granted to the total number of all green patents granted. The ESG coefficients in columns (1)–(2) of Table 10 are all significantly positive at the 10% level, showing that enterprises with good ESG performance are less likely to engage in strategic innovation and have a higher quality of green innovation.
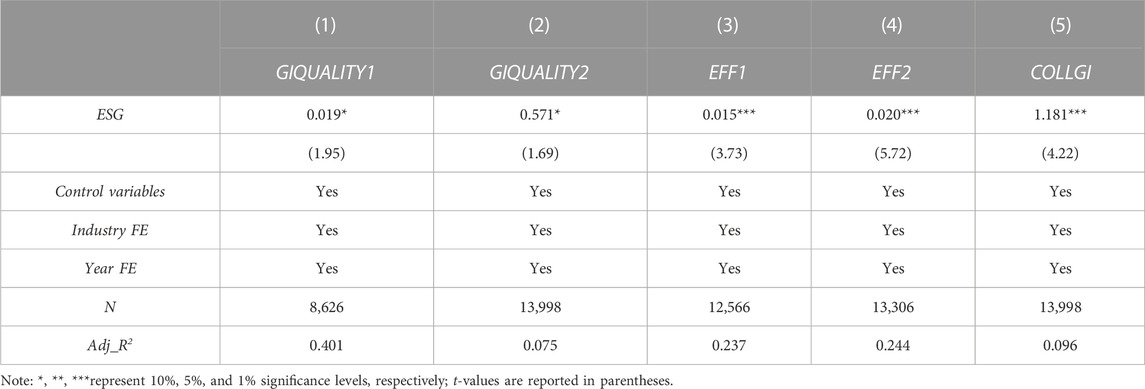
TABLE 10. Further analysis: Influence of ESG on corporate collaborative innovation.
7.2 Influence of ESG on the efficiency of corporate green innovation
Enterprise innovation not only requires investment in innovation resources such as capital and human capital but also depends on the efficient use of various types of innovation resources (Yam et al., 2004; Guan et al., 2006). If firms do not allocate innovation resources rationally according to the rules but merely increase their investment in innovation, their innovation activities are often difficult to succeed. Ideally, firms would be able to obtain more innovation output with less innovation input, which necessarily requires them to improve their innovation efficiency. Therefore, after clarifying the positive influence of ESG performance on green innovation output, we further examine whether good ESG performance can also enhance the green innovation efficiency of firms. Referring to Bereskin et al. (2018), this paper measures firms’ green innovation efficiency in terms of the number of green patents generated per unit of R&D expenditure, where EFFIi,t = ln (1 + green patent applied for by firm i in year t)/ln (1 + research and development expenses of firm i in year t) and EFF2i,t = ln (1 + green patent granted to firm i in year t)/ln (1 + R&D expenses of firm i in year t). The coefficients of ESG in columns (3)–(4) of Table 10 are obviously positive, suggesting that ESG performance improves the efficiency of green innovation.
7.3 Influence of ESG on corporate collaborative innovation
According to the sources of resources and capabilities required for innovation, enterprise innovation can be fallen into independent and collaborative innovation. Independent innovation is to develop new products or services by enterprises relying on their own resources and capabilities, and is an innovation activity carried out within the firm; collaborative innovation is the exchange or sharing of resources, information, and joint development of technologies, goods, or patents by multiple participants (Becker and Dietz, 2004; Alexiev et al., 2016; Chadee et al., 2017). As the speed of technological change continues to accelerate and the technological structure becomes increasingly complex, firms face the constraints of both resources and capabilities in the process of independent innovation, and need to rely on more external forces, so the collaborative innovation mode is gradually chosen by firms.
Compared with independent innovation, collaborative innovation has many advantages, which makes it more attractive to both managers and stakeholders: first, in terms of innovation costs and risks, collaborative innovation can make full use of the resources and capabilities of partners, share related costs and reduce R&D risks (Hagedoorn, 2002; Veugelers and Cassiman, 2005), thus generating synergy and achieving economies of scale; second, in terms of technology spillover effects, collaborative innovation can promote the internalization of knowledge spillover, thus promoting knowledge sharing and innovation investment among partners; third, from the perspective of innovation results diffusion, collaborative innovation can help shorten the innovation cycle and accelerate the process of new product marketization.
We try to answer the question: is firms’ good ESG performance more helpful to enhancing collaborative green innovation than independent green innovation? As mentioned earlier, firms with good ESG performance enjoy a better social reputation. This social reputation motivates firms to be regarded as reliable business partners by peer organizations, which helps them gain more opportunities for collaboration, including collaborative innovation (Bereskin et al., 2016). In addition, good ESG performance can also help firms establish opportunities for resource exchange and collaboration across organizations, such as mutual knowledge exchange between firms, which is crucial for collaborative innovation (Luo and Du, 2015). Therefore, we speculate that good ESG performance can boost enterprise green collaborative innovation. The ratio of the number of green patents granted jointly to the overall number of green patents granted is adopted to present the green collaborative innovation of enterprises, and the corresponding regression results are shown in Column (5) of Table 10. The ESG coefficient is considerably positive at the 1% level, which confirms that good ESG performance promotes green collaborative innovation.
8 Conclusion and implications
Green technology is also an important guarantee for achieving the carbon peaking and carbon neutrality goal, and the results and transformation efficiency of green technology innovation determine how soon the carbon neutrality goal will be achieved. At the same time, ESG is becoming more and more popular globally, while ESG investment concepts and strategies are being valued and applied by more and more investors worldwide. Due to COVID-19’s global popularity, governments and investors have been required to re-investigate the conventional growth model and focus more on green and sustainable development. Responsible investment under the guidance of the ESG concept has ushered in a new round of growth climax, and ESG has been incorporated into the corporate evaluation system by many large multinational companies. In this study, based on the data of China’s listed firms, we empirically examine whether and how firm ESG performance affects corporate green innovation. The key findings were as follows. First, ESG performance had a significant positive influence on enterprises’ green patents, indicating that ESG improved corporate green innovation. Second, good ESG performance could alleviate corporate financing constraints, improve corporate human capital levels, inhibit management myopia, and promote green innovation from three perspectives: capital, human capital, and management. Third, ESG performance has a more pronounced role in green innovation for firms with strong innovation capacity, non-state enterprises, firms in non-polluting industries, and firms in highly market-oriented regions. In addition, corporate ESG performance can still significantly contribute to green innovation during a downturn in the macroeconomic environment. Fourth, good ESG performance also helps to enhance the quality of green innovation, the efficiency of green innovation, and the proportion of collaborative green innovation.
These findings provide a valuable reference point for companies improving ESG performance and enhancing green innovation in other countries, especially emerging markets. Specifically, the following lessons can be drawn.
Firstly, firms should strive to improve their ESG performance. First of all, firms should establish and gradually improve the top-level design of the ESG management system, clarify the responsibilities of the ESG decision-making layer and ESG implementation layer, and ensure the effectiveness of ESG management. Firms should also fully integrate the ESG concept into all aspects of corporate strategy, operation management, quality management, supplier management, employee training, etc. It is worth noting that the promotion effect of improving ESG performance of non-state-owned enterprises on green innovation is more pronounced. Therefore, non-SOEs should pay more attention to improving their ESG performance.
Secondly, the government should create a favorable institutional environment for companies to improve their ESG performance. The government should improve marketization, reduce intervention in the market, and alleviate the problem of resource mismatch caused by government intervention. The government and financial regulators need to establish a comprehensive ESG system framework, develop a unified standard ESG evaluation system, and improve the ESG information disclosure system. Besides, relevant laws and regulations should be strengthened. Firms with higher ESG ratings should be given preferential treatment in tax relief, refinancing and green credit, etc. Firms that do not disclose or disclose false information as required should be sanctioned accordingly.
Thirdly, Capital market investors should integrate corporate ESG performance into their investment decision framework. Bond investors should incorporate ESG elements into their investment decisions and consider ESG factors when constructing investment portfolios and risk investment models to reduce investment risks and achieve investment goals. Stock investors should not only rely on fundamental analysis or simple diversification to manage risk but also combine corporate ESG performance to accurately judge the value of the corporate and help the sustainable development of the whole society while obtaining excess returns.
Data availability statement
Publicly available datasets were analyzed in this study. This data can be found here: https://www.wind.com.cn/.
Author contributions
YHL: Designed the research framework, conducted the empirical analysis and revised the manuscript. YQL: Collected data and drafted the manuscript. HC: Collected and analyzed the literature. All authors contributed to manuscript revision, read, and approved the submitted version.
Funding
This research was funded by the National Natural Science Foundation of China, Grant No. 71903136.
Conflict of interest
The authors declare that the research was conducted in the absence of any commercial or financial relationships that could be construed as a potential conflict of interest.
Publisher’s note
All claims expressed in this article are solely those of the authors and do not necessarily represent those of their affiliated organizations, or those of the publisher, the editors and the reviewers. Any product that may be evaluated in this article, or claim that may be made by its manufacturer, is not guaranteed or endorsed by the publisher.
Footnotes
1The manufacturing industry adopts the second-level industry code, and all other industries use the first-level industry code.
2To be more precise, we also examine the variance inflation factor (VIF), and find that all the inflation factor is less than 3, so there is no serious multicollinearity problem in the model.
3In the unreported results of the univariate analysis, we find that the mean (median) of GI is 1.287 (1.627) and 1.099 (1.099) when the ESG ratings are between C-BBB grades (ESG ≤ 6) and A-AAA grades (ESG > 6), respectively. The mean (median) difference test between groups shows that the mean (median) of GI is significantly different among the three groups, indicating that ESG performance does affect corporate green innovation.
4Similar results were obtained for using three or four-period lagged ESG as the explanatory variable.
5We also conducted a parallel trend test, and the results obtained are generally consistent with the results in the paper and pass the parallel trend test. Repeated results are not shown due to space limitations and are available from the authors upon request.
6The division between polluting and non-polluting industries is based on the “Guidelines on Environmental Disclosure for Listed Companies” (Draft for Public Comments) published by the Chinese Ministry of Environmental Protection on 14 September 2010. Sixteen categories of industries, including thermal power, iron and steel, cement, electrolytic aluminum, coal, metallurgy, chemical, petrochemical, building materials, paper, brewing, pharmaceutical, fermentation, textile, tannery and mining, are polluting industries. The remaining industries are categorized as non-polluting industries.
References
Aghion, P., Askenazy, P., Berman, N., Cette, G., and Eymard, L. (2012). Credit constraints and the cyclicality of R&D investment: Evidence from France. J. Eur. Econ. Assoc. 10 (5), 1001–1024. doi:10.1111/j.1542-4774.2012.01093.x
Aghion, P., Van Reenen, J., and Zingales, L. (2013). Innovation and institutional ownership. Am. Econ. Rev. 103 (1), 277–304. doi:10.1257/aer.103.1.277
Aguilera, R. V., Rupp, D. E., Williams, C. A., and Ganapathi, J. (2007). Putting the S back in corporate social responsibility: A multilevel theory of social change in organizations. Acad. Manage. Rev. 32 (3), 836–863. doi:10.5465/amr.2007.25275678
Akerlof, G. A., and Katz, L. F. (1989). Workers' trust funds and the logic of wage profiles. Q. J. Econ. 104 (3), 525–536. doi:10.2307/2937809
Albuquerque, R., Koskinen, Y., and Zhang, C. (2019). Corporate social responsibility and firm risk: Theory and empirical evidence. Manage. Sci. 65 (10), 4451–4469. doi:10.1287/mnsc.2018.3043
Aldieri, L. (2015). Overlap citation proximity within the triad: evidence from US and European patent citations. Rivista di Politica economica, 157–169. doi:10.2139/ssrn.2401953
Alexiev, A. S., Volberda, H. W., and Van den Bosch, F. A. (2016). Interorganizational collaboration and firm innovativeness: Unpacking the role of the organizational environment. J. Bus. Res. 69 (2), 974–984. doi:10.1016/j.jbusres.2015.09.002
Ayyagari, M., Demirgüç-Kunt, A., and Maksimovic, V. (2011). Firm innovation in emerging markets: The role of finance, governance, and competition. J. Financ. Quant. Anal. 46 (6), 1545–1580. doi:10.1017/S0022109011000378
Bai, Y., Song, S., Jiao, J., and Yang, R. (2019). The impacts of government R&D subsidies on green innovation: Evidence from Chinese energy-intensive firms. J. Clean. Prod. 233, 819–829. doi:10.1016/j.jclepro.2019.06.107
Barney, J. (1991). Firm resources and sustained competitive advantage. J. Manage. 17 (1), 99–120. doi:10.1177/014920639101700108
Becker, W., and Dietz, J. (2004). R&D cooperation and innovation activities of firms—evidence for the German manufacturing industry. Res. Policy. 33 (2), 209–223. doi:10.1016/j.respol.2003.07.003
Bereskin, F. L., Campbell, T. L., and Hsu, P. H. (2016). Corporate philanthropy, research networks, and collaborative innovation. Financ. Manage. 45 (1), 175–206. doi:10.1111/fima.12078
Bereskin, F. L., Hsu, P. H., and Rotenberg, W. (2018). The real effects of real earnings management: Evidence from innovation. Acc. Res. 35 (1), 525–557. doi:10.1111/1911-3846.12376
Chadee, D., Sharma, R. R., and Roxas, B. (2017). Linking and leveraging resources for innovation and growth through collaborative value creation: A study of Indian OSPs. Asia Pac. J. Manag. 34 (4), 777–797. doi:10.1007/s10490-016-9485-9
Chang, X., Fu, K., Low, A., and Zhang, W. (2015). Non-executive employee stock options and corporate innovation. J. Financ. Econ. 115 (1), 168–188. doi:10.1016/j.jfineco.2014.09.002
Cooper, E. W., and Uzun, H. (2015). Corporate social responsibility and the cost of debt. J Acco Fina 15 (8), 2158–3625. Available online at: https://www.researchgate.net/publication/303932276_Corporate_Social_Responsibility_and_the_Cost_of_Debt.
Cornaggia, J., Mao, Y., Tian, X., and Wolfe, B. (2015). Does banking competition affect innovation? J. Financ. Econ. 115 (1), 189–209. doi:10.1016/j.jfineco.2014.09.001
Dong, R., Fisman, R., Wang, Y., and Xu, N. (2021). Air pollution, affect, and forecasting bias: Evidence from Chinese financial analysts. J. Financ. Econ. 139 (3), 971–984. doi:10.1016/j.jfineco.2019.12.004
Dosi, G., Marengo, L., and Pasquali, C. (2006). How much should society fuel the greed of innovators? On the relations between appropriability, opportunities and rates of innovation. Res. Policy. 35 (8), 1110–1121. doi:10.1016/j.respol.2006.09.003
Dyreng, S. D., Hanlon, M., and Maydew, E. L. (2010). The effects of executives on corporate tax avoidance. Acc. Rev. 85 (4), 1163–1189. doi:10.2308/accr.2010.85.4.1163
Fang, X., and Na, J. (2021). A study on green innovation premiums of GEM listed companies. Econ. Res. J. 55 (10), 106–123. Available online at: https://www.cnki.com.cn/Article/CJFDTotal-JJYJ202010008.htm.
Fazzari, S. M., Hubbard, R. G., Petersen, B. C., Blinder, A. S., and Poterba, J. M. (1988). Financing constraints and corporate investment. Brookings. Pap. Eco. Ac 1988 (1), 141–206. doi:10.2307/2534426
Feng, J., Goodell, J. W., and Shen, D. (2022). ESG rating and stock price crash risk: Evidence from China. Financ. Res. Lett. 46, 102476. doi:10.1016/j.frl.2021.102476
Forcadell, F. J., Úbeda, F., and Aracil, E. (2021). Effects of environmental corporate social responsibility on innovativeness of Spanish industrial SMEs. Forecast. Soc. Change. 162, 120355. doi:10.1016/j.techfore.2020.120355
Frooman, J. (1999). Stakeholder influence strategies. Acad. Manage. Rev. 24 (2), 191–205. doi:10.5465/amr.1999.1893928
Gardberg, N. A., and Fombrun, C. J. (2006). Corporate citizenship: Creating intangible assets across institutional environments. Acad. Manage. Rev. 31 (2), 329–346. doi:10.5465/amr.2006.20208684
Godfrey, P. C. (2005). The relationship between corporate philanthropy and shareholder wealth: A risk management perspective. Acad. Manage. Rev. 30 (4), 777–798. doi:10.5465/amr.2005.18378878
Greening, D. W., and Turban, D. B. (2000). Corporate social performance as a competitive advantage in attracting a quality workforce. Bus. Soc. 39 (3), 254–280. doi:10.1177/000765030003900302
Guan, J. C., Yam, R. C., Mok, C. K., and Ma, N. (2006). A study of the relationship between competitiveness and technological innovation capability based on DEA models. Eur. J. Oper. Res. 170 (3), 971–986. doi:10.1016/j.ejor.2004.07.054
Hadlock, C. J., and Pierce, J. R. (2010). New evidence on measuring financial constraints: Moving beyond the KZ index. Rev. Financ. Stud. 23 (5), 1909–1940. doi:10.1093/rfs/hhq009
Hagedoorn, J. (2002). Inter-firm R&D partnerships: An overview of major trends and patterns since 1960. Res. Policy. 31 (4), 477–492. doi:10.1016/S0048-7333(01)00120-2
Hall, B. H., and Harhoff, D. (2012). Recent research on the economics of patents. Annu. Rev. Econ. 4 (1), 541–565. doi:10.1146/annurev-economics-080511-111008
He, J. J., and Tian, X. (2013). The dark side of analyst coverage: The case of innovation. J. Financ. Econ. 109 (3), 856–878. doi:10.1016/j.jfineco.2013.04.001
Hu, W., Du, J., and Zhang, W. (2020). Corporate social responsibility information disclosure and innovation sustainability: Evidence from China. Sustainability 12 (1), 409. doi:10.3390/su12010409
Kassinis, G., and Vafeas, N. (2006). Stakeholder pressures and environmental performance. Acad. Manage. J. 49 (1), 145–159. doi:10.5465/amj.2006.20785799
Kim, H. D., Park, K., and Roy Song, K. (2019). Do long-term institutional investors foster corporate innovation? Acc. Financ. 59 (2), 1163–1195. doi:10.1111/acfi.12284
Li, S., Liu, Y., and Xu, Y. (2023). Does ESG performance improve the quantity and quality of innovation? The mediating role of internal control effectiveness and analyst coverage. Sustainability 15 (1), 104. doi:10.3390/su15010104
Lin, H., Zeng, S., Ma, H., Qi, G., and Tam, V. W. (2014). Can political capital drive corporate green innovation? Lessons from China. J. Clean. Prod. 64, 63–72. doi:10.1016/j.jclepro.2013.07.046
Lins, K. V., Servaes, H., and Tamayo, A. (2017). Social capital, trust, and firm performance: The value of corporate social responsibility during the financial crisis. J. Financ. 72 (4), 1785–1824. doi:10.1111/jofi.12505
Liu, Y., Chen, Y., Ren, Y., and Jin, B. (2021a). Impact mechanism of corporate social responsibility on sustainable technological innovation performance from the perspective of corporate social capital. J. Clean. Prod. 308, 127345. doi:10.1016/j.jclepro.2021.127345
Liu, Y., Wang, A., and Wu, Y. (2021b). Environmental regulation and green innovation: Evidence from China’s new environmental protection law. J. Clean. Prod. 297, 126698. doi:10.1016/j.jclepro.2021.126698
Lubin, D. A., and Esty, D. C. (2010). The sustainability imperative. Harv. Bus. Rev. 88.5, 42–50. doi:10.2139/ssrn.3809958
Luo, X., and Du, S. (2015). Exploring the relationship between corporate social responsibility and firm innovation. Mark. Lett. 26 (4), 703–714. doi:10.1007/s11002-014-9302-5
Marvel, M. R., and Lumpkin, G. T. (2007). Technology entrepreneurs’ human capital and its effects on innovation radicalness. Entrep. Theory. Pract. 31 (6), 807–828. doi:10.1111/j.1540-6520.2007.00209.x
Noailly, J., and Smeets, R. (2015). Directing technical change from fossil-fuel to renewable energy innovation: An application using firm-level patent data. J. Environ. Econ. Manag. 72, 15–37. doi:10.1016/j.jeem.2015.03.004
Okafor, A., Adeleye, B. N., and Adusei, M. (2021). Corporate social responsibility and financial performance: Evidence from US tech firms. J. Clean. Prod. 292, 126078. doi:10.1016/j.jclepro.2021.126078
Peloza, J. (2006). Using corporate social responsibility as insurance for financial performance. Calif. Manage. Rev. 48 (2), 52–72. doi:10.2307/41166338
Porta, R. L., Lopez-de-Silanes, F., Shleifer, A., and Vishny, R. W. (1998). Law and finance. J. Polit. Econ. 106 (6), 1113–1155. doi:10.1086/250042
Sassen, R., Hinze, A.-K., and Hardeck, I. (2016). Impact of ESG factors on firm risk in Europe. J. Bus. Econ. 86 (8), 867–904. doi:10.1007/s11573-016-0819-3
Stein, J. C. (1988). Takeover threats and managerial myopia. J. Polit. Econ. 96 (1), 61–80. doi:10.1086/261524
Stiglitz, J. E. (1974). Alternative theories of wage determination and unemployment in LDC's: The labor turnover model. Q. J. Econ. 88 (2), 194–227. doi:10.2307/1883069
Tong, T. W., He, W., He, Z.-L., and Lu, J. (2014). Patent regime shift and firm innovation: Evidence from the second amendment to China’s patent law. Academy of Management Proceedings 2014 (1), 14174. doi:10.5465/ambpp.2014.14174abstract
Van Uden, A., Knoben, J., and Vermeulen, P. (2017). Human capital and innovation in sub-saharan countries: A firm-level study. Innovation 19 (2), 103–124. doi:10.1080/14479338.2016.1237303
Veugelers, R., and Cassiman, B. (2005). R&D cooperation between firms and universities. Some empirical evidence from Belgian manufacturing. Int. J. Ind. Organ. 23 (5-6), 355–379. doi:10.1016/j.ijindorg.2005.01.008
Vilanova, M., Lozano, J. M., and Arenas, D. (2009). Exploring the nature of the relationship between CSR and competitiveness. J. Bus. Ethics. 87 (1), 57–69. doi:10.1007/s10551-008-9812-2
Wang, Z., and Sarkis, J. (2017). Corporate social responsibility governance, outcomes, and financial performance. J. Clean. Prod. 162, 1607–1616. doi:10.1016/j.jclepro.2017.06.142
Wang, X., Fan, G., and Hu, L. (2019). China marketization index report by provinces. China: Social Sciences Literature Publishing House.
Wang, H., Qi, S., Zhou, C., Zhou, J., and Huang, X. (2022). Green credit policy, government behavior and green innovation quality of enterprises. J. Clean. Prod. 331, 129834. doi:10.1016/j.jclepro.2021.129834
Wu, D., Zhao, Q., and Han, J. (2020a). Corporate social responsibility and technological innovation—evidence from China. Nankai Bus. Rev. 38 (3), 140–160. doi:10.14116/j.nkes.2020.03.008
Wu, W., Liang, Z., and Zhang, Q. (2020b). Effects of corporate environmental responsibility strength and concern on innovation performance: The moderating role of firm visibility. Corp. Soc. Resp. Env. Ma. 27 (3), 1487–1497. doi:10.1002/csr.1902
Wu, L., Ren, F., and Xu, S. (2021). Influence of environmental regulation enforcement on enterprise's green innovation. Chin. J. Popul. Resour. 31 (01), 90–99. doi:10.12062/cpre.20200632
Wu, S., Li, X., Du, X., and Li, Z. (2022). The impact of ESG performance on firm value: The moderating role of ownership structure. Sustainability 14 (21), 14507. doi:10.3390/su142114507
Yam, R. C., Guan, J. C., Pun, K. F., and Tang, E. P. (2004). An audit of technological innovation capabilities in Chinese firms: Some empirical findings in Beijing, China. Res. Policy 33 (8), 1123–1140. doi:10.1016/j.respol.2004.05.004
Zhang, L., Cao, C., Tang, F., He, J., and Li, D. (2019). Does China’s emissions trading system foster corporate green innovation? Evidence from regulating listed companies. Technol. Anal. Strateg. 31 (2), 199–212. doi:10.1080/09537325.2018.1493189
Zhang, Y., Li, X., and Xing, C. (2022). How does China's green credit policy affect the green innovation of high polluting enterprises? The perspective of radical and incremental innovations. J. Clean. Prod. 336, 130387. doi:10.1016/j.jclepro.2022.130387
Keywords: ESG performance, green innovation, financing constraints, human capital, management myopia
Citation: Lian Y, Li Y and Cao H (2023) How does corporate ESG performance affect sustainable development: A green innovation perspective. Front. Environ. Sci. 11:1170582. doi: 10.3389/fenvs.2023.1170582
Received: 21 February 2023; Accepted: 21 March 2023;
Published: 31 March 2023.
Edited by:
Pengxiang Zhai, Beihang University, ChinaReviewed by:
Tiantian Wang, Nanjing Audit University, ChinaShen Yu, Southwestern University of Finance and Economics, China
Copyright © 2023 Lian, Li and Cao. This is an open-access article distributed under the terms of the Creative Commons Attribution License (CC BY). The use, distribution or reproduction in other forums is permitted, provided the original author(s) and the copyright owner(s) are credited and that the original publication in this journal is cited, in accordance with accepted academic practice. No use, distribution or reproduction is permitted which does not comply with these terms.
*Correspondence: Hong Cao, Y2FvaG9uZ0BjdWViLmVkdS5jbg==